


方案详情
文
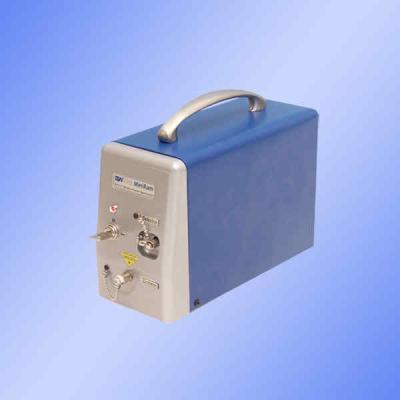
拉曼效应起源于分子振动(和点阵振动)与转动,因此从拉曼光谱中可以得到分子振动能级(点阵振动能级)与转动能级结构的知识。我们所展示的是利用成功地利用一台便携式拉曼光谱仪对聚合物样品做到无破坏的、实时的监测。
方案详情

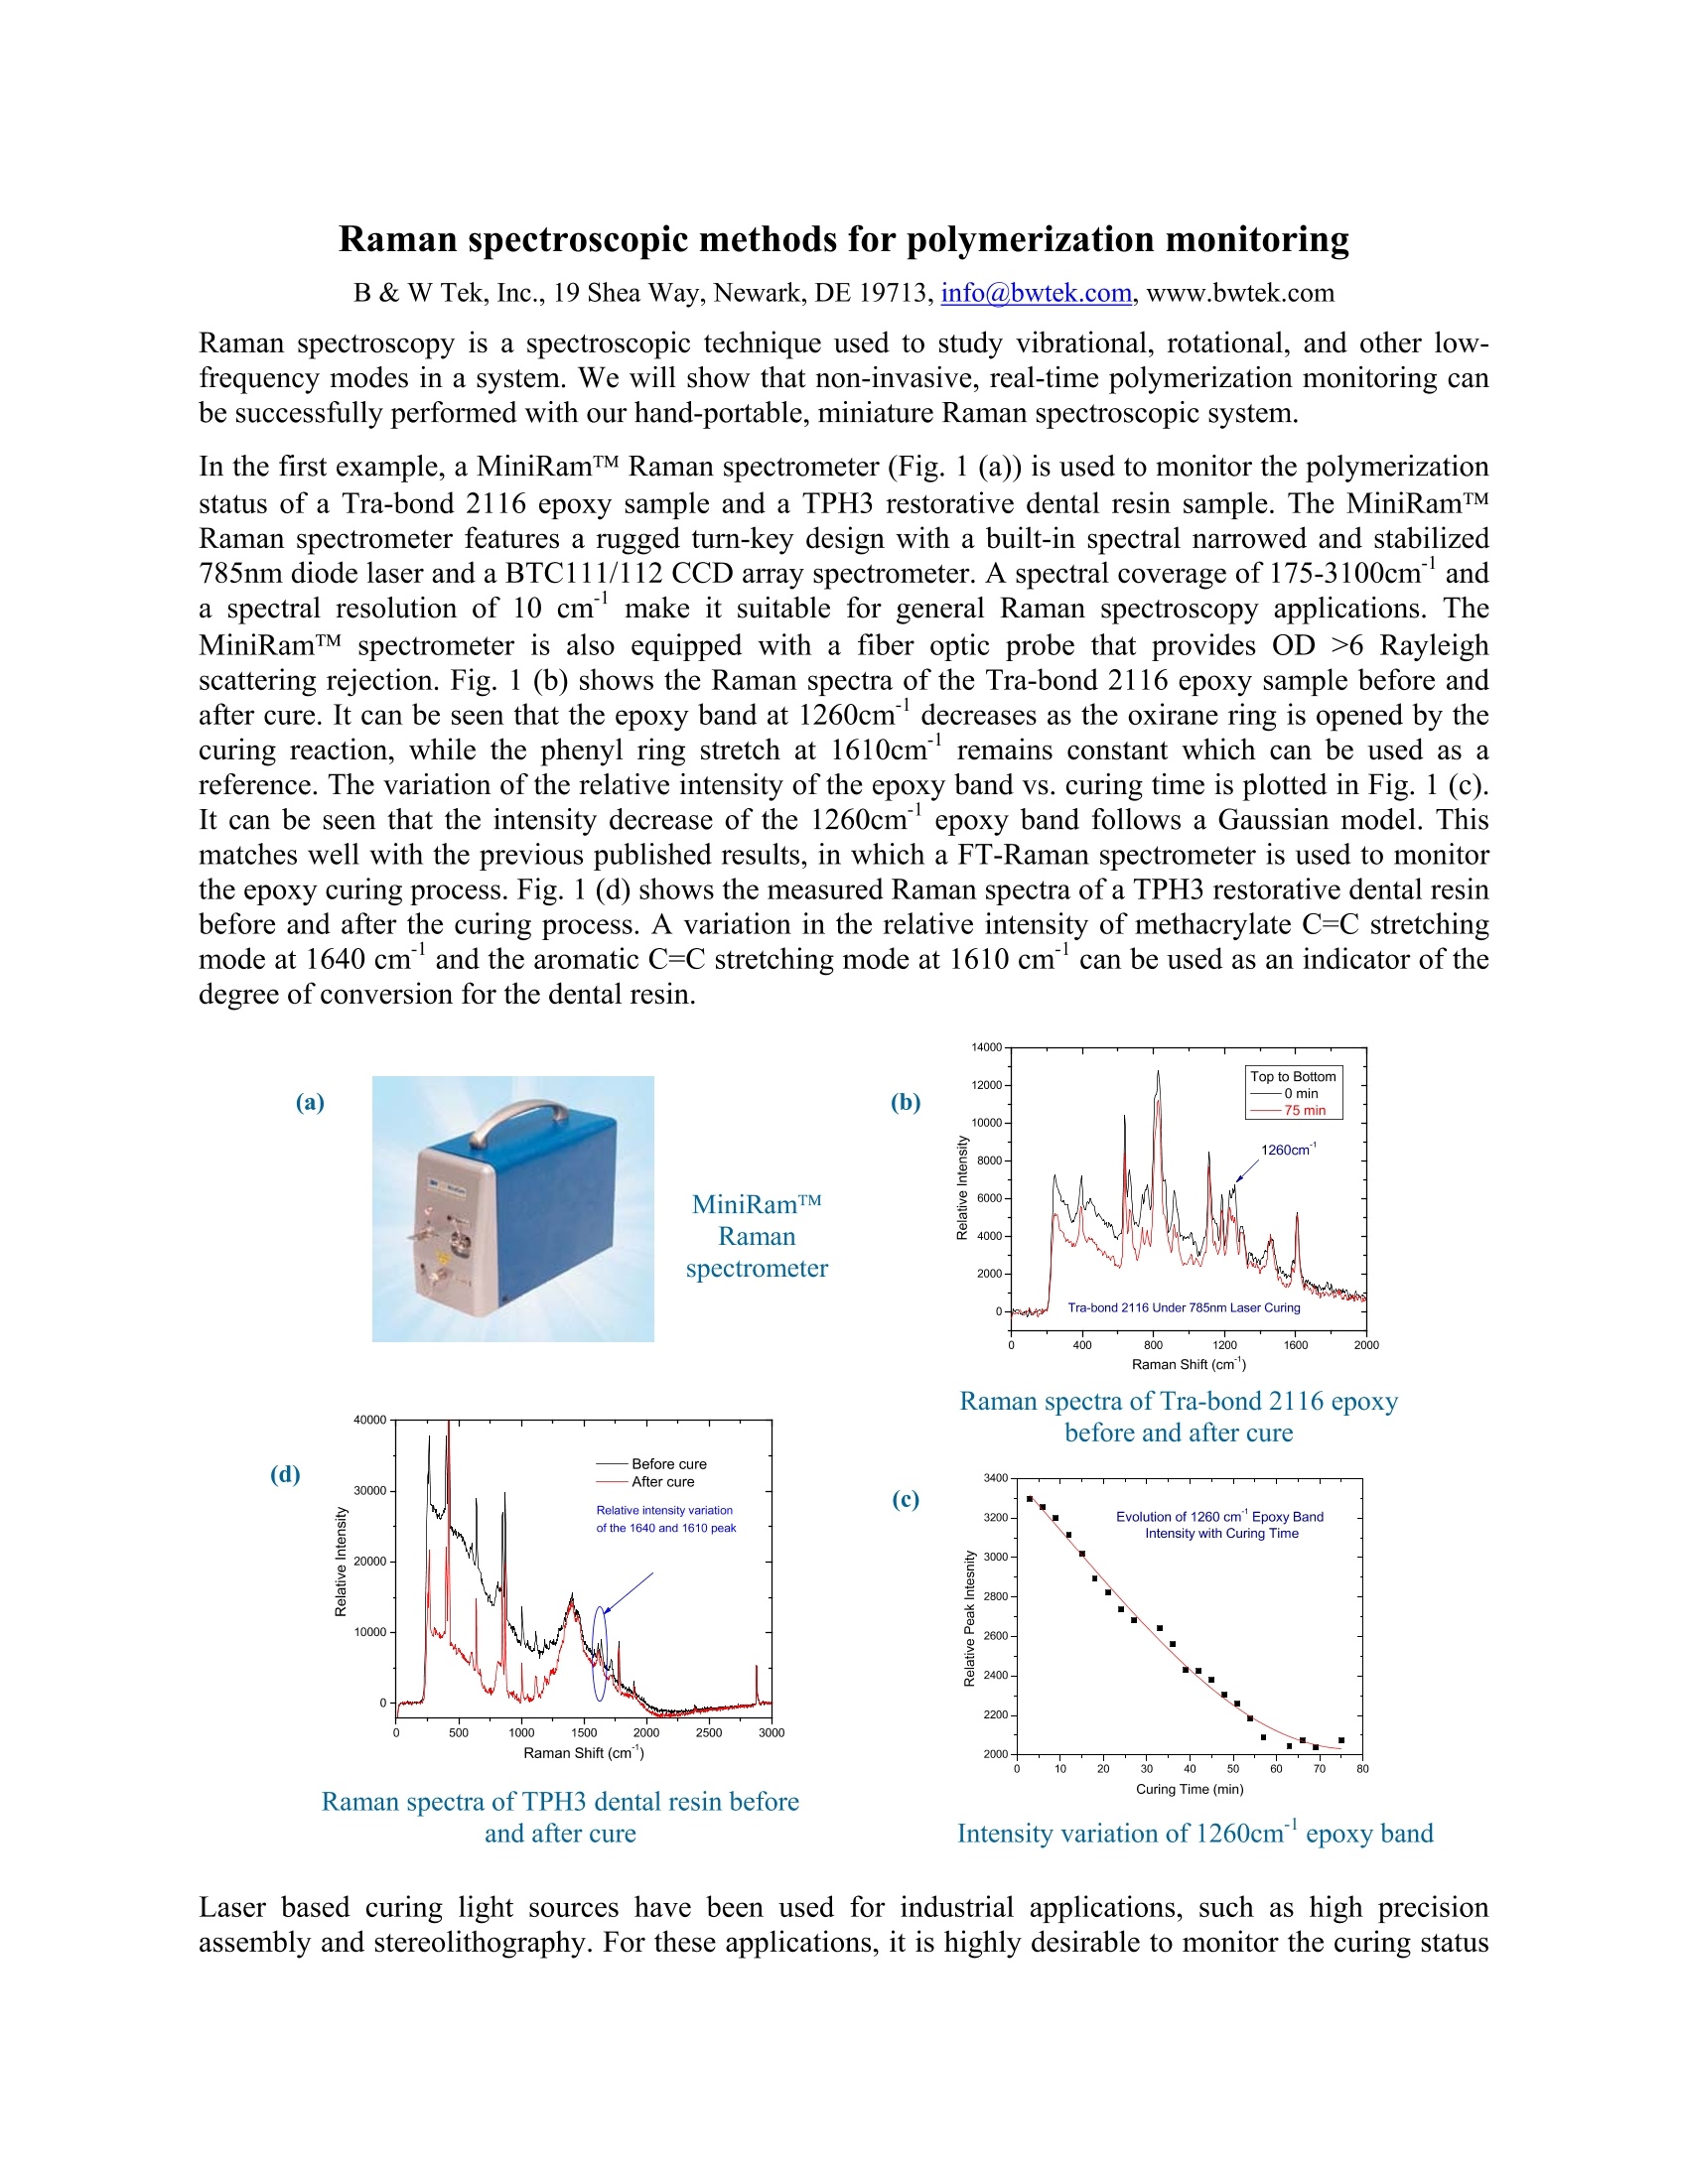
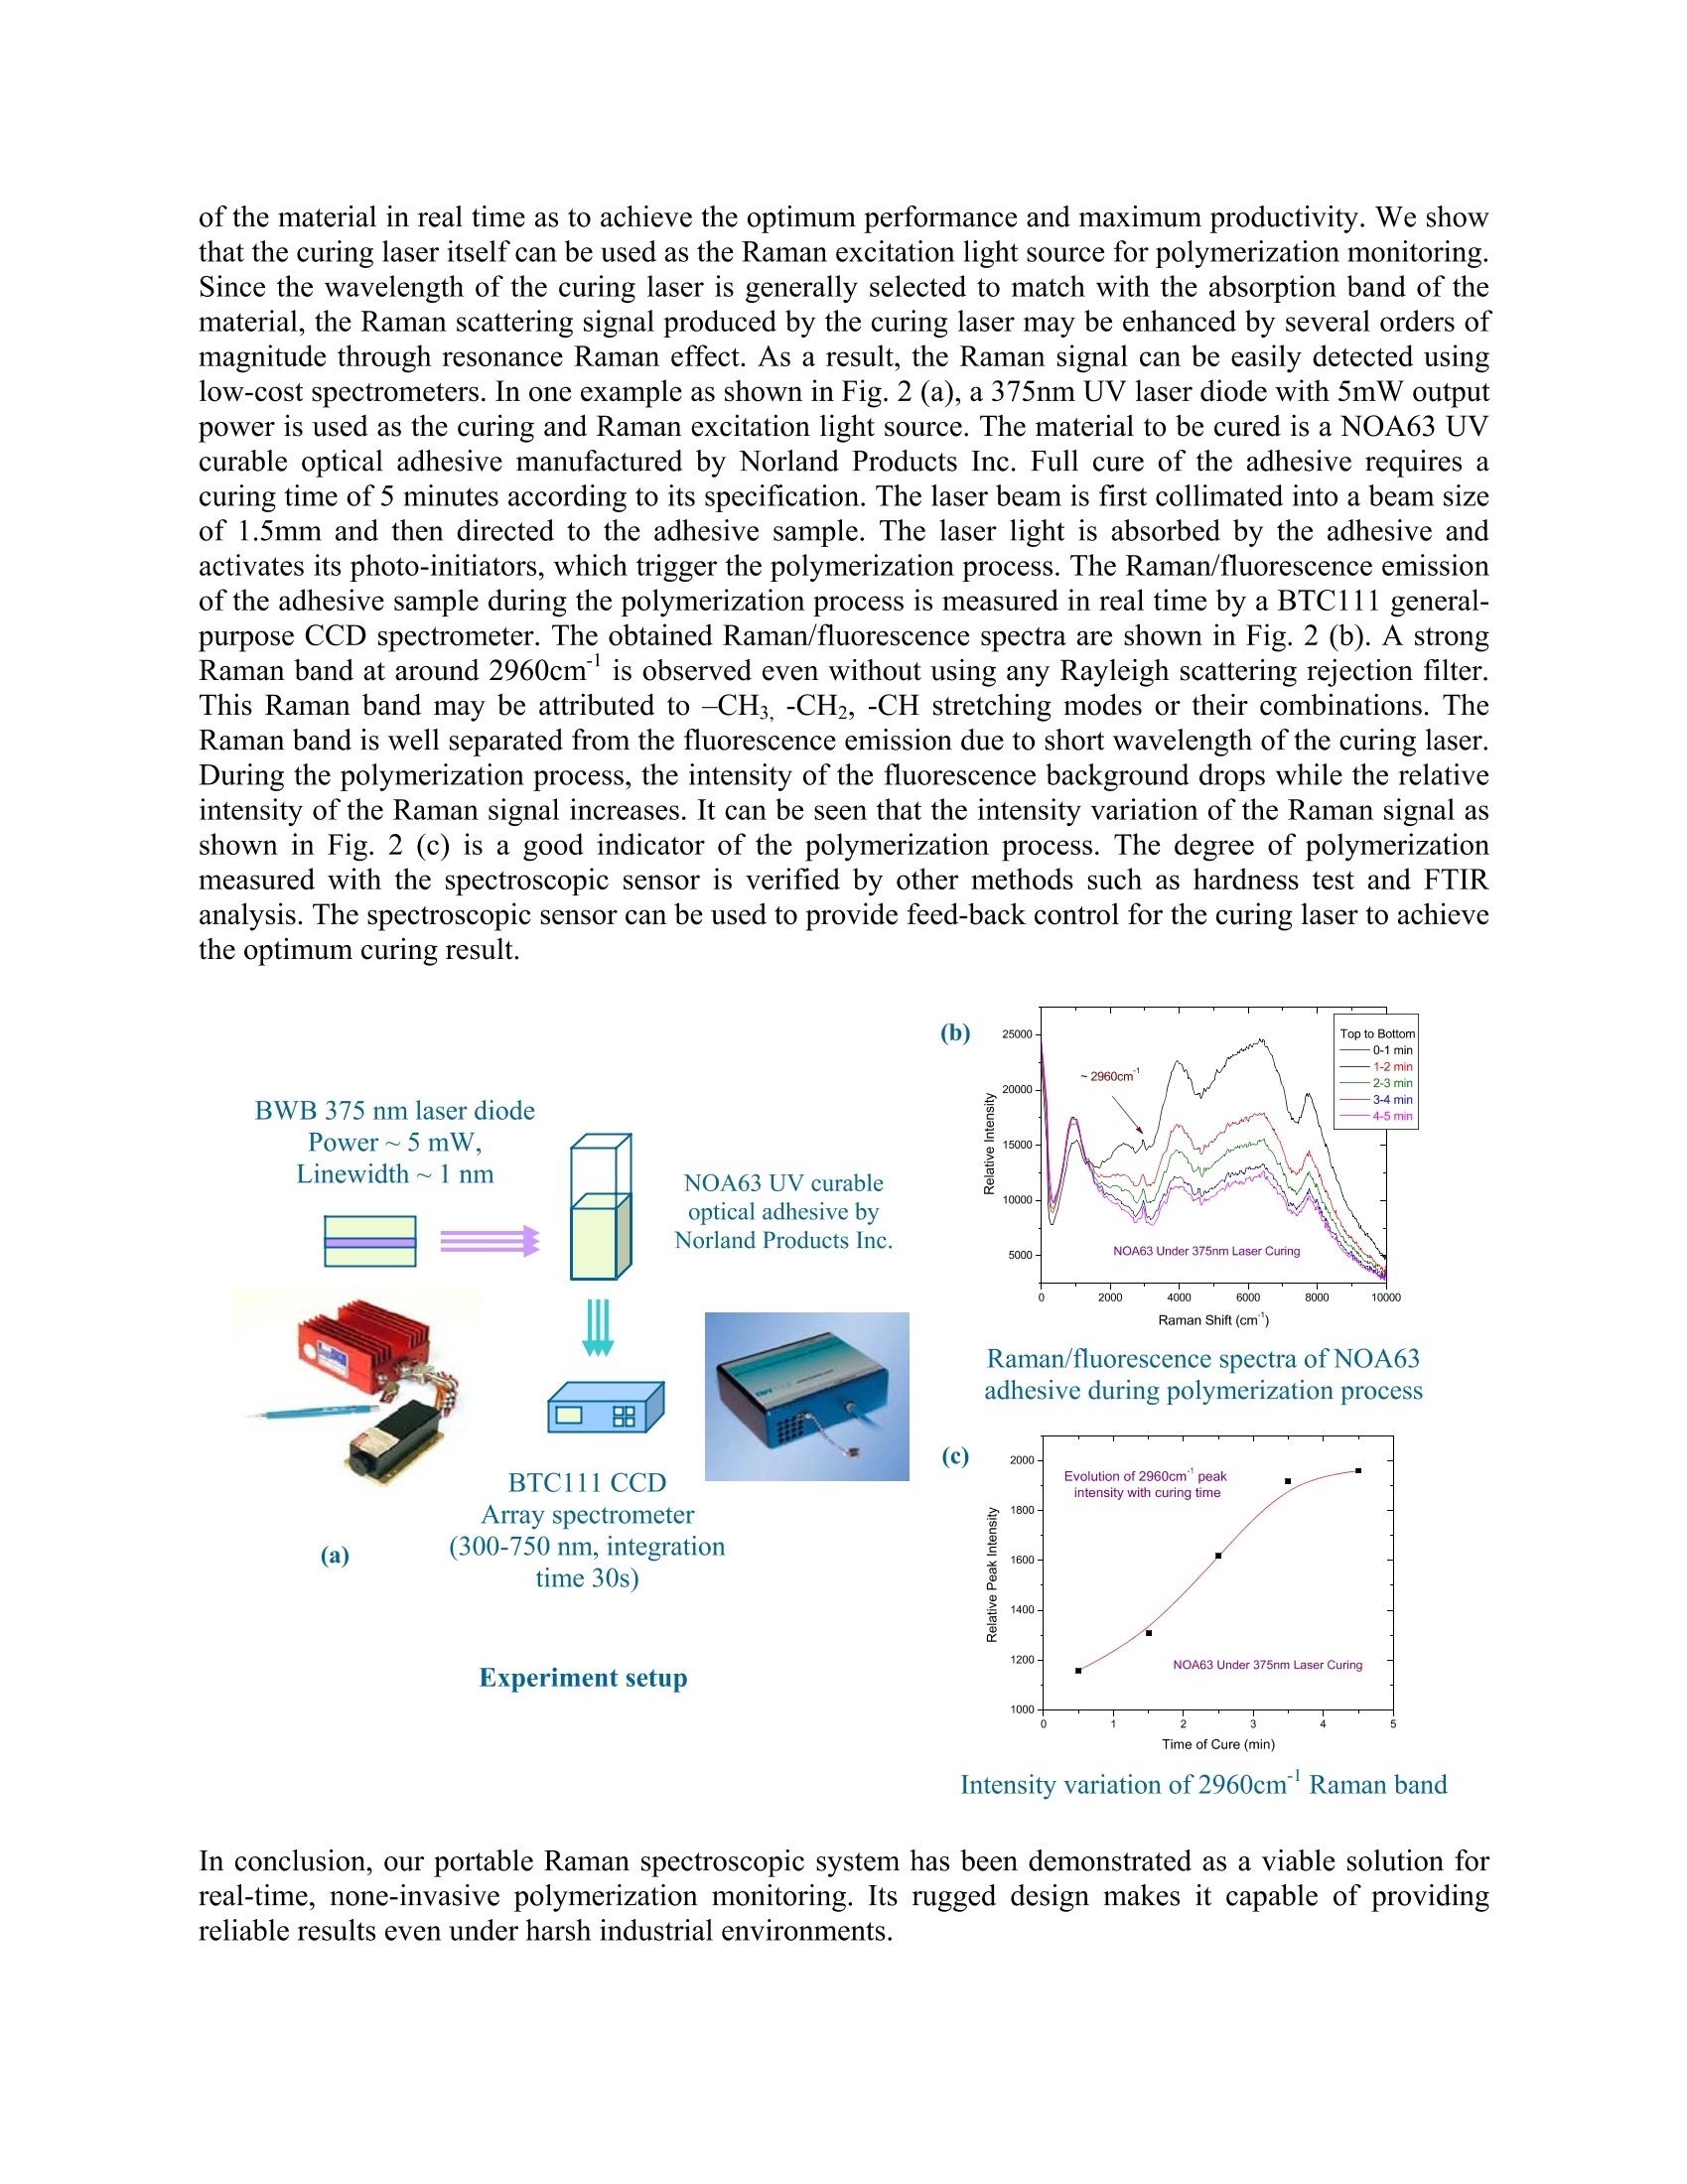
Raman spectroscopic methods for polymerization monitoring B & W Tek, Inc., 19 Shea Way,Newark, DE 19713, info@bwtek.com, www.bwtek.com Raman spectroscopy is a spectroscopic technique used to study vibrational,rotational, and other low-frequency modes in a system. We will show that non-invasive, real-time polymerization monitoring canbe successfully performed with our hand-portable, miniature Raman spectroscopic system. In the first example, a MiniRamTM Raman spectrometer (Fig. 1 (a)) is used to monitor the polymerizationstatus of a Tra-bond 2116 epoxy sample and a TPH3 restorative dental resin sample. The MiniRamTMRaman spectrometer features a rugged turn-key design with a built-in spectral narrowed and stabilized785nm diode laser and a BTC111/112 CCD array spectrometer. A spectral coverage of 175-3100cm anda spectral resolution of 10 cm make it suitable for general Raman spectroscopy applications. TheMiniRamTM spectrometer is also equipped with a fiber optic probe that provides OD >6 Rayleighscattering rejection. Fig. 1 (b) shows the Raman spectra of the Tra-bond 2116 epoxy samplilce before andafter curane. It can be seen that the epoxy band at 1260cm decreases as the oxirane ring is opened by thecuring reaction, while the phenyl ring stretch at 1610cm° remains constant which can be used as areference. The variation of the relative intensity of the epoxy band vs. curing time is plotted in Fig. 1 (c).It can be seen that the intensity decrease of the 1260cm° epoxy band follows a Gaussian model. Thismatches well with the previous published results, in which a FT-Raman spectrometer is used to monitorthe epoxy curing process. Fig. 1 (d) shows the measured Raman spectra of a TPH3 restorative dental resinbefore and after the curing process. A variation in the relative intensity of methacrylate C=C stretchingmode at 1640 cmand the aromatic C=C stretching mode at 1610 cm’’can be used as an indicator of thedegree of conversion for the dental resin. 40000 (d) Raman spectra of TPH3 dental resin beforeand after cure 14000- Raman spectra of Tra-bond 2116 epoxybefore and after cure (c) Intensity variation of 1260cm epoxy band of the material in real time as to achieve the optimum performance and maximum productivity. We showthat the curing laser itself can be used as the Raman excitation light source for polymerization monitoring.Since the wavelength of the curing laser is generally selected to match with the absorption band of thematerial, the Raman scattering signal produced by the curing laser may be enhanced by several orders ofmagnitude through resonance Raman effect. As a result, the Raman signal can be easily detected usinglow-cost spectrometers. In one example as shown in Fig.2 (a), a 375nm UV laser diode with 5mW outputpower is used as the curing and Raman excitation light source. The material to be cured is a NOA63 UVcurable optical adhesive manufactured by Norland Products Inc. Full cure of the adhesive requires acuring time of5 minutes according to its specification. The laser beam is first collimated into a beam sizeof 1.5mm and then directed to the adhesive sample. The laser light is absorbed by the adhesive andactivates its photo-initiators, which trigger the polymerization process. The Raman/fluorescence emissionof the adhesive sample during the polymerization process is measured in real time by a BTC111 general-purpose CCD spectrometer. The obtained Raman/fluorescence spectra are shown in Fig. 2(b). A strongRaman band at around 2960cm°is observed even without using any Rayleigh scattering rejection filter.This Raman band may be attributed to -CHs,-CH2, -CH stretching modes or their combinations. TheRaman band is well separated from the fluorescence emission due to short wavelength of the curing laser.During the polymerization process, the intensity of the fluorescence background drops while the relativeintensity of the Raman signal increases. It can be seen that the intensity variation of the Raman signal asshown in Fig. 2 (C) is a good indicator of the polymerization process. The degree of polymerizationmeasured with the spectroscopic sensor is verified by other methods such as hardness test and FTIRanalysis. The spectroscopic sensor can be used to provide feed-back control for the curing laser to achievethe optimum curing result. (b) 25000 Top to Bottom In conclusion, our portable Raman spectroscopic system has been demonstrated as a viable solution forreal-time, none-invasive polymerization monitoring. Its rugged design makes it capable of providingreliable results even under harsh industrial environments.
确定
还剩1页未读,是否继续阅读?

产品配置单

必达泰克光电设备(上海)有限公司为您提供《聚合物聚合过程中胶粘剂检测方案(激光拉曼光谱)》,该方案主要用于合成树脂/塑料中胶粘剂检测,参考标准--,《聚合物聚合过程中胶粘剂检测方案(激光拉曼光谱)》用到的仪器有MiniRam 微型近红外激光拉曼光谱仪、高灵敏度便携式拉曼光谱仪i-Raman Plus、高通量TE致冷控温CCD阵列光谱仪
推荐专场


相关方案
更多