


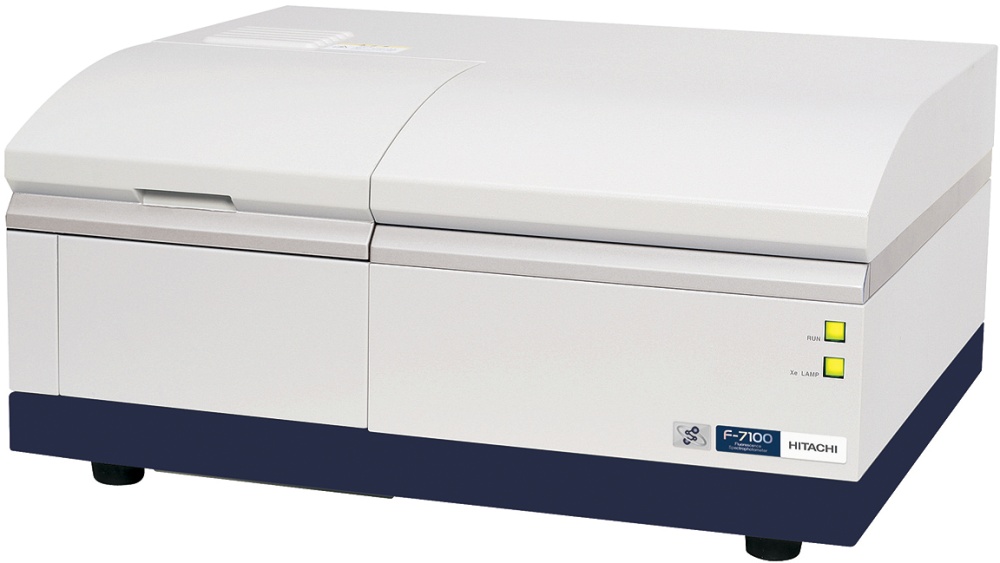
本文向您介绍如何使用日立荧光分光光度计F-7000通过荧光指纹法分析判别菠萝制品来源。通过测量鲜榨果汁和浓缩还原果汁、新鲜水果和水果罐头、单一果酱和混合果酱等品种繁多的水果制品样品,利用三维立体的激发发射光谱,可以辨别出样品种类和来源,并检测其中的化学成分。F-7000拥有全球最快扫描和驱动速度,三维光谱分析更加方便、快捷,提供追踪监控化学反应过程。超高信噪比的优异功能,可以检测出低至1*10-12mol/L的荧光素,同时,更有利于痕量样品的测量。
方案详情

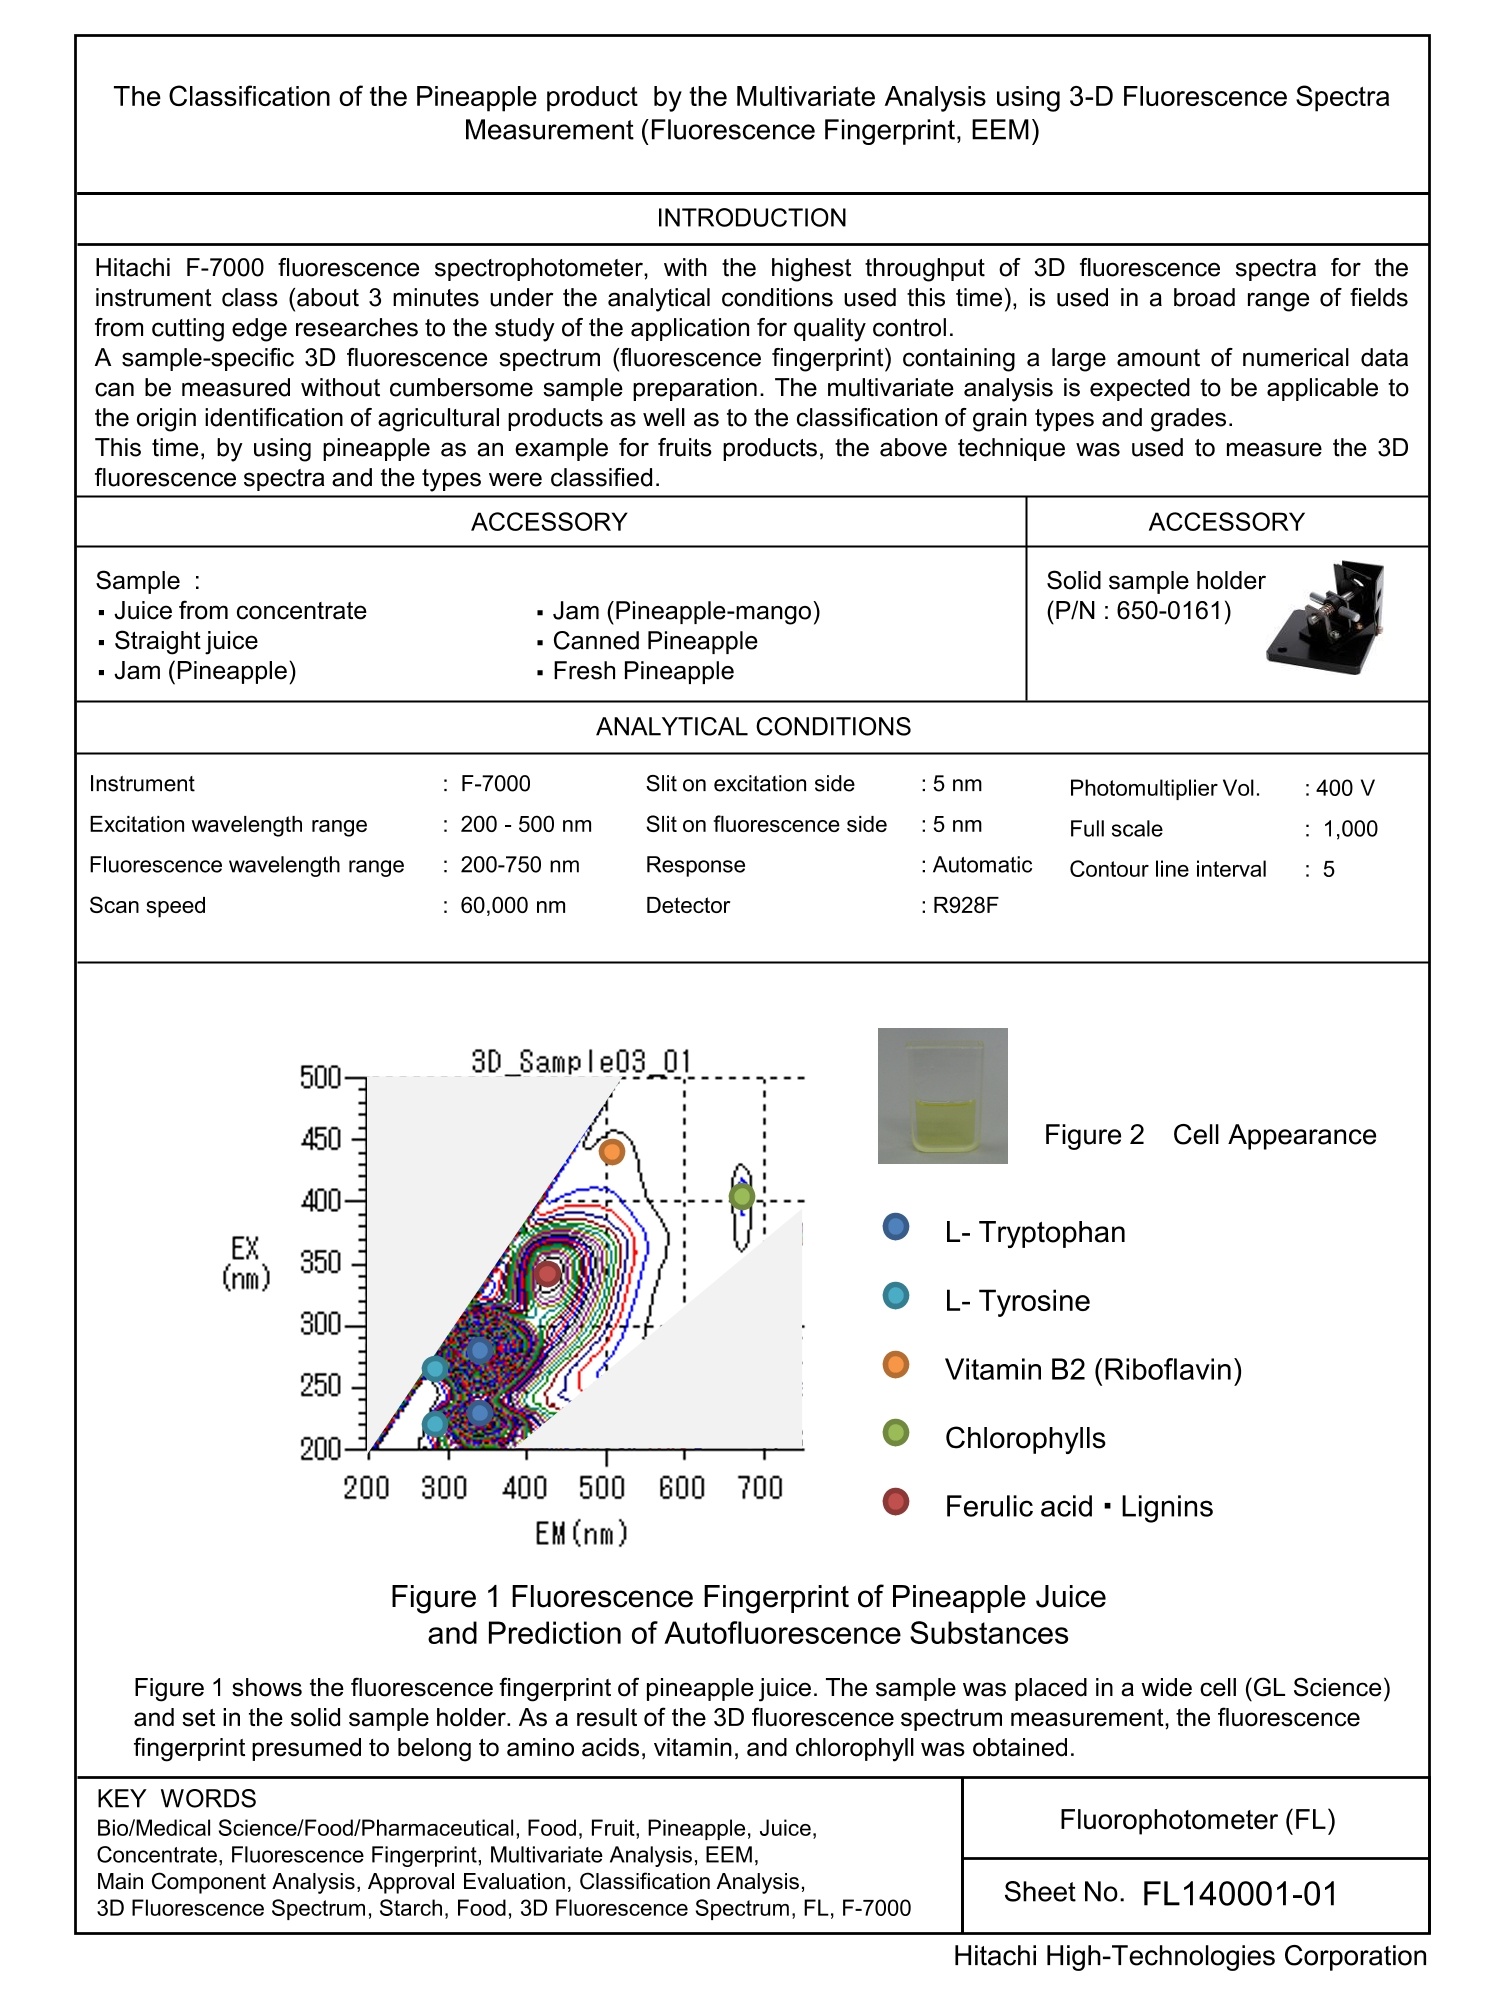
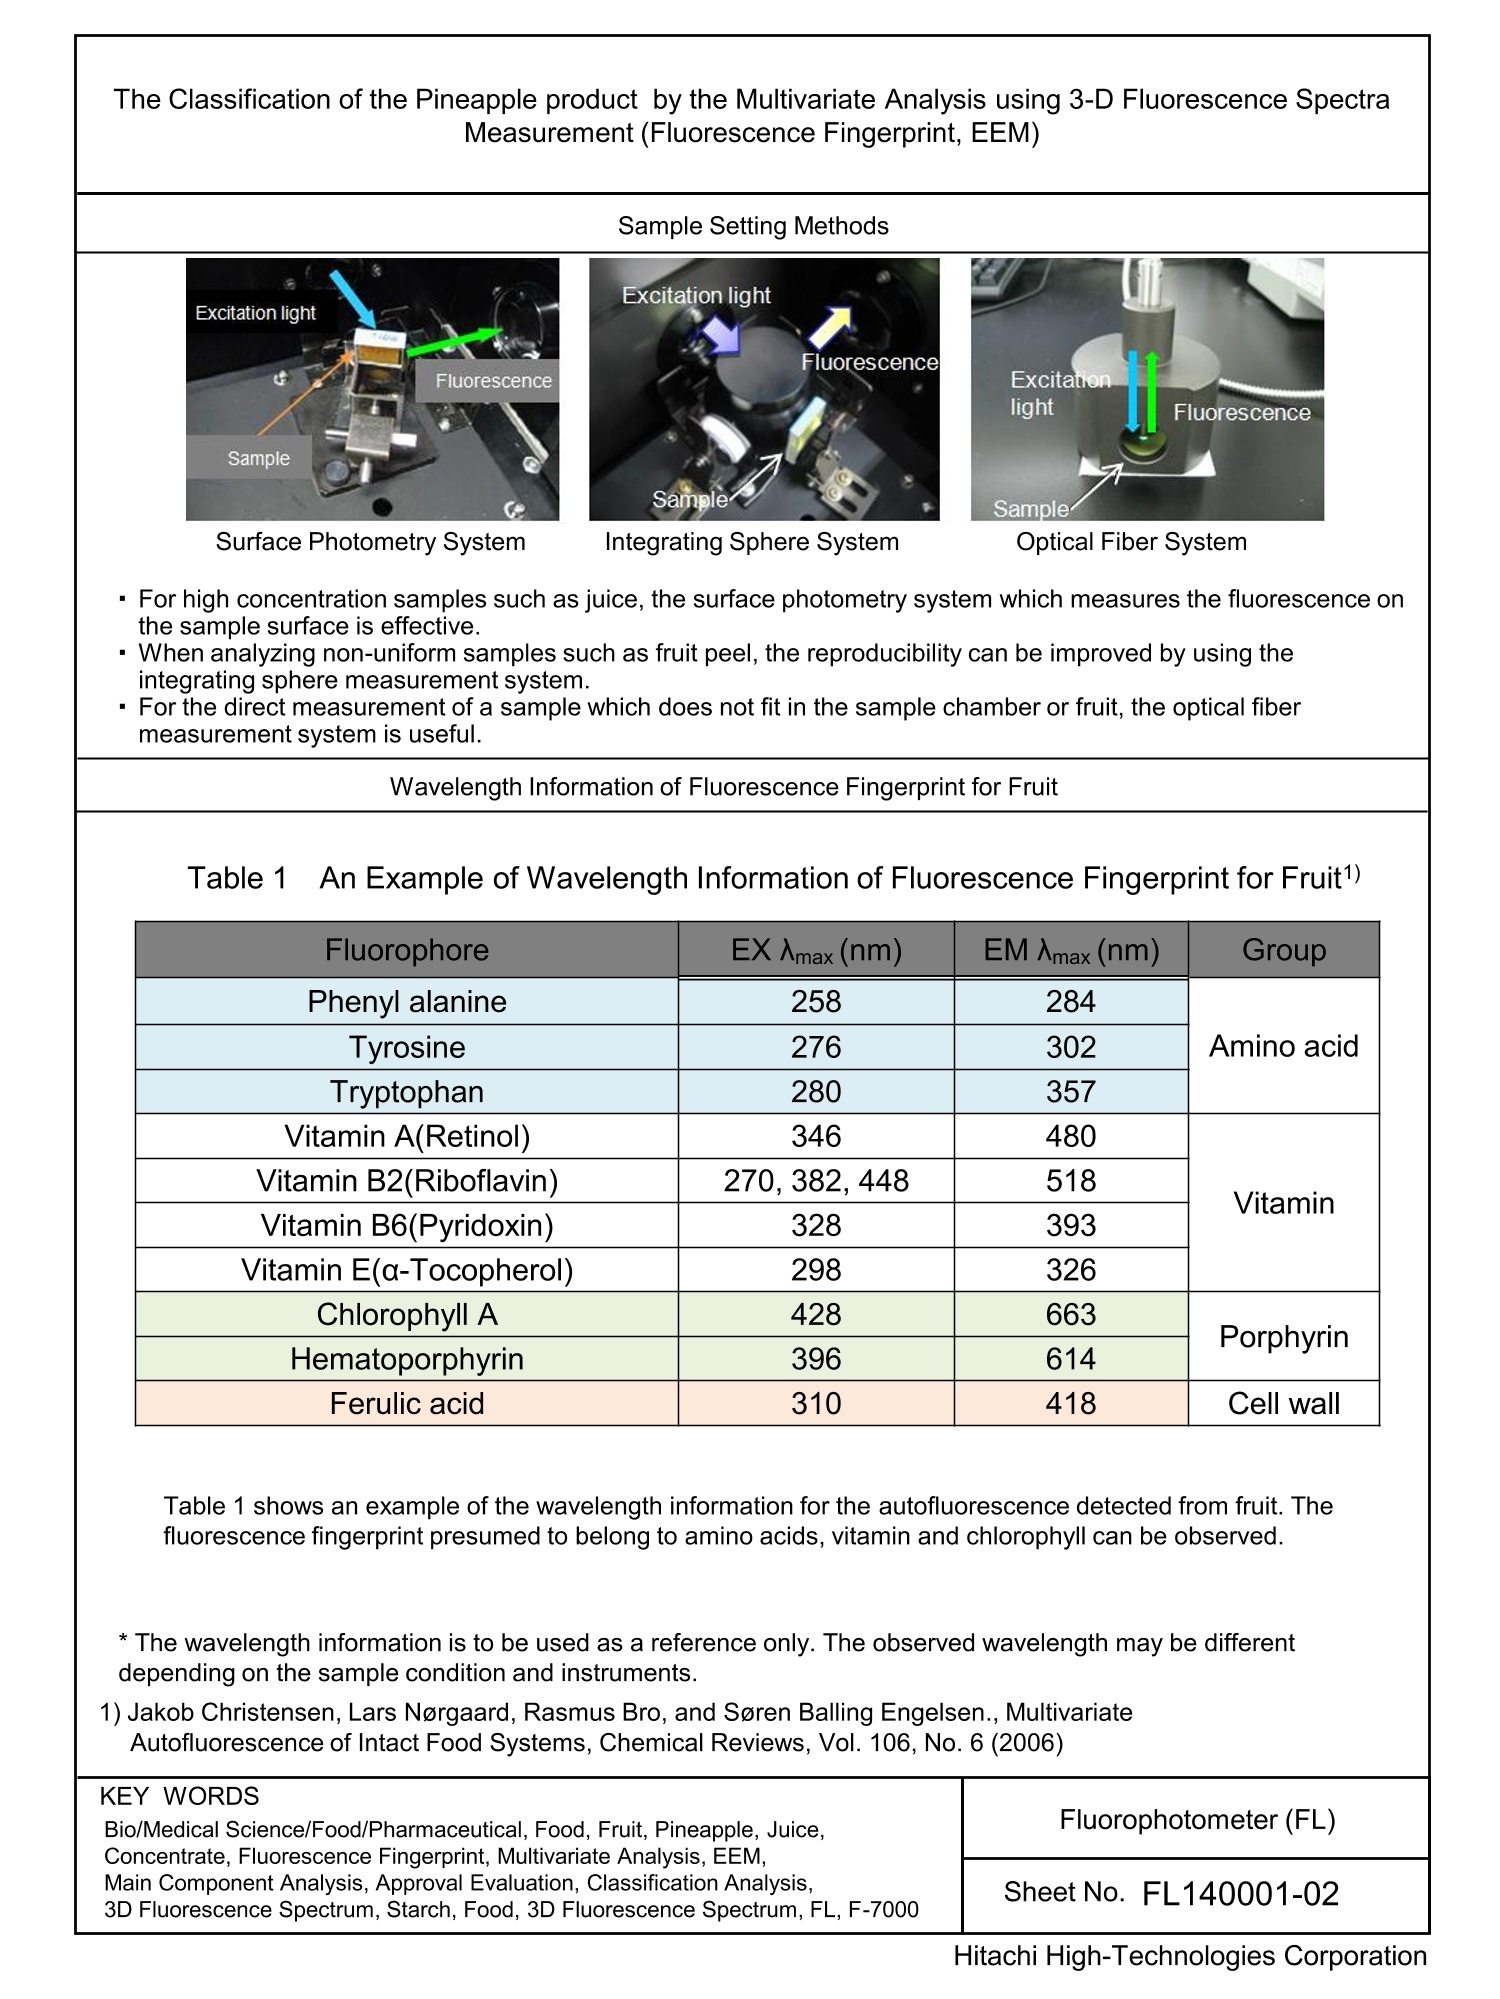
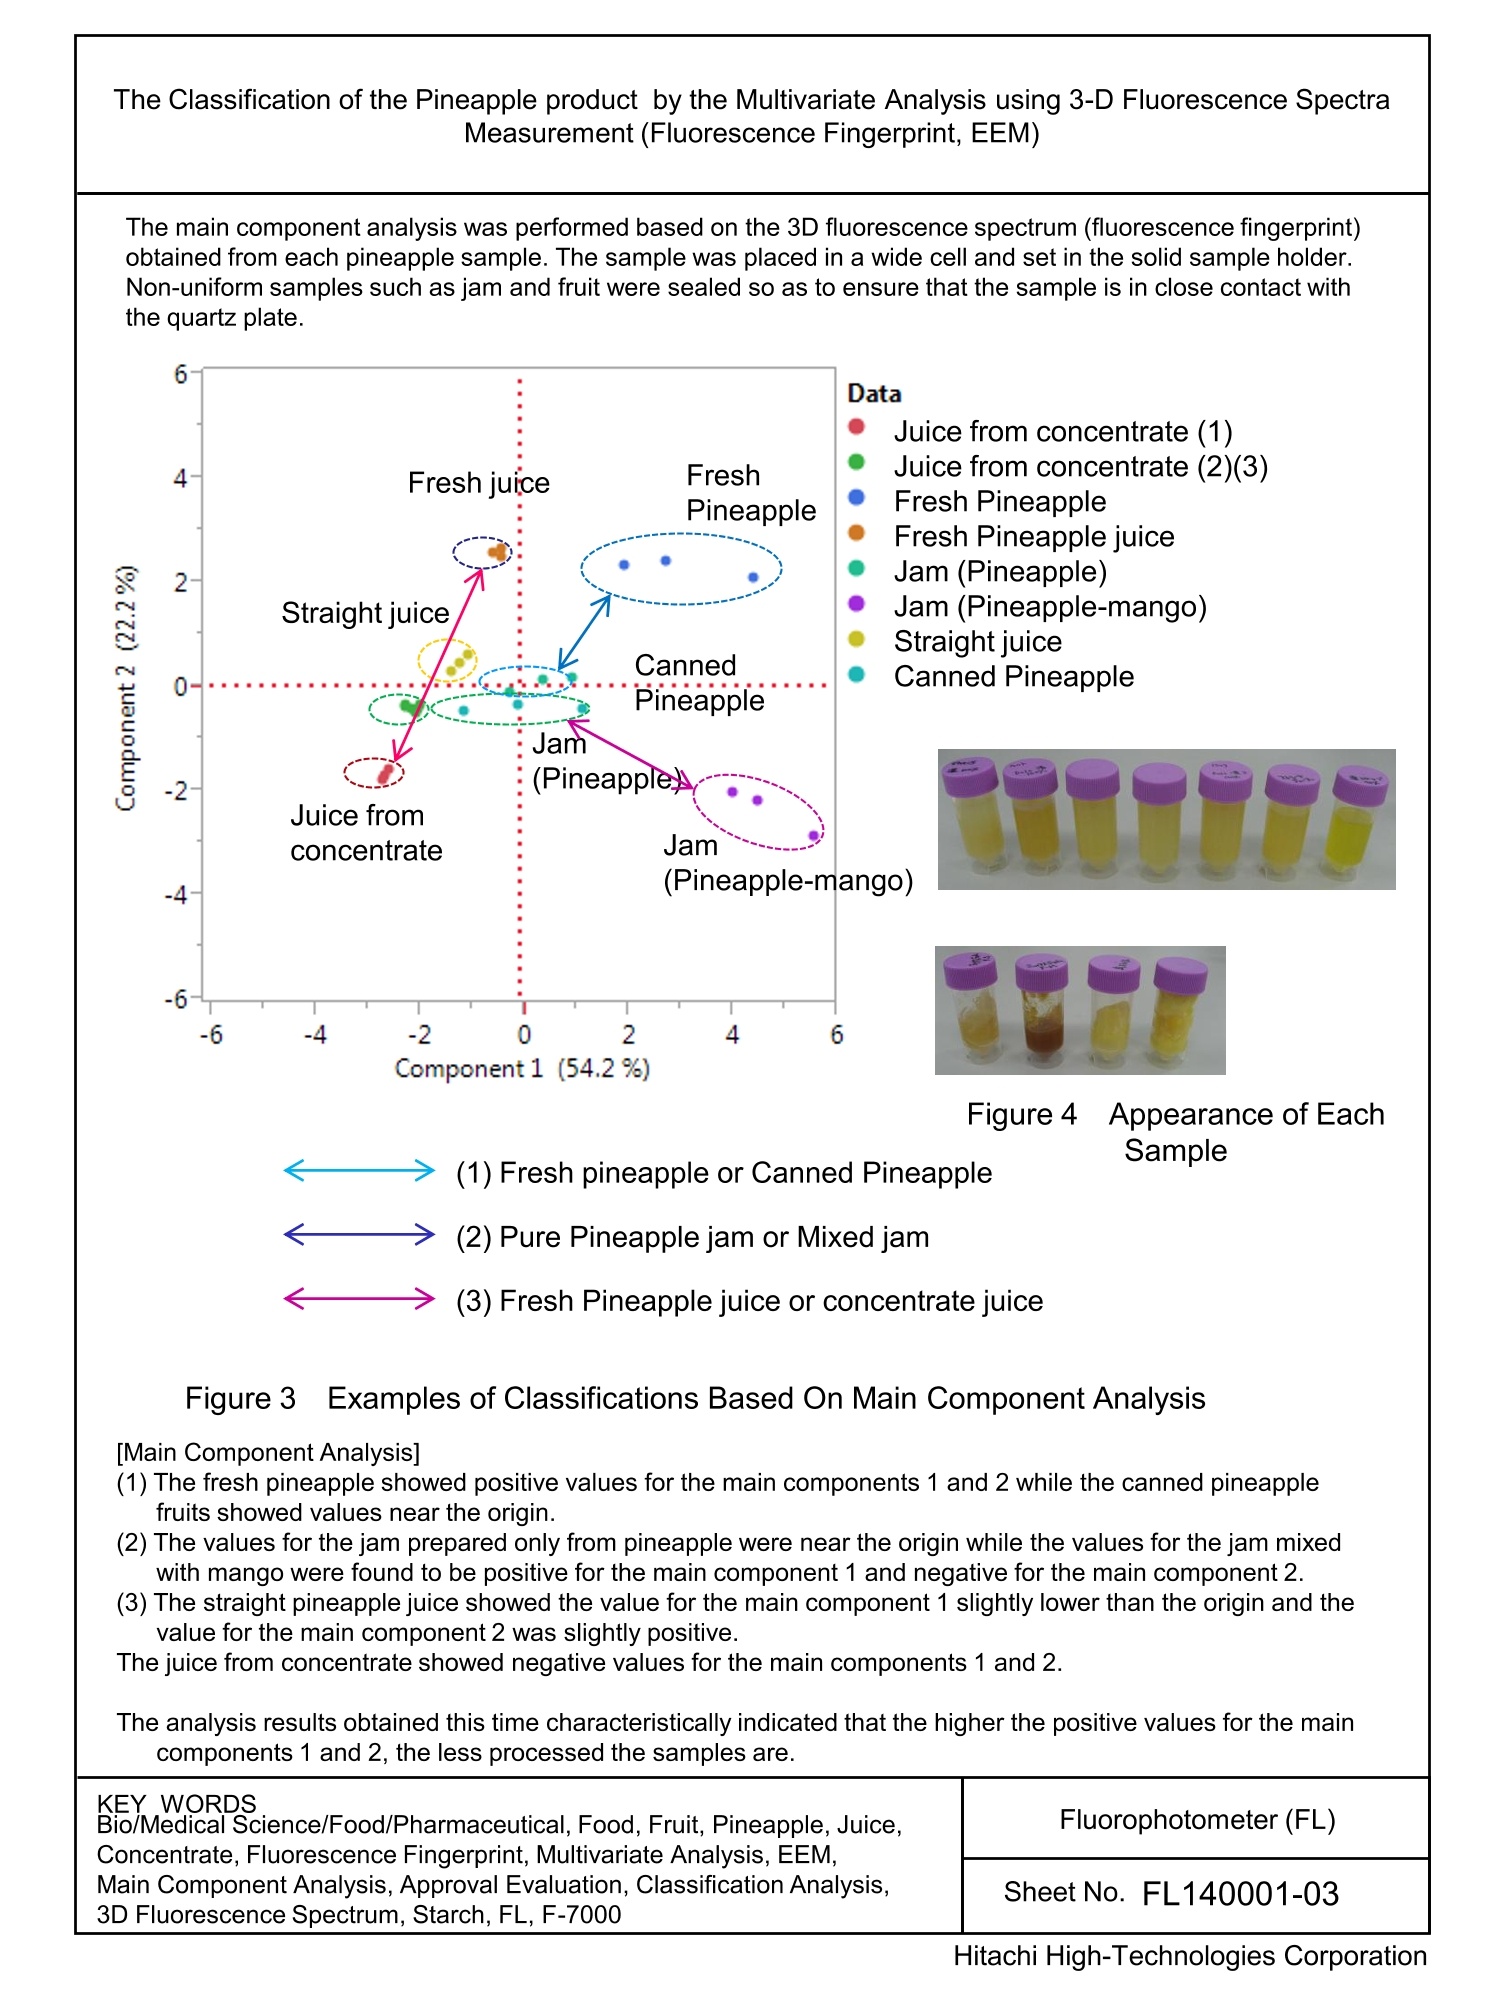
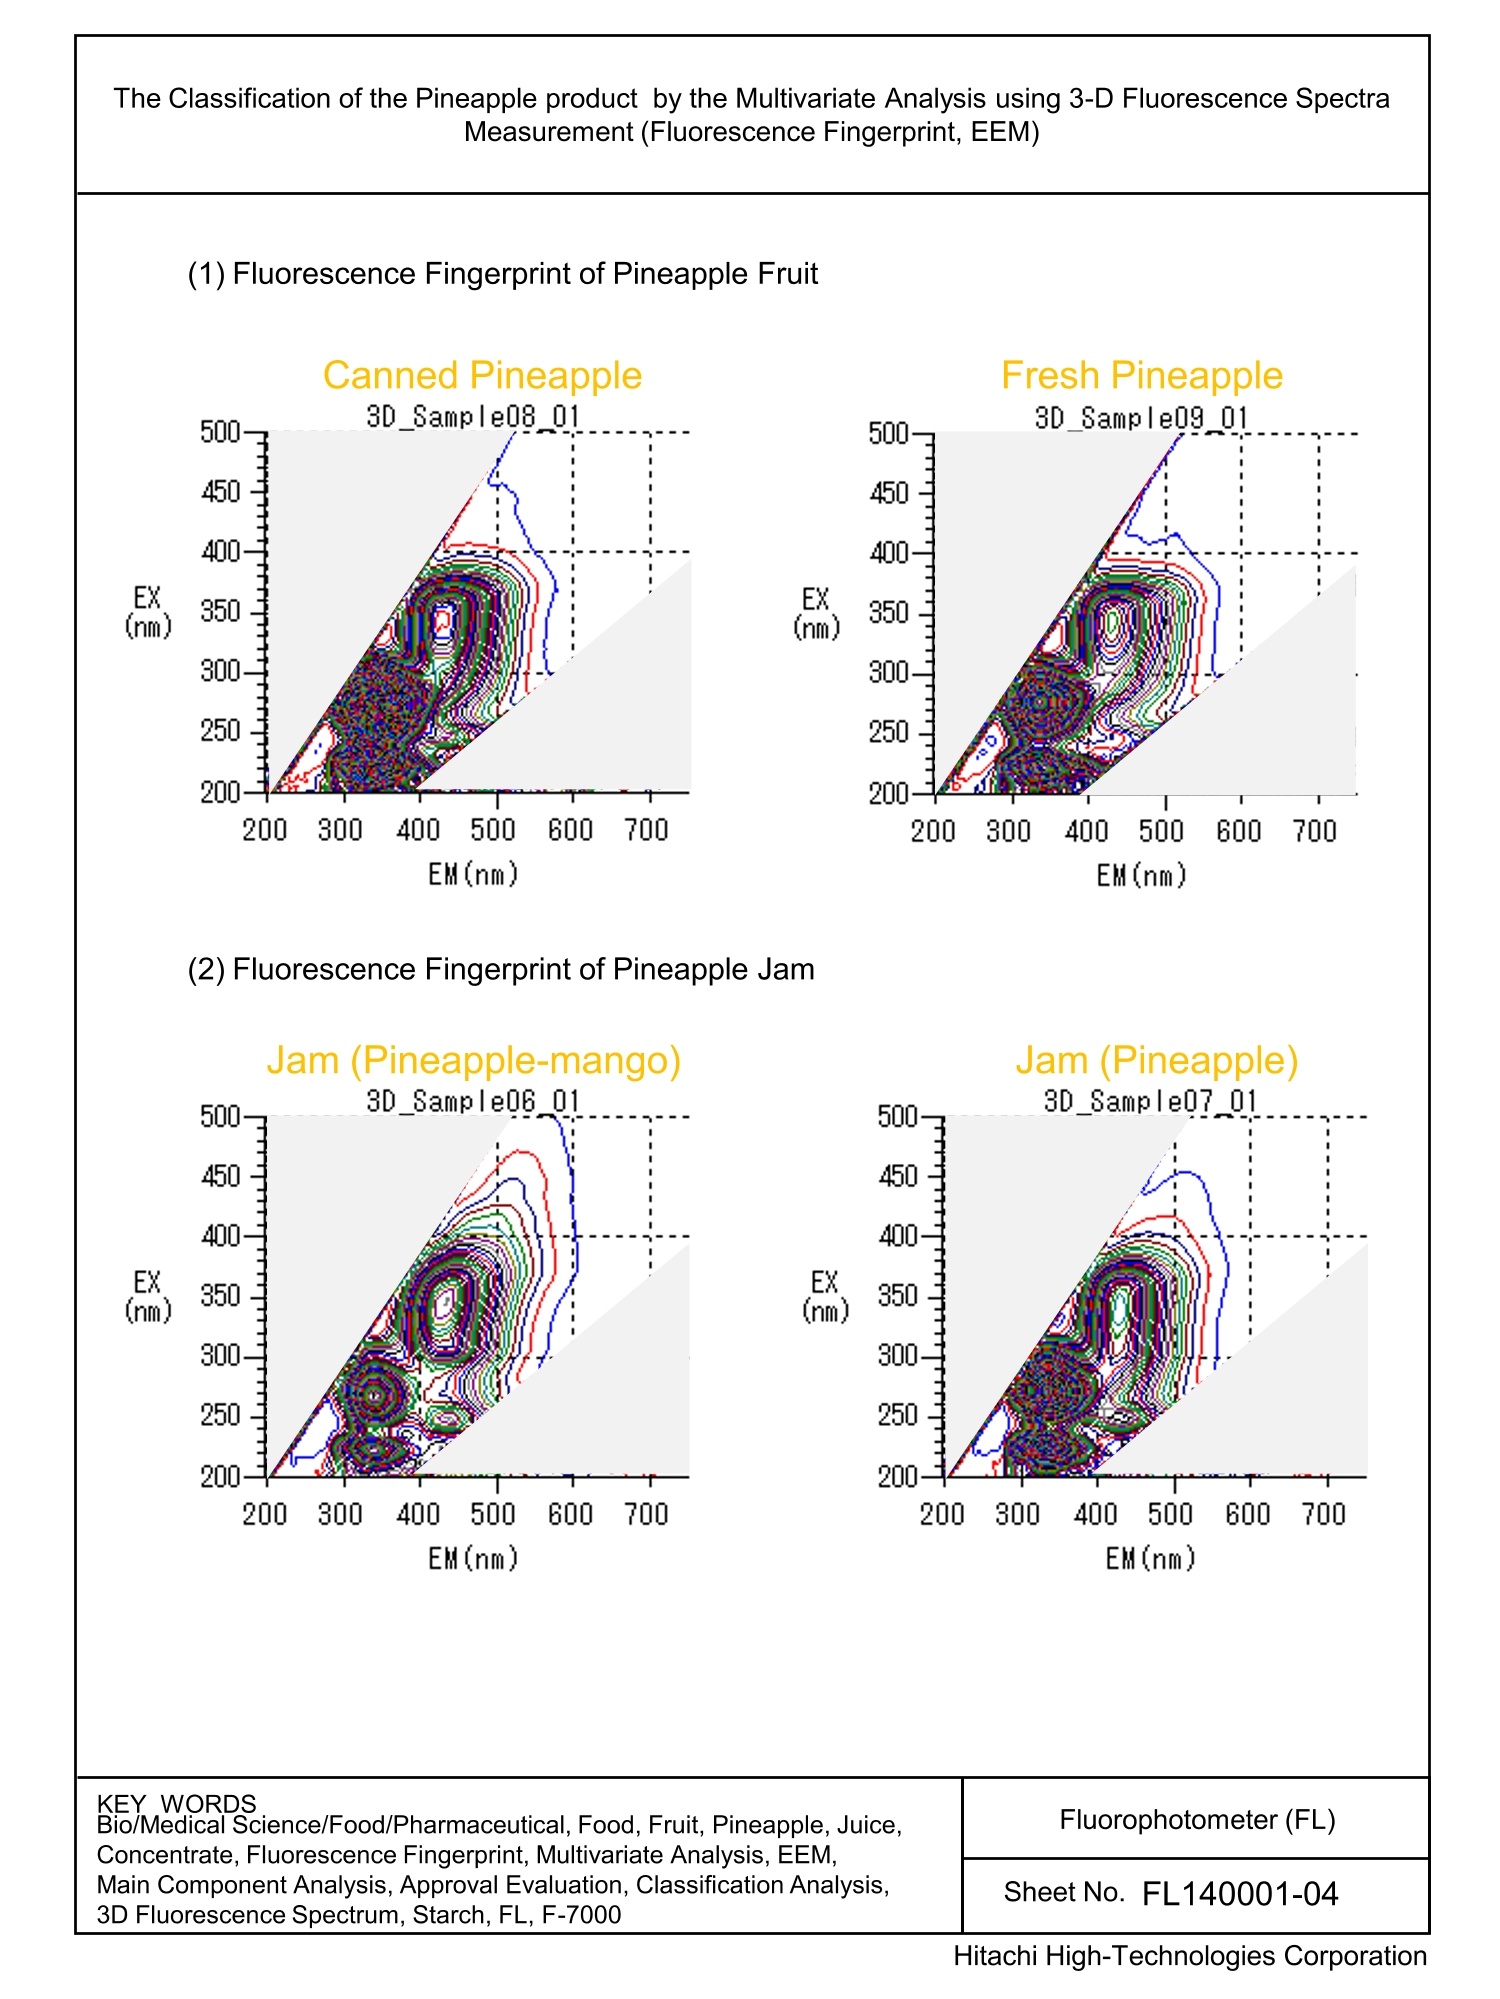
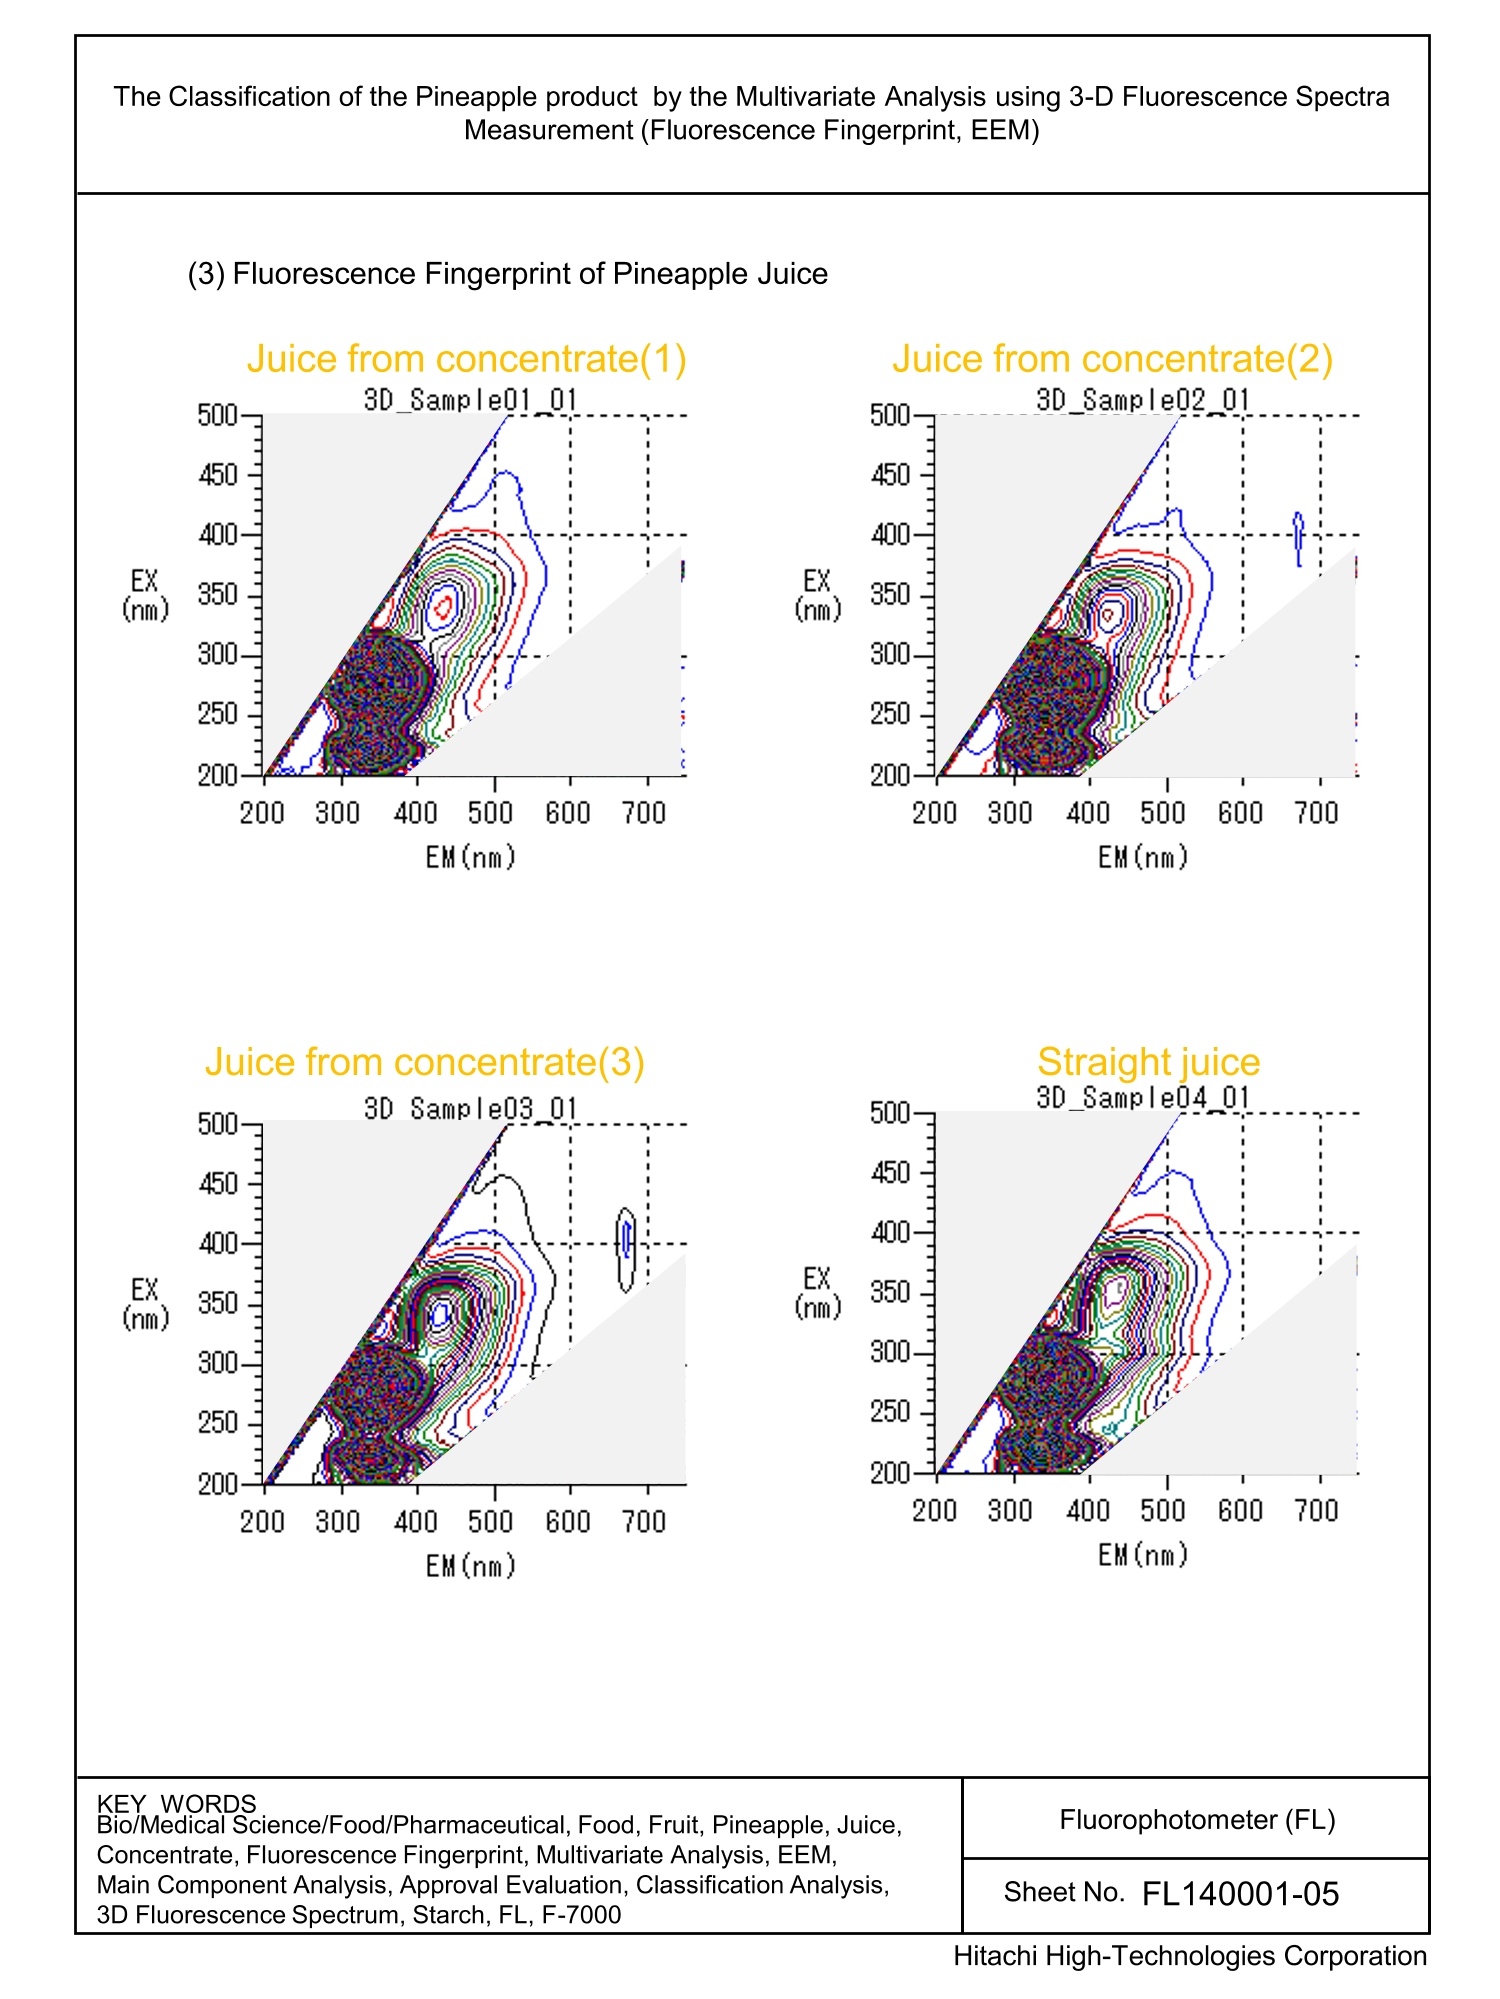
The Classification of the Pineapple product by the Multivariate Analysis using 3-D Fluorescence Spectra Measurement (Fluorescence Fingerprint,EEM) INTRODUCTION Hitachi F-7000 fluorescence spectrophotometer, with the highest throughput of 3D fluorescence spectra for theinstrument class (about 3 minutes under the analytical conditions used this time), is used in a broad range of fieldsfrom cutting edge researches to the study of the application for quality control. A sample-specific 3D fluorescence spectrum (fluorescence fingerprint) containing a large amount of numerical data Hitachi F-7000 fluorescence spectrophotometer, with the highest throughput of 3D fluorescence spectra for the instrument class (about 3 minutes under the analytical conditions used this time), is used in a broad range of fieldsfrom cutting edge researches to the study of the application for quality control.A sample-specific 3D fluorescence spectrum (fluorescence fingerprint) containing a large amount of numerical datacan be measured without cumbersome sample preparation. The multivariate analysis is expected to be applicable tothe origin identification of agricultural products as well as to the classification of grain types and grades.This time, by using pineapple as an example for fruits products, the above technique was used to measure the 3Dfluorescence spectra and the types were classified. ACCESSORY ACCESSORY Sample : · Juice from concentrate ·Jam (Pineapple-mango) · Straight juice ·Canned Pineapple · Jam (Pineapple) · Fresh Pineapple Solid sample holder(P/N:650-0161) ANALYTICAL CONDITIONS Instrument : F-7000 Slit on excitation side :5 nm Photomultiplier Vol. :400V Excitation wavelength range : 200-500nm Slit on fluorescence side :5nm Full scale :1,000Fluorescence wavelength range :200-750nm Response :Automatic Contour line interval :5 Scan speed : 60,000 nm Detector : R928F 300- 250 Vitamin B2 (Riboflavin) 200- Chlorophylls 200 300 400 500 600700 Ferulic acid·Lignins EM(nm) Figure 1 Fluorescence Fingerprint of Pineapple Juice and Prediction of Autofluorescence Substances Figure 1 shows the fluorescence fingerprint of pineapple juice. The sample was placed in a wide cell (GL Science)and set in the solid sample holder. As a result of the 3D fluorescence spectrum measurement, the fluorescencefingerprint presumed to belong to amino acids, vitamin, and chlorophyll was obtained. KEY WORDS Bio/Medical Science/Food/Pharmaceutical, Food, Fruit, Pineapple, Juice,Concentrate, Fluorescence Fingerprint, Multivariate Analysis,EEM,Main Component Analysis, Approval Evaluation, Classification Analysis, 3D Fluorescence Spectrum, Starch, Food, 3D Fluorescence Spectrum, FL, F-7000 Fluorophotometer (FL) Sheet No. FL140001-01 The Classification of the Pineapple product by the Multivariate Analysis using 3-D Fluorescence Spectra Measurement (Fluorescence Fingerprint, EEM) Sample Setting Methods Excitation light Fluorescence Excitation ight Fluorescence Sample SampleSurface Photometry System Integrating Sphere System Optical Fiber System· For high concentration samples such as juice, the surface photometry system which measures the fluorescence onthe sample surface is effective.· When analyzing non-uniform samples such as fruit peel, the reproducibility can be improved by using theintegrating sphere measurement system. · For the direct measurement of a sample which does not fit in the sample chamber or fruit, the optical fibermeasurement system is useful. Wavelength Information of Fluorescence Fingerprint for Fruit Fluorophore EX 入max(nm) EM 入max (nm) Group Phenyl alanine 258 284 Amino acid Tyrosine 276 302 Tryptophan 280 357 Vitamin A(Retinol) 346 480 Vitamin Vitamin B2(Riboflavin) 270, 382,448 518 Vitamin B6(Pyridoxin) 328 393 Vitamin E(a-Tocopherol) 298 326 Chlorophyll A 428 663 Porphyrin Hematoporphyrin 396 614 Ferulic acid 310 418 Cell wall Table 1 shows an example of the wavelength information for the autofluorescence detected from fruit. Thefluorescence fingerprint presumed to belong to amino acids, vitamin and chlorophyll can be observed. * The wavelength information is to be used as a reference only. The observed wavelength may be differentdepending on the sample condition and instruments. 1) Jakob Christensen, Lars Norgaard, Rasmus Bro, and Soren Balling Engelsen., MultivariateAutofluorescence of Intact Food Systems, Chemical Reviews, Vol. 106,No.6 (2006) KEY WORDS Bio/Medical Science/Food/Pharmaceutical, Food, Fruit, Pineapple, Juice, Concentrate, Fluorescence Fingerprint, Multivariate Analysis,EEM,Main Component Analysis, Approval Evaluation, Classification Analysis, 3D Fluorescence Spectrum, Starch, Food, 3D Fluorescence Spectrum, FL, F-7000 Fluorophotometer (FL) Sheet No. FL140001-02 The Classification of the Pineapple product by the Multivariate Analysis using 3-D Fluorescence SpectraMeasurement (Fluorescence Fingerprint, EEM) The main component analysis was performed based on the 3D fluorescence spectrum (fluorescence fingerprint) obtained from each pineapple sample. The sample was placed in a wide cell and set in the solid sample holder. Figure 3Examples of Classifications Based On Main Component Analysis [Main Component Analysis] (1) The fresh pineapple showed positive values for the main components 1 and 2 while the canned pineapplefruits showed values near the origin. (2) The values for the jam prepared only from pineapple were near the origin while the values for the jam mixedwith mango were found to be positive for the main component 1 and negative for the main component 2. (3) The straight pineapple juice showed the value for the main component 1 slightly lower than the origin and thevalue for the main component 2 was slightly positive. The juice from concentrate showed negative values for the main components 1 and 2. The analysis results obtained this time characteristically indicated that the higher the positive values for the maincomponents 1 and 2, the less processed the samples are. KEY WORDS Bio/Medical Science/Food/Pharmaceutical, Food, Fruit, Pineapple, Juice,Concentrate, Fluorescence Fingerprint, Multivariate Analysis,EEM,Main Component Analysis, Approval Evaluation, Classification Analysis,3D Fluorescence Spectrum, Starch, FL, F-7000 Fluorophotometer (FL) Sheet No. FL140001-03 Sheet No. FL140001-03 3D Fluorescence Spectrum, Starch, FL, F-7000 KEY WORDS Bio/Medical Science/Food/Pharmaceutical, Food, Fruit, Pineapple, Juice, Fluorophotometer (FL) Concentrate, Fluorescence Fingerprint, Multivariate Analysis,EEM, Main Component Analysis,Approval Evaluation, Classification Analysis, Sheet No. FL140001-04 3D Fluorescence Spectrum, Starch, FL, F-7000 KEY WORDS. Bio/Medical Science/Food/Pharmaceutical, Food, Fruit, Pineapple, Juice, Fluorophotometer (FL) Concentrate, Fluorescence Fingerprint, Multivariate Analysis,EEM, Main Component Analysis, Approval Evaluation, Classification Analysis, Sheet No. FL140001-05 3D Fluorescence Spectrum, Starch, FL, F-7000 Hitachi High-Technologies Corporation
确定
还剩3页未读,是否继续阅读?

产品配置单
日立科学仪器(北京)有限公司为您提供《菠萝中荧光检测方案(分子荧光光谱)》,该方案主要用于其他水果制品中理化分析检测,参考标准--,《菠萝中荧光检测方案(分子荧光光谱)》用到的仪器有日立F-7000荧光分光光度计
推荐专场
相关方案
更多
该厂商其他方案
更多