


方案详情
文
由于飞秒激光的频率远远高于THz的频率,可以认为,在第二束飞秒激光到探测晶体的时候,对此时的THz信号进行探测。达由于延迟线可以控制探测束飞秒激光的光程,因此,可以让探测的时间点和产生的THz信号的时间起点有一定的时间差,通过不断地改变这个时间差(光程差),可以探测到不同时间点的THz信号。由于飞秒激光是连续不断地发射,每一次飞秒激光的发生都会得到一个探测信号,通过若干次地改变延迟线的长度,进而改变对透射(反射)THz信号的探测时间点,最终就可以得到一个完整的透射(反射)THz信号的强度随时间变化的图谱,也就是THz-TDS结果。
方案详情

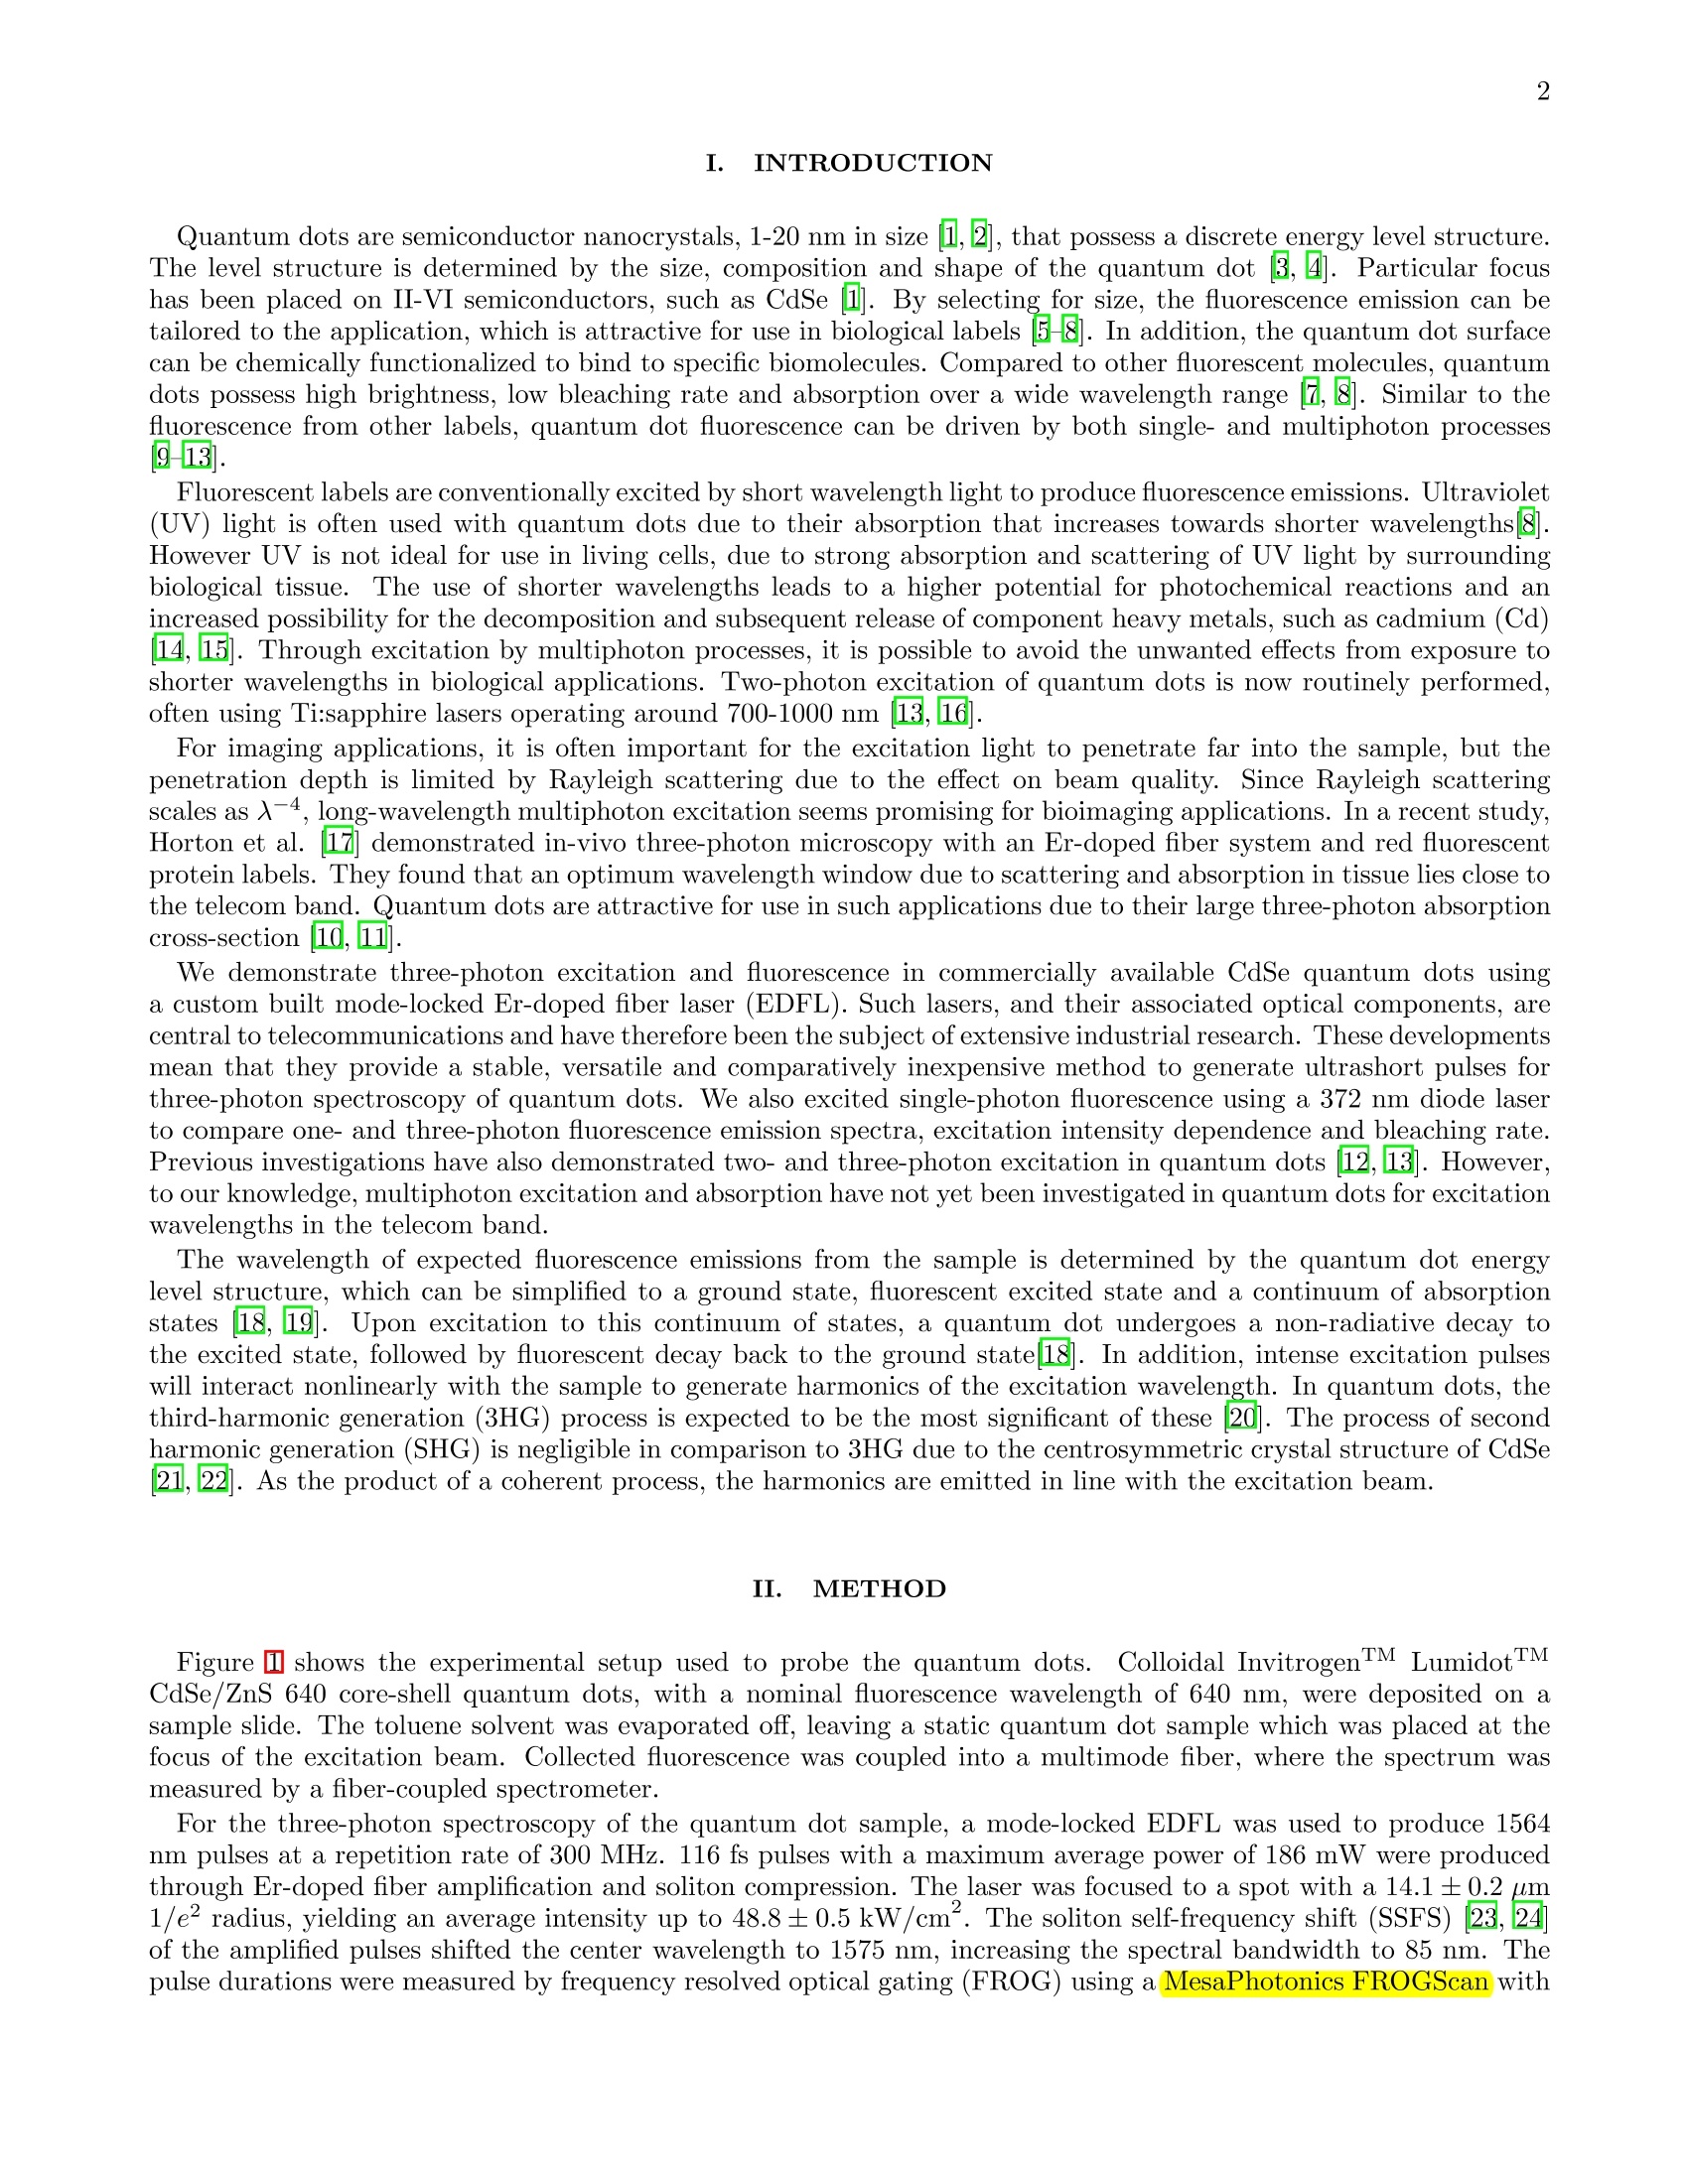
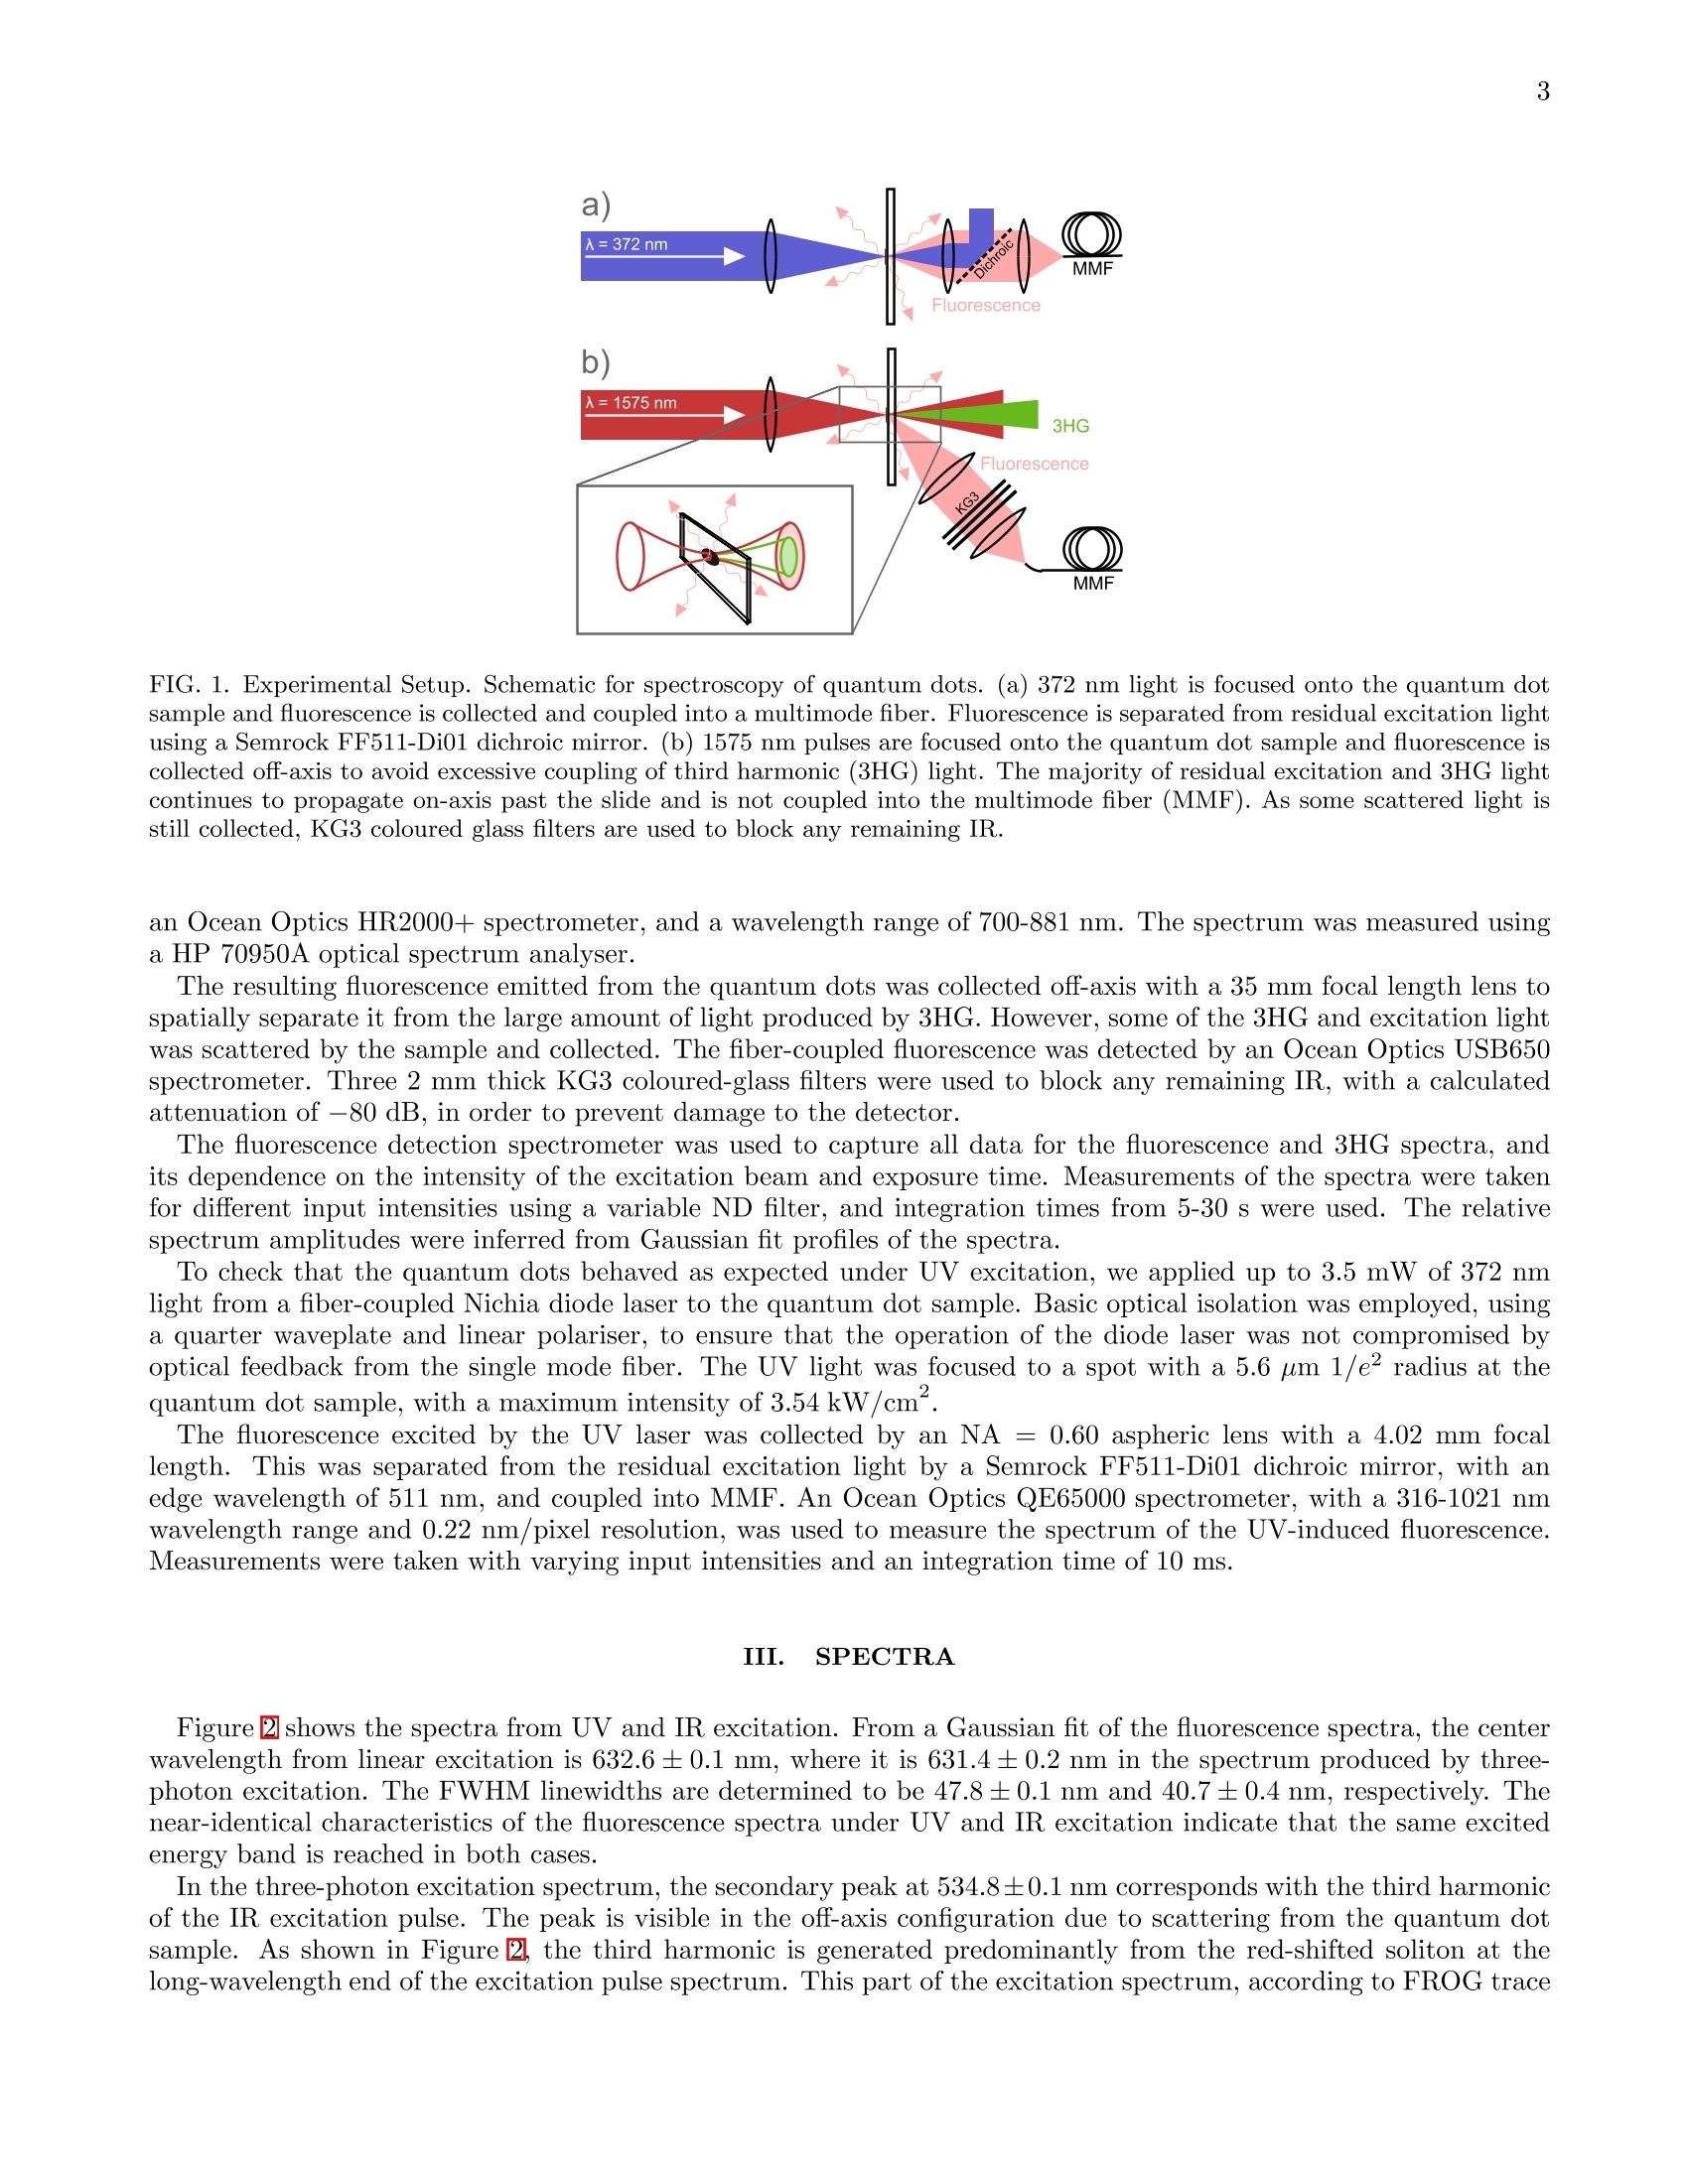
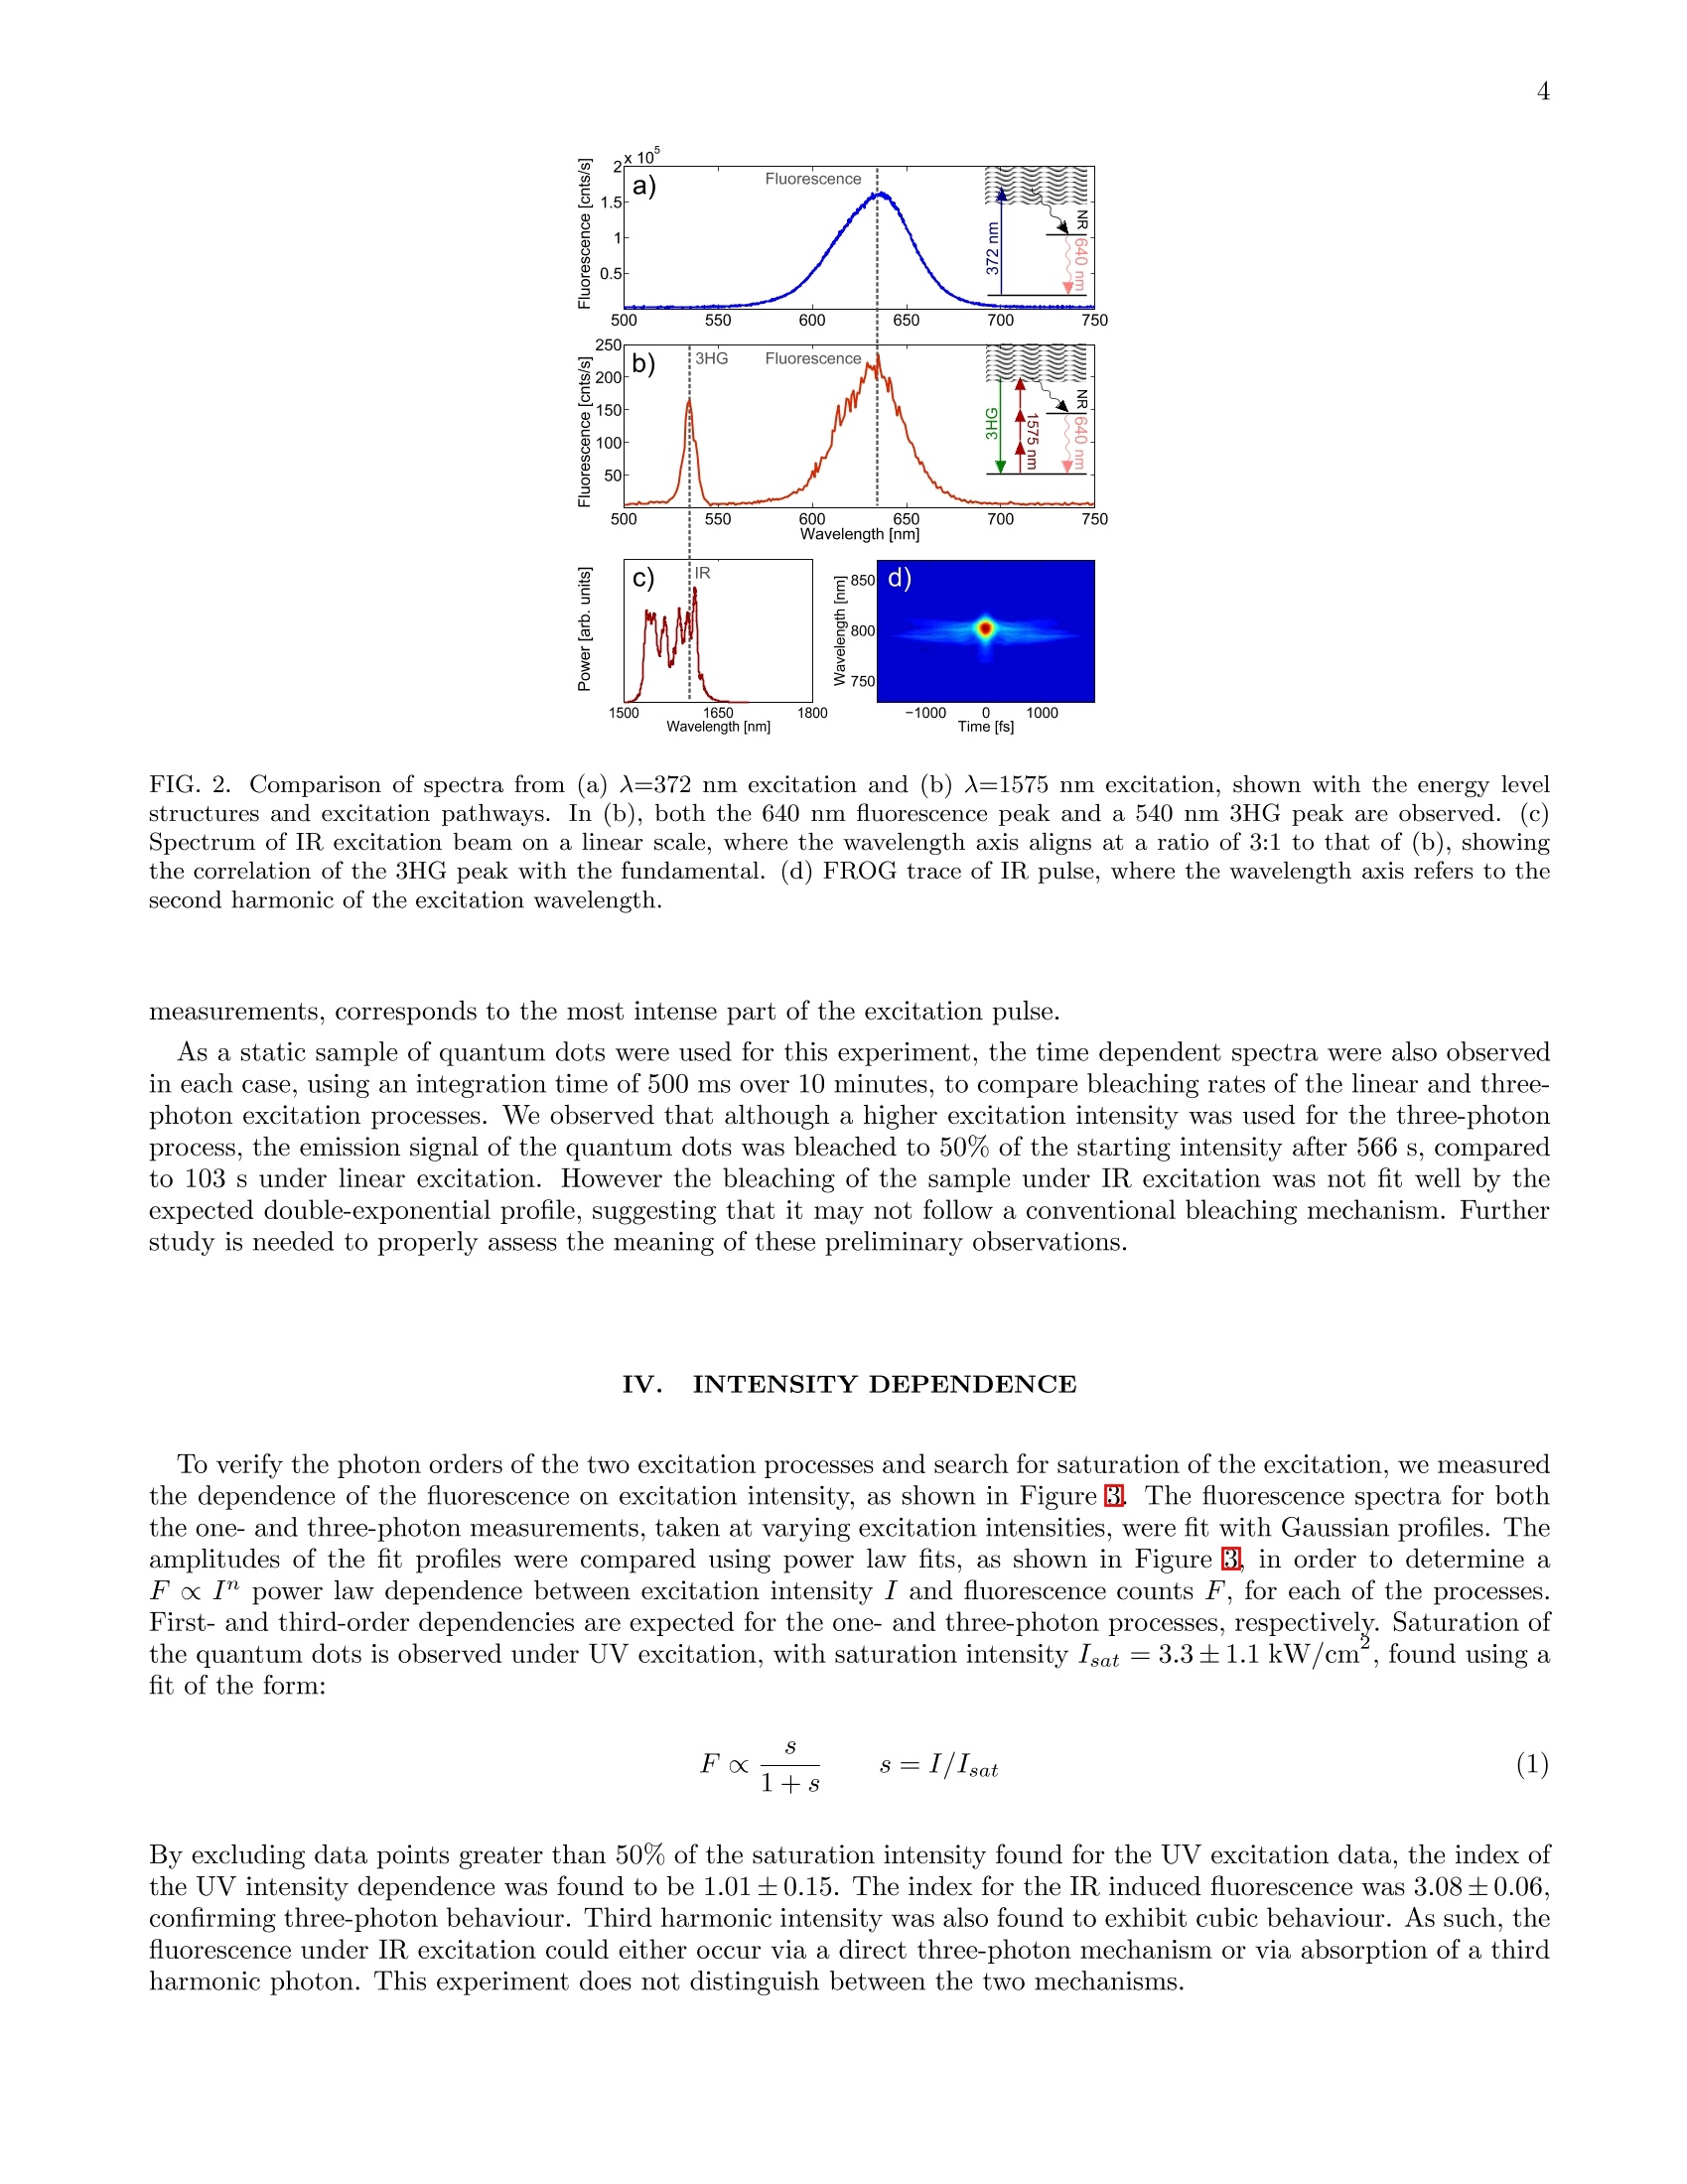
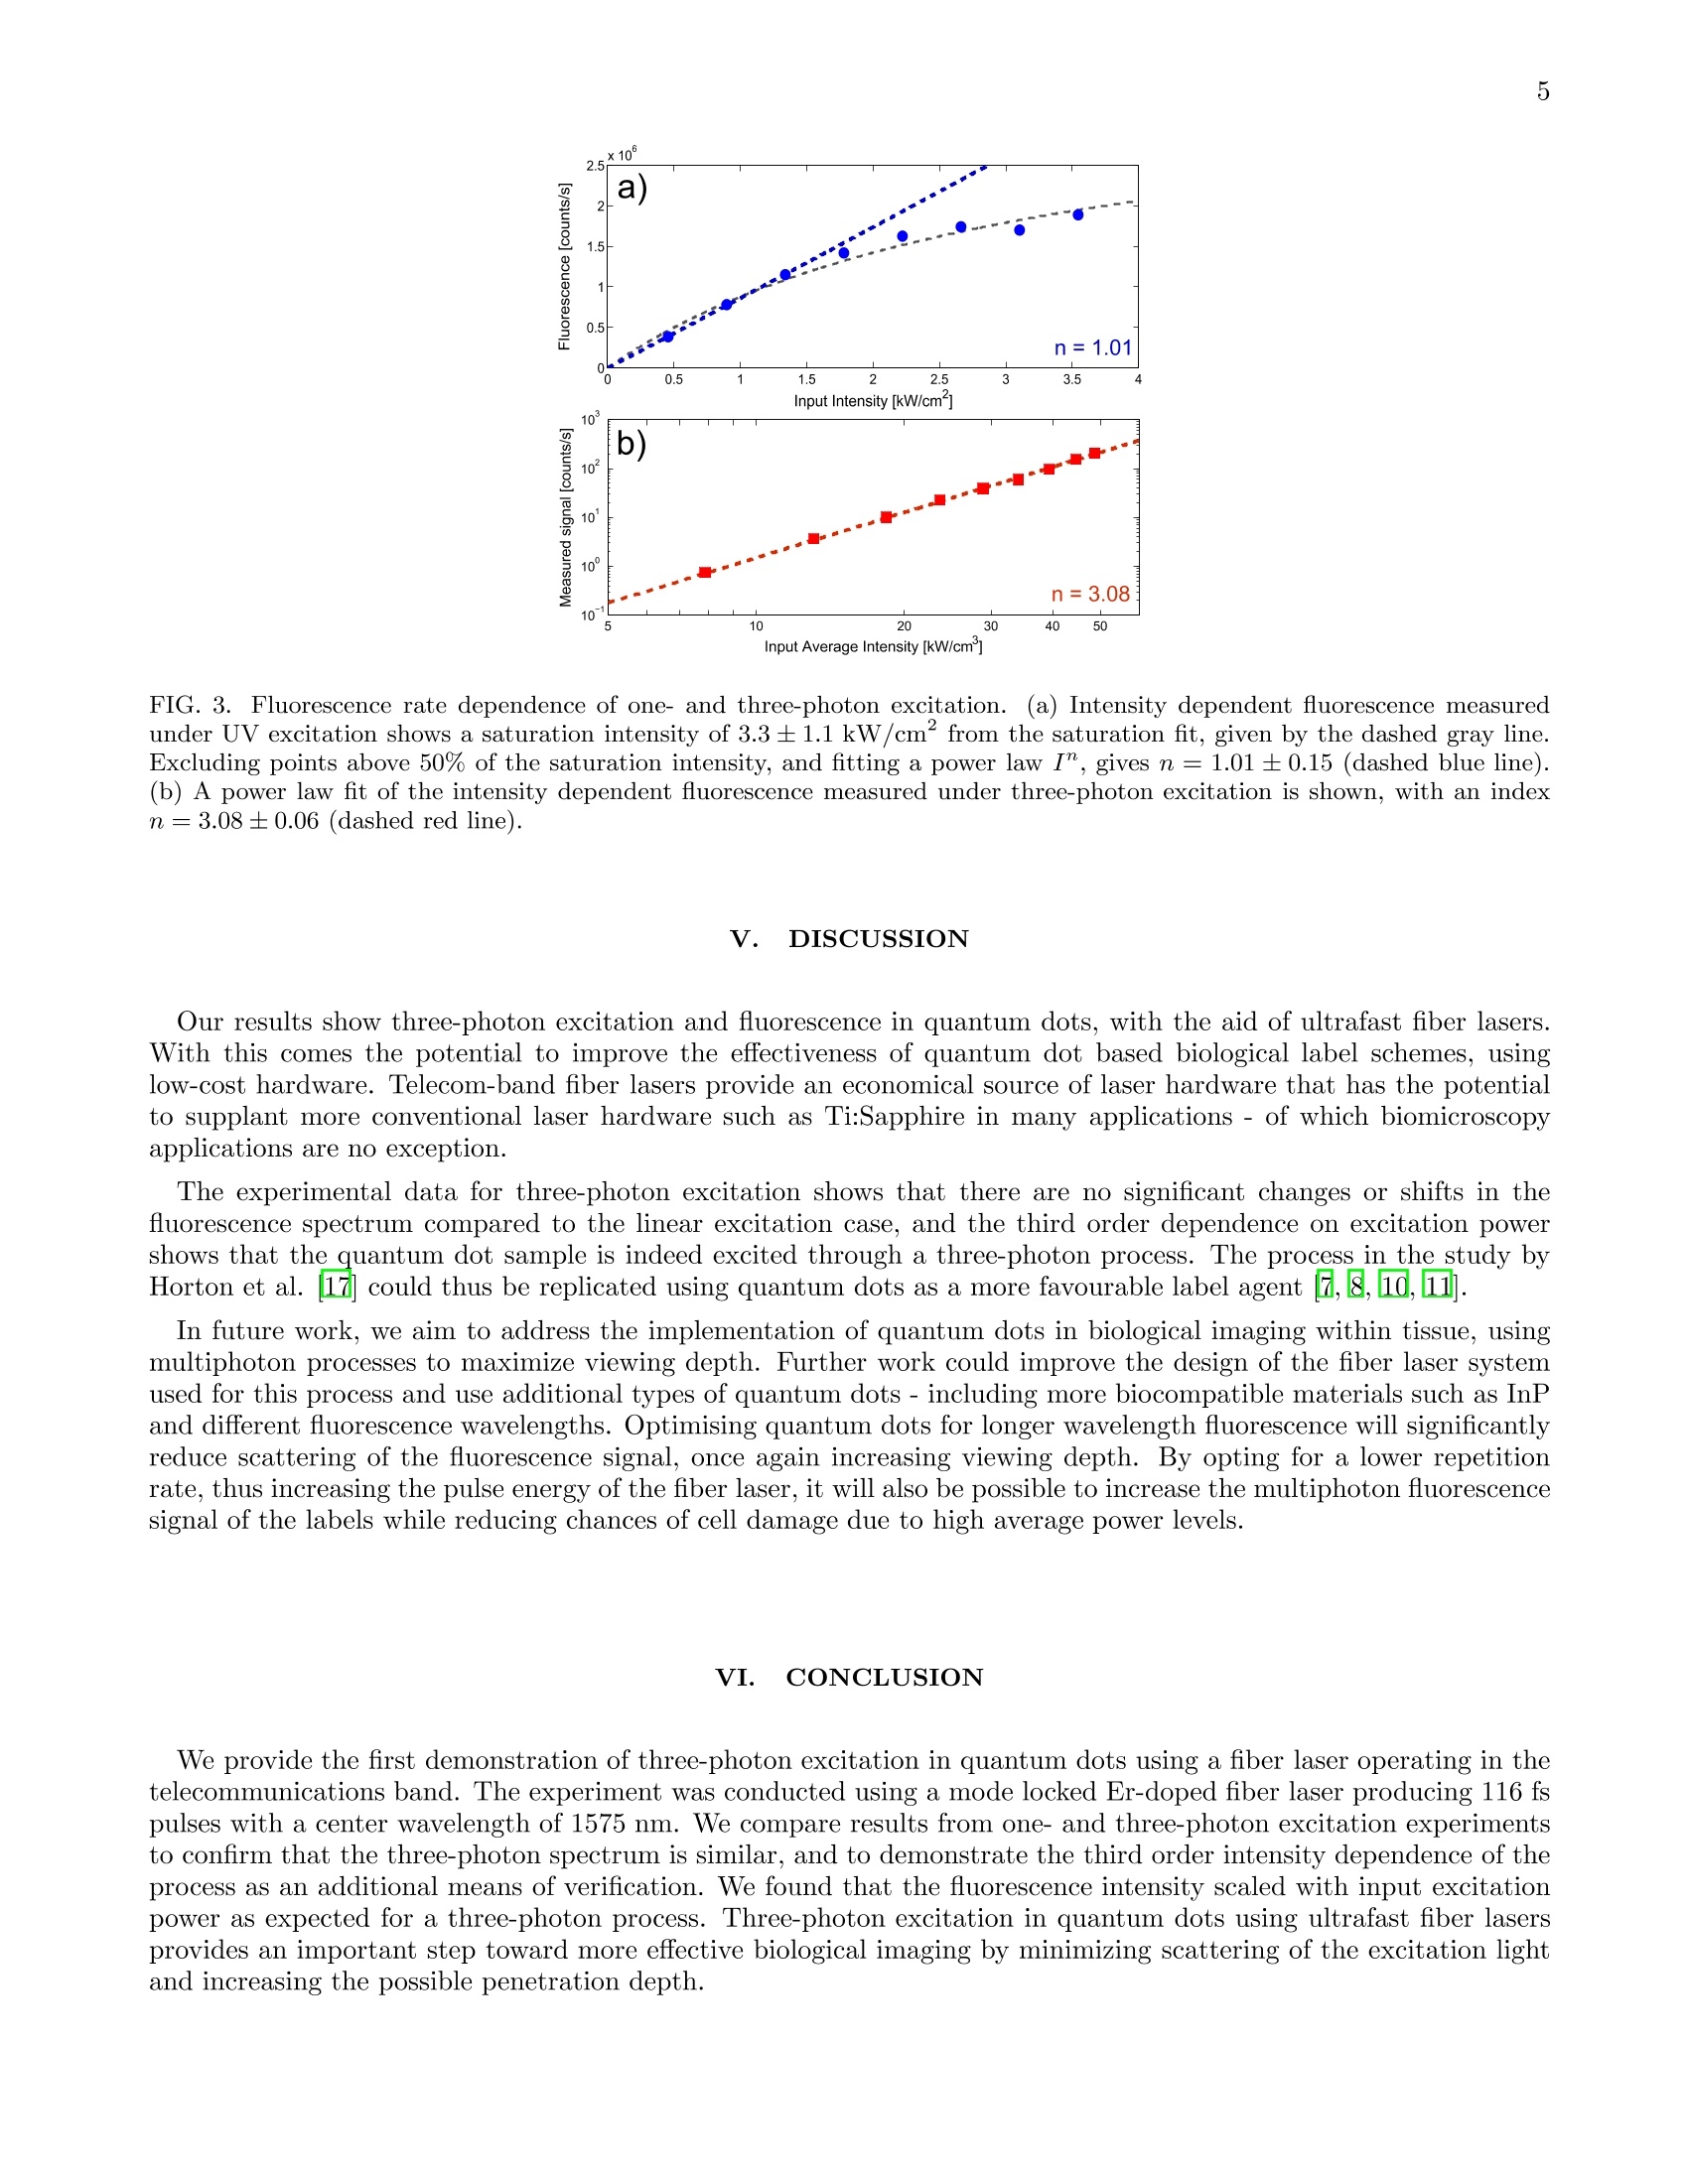
3 5 m.petrasiunas@griffith.edu.au Three-photon excitation of quantum dots with a telecom band ultrafast fiber laser M.J. Petrasiunas.J.B.O. Wood, D. Kielpinski, and E.W. Streed Centre for Quantum Dynamics, Griffith University 170 Kessels Road, Nathan, Queensland 4111, Australia (Dated: February 7, 2014) We demonstrate three-photon excitation in quantum dots with a mode-locked fiber laser operatingin the telecommunications band. We compare spectra and intensity dependence of fluorescence fromone-and three-photon excitation of commercially available 640 nm quantum dots, using a 372 nmdiode laser for one-photon excitation and 116 fs pulses from a mode-locked fiber laser with a centerwavelength of 1575 nm for three-photon excitation. 1. INTRODUCTION Quantum dots are semiconductor nanocrystals, 1-20 nm in size 1,, that possess a discrete energy level structure.The level structure is determined by the size, composition and shape of the quantum dotlot 31. Particular focushas been placed on II-VI semiconductors, such as CdSe1. By selecting for size, the fluorescence emission can betailored to the application, which is attractive for use in biological labels 5 8]. In addition, the quantum dot surfacecan be chemically functionalized to bind to specific biomolecules. Compared to other fluorescent molecules, quantumdots possess high brightness, low bleaching rate and absorption over a wide wavelength rangeBj. Similar to thefluorescence from other labels, quantum dot fluorescence can be driven by both single- and multiphoton processesg 13. Fluorescent labels are conventionally excited by short wavelength light to produce fluorescence emissions. Ultraviolet(UV) light is often used with quantum dots due to their absorption that increases towards shorter wavelengths8However UV is not ideal for use in living cells, due to strong absorption and scattering of UV light by surroundingbiological tissueT.he use of shorter wavelengths leads to a higher potential for photochemical reactions and anincreased possibility for the decomposition and subsequent release of component heavy metals, such as cadmium (Cd)14,15]. Through excitation by multiphoton processes, it is possible to avoid the unwanted effects from exposure toshorter wavelengths in biological applications. Two-photon excitation of quantum dots is now routinely performed,often using Ti:sapphire lasers operating around 700-1000 nm [306]. For imaging applications, it is often important for the excitation light to penetrate far into the sample, but thepenetration depth is limited by Rayleigh scattering due to the effect on beam quality. Since Rayleigh scatteringscales as X-4, long-wavelength multiphoton excitation seems promising for bioimaging applications. In a recent study,Horton et al. demonstrated in-vivo three-photon microscopy with an Er-doped fiber system and red fluorescentprotein labels. They found that an optimum wavelength window due to scattering and absorption in tissue lies close tothe telecom band. Quantum dots are attractive for use in such applications due to their large three-photon absorptioncross-section ]. We demonstrate three-photon excitation and fluorescence in commercially available CdSe quantum dots usinga custom built mode-locked Er-doped fiber laser (EDFL). Such lasers, and their associated optical components, arecentral to telecommunications and have therefore been the subject of extensive industrial research. These developmentsmean that they provide a stable, versatile and comparatively inexpensive method to generate ultrashort pulses forthree-photon spectroscopy of quantum dots. We also excited single-photon fluorescence using a 372 nm diode laserto compare one- and three-photon fluorescence emission spectra, excitation intensity dependence and bleaching rate.Previous investigations have also demonstrated two- and three-photon excitation in quantum dots,13. However,to our knowledge, multiphoton excitation and absorption have not yet been investigated in quantum dots for excitationwavelengths in the telecom band. The wavelength of expected fluorescence emissions from the sample is determined by the quantum dot energylevel structure, which can be simplified to a ground state, fluorescent excited state and a continuum of absorptionstates18,19]. Upon excitation to this continuum of states, a quantum dot undergoes a non-radiative decay tothe excited state, followed by fluorescent decay back to the ground state[18]. In addition, intense excitation pulseswill interact nonlinearly with the sample to generate harmonics of the excitation wavelength. In quantum dots, thethird-harmonic generation (3HG) process is expected to be the most significant of these [20]. The process of secondharmonic generation (SHG) is negligible in comparison to 3HG due to the centrosymmetric crystal structure of CdSe21, 22. As the product of a coherent process, the harmonics are emitted in line with the excitation beam. II. METHOD Figure shows the experimental setup used to probe the quantum dots.. Colloidal InvitrogenTM LumidotTMCdSe/ZnS 640 core-shell quantum dots, with a nominal fluorescence wavelength of 640 nm, were deposited on asample slide. The toluene solvent was evaporated off, leaving a static quantum dot sample which was placed at thefocus of the excitation beam. Collected fluorescence was coupled into a multimode fiber, where the spectrum wasmeasured by a fiber-coupled spectrometer. For the three-photon spectroscopy of the quantum dot sample, a mode-locked EDFL was used to produce 1564nm pulses at a repetition rate of 300 MHz. 116 fs pulses with a maximum average power of 186 mW were producedthrough Er-doped fiber amplification and soliton compression. The laser was focused to a spot with a 14.1±0.2um1/e radius, yielding an average intensity up to 48.8±0.5 kW/cm. The soliton self-frequency shift (SSFS) 23,24of the amplified pulses shifted the center wavelength to 1575 nm, increasing the spectral bandwidth to 85 nm. Thepulse durations were measured by frequency resolved optical gating (FROG) using a MesaPhotonics FROGScan with FIG.1. Experimental Setup. Schematic for spectroscopy of quantum dots. (a) 372 nm light is focused onto the quantum dotsample and fluorescence is collected and coupled into a multimode fiber. Fluorescence is separated from residual excitation lightusing a Semrock FF511-Di01 dichroic mirror. (b) 1575 nm pulses are focused onto the quantum dot sample and fluorescence iscollected off-axis to avoid excessive coupling of third harmonic (3HG) light. The majority of residual excitation and 3HG lightcontinues to propagate on-axis past the slide and is not coupled into the multimode fiber (MMF). As some scattered light isstill collected, KG3 coloured glass filters are used to block any remaining IR. an Ocean Optics HR2000+ spectrometer, and a wavelength range of 700-881 nm. The spectrum was measured usinga HP 70950A optical spectrum analyser. The resulting fluorescence emitted from the quantum dots was collected off-axis with a 35 mm focal length lens tospatially separate it from the large amount of light produced by 3HG. However, some of the 3HG and excitation lightwas scattered by the sample and collected. The fiber-coupled fluorescence was detected by an Ocean Optics USB650spectrometer. Three 2 mm thick KG3 coloured-glass filters were used to block any remaining IR, with a calculatedattenuation of -80 dB, in order to prevent damage to the detector. The fluorescence detection spectrometer was used to capture all data for the fluorescence and 3HG spectra, andits dependence on the intensity of the excitation beam and exposure time. Measurements of the spectra were takenfor different input intensities using a variable ND filter, and integration times from 5-30 s were used. The relativespectrum amplitudes were inferred from Gaussian fit profiles of the spectra. To check that the quantum dots behaved as expected under UV excitation, we applied up to 3.5 mW of 372 nmlight from a fiber-coupled Nichia diode laser to the quantum dot sample. Basic optical isolation was employed,usinga quarter waveplate and linear polariser, to ensure that the operation of the diode laser was not compromised byoptical feedback from the single mode fiber. The UV light was focused to a spot with a 5.6 um 1/e radius at thequantum dot sample, with a maximum intensity of 3.54 kW/cm . The fluorescence excited by the UV laser was collected by an NA = 0.60 aspheric lens with a 4.02 mm focallength. This was separated from the residual excitation light by a Semrock FF511-Di01 dichroic mirror, with anedge wavelength of 511 nm, and coupled into MMF. An Ocean Optics QE65000 spectrometer, with a 316-1021 nmwavelength range and 0.22 nm/pixel resolution, was used to measure the spectrum of the UV-induced fluorescence.Measurements were taken with varying input intensities and an integration time of 10 ms. III. SPECTRA Figure 2 shows the spectra from UV and IR excitation. From a Gaussian fit of the fluorescence spectra, the centerwavelength from linear excitation is 632.6 ±0.1 nm, where it is 631.4±0.2 nm in the spectrum produced by three-photon excitation. The FWHM linewidths are determined to be 47.8±0.1 nm and 40.7±0.4 nm, respectively. Thenear-identical characteristics of the fluorescence spectra under UV and IR excitation indicate that the same excitedenergy band is reached in both cases. In the three-photon excitation spectrum, the secondary peak at 534.8±0.1 nm corresponds with the third harmonicof the IR excitation pulse. The peak is visible in the off-axis configuration due to scattering from the quantum dotsample. As shown in Figure2tthe third harmonic is generated predominantly from the red-shifted soliton at thelong-wavelength end of the excitation pulse spectrum. This part of the excitation spectrum, according to FROG trace FIG. 2. Comparison of spectra from (a) 入=372 nm excitation and (b) 入=1575 nm excitation, shown with the energy levelstructures and excitation pathways. In (b), both the 640 nm fluorescence peak and a 540 nm 3HG peak are observed. (c)Spectrum of IR excitation beam on a linear scale, where the wavelength axis aligns at a ratio of 3:1 to that of (b), showingthe correlation of the 3HG peak with the fundamental. (d) FROG trace of IR pulse, where the wavelength axis refers to thesecond harmonic of the excitation wavelength. measurements, corresponds to the most intense part of the excitation pulse. As a static sample of quantum dots were used for this experiment, the time dependent spectra were also observedin each case, using an integration time of 500 ms over 10 minutes, to compare bleaching rates of the linear and three-photon excitation processes. We observed that although a higher excitation intensity was used for the three-photonprocess, the emission signal of the quantum dots was bleached to 50% of the starting intensity after 566 s, comparedto 103 s under linear excitation. However the bleaching of the sample under IR excitation was not fit well by theexpected double-exponential profile, suggesting that it may not follow a conventional bleaching mechanism. Furtherstudy is needed to properly assess the meaning of these preliminary observations. IV.. IINTENSITY DEPENDENCE To verify the photon orders of the two excitation processes and search for saturation of the excitation, we measuredthe dependence of the fluorescence on excitation intensity, as shown in Figure B.The fluorescence spectra for boththe one- and three-photon measurements, taken at varying excitation intensities, were fit with Gaussian profiles. Theamplitudes of the fit profiles were compared using power law fits, as shown in Figure B,.in order to determine aF x I" power law dependence between excitation intensity I and fluorescence counts F, for each of the processes.First- and third-order dependencies are expected for the one- and three-photon processes, respectively. Saturation ofthe quantum dots is observed under UV excitation, with saturation intensity Isat=3.3±1.1 kW/cm, found using afit of the form: By excluding data points greater than 50% of the saturation intensity found for the UV excitation data, the index ofthe UV intensity dependence was found to be 1.01±0.15. The index for the IR induced fluorescence was 3.08±0.06,confirming three-photon behaviour. Third harmonic intensity was also found to exhibit cubic behaviour. As such, thefluorescence under IR excitation could either occur via a direct three-photon mechanism or via absorption of a thirdharmonic photon. This experiment does not distinguish between the two mechanisms. FIG. 3. Fluorescence rate dependence of one- and three-photon excitation. (a) Intensity dependent fluorescence measuredunder UV excitation shows a saturation intensity of 3.3±1.1 kW/cmfrom the saturation fit, given by the dashed gray line.Excluding points above 50% of the saturation intensity, and fitting a power law I", gives n = 1.01±0.15 (dashed blue line).(b) A power law fit of the intensity dependent fluorescence measured under three-photon excitation is shown, with an indexn = 3.08±0.06 (dashed red line). .DISCUSSION Our results show three-photon excitation and fluorescence in quantum dots, with the aid of ultrafast fiber lasers.With this comes the potential to improve the effectiveness of quantum dot based biological label schemes, usinglow-cost hardware. Telecom-band fiber lasers provide an economical source of laser hardware that has thepotentialto supplant more conventional laser hardware such as Ti:Sapphire in many applications - of which biomicroscopyapplications are no exception. The experimental data for three-photon excitation shows that there are no significant changes or shifts in thefluorescence spectrum compared to the linear excitation case, and the third order dependence on excitation powershows that the quantum dot sample is indeed excited through a three-photon process. The process in the study byHorton et al. could thus be replicated using quantum dots as a more favourable label agentt2,8,. In future work, we aim to address the implementation of quantum dots in biological imaging within tissue, usingmultiphoton processes to maximize viewing depth. Further work could improve the design of the fiber laser systemused for this process and use additional types of quantum dots - including more biocompatible materials such as InPand different fluorescence wavelengths. Optimising quantum dots for longer wavelength fluorescence will significantlyreduce scattering of the fluorescence signal, once again increasing viewing depth. By opting for a lower repetitionrate, thus increasing the pulse energy of the fiber laser, it will also be possible to increase the multiphoton fluorescencesignal of the labels while reducing chances ofcell damage due to high average power levels. VI..(CONCLUSION We provide the first demonstration of three-photon excitation in quantum dots using a fiber laser operating in thetelecommunications band. The experiment was conducted using a mode locked Er-doped fiber laser producing 116 fspulses with a center wavelength of 1575 nm. We compare results from one- and three-photon excitation experimentsto confirm that the three-photon spectrum is similar, and to demonstrate the third order intensity dependence of theprocess as an additional means of verification. We found that the :hrfluorescence intensity scaled with input excitationpower as expected for a three-photon process. Three-photon excitation in quantum dots using ultrafast fiber lasersprovides an important step toward more effective biological imaging by minimizing scattering of the excitation lightand increasing the possible penetration depth. ACKNOWLEDGMENTS D.K. was supported by an Australian Research Council Future Fellowship (FT110100513).We would like toacknowledge Prof. Jay L. Nadeau of McGill University for sparking our interest in the area. ( [1] C. B . Murray, D. J . Norris , an d M. G . Bawendi, “ Synthesis and characterization of nearl y monodisperse CdE (E= sulfur,selenium, tellurium) semiconductor nanocrystallites," J J. Am.Chem. Soc. 115, 8706-8715 (1993) ) ( [2 ] J . M. Pietryga, R. D. Schaller, D . Werder, M. H. Stewart, V.I. Klimov, and J. A . Hollingsworth,“Pushing the band gapenvelope: mid-infrared emitting colloidal PbSe quantum dots." J. Am. Chem. S oc. 1 26,1 1 752-3(2004) ) ( [3 ] S . A . Empedocles , D. J . Norris , and M. G. B awendi, “Photoluminescence Spectroscopy of Single CdSe N anocrystalliteQuantum D o ts." Phys. Rev. Lett. 77, 3873-3876(1996) ) ( 4] D. J . Norris and M. G. Bawendi,“Measurement and assignment of the size-dependent optical spectrum in CdSe quantumdots.”Phys. Rev. B 53, 16338- 1 6346 (1996). ) ( [5] M. Bruchez Jr., M. Moronne, P. Gin, S. Weiss, and A. P. Alivisatos,“Semiconductor Nanocrystals as Fluorescent BiologicalLabels, ” Science 281, 2013-2016(1998) ) ( 6P. Alivisatos, “ The us e of nanocrystals in b io l ogical detection." N at. Biotechnol. 22, 47-52(2004) ) ( 7X. Michalet, F. F. Pinaud, L. A. B entolila, J. M. Tsay, S. Doose, J. J . Li, G. Sundaresan, A. M. Wu, S . S. Gambhir, a n dS. Weiss, “Quantum dots for live cells, in vivo imaging, and diagnostics."Science 307, 538- 44 (2005) ) ( 81U. R esch-Genger, M . G r abolle, S . C a valiere-Jaricot, R. N itschke, and T. Nann,“Quantum dots versus orga n ic dyes asfluorescent labels, ” N at. Methods 5, 763-775 (2008) ) ( 9W. R . Zipfel , R . M. Williams , and W. W. W e bb,“No n linear magic: mu l tiphoton microscopy in th e bi o sciences.”Nat. Biotechnol. 21, 1369-77( 2 003), ) ( [10]S.J. Bentley, C. V. Anderson, a nd J. P. D ooher,“Three-photon absorption for nanosecond excitation in cadmium sele n idequantum dots,”lOpt. Eng. 46, 128003 (2007) ) ( [11 ] A. D. Lad, P. Prem Kiran, G. Ravindra Kumar, and S. Mahamuni,“Three-photon a bsorption in ZnSe and ZnSeZnS quantum dots,” A ppl. Phys. Lett.90, 133113 (2007) ) ( [12] J. W . M. Chon, M. Gu, C . Bullen, a nd P . M ulvaney,“Three-photon excited band ed g e an d trap emission of CdSsemiconductor n anocrystals,” A ppl. Phys. Lett. 84, 4 472( 2 004), ) ( 13 G . S. H e, K .-T. Y ong, Q. Zheng, Y. Sahoo, A. B a ev, A . I . Ryasnyanskiy, a n d P. N. Prasad,“Mu l ti-photon excitation prop- ) ( erties of CdSe quantum dots solutions and optical limiting b e havior in infrared range."Opt. E xpress 15, 12818-33(2007). ) ( [1 4 A. M. Derfus , W. C. W. Chan, a nd S. N. Bh a tia,“Probing the Cytotoxicity 77 o f S e miconductor Q u antum Dots, Nano Le tt. 4 , 1 1 -1 8 (2004 ) ) ( |15| R. Hardman,“A Toxicologic Review of Quantum Dots: Toxicity Depends on Physicochemical and Environmental Factors,”Environ. Health Perspect. 114,165-172 (2006) ) 16|M. Dahan, T.Laurence, F. Pinaud, D. S. Chemla, A. P. Alivisatos, M. Sauer, and S. Weiss,“Time-gated biologicalimaging by use of colloidal quantum dots.”Opt. Lett.26,825-7(2001) |17|N. G. Horton, K. Wang, D. Kobat, C. G. Clark, F. W. Wise, C. B. Schaffer, and C. Xu, “In Vivo Three-Photon Microscopyof Subcortical Structures within an Intact Mouse Brain,”Nat. Photonics 7, 205-209(2013) [18]A. P. Alivisatos,“Perspectives on the Physical Chemistry of Semiconductor Nanocrystals,”J. Phys. Chem. 3654,1322613239 (1996). ( 19 S. M. Reimann and M. Manninen,“Electronic structure of quantum dots,"Rev. Mod. P hys. 7 4, 1283-1342 (2002). ) 20A. K. Dharmadhikari,N. Kumbhojkar, J. A. Dharmadhikari, S. Mahamuni,and R. C. Aiyer,“Studies on third-harmonic generation in chemically grown ZnS quantum dots,”J. Phys.: Condens. Matter 11, 1363-1368 (1999) 21|L. Banyai and S. Koch, Semiconductor Quantum Dots((World Scientific, 1993) p. 244. ( 22 X . F eng, G. X i ong, X . Z h ang, and H. G ao,“Thir d - o rder nonlin e ar optica l susceptibilities associated with inte r subbandtransitions i n CdSe/ZnS coreshell quantum dots, ” Physica B Condens. M atter 3 83, 207-212 (2006) ) ( 23 F. M. M itschke and L. F. M ollenauer,“ D iscovery of t h e soliton self-frequency shift.”Opt. Lett . 11 , 659-61 (1986) ) ( [24] J .P . Gordon,“Theory of the soliton self-frequency shift,”Opt. Lett. 11, 662-664( 1 986)| )
确定
还剩4页未读,是否继续阅读?

产品配置单
广州市固润光电科技有限公司为您提供《激光中激光脉宽检测方案(光学测量仪)》,该方案主要用于其他中理化性能检测,参考标准--,《激光中激光脉宽检测方案(光学测量仪)》用到的仪器有超短脉冲测量仪 FROG(中红外可选)、自相关仪-FR-103
推荐专场


相关方案
更多