


使用非接触式全场的数字图像相关技术研究气凝胶材料的力学特性。测量结果和有限元分析方法的结果做了对比分析。
方案详情

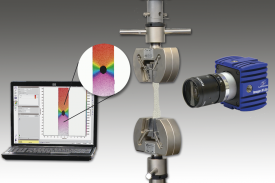
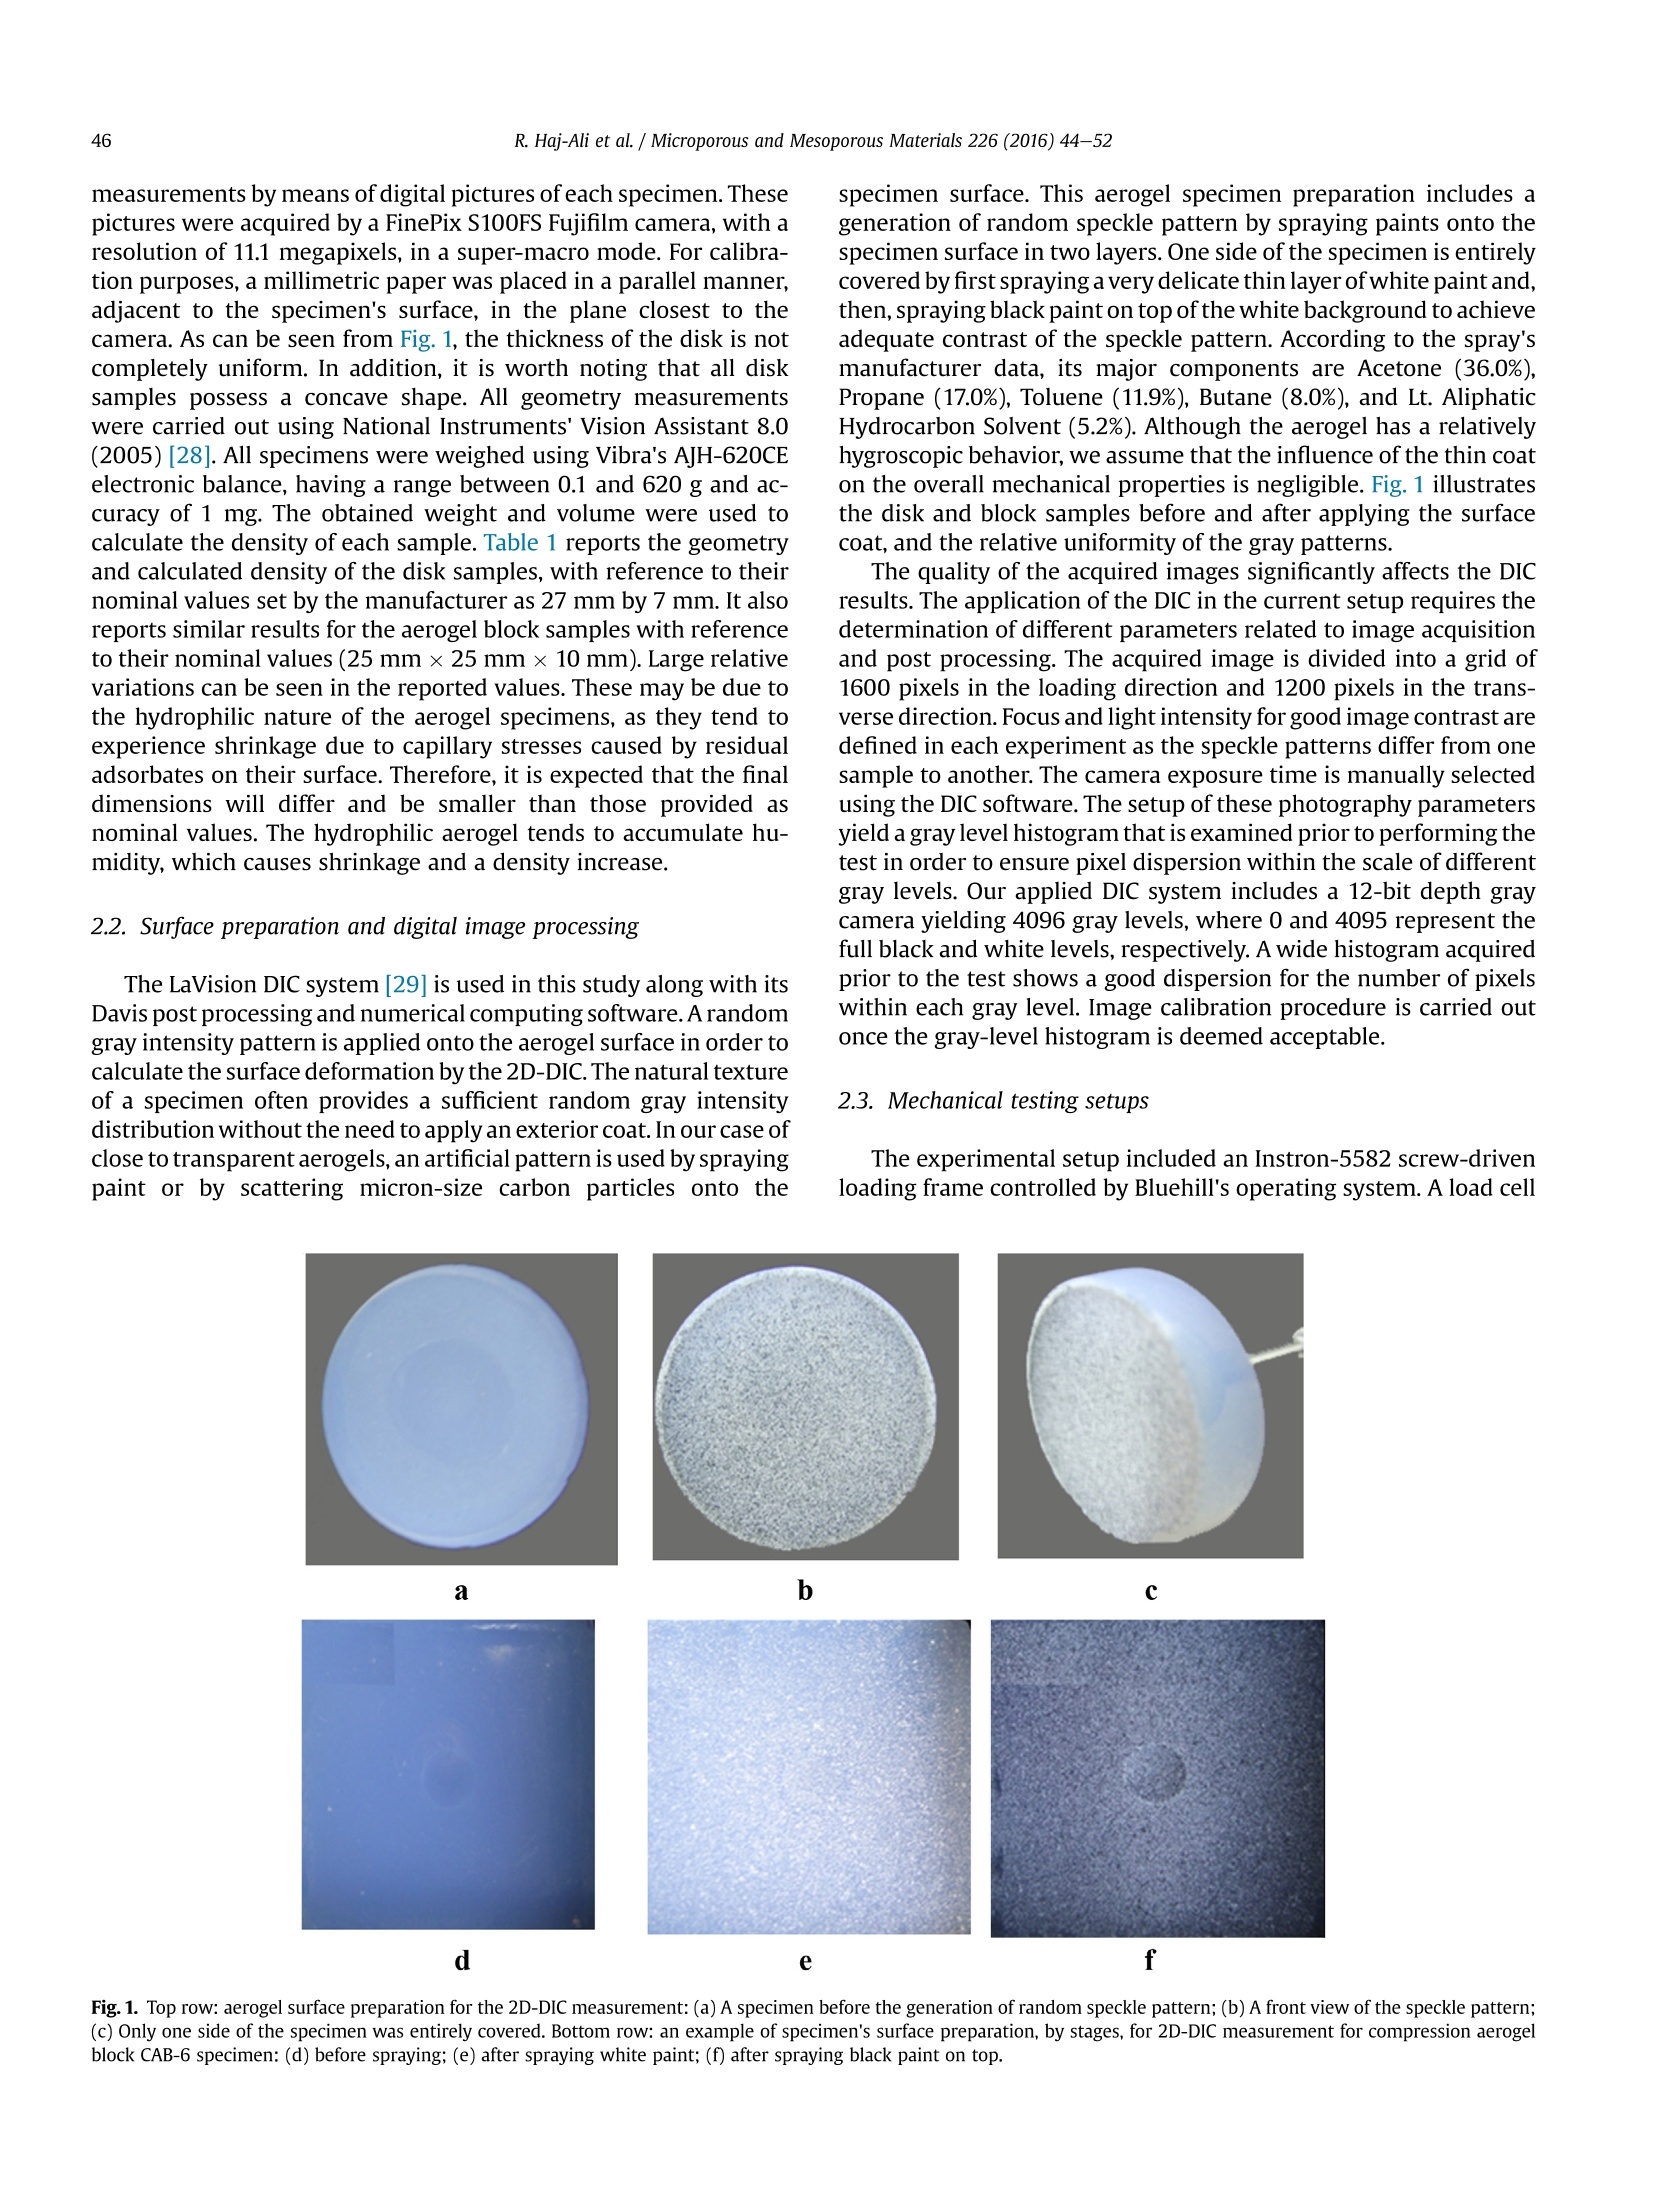
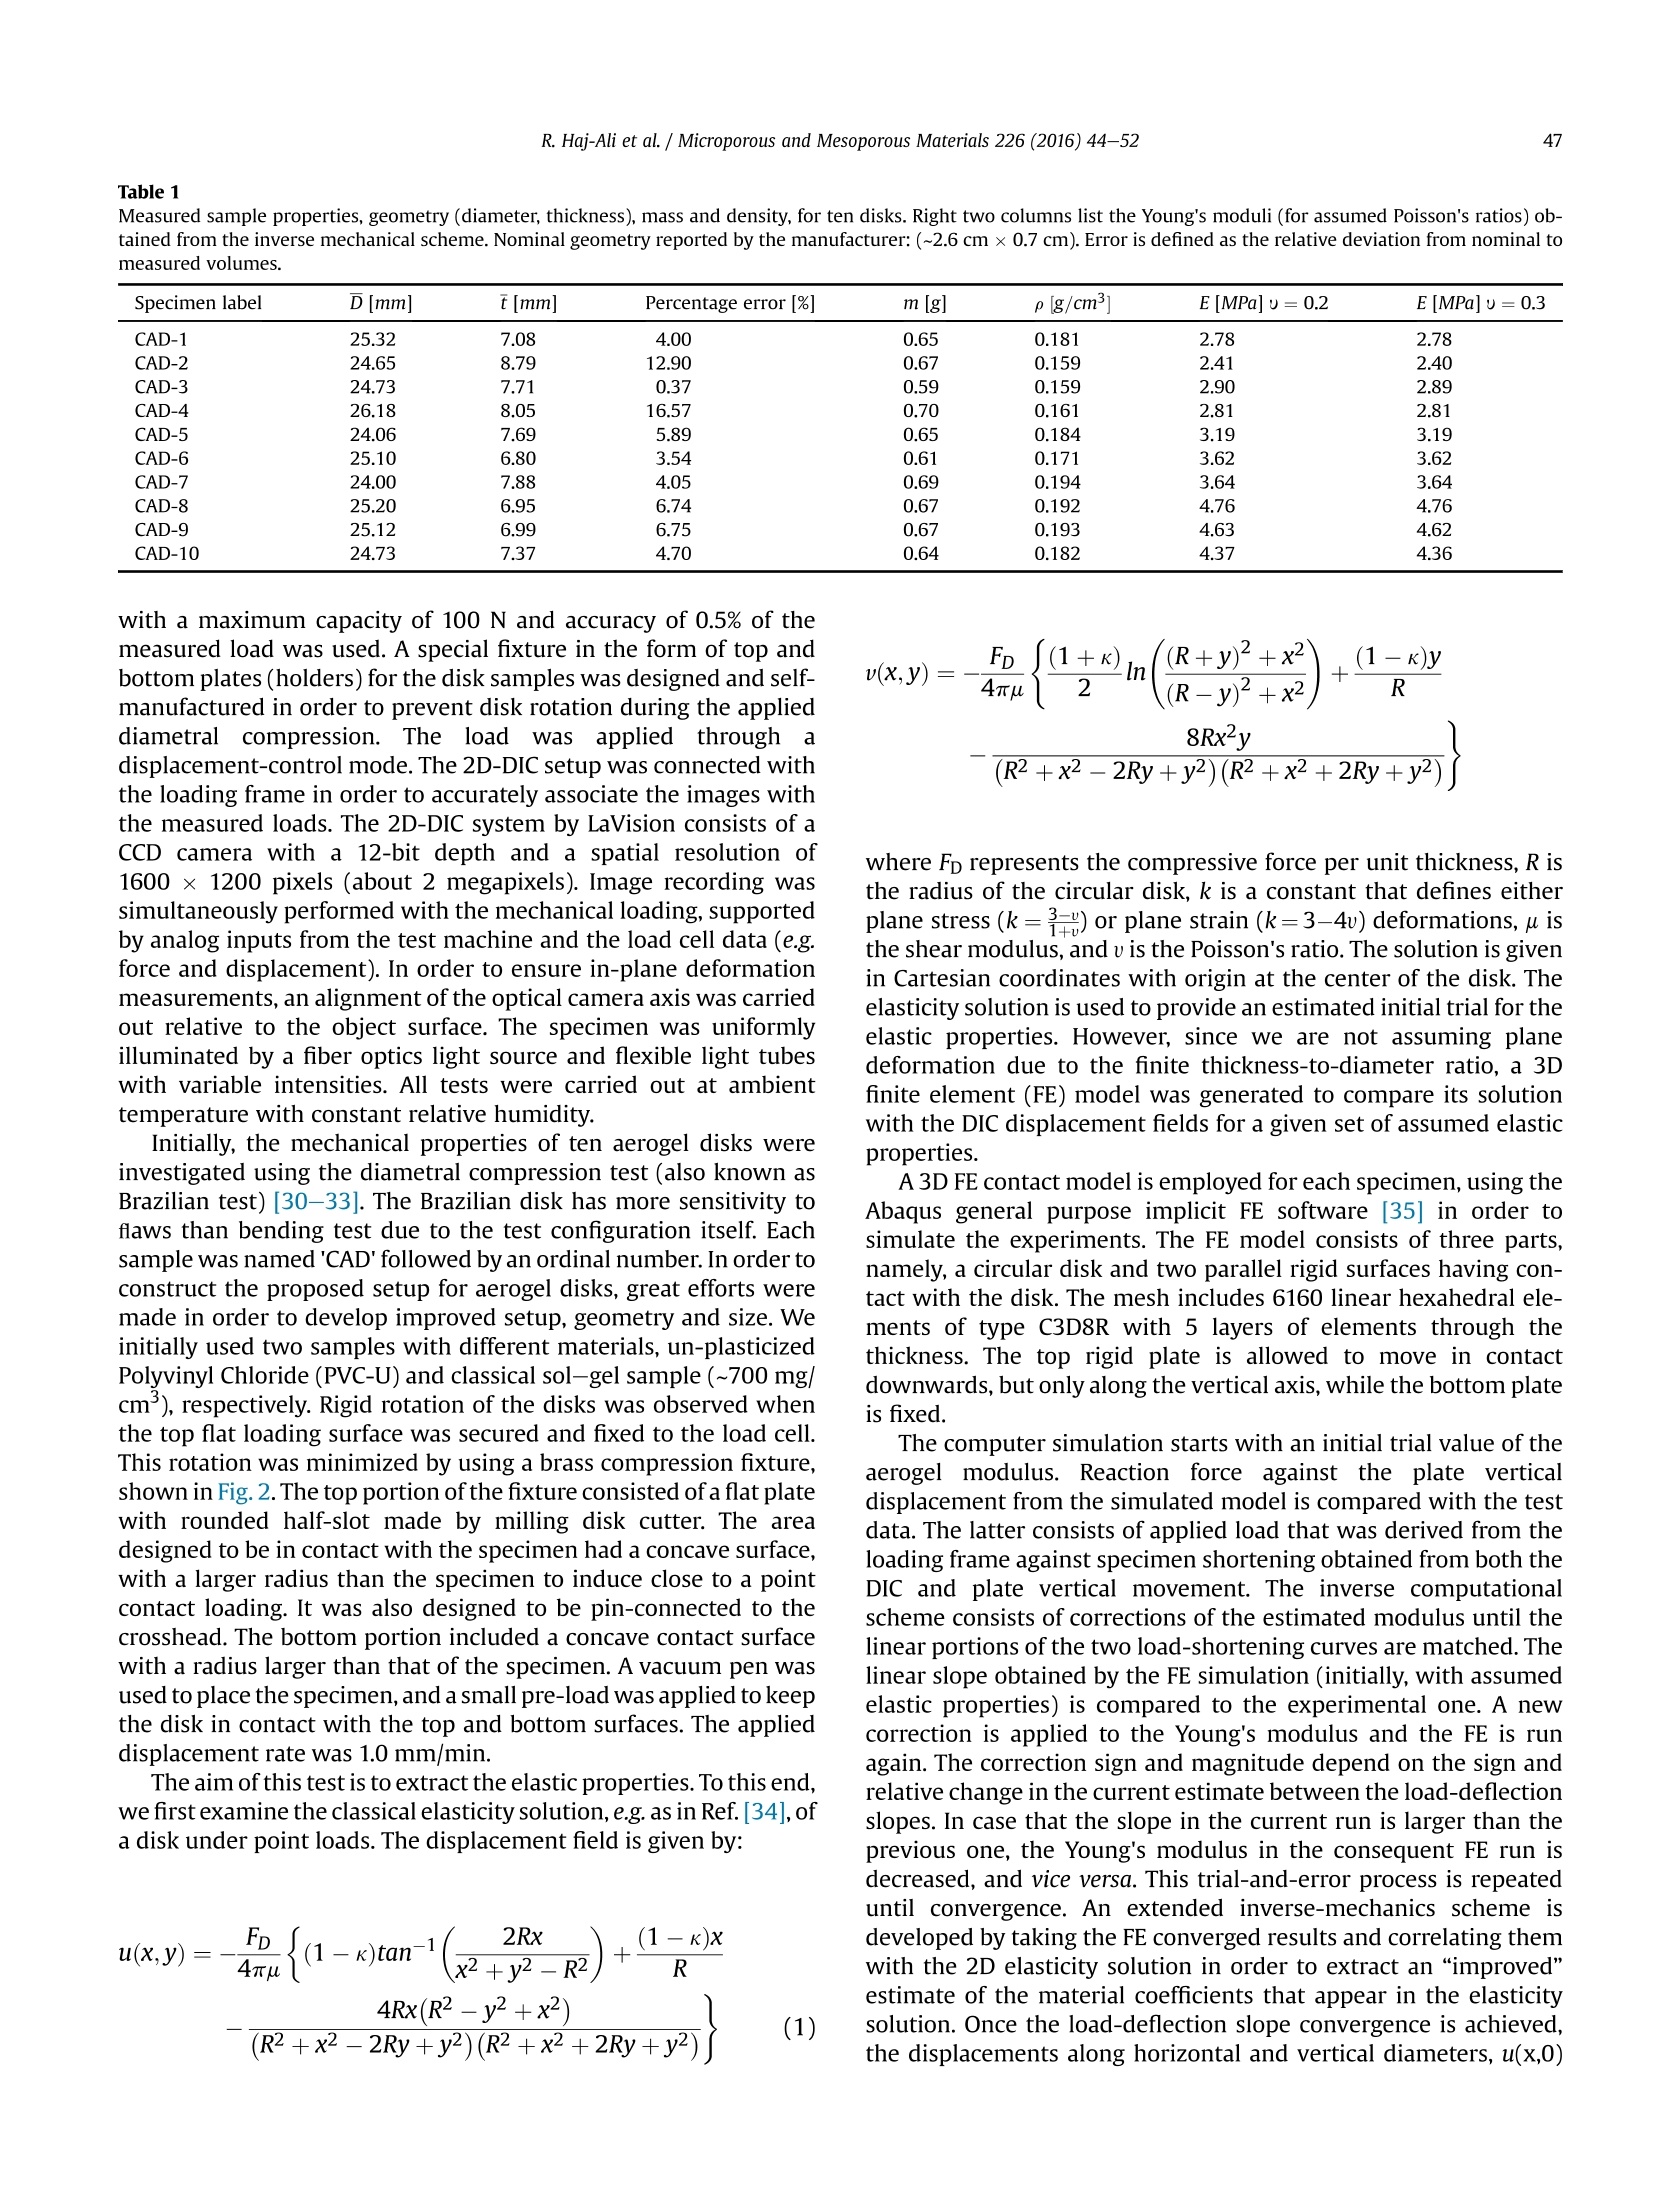
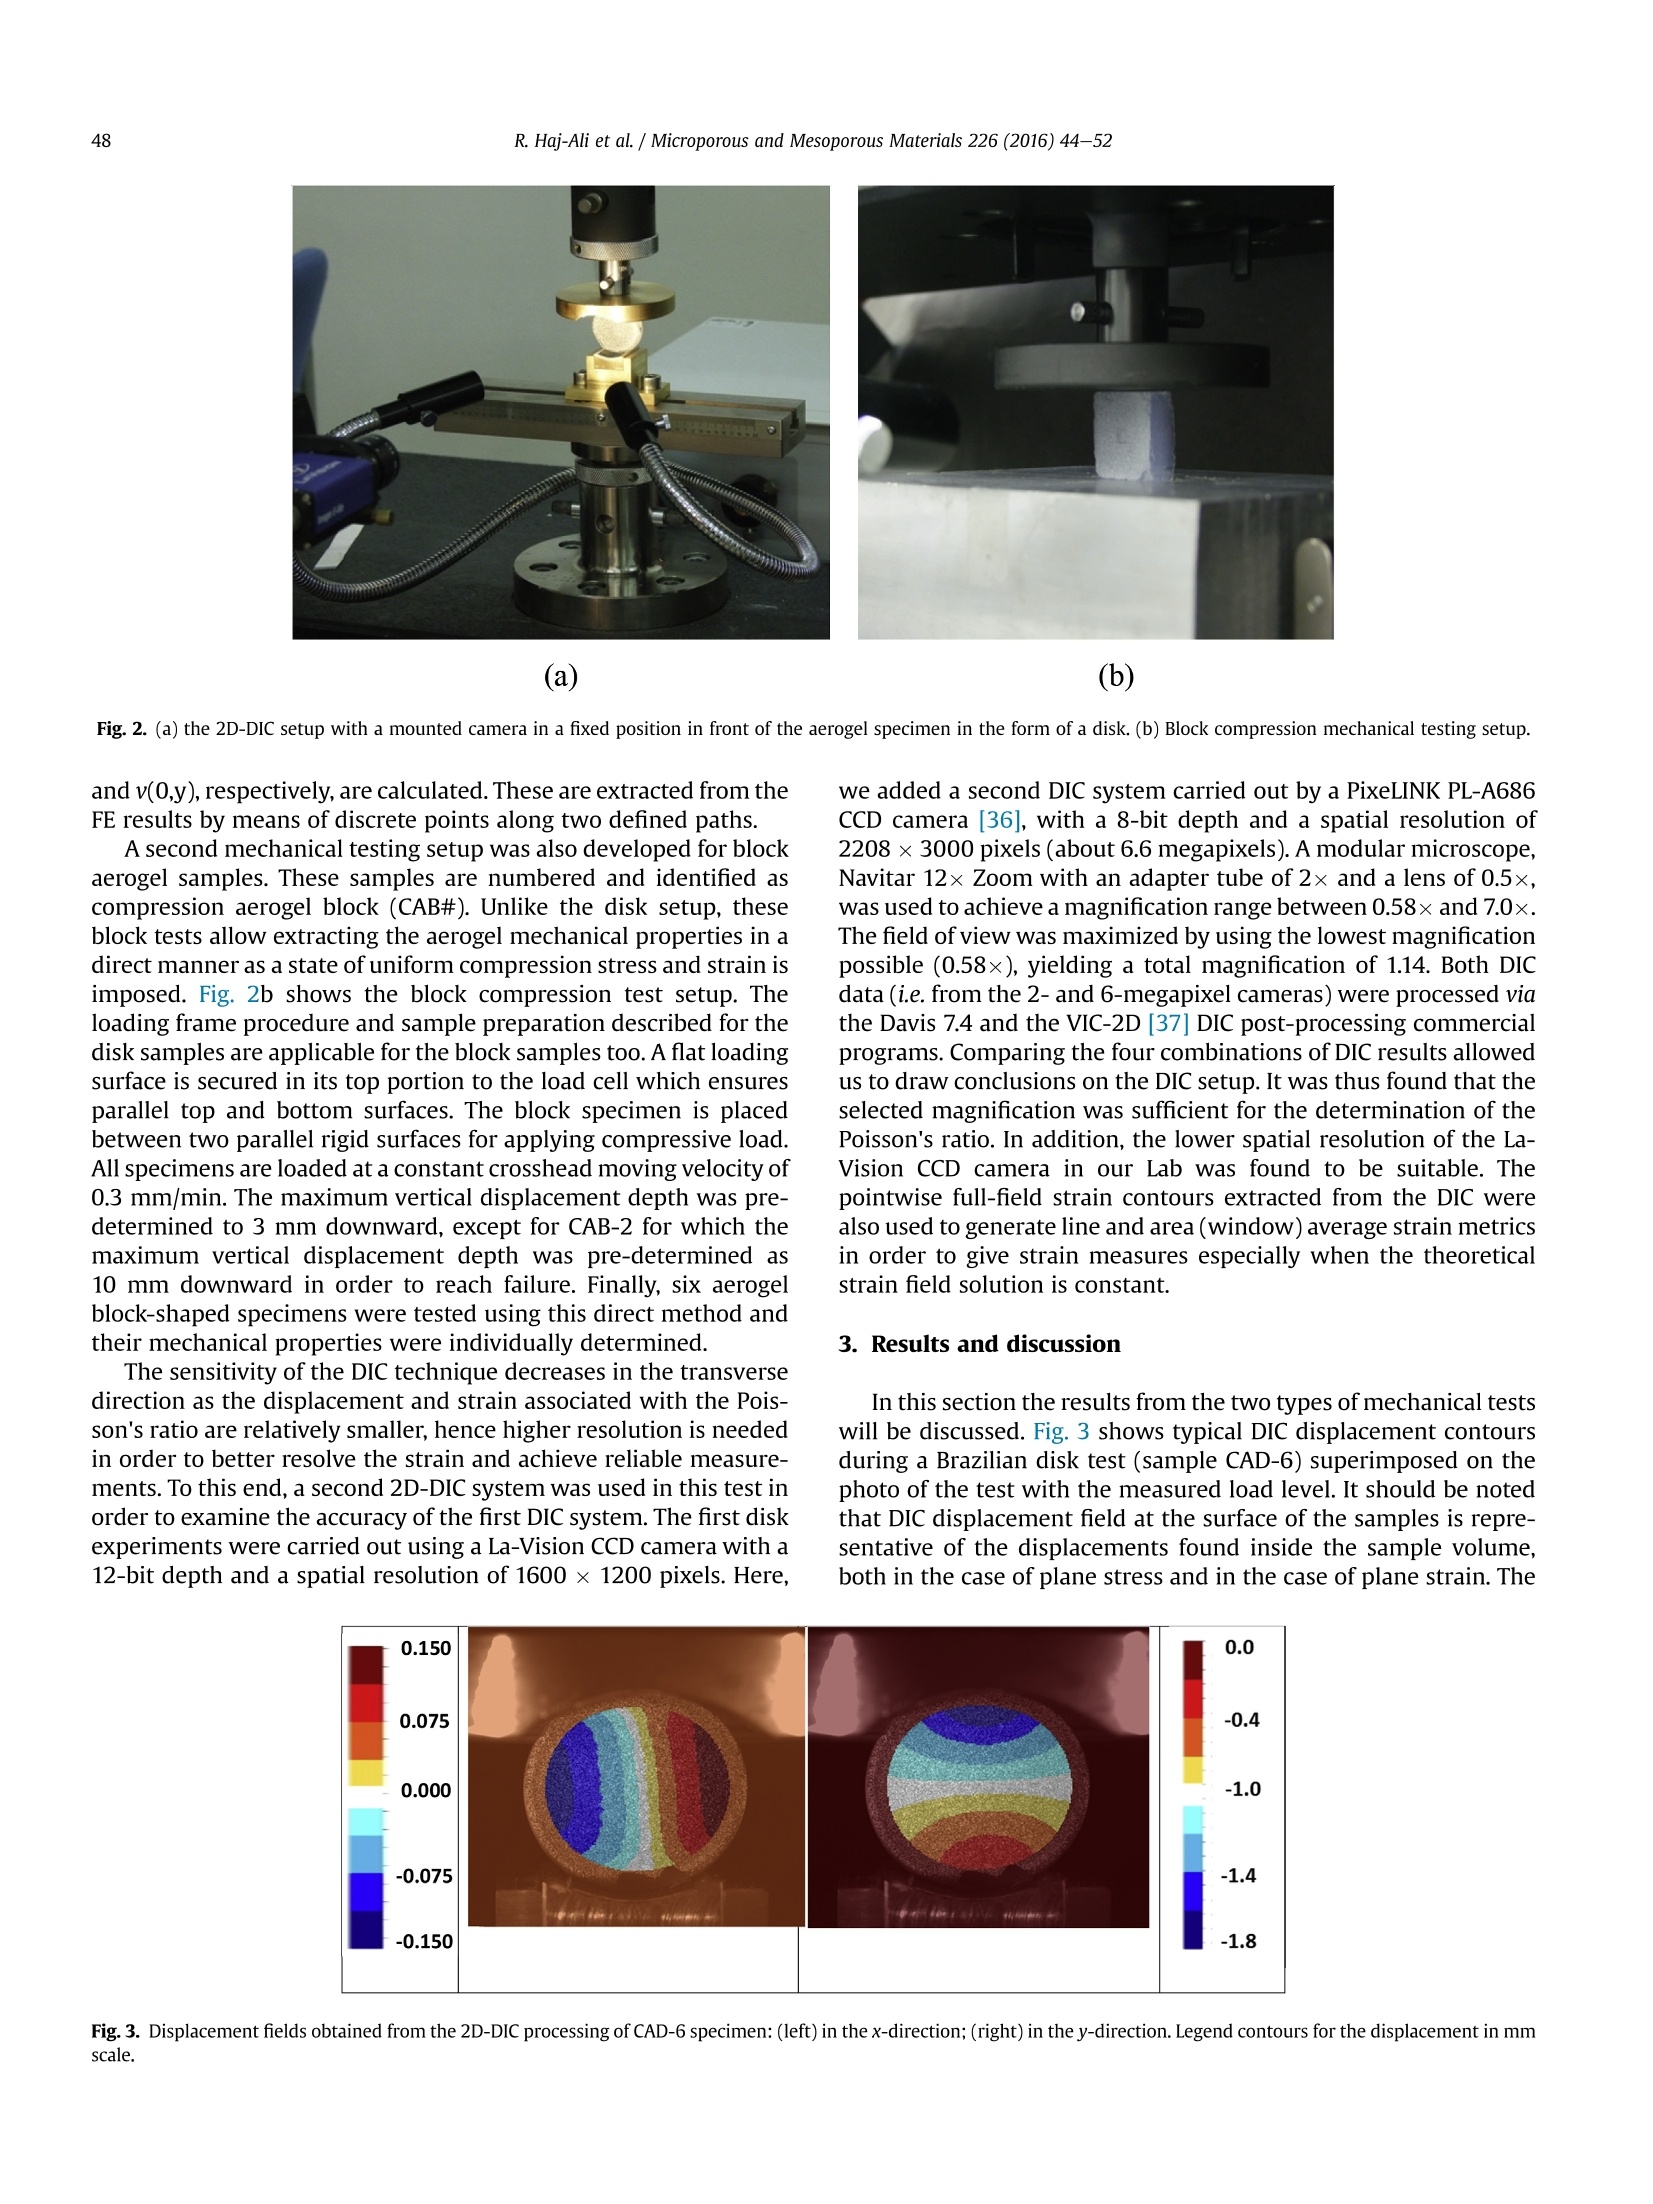
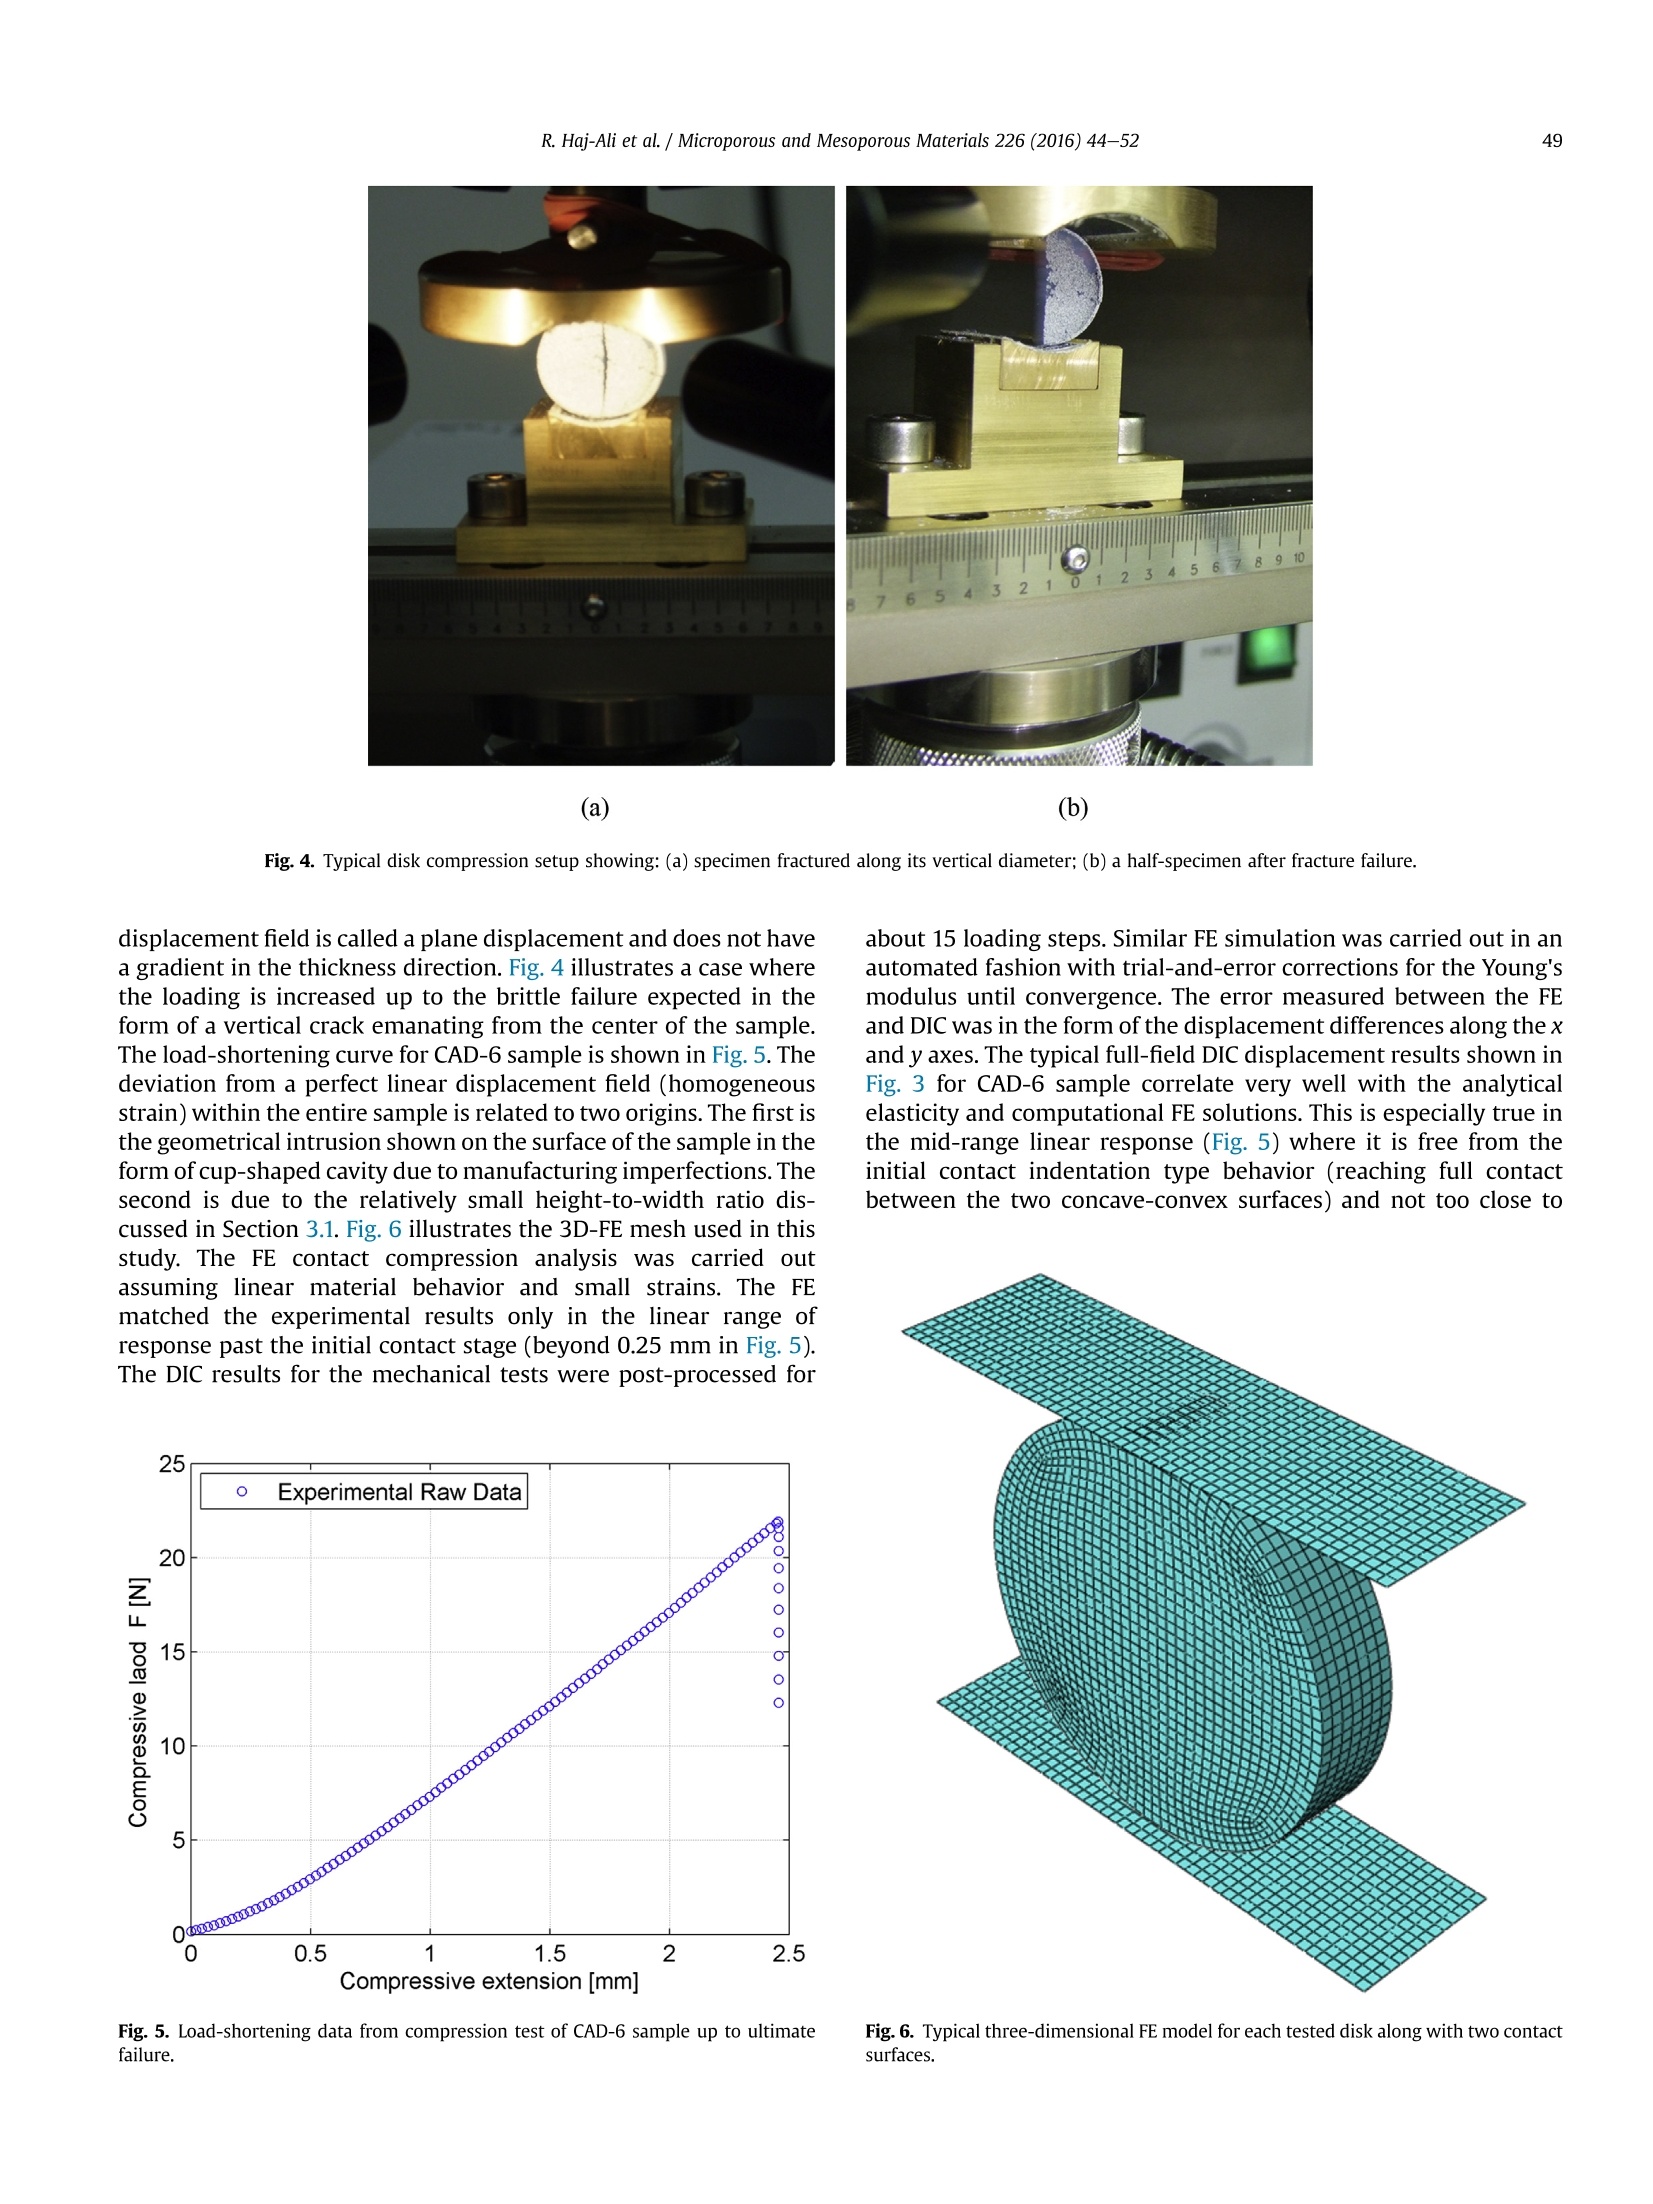
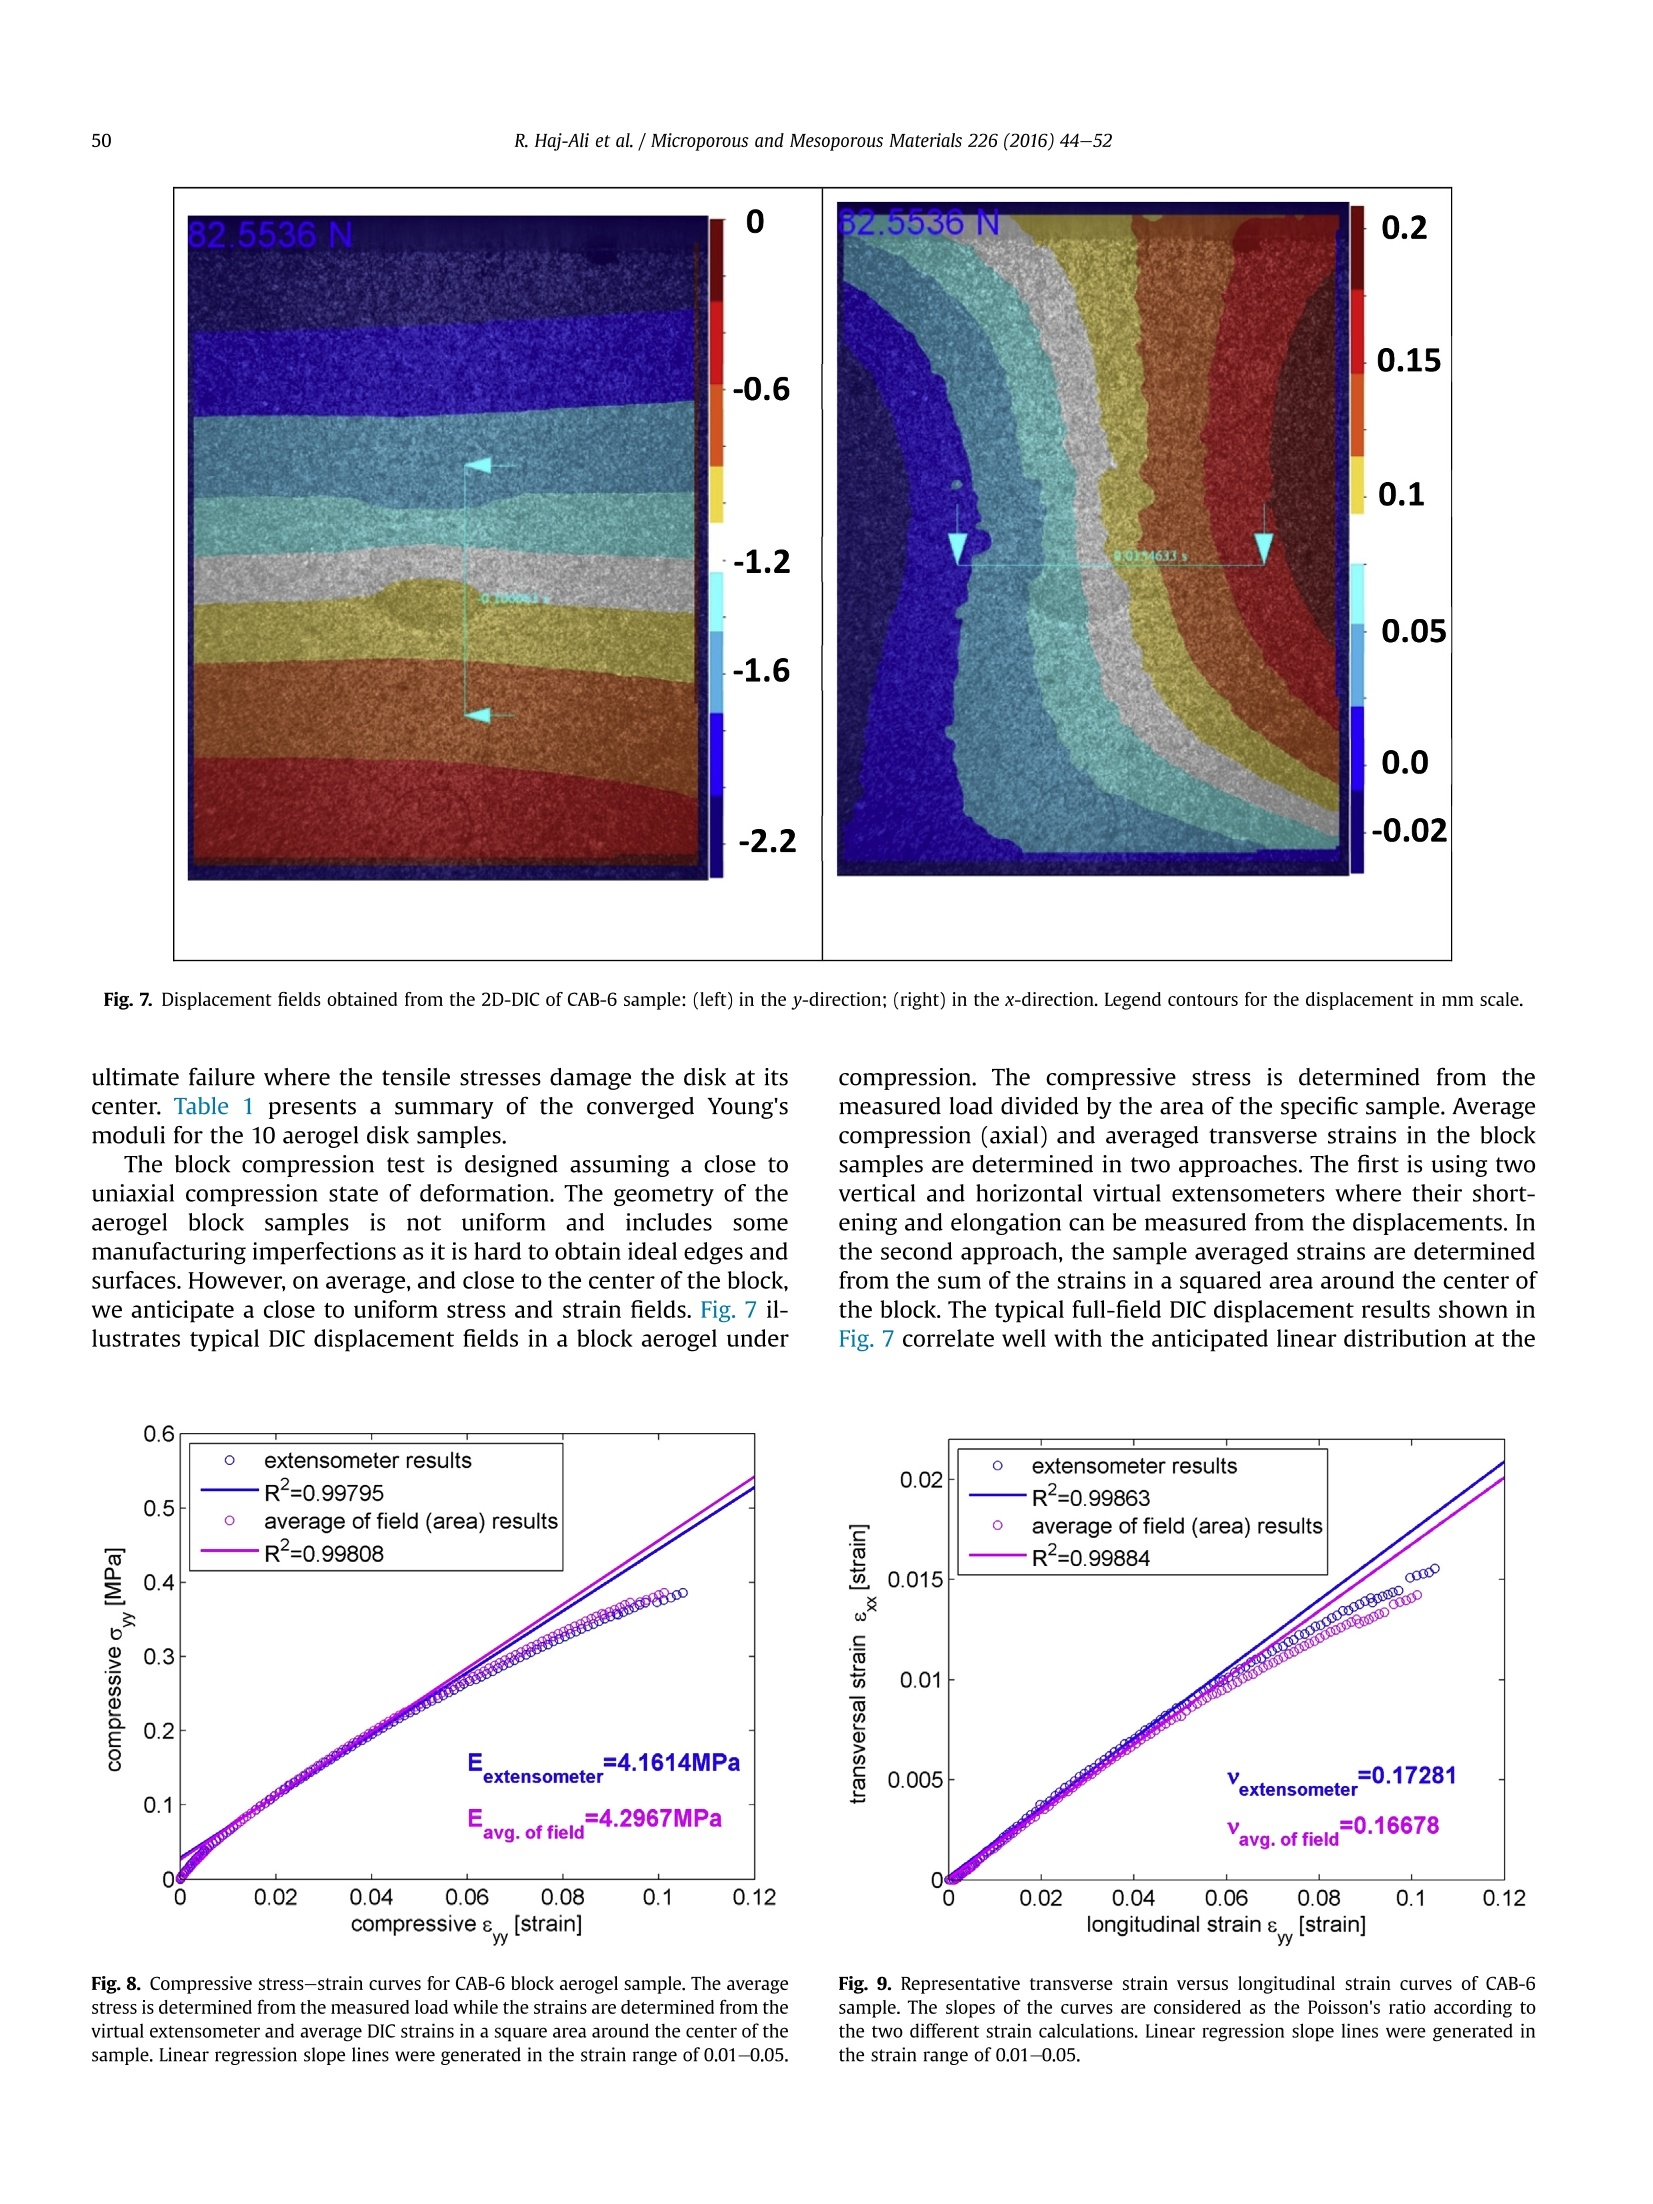
Microporous and Mesoporous Materials 226 (2016)44-52 45R. Haj-Ali et al./ Microporous and Mesoporous Materials 226 (2016) 44-52 Contents lists available at ScienceDirect Microporous and Mesoporous Materials ELSEVIER journal homepage: www.els evier.com/locate/micromeso Mechanical characterization of aerogel materials with digital imagecorrelation Rami Haj-Ali, Rami Eliasi, Victor Fourman , Chen Tzur, Galit Bar , Eitan Grossman,Ronen Verker , Raz Gvishi ", Irina Gouzman, Noam Eliazd.* School of Mechanical Engineering, Tel-Aviv University, Ramat Aviv, Tel Aviv 6997801, Israel " Applied Physics Division, Soreq NRC, Yavne 81800, Israel Space Environment Department, Soreq NRC, Yavne 81800, Israel " Department of Materials Science and Engineering, Tel-Aviv University, Ramat Aviv, Tel Aviv 6997801, Israel ARTICLEINF O ABSTRACT Article history:Received 29 March 2015Received in revised form1 December 2015Accepted 17 December 2015Available online 29 December 2015 Keywords: Silica aerogelsMechanical propertiesDigital image correlationDisk compressionInverse mechanics Silica aerogels are ultralow density materials with nano-sized skeleton network of pores. Their highbrittle nature presents a major challenge for mechanical testing and a need exists for novel testingmethods. Two new mechanical setups and testing techniques are proposed for measuring the aerogelelastic mechanical properties. Both techniques employ full-field Digital Image Correlation (DIC) forsurface deformation measurements. The first setup uses disk compression experiment, known asdiametral compression test (Brazilian disk). However, the elastic properties of the material cannot beobtained directly. Instead, an inverse mechanics computational scheme, using both a finite element(FE)model and analytical solution, is proposed. The second direct testing setup is uniaxial compression ofrectangular-shaped blocks. The Young's modulus and Poisson's ratio are extracted directly from theexperimental stress-strain curves. Our results of tested samples show the relation between the densityand the Young's modulus to coincide with previously published trends. The direct and iterative inverse-mechanics solution methods agree well with each other. The Poisson's ratio is found to be independentof the material apparent density. Comparisons between the two methods and recommendations forexpanding the disk testing approach to fracture toughness are discussed. ◎ 2015 Elsevier Inc. All rights reserved. 1. Introduction Aerogels comprise a special class of low-density open-cell solidfoams (typically, with porosity over 90%) which exhibit manyunique properties such as exceptionally lightweight, high surfacearea, low thermal conductivity, extremely low dielectric constant,low sound wave transmission, high optical transparency in a widerange of wavelengths close to that of glass, and a very low refractiveindex [1-4]. These properties result from the microstructure ofaerogels, which consists of a three-dimensional amorphous solidskeleton network with interconnected nanometer-sized pores inbetween. Silica aerogels are used for thermal and electrical insu-lation, especially in space applications, oxygen and humidity sen-sors, aerosol particle collectors, space mirror protectors, catalystsupports, battery electrodes, etc.[5]. ( * C o rresponding author. Tel.: + 972(3)640 7 3 84; f a x: + 9 72 ( 3 )640 6648. E-mail address: n eli a z@tau. a c.il ( N. Eliaz). ) The structure of the aerogel is sponge-like with nano-structuredairy material whose three-dimensional network of interconnectedsilica particles forms cylindrical and branched open 2-50 nmpores. The elastic modulus of highly porous aerogel materials isproportional to the relative density raised by the m" power(3≤m≤4). Ma et al. [6] proposed a computational model usingdiffusion-limited cluster-cluster aggregation (DLCA) algorithmsalong with FE models to estimate the elastic properties. Theircomputational modeling resulted in m ~ 3.6 for perfectly con-nected micro-structures. In general, aerogels are highly brittle materials, although theycan have a high stiffness-to-density ratio. Due to their low tough-ness, there is a major challenge to perform mechanical tests withthese materials. Characterization of the mechanical properties ofaerogels is important in order to design engineering applicationsand utilize their unique physical properties. Woignier et al. [7-9]performed both three-point bending and acoustical experimentsin order to determine the static and the dynamic Young's moduli, respectively, of monolithic parallelepipedic non-densified silicaaerogel samples. It was found that the density dependence of theYoung’s modulus, E, can be scaled by a power-law function 3.8,whereo is the volume fraction, so a calibration law was proposedaccordingly. Dynamic experiments have been carried out by meansof the Brillouin scattering acoustic technique [7,10]. The longitudi-nal and transverse wave-length velocities were measured, allowingthe determination of the elastic constants. Woignier and Phalippou[8] further extended the three-point bending method for densifiedaerogels. A general trend in which E increases with the density wasobserved, with E values varying between 10-3 and 10-2 GPa. Twodifferent slopes with two different scaling exponents wereobserved. Thus, it was deduced that non-densified aerogels anddensified aerogels have different elastic behaviors. The mechanicalstrength of silica aerogels has also been determined by bendingtests [81. Gross et al.[11] employed ultrasonic and static compressionexperiments at high frequencies in which longitudinal and trans-verse velocities were measured for different densities of aerogels.The Poisson’s ratios thus determined were not affected by thedensity variations. Tillotson and Hrubesh [12] investigated themechanical properties of ultralow-density aerogels (3-80 mg/cm’). Scattered results for densities lower than 80 mg/cm’ wereshown since measurement in this range of low densities was moredifficult to implement. The results coincided with previously pub-lished results reflecting a lower power-law slope for the ultralow-density aerogels compared with the higher-density silica aero-gels. Scherer et al.[13,14] measured the shear modulus and bulkmodulus of alkoxide-derived silica gels during aging and dryingstages. Parmenter and Milstein [15] investigated the mechanicalbehavior of fiber-reinforced and unreinforced silica aerogels usingindentation and block compression tests. The direct (block)compressive strength showed correlation with the hardness re-sults. Moner-Girona et al. [16] investigated the mechanical prop-erties of silica aerogels by means of the micro-indentationtechnique. The Young's modulus for the lightest aerogel (80 mg/cm’) was 7.0 MPa, whereas the highest density (260 mg/cm)yielded a modulus of 346 MPa. The four experimental points werefitted according to power-law function for the Young's modulus,with a power α=3.0±0.2. Wong et al.[17] investigated the elasticmodulus of a wide range of hydrophobic silica aerogels in order tostudy the effect of density on modulus, which ranged from 40 kPato 70 MPa. Tension and compression tests along with thermalconductivity properties were also reported. The Brazilian disk testwas used for the limited purpose of measuring the tensile strengthonly. To-date, very few studies have used Digital Image Correlation(DIC) for aerogels. Sun et al. [18] established guidelines for pre-paring shear tests of ceramic-fiber-reinforced aerogel. Iosipescuaerogel specimens with two different notches were investigatedusing the FE method. It was proposed (without actually applying it)that the needed mid-section strain gages can be replaced by the DICmethod. Dynamic compressive tests of cross-linked silica aerogelusing a split Hopkinson pressure bar (SHPB) were conducted by Luoet al.[19]. The DIC method was employed using high-speed imageacquisition. The Poisson's ratio was determined to be 0.162. Ductilesplitting was observed at high strain rates, but the samples weremuch more ductile than native silica aerogels. Luo et al. [20] studiedthe mechanical properties of isocyanate-crosslinked vanadia aer-ogels under both quasi-static loading conditions and high strainrate loading conditions using a SHPB. DIC was used to measure thesurface strains, indicating nearly uniform compression at all stagesof deformation during compression. In our study we apply the DICmethod in a unique fashion and demonstrate the use of virtual extensometer (extension or shortening distance between twopoints). There are strong reasons for using the proposed DIC foraerogels. The latter are brittle, and contact gauges for deformationmeasurements cannot be mounted without local damage. Inaddition. the full-field nature of the DIC allows both overall andlocal strain measurements, including of the Poisson's ratio. The DICcan also be used for inhomogeneity, damage and flow detections. Fracture toughness tests using the Single-Edge-Notched Beam(SENB) technique have been conducted[9], showing that for aer-ogel samples having densities between 0.1 and 0.35 g/cm’, thefracture toughness Kic ranges between 0.8 and 4.8 KPa-m1/2 andcan be scaled by a power law with an exponent equals to 1.6±0.2.Alaoui et al. [21]measured the toughness of alcogels and aerogelswith different porosities by SENB. The mechanical strength wasalso measured using the three-point bending on un-notchedspecimens. Both aerogel and alcogel samples were monolithicwith densities ranging from 90 to 250 mg/cm. It was observedthat, for a given density, the toughness of aerogels was higher (by afactor close to 2) than alcogels. This toughness enhancement isexpected taking into account the textural and structural trans-formation of the gel, and was attributed to the growth of the necksbetween the particles. The brittle nature of the light-weight aerogel presents severalchallenges for mechanical testing, such as end fixtures formounting the specimen, contact method for applying the load, anddisplacement measurements during the test up to ultimate failure.Standard deformation measurement techniques (e.g. strain gauges,extensometers) are found unsuitable since they cause damage tothe specimen. Therefore, non-contact optical measurement tech-niques offer a better alternative for monitoring the deformationduring loading. In this study, we examine the use of the optical two-dimensional (2D) DIC technique. The 2D-DIC technique is a full-field non-contact optical technique for spatial deformation mea-surement on the surface of the tested sample. It directly providesthe displacement components on the surface. The 2D-DIC compu-tational algorithm divides the measured area into cells and tracksand compares features to locate their displacement vectors withtime from a successive series of digital images. The DIC method hasbeen extensively developed and applied since the early 1980's, andits principles and theoretical background have been extensivelyreported [22-26]. The overall objective of this work is to examine two newexperimental tests and data characterization of light-weight silicaaerogels in order to determine reliably their elastic properties, suchas the Young's modulus. Direct block compression and indirectdiametral (Brazilian disk) tests are employed. To the best of ourknowledge, this is the first ever use of the Brazilian disk test formeasuring the Young’s modulus of aerogels. The non-contact full-field 2D-DIC strain measurement is used, and a technique isdeveloped for applying an external coat with speckle field. A back-calculation (inverse mechanics) technique is used in the indirecttests to determine the mechanical properties of aerogels from thetest results and parametric finite-element solutions. 2. Experimental 2.1. Materials and samples characterization The tested silica aerogel samples were in the form of disks andblockSs 1with dimensions of about 2.6 cm x0.7 cm and2.5 cm × 2.5 cm x1.0 cm,respectively. These samples were ob-tained commercially from Aerogel TechnologiesTM [27]. They arehydrophilic and were supercritically dried with CO2. Each samplewas labeled 'compression aerogel disk (CAD)' followed by itsnumber. Therefore, the first task was to perform geometrical measurements by means of digital pictures of each specimen. Thesepictures were acquired by a FinePix S100FS Fujifilm camera, with aresolution of 11.1 megapixels, in a super-macro mode. For calibra-tion purposes, a millimetric paper was placed in a parallel manner,adjacent to the specimen's surface, in the plane closest to thecamera. As can be seen from Fig. 1, the thickness of the disk is notcompletely uniform. In addition,it is worth noting that all disksamples possess a concave shape. All geometry measurementswere carried out using National Instruments' Vision Assistant 8.0(2005) [28]. All specimens were weighed using Vibra's AJH-620CEelectronic balance, having a range between 0.1 and 620 g and ac-curacy of 1 mg. The obtained weight and volume were used tocalculate the density of each sample. Table 1 reports the geometryand calculated density of the disk samples, with reference to theirnominal values set by the manufacturer as 27 mm by 7 mm. It alsoreports similar results for the aerogel block samples with referenceto their nominal values (25 mmx25mmx10 mm). Large relativevariations can be seen in the reported values. These may be due tothe hydrophilic nature of the aerogel specimens, as they tend toexperience shrinkage due to capillary stresses caused by residualadsorbates on their surface. Therefore, it is expected that the finaldimensions will differ and be smaller than those provided asnominal values. The hydrophilic aerogel tends to accumulate hu-midity,which causes shrinkage and a density increase. 2.2. Surface preparation and digital image processing The LaVision DIC system [29] is used in this study along with itsDavis post processing and numerical computing software.Arandomgray intensity pattern is applied onto the aerogel surface in order tocalculate the surface deformation by the 2D-DIC. The natural textureof a specimen often provides a sufficient random gray intensitydistribution without the need to apply an exterior coat. In our case ofclose totransparent aerogels, an artificial pattern is used by sprayingpaint or by scattering micron-size carbon particles onto the specimen surface. This aerogel specimen preparation includes ageneration of random speckle pattern by spraying paints onto thespecimen surface in two layers. One side of the specimen is entirelycovered by first spraying a very delicate thin layer of white paint and,then, spraying black paint on top of the white background to achieveadequate contrast of the speckle pattern.According to the spray'smanufacturer data, its major components are Acetone (36.0%),Propane (17.0%), Toluene (11.9%), Butane (8.0%), and Lt. AliphaticHydrocarbon Solvent (5.2%). Although the aerogel has a relativelyhygroscopic behavior, we assume that the influence of the thin coaton the overall mechanical properties is negligible. Fig.1 illustratesthe disk and block samples before and after applying the surfacecoat, and the relative uniformity of the gray patterns. The quality of the acquired images significantly affects the DICresults. The application of the DIC in the current setup requires thedetermination of different parameters related to image acquisitionand post processing. The acquired image is divided into a grid of1600 pixels in the loading direction and 1200 pixels in the trans-verse direction. Focus and light intensity for good image contrast aredefined in each experiment as the speckle patterns differ from onesample to another. The camera exposure time is manually selectedusing the DIC software. The setup of these photography parametersyield a gray level histogram that is examined prior to performing thetest in order to ensure pixel dispersion within the scale of differentgray levels. Our applied DIC system includes a 12-bit depth graycamera yielding 4096 gray levels, where 0 and 4095 represent thefull black and white levels, respectively. A wide histogram acquiredprior to the test shows a good dispersion for the number of pixelswithin each gray level. Image calibration procedure is carried outonce the gray-level histogram is deemed acceptable. 2.3. Mechanical testing setups The experimental setup included an Instron-5582 screw-drivenloading frame controlled by Bluehill's operating system. A load cell a b c d e f Fig. 1. Top row: aerogel surface preparation for the 2D-DIC measurement:(a) A specimen before the generation of random speckle pattern; (b) A front view of the speckle pattern;(c) Only one side of the specimen was entirely covered. Bottom row: an example of specimen's surface preparation, by stages, for 2D-DIC measurement for compression aerogelblock CAB-6 specimen: (d) before spraying; (e) after spraying white paint; (f) after spraying black paint on top. Measured sample properties, geometry (diameter, thickness), mass and density, for ten disks. Right two columns list the Young's moduli (for assumed Poisson's ratios) ob-tained from the inverse mechanical scheme. Nominal geometry reported by the manufacturer: (~2.6cm x0.7 cm). Error is defined as the relative deviation from nominal tomeasured volumes. Specimen label D [mm] t [mm] Percentage error [%] m [g] p [g/cm3] E[MPa]u=0.2 E[MPa]u=0.3 CAD-1 25.32 7.08 4.00 0.65 0.181 2.78 2.78 CAD-2 24.65 8.79 12.90 0.67 0.159 2.41 2.40 CAD-3 24.73 7.71 0.37 0.59 0.159 2.90 2.89 CAD-4 26.18 8.05 16.57 0.70 0.161 2.81 2.81 CAD-5 24.06 7.69 5.89 0.65 0.184 3.19 3.19 CAD-6 25.10 6.80 3.54 0.61 0.171 3.62 3.62 CAD-7 24.00 7.88 4.05 0.69 0.194 3.64 3.64 CAD-8 25.20 6.95 6.74 0.67 0.192 4.76 4.76 CAD-9 25.12 6.99 6.75 0.67 0.193 4.63 4.62 CAD-10 24.73 7.37 4.70 0.64 0.182 4.37 4.36 with a maximum capacity of 100 N and accuracy of 0.5% of themeasured load was used. A special fixture in the form of top andbottom plates (holders) for the disk samples was designed and self-manufactured in order to prevent disk rotation during the applieddiametral compression. TheloadWas applied through adisplacement-control mode. The 2D-DIC setup was connected withthe loading frame in order to accurately associate the images withthe measured loads. The 2D-DIC system by LaVision consists of aCCD camera with a 12-bit depth and a spatial resolution of1600×1200 pixels (about 2 megapixels). Image recording wassimultaneously performed with the mechanical loading, supportedby analog inputs from the test machine and the load cell data (e.g.force and displacement). In order to ensure in-plane deformationmeasurements, an alignment of the optical camera axis was carriedout relative to the object surface. The specimen was uniformlyilluminated by a fiber optics light source and flexible light tubeswith variable intensities. All tests were carried out at ambienttemperature with constant relative humidity. Initially, the mechanical properties of ten aerogel disks wereinvestigated using the diametral compression test (also known asBrazilian test) [30-33]. The Brazilian disk has more sensitivity toflaws than bending test due to the test configuration itself. Eachsample was named 'CAD' followed by an ordinal number. In order toconstruct the proposed setup for aerogel disks, great efforts weremade in order to develop improved setup, geometry and size. Weinitially used two samples with different materials, un-plasticizedPolyvinyl Chloride (PVC-U) and classical sol-gel sample (~700 mg/cm’), respectively. Rigid rotation of the disks was observed whenthe top flat loading surface was secured and fixed to the load cell.This rotation was minimized by using a brass compression fixture,shown in Fig. 2. The top portion of the fixture consisted of a flat platewith rounded half-slot made by milling disk cutter. The areadesigned to be in contact with the specimen had a concave surface,with a larger radius than the specimen to induce close to a pointcontact loading. It was also designed to be pin-connected to thecrosshead. The bottom portion included a concave contact surfacewith a radius larger than that of the specimen. A vacuum pen wasused to place the specimen,and a small pre-load was applied to keepthe disk in contact with the top and bottom surfaces. The applieddisplacement rate was 1.0 mm/min. The aim of this test is to extract the elastic properties. To this end,we first examine the classical elasticity solution, e.g. as in Ref. [34], ofa disk under point loads. The displacement field is given by: where Fp represents the compressive force per unit thickness, R isthe radius of the circular disk, k is a constant that defines eitherplane stress (k=) or plane strain (k=3-4v) deformations, u isthe shear modulus, and u is the Poisson's ratio. The solution is givenin Cartesian coordinates with origin at the center of the disk. Theelasticity solution is used to provide an estimated initial trial for theelastic properties. However, since we are not assuming planedeformation due to the finite thickness-to-diameter ratio, a 3Dfinite element (FE) model was generated to compare its solutionwith the DIC displacement fields for a given set of assumed elasticproperties. A 3D FE contact model is employed for each specimen, using theAbaqus general purpose implicit FE software [35] in order tosimulate the experiments. The FE model consists of three parts,namely, a circular disk and two parallel rigid surfaces having con-tact with the disk. The mesh includes 6160 linear hexahedral ele-ments of type C3D8R with 5 layers of elements through thethickness. The top rigid plate is allowed to move in contactdownwards, but only along the vertical axis, while the bottom plateis fixed. The computer simulation starts with an initial trial value of theaerogel modulus. Reaction force against the plate verticaldisplacement from the simulated model is compared with the testdata. The latter consists of applied load that was derived from theloading frame against specimen shortening obtained from both theDIC and plate vertical movement. The inverse computationalscheme consists of corrections of the estimated modulus until thelinear portions of the two load-shortening curves are matched. Thelinear slope obtained by the FE simulation (initially, with assumedelastic properties) is compared to the experimental one. A newcorrection is applied to the Young's modulus and the FE is runagain. The correction sign and magnitude depend on the sign andrelative change in the current estimate between the load-deflectionslopes. In case that the slope in the current run is larger than theprevious one, the Young's modulus in the consequent FE run isdecreased, and vice versa. This trial-and-error process is repeateduntil convergence. An extended inverse-mechanics scheme isdeveloped by taking the FE converged results and correlating themwith the 2D elasticity solution in order to extract an “improved"estimate of the material coefficients that appear in the elasticitysolution. Once the load-deflection slope convergence is achieved,the displacements along horizontal and vertical diameters, u(x,0) (a) (b) Fig. 2. (a) the 2D-DIC setup with a mounted camera in a fixed position in front of the aerogel specimen in the form of a disk. (b) Block compression mechanical testing setup. and v(0,y), respectively, are calculated. These are extracted from theFE results by means of discrete points along two defined paths. A second mechanical testing setup was also developed for blockaerogel samples. These samples are numbered and identified ascompression aerogel block (CAB#). Unlike the disk setup, theseblock tests allow extracting the aerogel mechanical properties in adirect manner as a state ofuniform compression stress and strain isimposed. Fig. 2b shows the block compression test setup. Theloading frame procedure and sample preparation described for thedisk samples are applicable for the block samples too. A flat loadingsurface is secured in its top portion to the load cell which ensuresparallel top and bottom surfaces. The block specimen is placedbetween two parallel rigid surfaces for applying compressive load.All specimens are loaded at a constant crosshead moving velocity of0.3 mm/min. The maximum vertical displacement depth was pre-determined to 3 mm downward, except for CAB-2 for which themaximum vertical displacement depth was pre-determined as10 mm downward in order to reach failure. Finally, six aerogelblock-shaped specimens were tested using this direct method andtheir mechanical properties were individually determined. The sensitivity of the DIC technique decreases in the transversedirection as the displacement and strain associated with the Pois-son's ratio are relatively smaller, hence higher resolution is neededin order to better resolve the strain and achieve reliable measure-ments. To this end, a second 2D-DIC system was used in this test inorder to examine the accuracy of the first DIC system. The first diskexperiments were carried out using a La-Vision CCD camera with a12-bit depth and a spatial resolution of 1600× 1200 pixels. Here, we added a second DIC system carried out by a PixeLINK PL-A686CCD camera [36], with a 8-bit depth and a spatial resolution of2208 ×3000 pixels (about 6.6 megapixels). A modular microscope,Navitar 12× Zoom with an adapter tube of 2x and a lens of 0.5×,was used to achieve a magnification range between 0.58x and 7.0x.The field of view was maximized by using the lowest magnificationpossible (0.58×), yielding a total magnification of 1.14. Both DICdata (i.e. from the 2- and 6-megapixel cameras) were processed viathe Davis 7.4 and the VIC-2D [37] DIC post-processing commercialprograms. Comparing the four combinations of DIC results allowedus to draw conclusions on the DIC setup. It was thus found that theselected magnification was sufficient for the determination of thePoisson's ratio. In addition, the lower spatial resolution of the La-Vision CCD camera in our Lab was found to be suitable. Thepointwise full-field strain contours extracted from the DIC werealso used to generate line and area (window) average strain metricsin order to give strain measures especially when the theoreticalstrain field solution is constant. 3. Results and discussion In this section the results from the two types of mechanical testswill be discussed. Fig. 3 shows typical DIC displacement contoursduring a Brazilian disk test (sample CAD-6) superimposed on thephoto of the test with the measured load level. It should be notedthat DIC displacement field at the surface of the samples is repre-sentative of the displacements found inside the sample volume,both in the case of plane stress and in the case of plane strain. The (a) (b) Fig. 4. Typical disk compression setup showing: (a) specimen fractured along its vertical diameter; (b)a half-specimen after fracture failure. displacement field is called a plane displacement and does not havea gradient in the thickness direction. Fig. 4 illustrates a case wherethe loading is increased up to the brittle failure expected in theform of a vertical crack emanating from the center of the sample.The load-shortening curve for CAD-6 sample is shown in Fig.5. Thedeviation from a perfect linear displacement field (homogeneousstrain) within the entire sample is related to two origins. The first isthe geometrical intrusion shown on the surface of the sample in theform of cup-shaped cavity due to manufacturing imperfections. Thesecond is due to the relatively small height-to-width ratio dis-cussed in Section 3.1. Fig. 6 illustrates the 3D-FE mesh used in thisstudy. The FE contact compression analysis was carried outassuming linear material behavior and small strains. The FEmatched the experimental results only in the linear range ofresponse past the initial contact stage (beyond 0.25 mm in Fig.5).The DIC results for the mechanical tests were post-processed for about 15 loading steps. Similar FE simulation was carried out in anautomated fashion with trial-and-error corrections for the Young'smodulus until convergence. The error measured between the FEand DIC was in the form of the displacement differences along the xand y axes. The typical full-field DIC displacement results shown inFig. 3 for CAD-6 sample correlate very well with the analyticalelasticity and computational FE solutions. This is especially true inthe mid-range linear response (Fig. 5) where it is free from theinitial contact indentation type behavior (reaching full contactbetween the two concave-convex surfaces) and not too close to Fig.7. Displacement fields obtained from the 2D-DIC of CAB-6 sample: (left) in the y-direction; (right) in the x-direction. Legend contours for the displacement in mm scale. ultimate failure where the tensile stresses damage the disk at itscenter. Table 1 presents a summary of the converged Young’smoduli for the 10 aerogel disk samples. The block compression test is designed assuming a close touniaxial compression state of deformation. The geometry of theaerogel block samples is not uniform and includes somemanufacturing imperfections as it is hard to obtain ideal edges andsurfaces. However,on average, and close to the center of the block,we anticipate a close to uniform stress and strain fields. Fig.7 il-lustrates typical DIC displacement fields in a block aerogel under Fig. 8. Compressive stress-strain curves for CAB-6 block aerogel sample. The averagestress is determined from the measured load while the strains are determined from thevirtual extensometer and average DIC strains in a square area around the center of thesample. Linear regression slope lines were generated in the strain range of 0.01-0.05. compression. The compressive stress is determined from themeasured load divided by the area of the specific sample. Averagecompression (axial) and averaged transverse strains in the blocksamples are determined in two approaches. The first is using twovertical and horizontal virtual extensometers where their short-eningand elongation can be measured from the displacements. Inthe second approach, the sample averaged strains are determinedfrom the sum of the strains in a squared area around the center ofthe block. The typical full-field DIC displacement results shown inFig. 7 correlate well with the anticipated linear distribution at the Fig. 9. Representative transverse strain versus longitudinal strain curves of CAB-6sample. The slopes of the curves are considered as the Poisson’s ratio according tothe two different strain calculations. Linear regression slope lines were generated inthe strain range of 0.01-0.05. Table 2 Measured sample properties, geometry (height, width, thickness), mass and density, for six block specimens. Young's modulus and Poisson’s ratio results for all six blockspecimens are generated using virtual extensometers and an averaged window of DIC strains. Nominal geometry reported by the manufacturer: (~2.5 cm×2.5cmx1.0 cm).Error is defined as the relative deviation from nominal to measured volumes. Specimen label h[mm] w [mm] t [mm²] Error [%] m [g] p [g/cm3] EDIc [MPa] EvE [MPa] VDIC VVE CAB-1 24.62 24.78 8.75 14.60 0.86 0.162 1.76 1.77 0.18 0.17 CAB-2 23.77 24.06 8.43 22.87 0.85 0.177 3.81 3.87 0.19 0.19 CAB-3 23.09 23.37 8.68 25.53 1.00 0.214 5.97 6.21 0.16 0.15 CAB-4 24.02 23.91 9.21 15.40 0.98 0.185 5.60 5.900 0.18 0.17 CAB-5 23.83 23.94 9.08 17.08 0.94 0.182 5.15 5.45 0.18 0.17 CAB-6 23.93 23.95 8.87 18.65 0.94 0.185 4.16 4.30 0.17 0.17 center of the samples. Fig. 8 illustrates typical stress-strain datapoints and the calculated Young's modulus. A similar process isused to calculate the Poisson's ratio as the slope of the average axialcompression strain when plotted against the average transversestrain, as illustrated in Fig.9. In the case of a linear elastic material,these curves are supposed to yield linear relations; however, at theinitial state a nonlinear response is shown as evident from estab-lishing a full contact with the rigid loading plate. The nonlinearresponse shown in the stress-strain curve indicates an evolvingdamage that occurs prior to reaching ultimate failure. Table 2 liststhe results for the Young's modulus and the Poisson's ratio for thesix block samples, using the averaged area strains and the virtualextensometer. Ten specimens were examined in the indirect aerogel disk tests.All of the specimens had densities ranging from approximately 150to 200 mg/cm. The Young's moduli determined were in the rangefrom 2.78 to 4.76 MPa. These are within the aerogel moduli re-ported for aerogels having the same range of density. Compared toRef.[11], for example, the current results are below the reportedupper bound. The Young's moduli that were obtained from the firsttwo disk specimens are relatively smaller than the others. Areasonable explanation to this result can be related to the fact thatthe first two specimens were tested in the original disk fixture andmay have excessive rigid body rotations during the first two tests.The elastic properties calculated from the elasticity equationsassuming plane stress have smaller differences (error) compared tousing the 3D-FE solution. The direct compression testing of aerogel blocks yields theYoung's moduli and Poisson's ratio in a direct manner. The Poisson'sratio is relatively independent of apparent density. Six aerogelblock specimens were examined. All of the specimens had densitiesranging from approximately 160 to 220 mg/cm. Here, the deter-mined Young's moduli were between 1.76 and 6.21 MPa, andagreed well with the indirect disk compression method.Comparingthe range of Young's moduli of the disk and block samples (Tables 1and 2, respectively), it is noted that the Young's modulus from theblock samples is somewhat on the higher bound while the disksamples give lower overall values. Noting that the samples areneither uniform in geometry nor in density, more tests are neededwith different sample geometries in order to better judge the dif-ferences and scatter of the data. Finally, an average value of Pois-son's ratio was found to be between 0.168 and 0.176. This supportedthe use of 0.2 value in the indirect test. 3.1. Limitations The two-block compression testing of aerogels is known to besensitive to sample size and geometry. The average height-to-thickness ratios of the two commercially available sets of blockand disk compression samples were, on average, 2.72 and 3.33,respectively. The height-to-width geometric ratio in both samplesis 1.0. The latter geometric ratio is small for the block samples, and a preferable ratio greater than 4 is more suitable to eliminate inho-mogeneous distribution of deformation emanating from the edgeareas. However, the use of the DIC method allowed extracting vir-tual extensometer data. In addition, a window of a close-to-uniformdeformation in the block samples close to the center of the moni-tored areas is evident from the linear patterns of the displacementfields in Fig. 9. Nevertheless, the proposed testing methodologyadvocates the use of height-to-width geometrical ratio greater than4 (assuming buckling will be prevented prior to failure). The re-ported results demonstrate the ability of the proposed tests tomeasure the mechanical properties of aerogels. The elastic modulusmay have been underestimated for the block samples with smallergeometrical ratios. 4. Conclusions The main purpose of this study was to examine two mechanicalsetups and testing procedures for measuring the elastic mechanicalproperties of (silica) aerogels; these can be used also for fracturetoughness measurements. Both procedures employ full-field Digi-tal Image Correlation (DIC) for surface deformation measurements.The first (indirect) test employs compression disk (CAD) in a Bra-zilian disk test, which is used here for the first time for measuringthe Young's modulus of aerogels. Since the elastic properties of thematerial cannot be obtained directly, an inverse mechanicscomputational scheme, using both a finite-element (FE) model andan analytical solution, is proposed. The second (direct) test is uni-axial compression of rectangular-shaped blocks (CAB). The twosetups are able to apply proper loading and can handle the materialwithout inducing damage. The expected correlation betweendensity and Young's modulus is found similar to values reported inthe literature. The Poisson’s ratio is found to be independent of thematerial apparent density. The DIC method is capable of providingfull strain fields (not just an average stiffness) and can be used toexamine material flaws due to manufacturing or damage duringhigher loads. The disadvantage of the CAD test setup lies in its needto employ indirect methods to extract the aerogel mechanicalproperties. Acknowledgment This work was supported by Grant No. 279/6065/99 from thePazy Foundation of the Israeli Council of Higher Education and theIsrael Atomic Energy Commission. References ( S .M. J o n es, A e rogel: s p a c e explo r ation ap p l ications, J. S o l -Gel Sci. Te c hno l .40 (2006)35 1 - 3 57. ) ( H .-S. M a, A . P. Robert s, J.H. P r evost,R. J u l lien, G .W. S c here r , J.N o n-Cr y stalline Sol i ds 277 ( 2 -3) (2000 ) 127 - 141 . ) ( [7] T . W oignier, J . P elous, J. P halipp o u, R . V acher, E. C o urten s , J. N o n-Cr y s t alline Solids 9 5- 96 (Part 2(0)) (1987)1197- 1 2 02. ) ( T . Woignier,J . Phalippou,J. Non-Crystallin e Solids 1 00 (1 - 3 ) ( 1 9 88)404-408. T T . Woignier, J . P h alip p ou, J . P hys. C olloq. 5 0 (1 9 8 9) (C4). ) ( [10] E E . C ourtens, J. Pelous, J . Phalippou, R . Vacher, T . W oignier, P h ys. Re v . L e tt. 58 ( 1 987)128- 1 31 . ) ( [111 J J . Gross, G. R eichenauer, J . Fri c ke, J . Phys . D Appl. Phys. 21 ( 9) ( 1 9 88)1447 - 1451 . ) ( [ 1 2] T . T il lotson, L . Hrubesh, J . N on-Crysta ll ine Solids 1 4 5 (0 ) (1 9 9 1 ) 44-50. Wurzburg, Ger m any. ) ( [13] G.W. S c herer, S . A. Pard e nek, R. Swiatek, J. N o n-Crystalline So l ids 10 7 (1) (1988 ) 14-22. ) ( [14] G.W. Sch e rer, D .M. S m i t h ,X . Q i u, J . M. A nderson,J . Non-C r ystalline S olids 186 (1995)316- 3 20 . ) ( [ 1 5] K . E. Parmenter, F. M ilstein, J . Non- C rystalli ne S olid s 223 (3)(1 9 98)179-189 . ) ( ] M . Moner-Gi r ona,A. Roi g , E. M o l ins, E. Ma r t i nez, J. E s teve, A p pl. P h ys. L e t t. 75 (5)(1999 ) 653-655. ) ( J.C.H. Wong, et al., Mic r oporous Mesoporous Ma t e r . 183 (2014 ) 23-29 . ) ( 181 Y .T. Sun, et al. , Procedi a E ng. 6 7 (0) (2013) 51 7- 524. ) ( H . Luo, H. L u, N . Leventis , Mech. T ime- D epend M a ter. 1 0 (2) ( 2 006) 8 3 -11 1. [201 ] H H . L uo, G . C huru, E . F. F a brizi o , e t a l. , J. Sol-G e l Sci. Te c h nol. 48 ( 2008) 113- 1 34. ) ( [21] A .H . A l a ou i , T . W oignier, F . P e rnot,J. P h ali pp o u , A. H i h i , J . N on-Crystalli n e Solids 265 ( 1- 2)(2000) 29 - 3 5. ) ( 221 B . P an, K. Qian, H. Xie , A. Asundi , Me a s. Sci. Technol . 20 (6)(2009). ) 23W.H. Peters, W.F. Ranson, Opt. Eng. 21 (3)(1982)427-431. ( 241 H . Bruck, S. M cNeill, M. S utton, W. P eters, Exp. Mech. 2 9 (1989) 261-26 7 . ) D.J. Chen, F.P. Chiang, Y.S. Tan, Appl. Opt. 32 (11)(1993)1839-1849. ( M . Sutton, j . Yan , V. Tiwari, H . Schreier , J . Orteu, Opt . Lasers Eng. 46 ( 10)( 2 008) 746-757 . ) ( [27] A erogel Technologies, Classic SilicaTM Aerogel M onolith ( S ilica Aerogel),2013. Available from: http://www.buyaerogel.com. ) ( 1281 N ati on al- i nstrum e nts. NI Vision A ssistant. 2005. National Instr u ments . ) ( 1291 L aVision, LaVision GmbH i n Davis St ra in Ma s ter 2D Software, 2010. Gottingen Germany. ) ( 301 M . Me l lor, I . Hawkes, Eng. Geol.5 (3)(197 1 ) 1 73- 22 5. ) ( 1311 P .P a n d e y , D . Si ngh, En g. Ge o l.22 (3)(19 86) 281 - 29 2. ) ( [32 ] C . L iu, Y . Huang, M. Lovato, Int . J . Fr ac t. 8 7 (3)(1997)241-263. ) ( 33 C . Liu , Ex p .Mech . 50 (2010)1025 - 1 039 . ) [34]S. Timoshenko, Theory of Elasticity, second ed.,McGraw-Hill Book Company,1951. ( [35] A baqus , Abaqus, FE Standard, S im u lia Corp, Providence, Rhode I sland, USA, 2010 . ) ( [36] PixeL I NK, Pix e LINK Ca p ture OEM, PixeLINK, Ottawa, ON, Canada, 2005. ) [37]Vic-2D, Vic-2D, in Digital Image Correlation, Correlated Solutions, Inc., SC,USA, 2006. Silica aerogels are ultralow density materials with nano-sized skeleton network of pores. Their high brittle nature presents a major challenge for mechanical testing and a need exists for novel testing methods. Two new mechanical setups and testing techniques are proposed for measuring the aerogel elastic mechanical properties. Both techniques employ full-field Digital Image Correlation (DIC) for surface deformation measurements. The first setup uses disk compression experiment, known as diametral compression test (Brazilian disk). However, the elastic properties of the material cannot be obtained directly. Instead, an inverse mechanics computational scheme, using both a finite element (FE) model and analytical solution, is proposed. The second direct testing setup is uniaxial compression of rectangular-shaped blocks. The Young's modulus and Poisson's ratio are extracted directly from the experimental stressestrain curves. Our results of tested samples show the relation between the densityand the Young's modulus to coincide with previously published trends. The direct and iterative inversemechanics solution methods agree well with each other. The Poisson's ratio is found to be independent of the material apparent density. Comparisons between the two methods and recommendations for expanding the disk testing approach to fracture toughness are discussed.
确定
还剩7页未读,是否继续阅读?

产品配置单
北京欧兰科技发展有限公司为您提供《气凝胶材料中力学特性的数字图像相关(DIC)研究检测方案(其它无损检测仪器/设备)》,该方案主要用于气凝胶中力学特性的数字图像相关(DIC)研究检测,参考标准--,《气凝胶材料中力学特性的数字图像相关(DIC)研究检测方案(其它无损检测仪器/设备)》用到的仪器有LaVision StrainMaster材料应变形变成像测量系统
推荐专场
该厂商其他方案
更多