


Water-Raman transitions are detectable across a large spectral range. Therefore, the Fluorolog ® demonstrates high sensitivity to fluorescence throughout the UV- visible region; see if your system can handle this task. Kinematically mounted gratings allow optimization of the spectrofluorometer custom applications at various wavelengths. Gratings, blazed at different wavelengths and optimized for different spectral regions, are changed easily with instant alignment. The Fluorolog reaches the statistical noise limit: this means that we provide the best system possible. Water-Raman experiments prove that the bench-top FluoroMax ® is superior in every respect.
?
方案详情

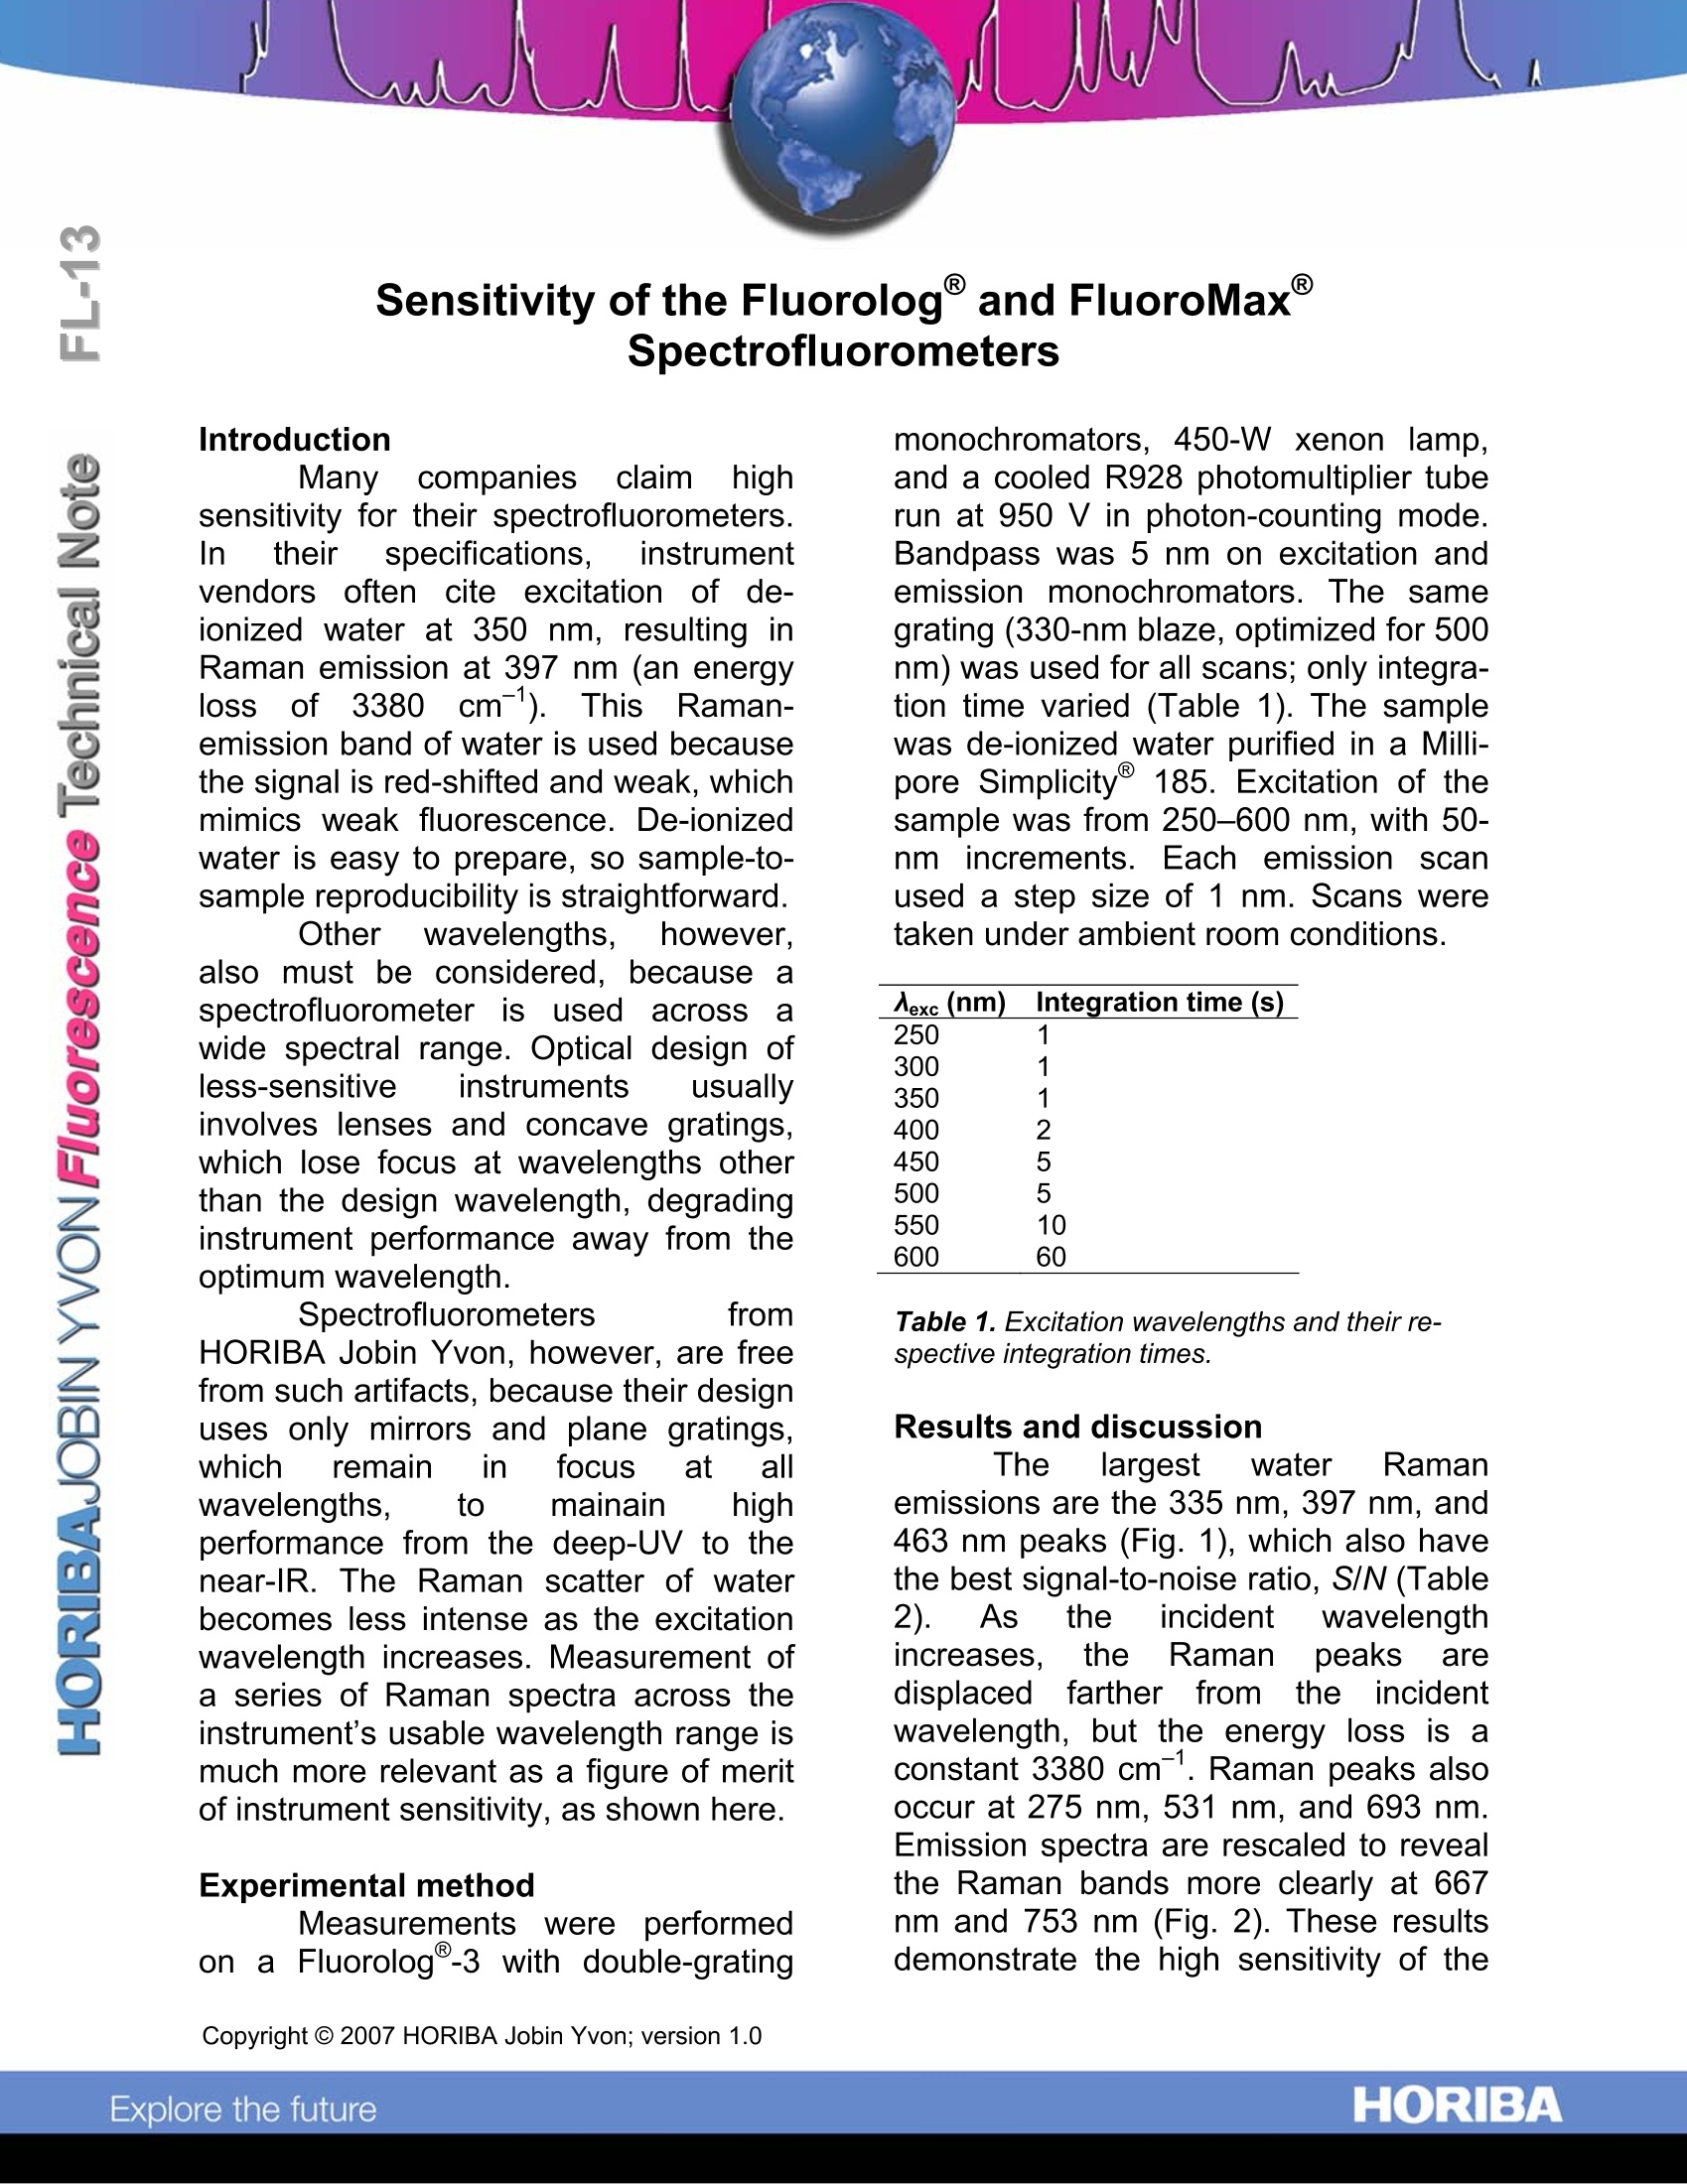
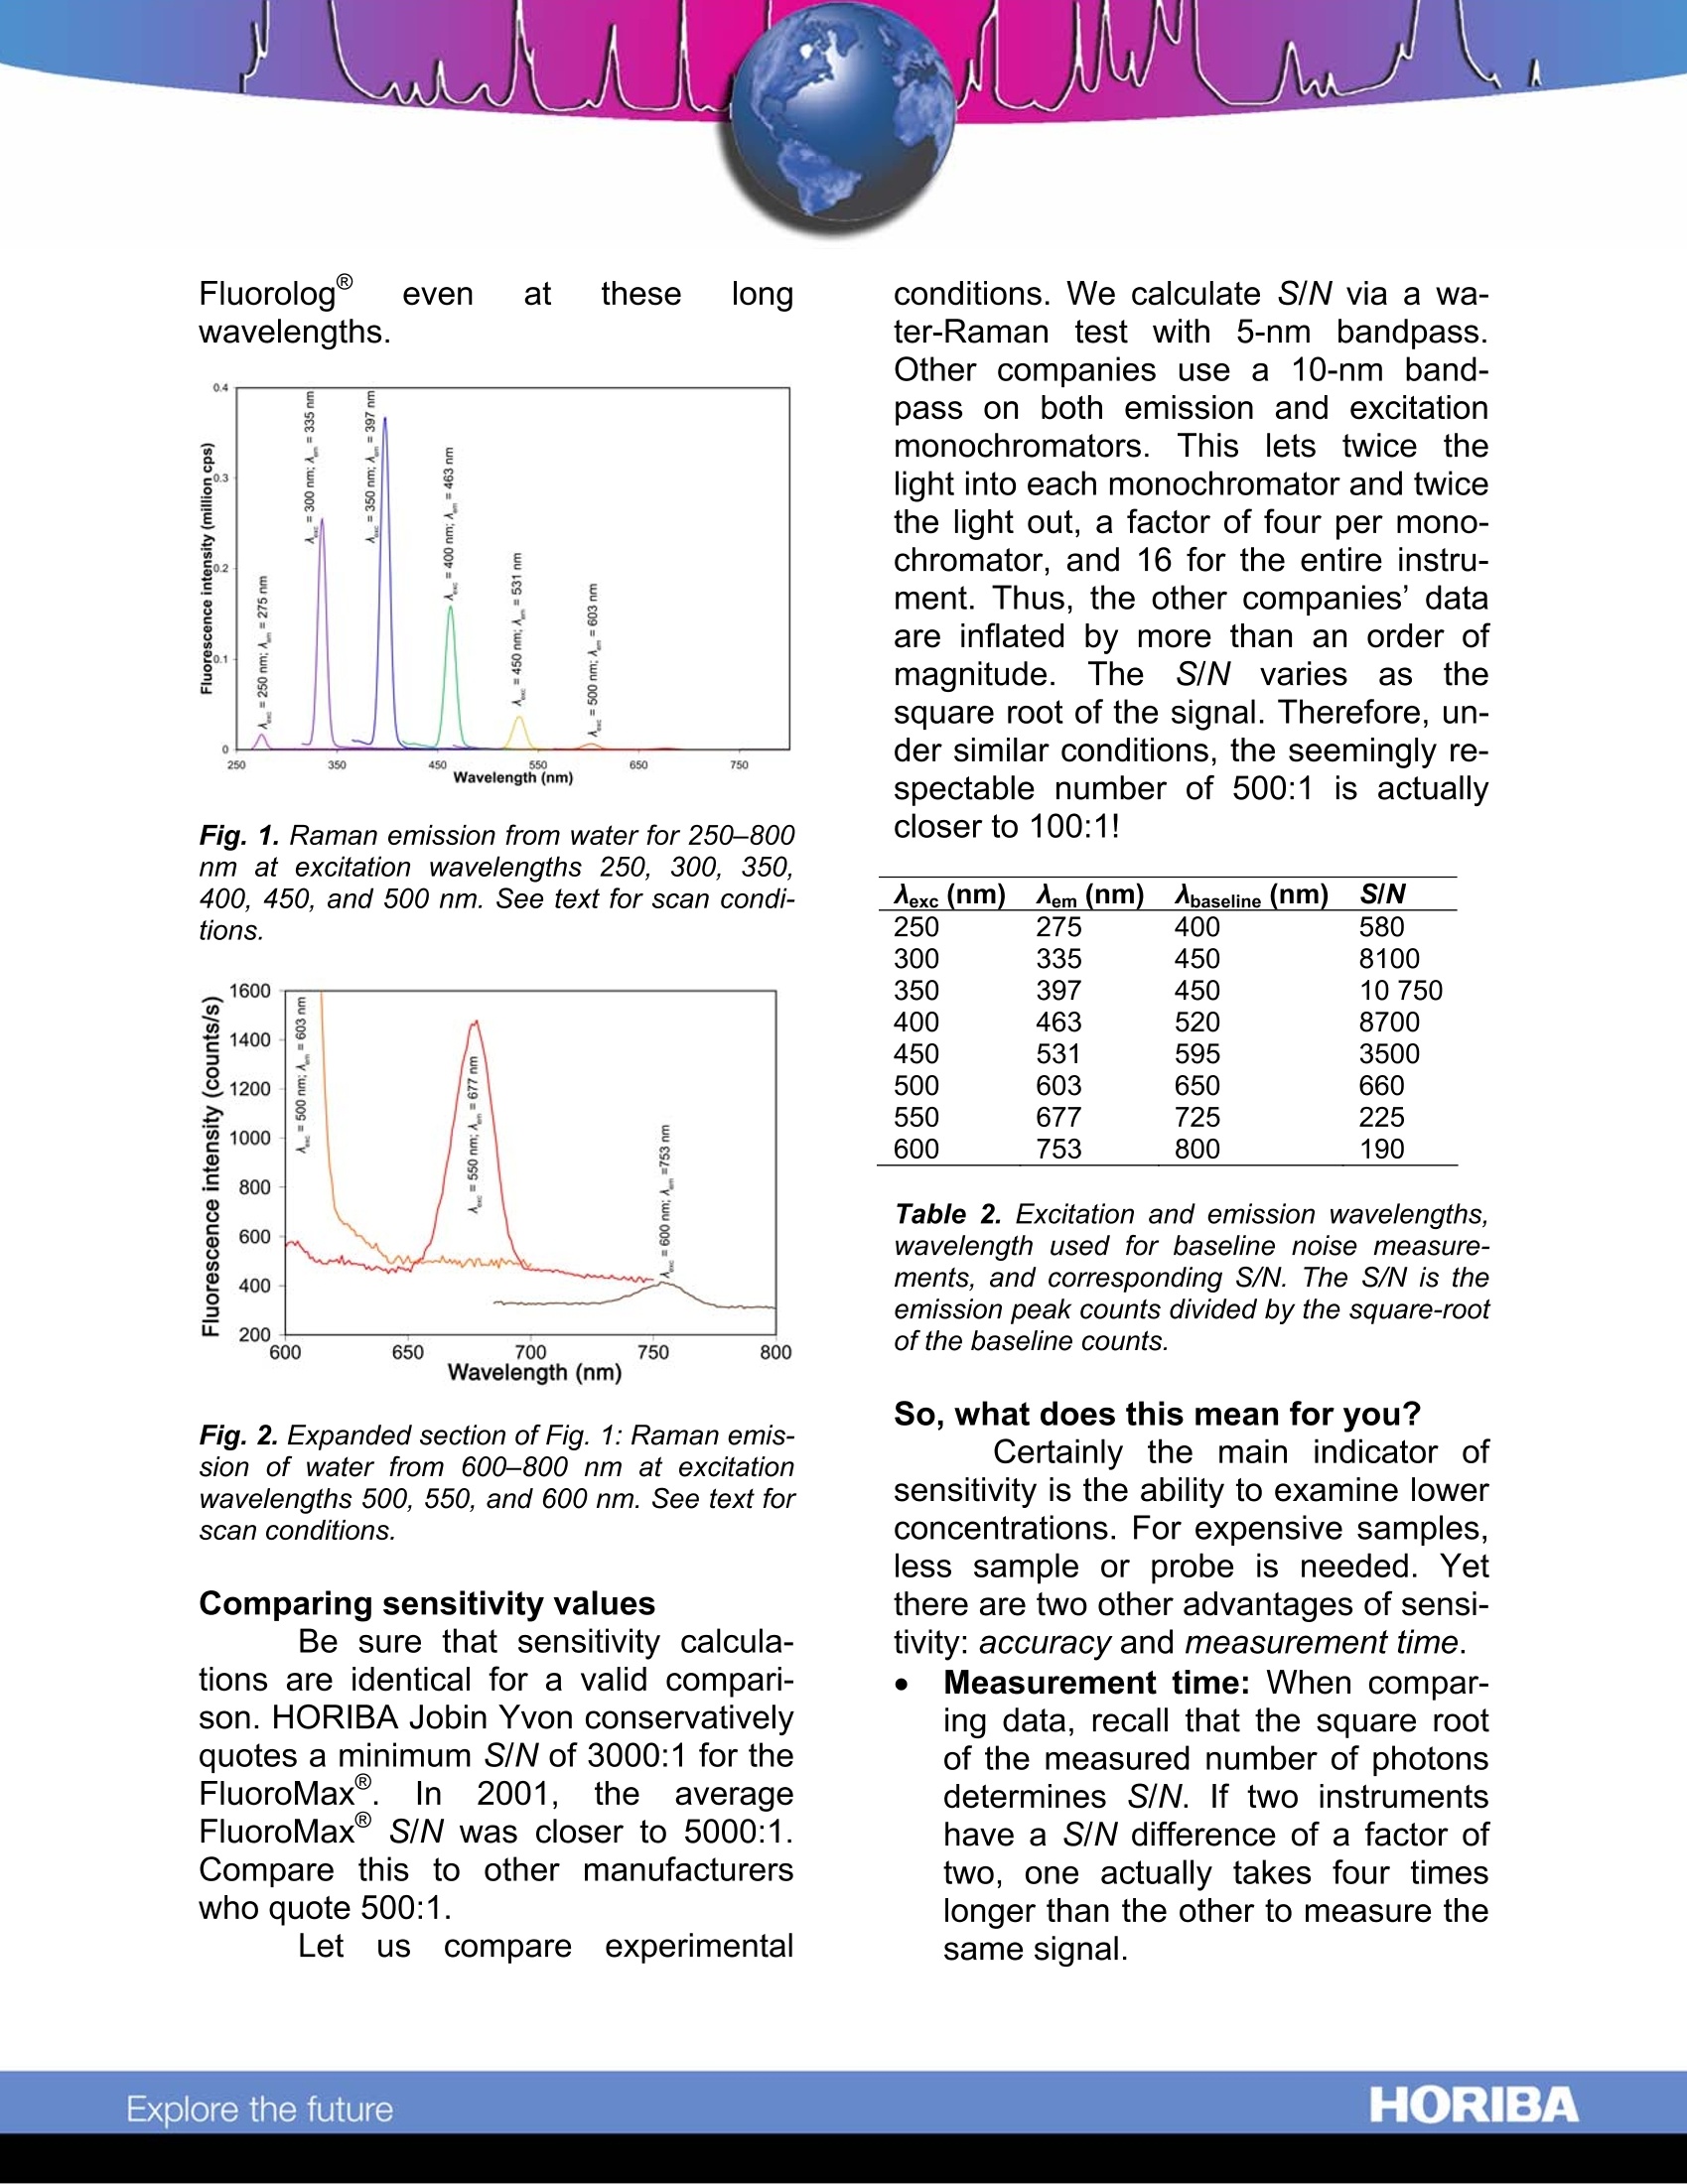
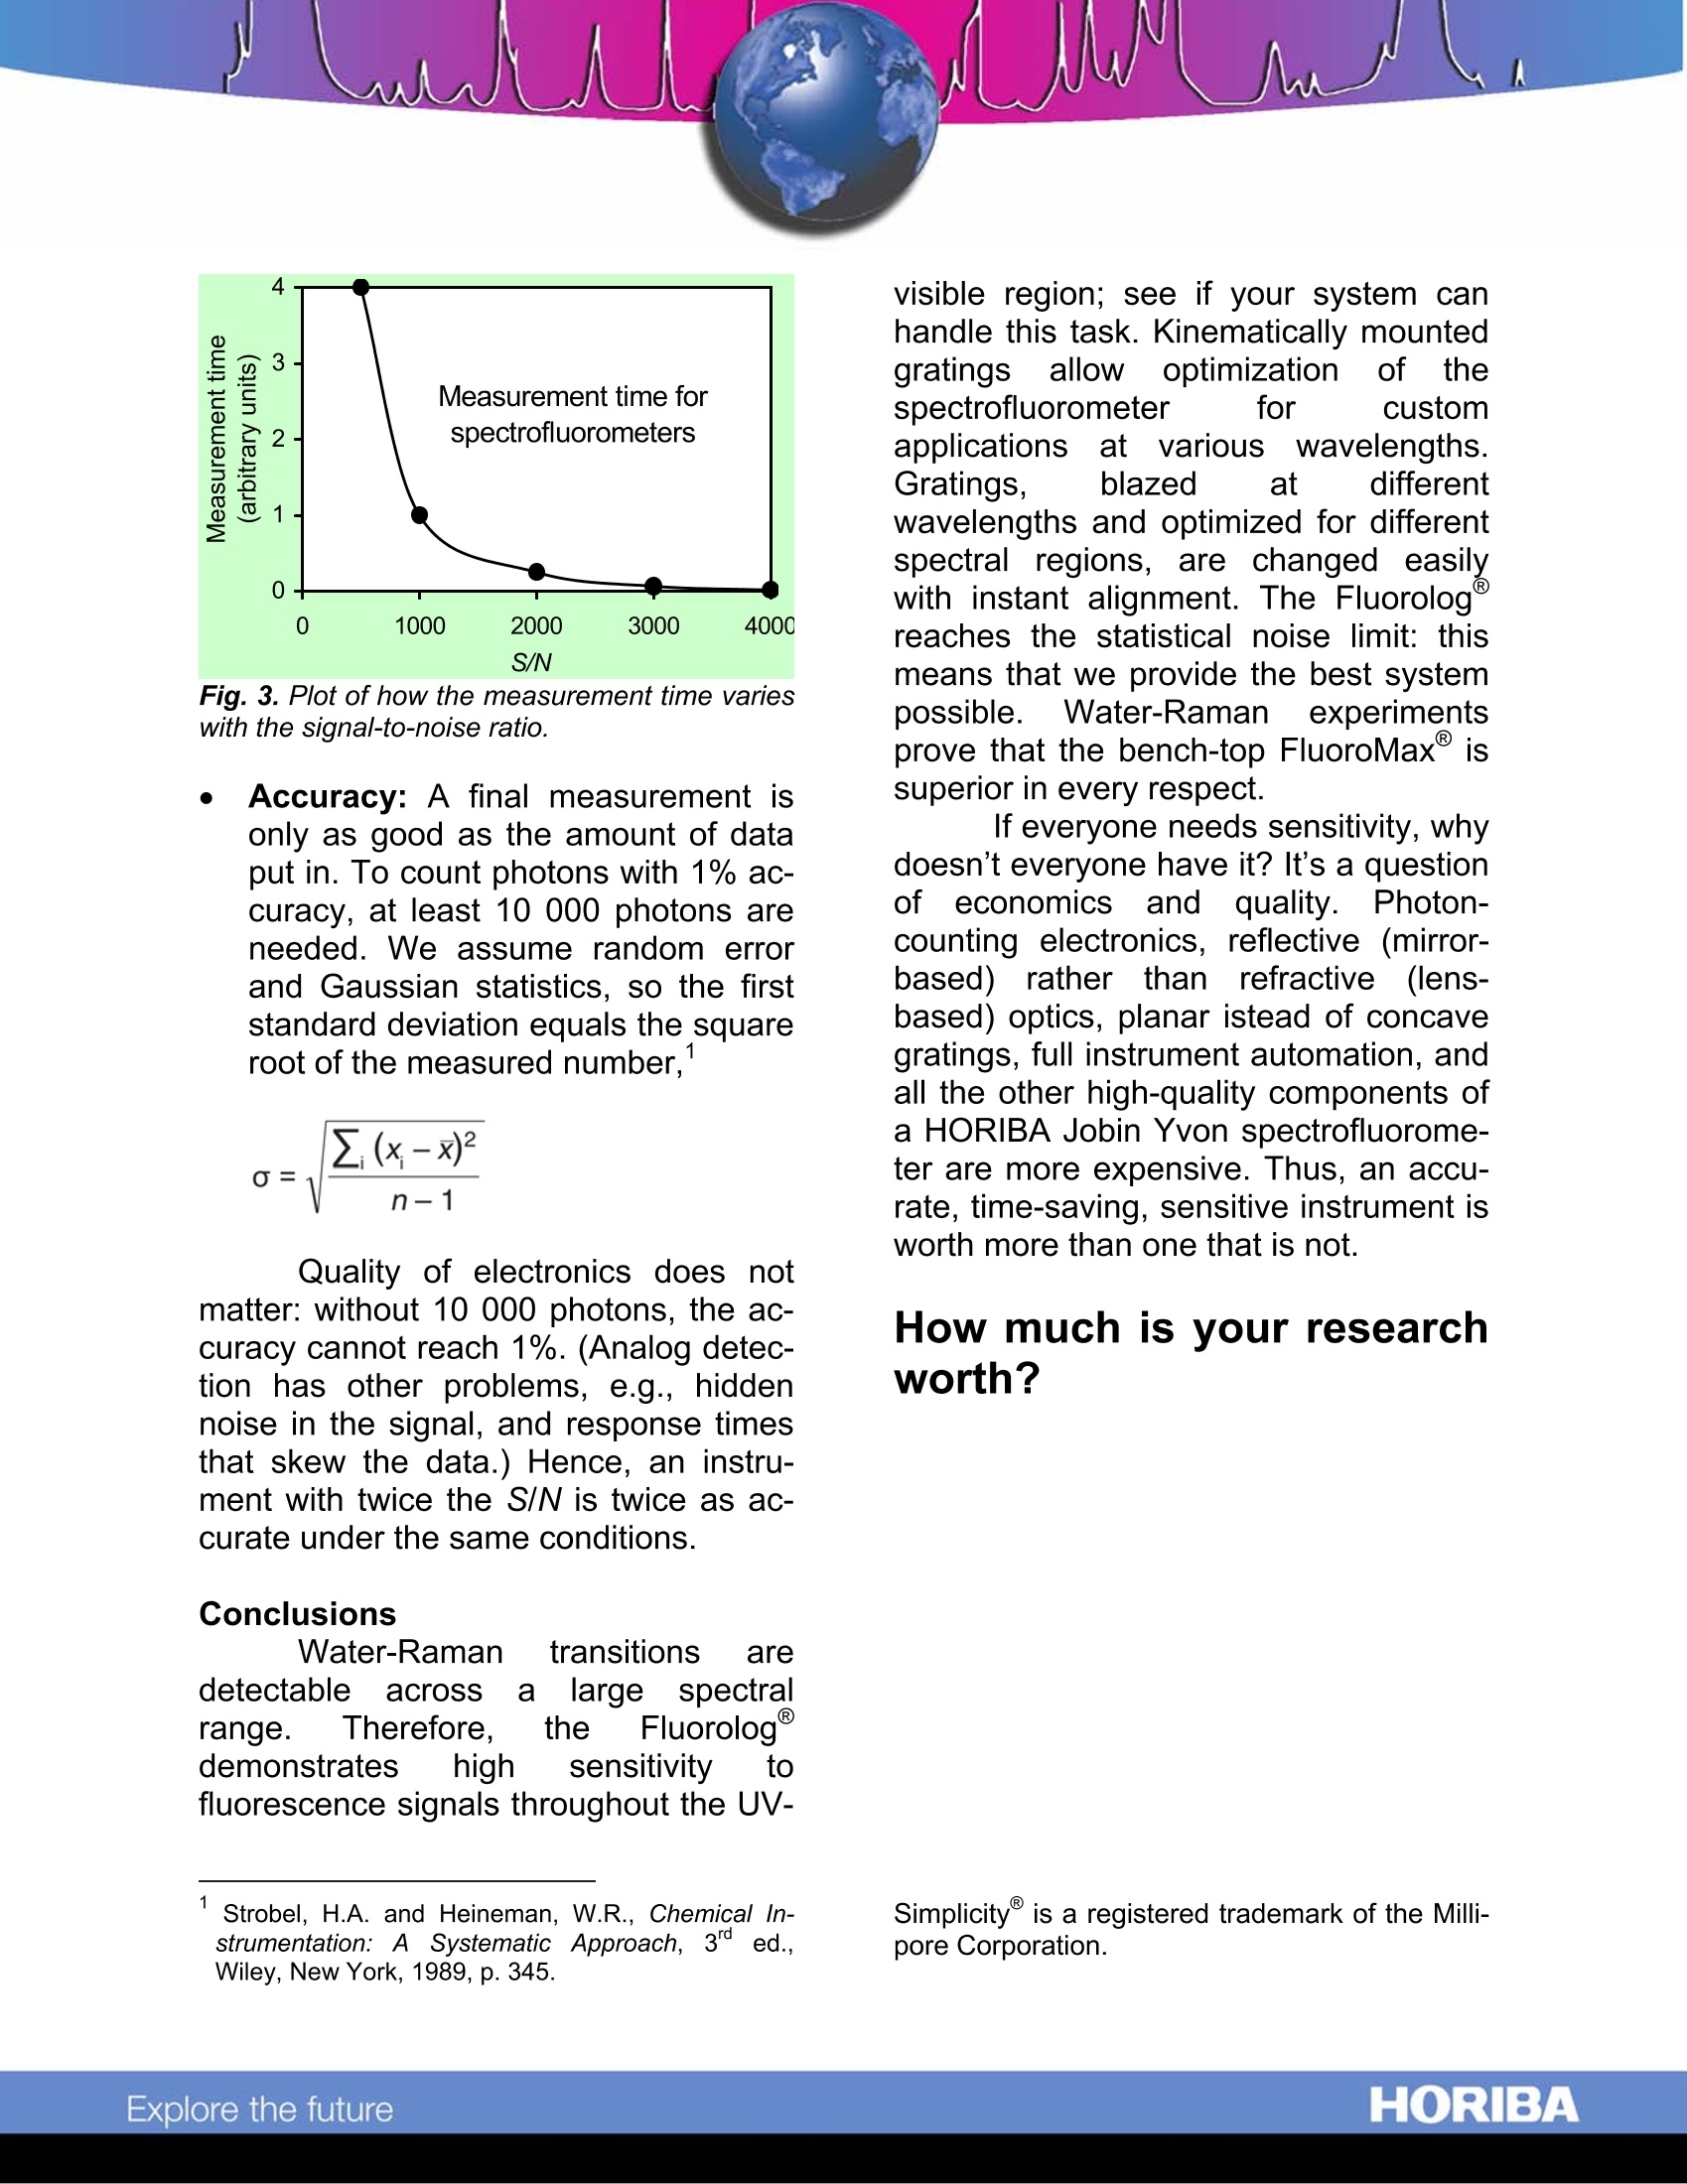
Sensitivity of the Fluorologand FluoroMax"Spectrofluorometers Introduction Many companies claim highsensitivity for their spectrofluorometers.ln their specifications, instrumentvendors often cite excitation of de-ionized water at 350 nm, resulting inRaman emission at 397 nm (an energylosss of3380 cm-). This;Raman-emission band of water is used becausethe signal is red-shifted and weak, whichmimics weak fluorescence. De-ionizedwater is easy to prepare, so sample-to-sample reproducibility is straightforward. Otherwavelengths, however,also must be considered, because aspectrofluorometer is; used across awide spectral range. Optical design ofless-sensitive instruments usuallyinvolves lenses and concave gratings,which lose focus at wavelengths otherthan the design wavelength, degradinginstrument performance away from theoptimum wavelength. Spectrofluorometers fromHORIBA Jobin Yvon, however, are freefrom such artifacts, because their designuses only mirrors and plane gratings,which remain in focus at:allwavelengths, to mainain highperformance from the deep-UV to thenear-IR. The Raman scatter of waterbecomes less intense as the excitationwavelength increases. Measurement ofa series of Raman spectra across theinstrument’s usable wavelength range ismuch more relevant as a figure of meritof instrument sensitivity, as shown here. Experimental method Measurements were performedon a Fluorolog@-3 with double-grating monochromators, 450-W xxenon lamp,and a cooled R928 photomultiplier tuberun at 950 V in photon-counting mode.Bandpass was 5 nm on excitation andemission monochromators.).The samegrating (330-nm blaze, optimized for 500nm) was used for all scans; only integra-tion time varied (Table 1). The samplewas de-ionized water purified in a Milli-pore Simplicity 185. Excitation of thesample was from 250-600 nm, with 50-nm increments.Each emission scanused a step size of 1 nm. Scans weretaken under ambient room conditions. ^exc (nm) Integration time (s) 250 300 350 400 450 500 550 600 Table 1. Excitation wavelengths and their re-spective integration times. Results and discussion The largest water Ramanemissions are the 335 nm, 397 nm, and463 nm peaks (Fig. 1), which also havethe best signal-to-noise ratio, S/N (Table2). As the incident wavelengthincreases,the Raman peaksaredisplacedfarther fromtthe incidentwavelength, but the energy loss is aconstant 3380 cm.Raman peaks alsooccur at 275 nm, 531 nm, and 693 nm.Emission spectra are rescaled to revealthe Raman bands more clearly at 667nm and 753 nm (Fig. 2). These resultsdemonstrate the high sensitivity of the Fluorolog even at these longwavelengths. Fig. 1. Raman emission from water for 250-800nm at excitation wavelengths 250, 300, 350,400, 450, and 500 nm. See text for scan condi-tions. Fig.2.Expanded section of Fig. 1: Raman emis-sion of water from 600-800 nm at excitationwavelengths 500, 550, and 600 nm. See text forscan conditions. Comparing sensitivity values Be sure that sensitivity calcula-tions are identical for a valid compari-son. HORIBA Jobin Yvon conservativelvquotes a minimum S/N of 3000:1 for theFluoroMax@.In2001,,the averageFluoroMax s/N was closer to 5000:1.Compare this to other manufacturerswho quote 500:1. Let US compareexperimental conditions. We calculate S/N via a wa-ter-Raman test with 5-nm bandpass.Other companies use a 10-nm band-pass on both emission and excitationmonochromators. This lets twice thelight into each monochromator and twicethe light out, a factor of four per mono-chromator, and 16 for the entire instru-ment. Thus, the other companies’dataare inflated by more than an order ofmagnitude.The S/NV vvarieassthesquare root of the signal. Therefore, un-der similar conditions, the seemingly re-closer to 100:1! Aexc (nm) Aem (nm) Abaseline (nm) S/N 250 275 400 580 300 335 450 8100 350 397 450 10 750 400 463 520 8700 450 531 595 3500 500 603 650 660 550 677 725 225 600 753 800 190 Table 2. Excitation and emission wavelengths,wavelength used for baseline noise measure-ments, and corresponding S/N. The S/N is theemission peak counts divided by the square-rootof the baseline counts. So, what does this mean for you? Certainly the main indicator ofsensitivity is the ability to examine lowerconcentrations. For expensive samples,less sample or probe is needed. Yetthere are two other advantages of sensi-tivity: accuracy and measurement time. ● Measurement time: When compar-ing data, recall that the square rootof the measured number of photonsdetermines S/N. If two instrumentshave a S/N difference of a factor oftwo, one actually takes four timeslonger than the other to measure thesame signal. Fig. 3. Plot of how the measurement time varieswith the signal-to-noise ratio. ●Accuracy: A final measurement isonly as good as the amount of dataput in. To count photons with 1% ac-curacy, at least 10 000 photons areneeded. We assume random errorand Gaussian statistics, so the firststandard deviation equals the squareroot of the measured number. Quality of electronics does notmatter: without 10 000 photons, the ac-curacy cannot reach 1%. (Analog detec-tion has other problems, e.g., hiddennoise in the signal, and response timesthat skew the data.) Hence, an instru-ment with twice the S/N is twice as ac-curate under the same conditions. Conclusions Water-Raman transitions aredetectable across a large spectralrange. Therefore. the Fluorologdemonstrates high sensitivity tofluorescence signals throughout the UV- ( 1 Strobel, H.A. and Heineman, W . R., C h emical In - strumentation: A Systematic Approach, 3d ed.,Wiley, New York, 1 989, p.345. ) visible region; see if your system canhandle this task. Kinematically mountedgratings allowoptimization cof thespectrofluorometer for customapplications attVvarious wavelengths.Gratings, blazed differentwavelengths and optimized for differentspectral regions, are changed easilywith instant alignment. The Fluorologreaches the statistical noise limit: thismeans that we provide the best systempossible. Water-Raman experimentsprove that the bench-top FluoroMax issuperior in every respect. If everyone needs sensitivity, whydoesn’t everyone have it? It’s a questionof economics andquality. Photon-counting electronics, reflective (mirror-based) rather than refractive(lens-based) optics, planar istead of concavegratings, full instrument automation, andyiatiiall the other high-quality components ofa HORIBA Jobin Yvon spectrofluorome-ter are more expensive. Thus, an accu-rate, time-saving, sensitive instrument isworth more than one that is not. How much is your researchworth? ( USA: H ORIBA Jobin Yvon In c ., 3 8 80 Park Avenue, Edison, NJ 08 8 20-3012, Toll-Free:+1 - 866-jobinyvon Tel: +1-732-494-8660, F ax: + 1 - 732-549-5125, E - mail: info@jobinyvon.com,www.jobinyvon.com France: H ORIBA Jobin Yvon S . A . S., 1 6-18, rue du Canal , 9116 5 Longjumeau Cedex, ) ( T el: +33 ( 0) 1 6 4 54 1 3 0 0 , Fax: + 33 (0) 1 69 09 9 3 1 9 , w w w.jobinyvon.fr Japan: H ORIBA Ltd., J Y Optical Sales Dept, Hig a s h i-Kanda, Daij i Building, 1-7-8 Higashi-Kanda ) ( Chiyoda-ku, T okyo 1 0 1-0031, T e l: +81 (0) 3 3861 8231, www.jyhoriba.jp Germany: +49(0)89462317-0 I taly:+39 0 2 57603050 U K:+44 (0) 20 8204 8142 China: ) Copyright C HORIBA Jobin Yvon; version .HORIBAExplore the future HORIBAExplore the future Water-Raman transitions are detectable across a large spectral range. Therefore, the Fluorolog ® demonstrates high sensitivity to fluorescence throughout the UV- visible region; see if your system can handle this task. Kinematically mounted gratings allow optimization of the spectrofluorometer custom applications at various wavelengths. Gratings, blazed at different wavelengths and optimized for different spectral regions, are changed easily with instant alignment. The Fluorolog reaches the statistical noise limit: this means that we provide the best system possible. Water-Raman experiments prove that the bench-top FluoroMax ® is superior in every respect.
确定

还剩2页未读,是否继续阅读?

产品配置单

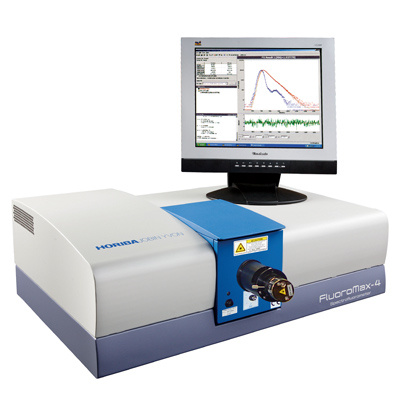
HORIBA(中国)为您提供《水中荧光检测方案(分子荧光光谱)》,该方案主要用于环境水(除海水)中荧光检测,参考标准--,《水中荧光检测方案(分子荧光光谱)》用到的仪器有HORIBA高灵敏一体式FluoroMax-4荧光光谱仪
推荐专场
相关方案
更多
该厂商其他方案
更多