


方案详情
文
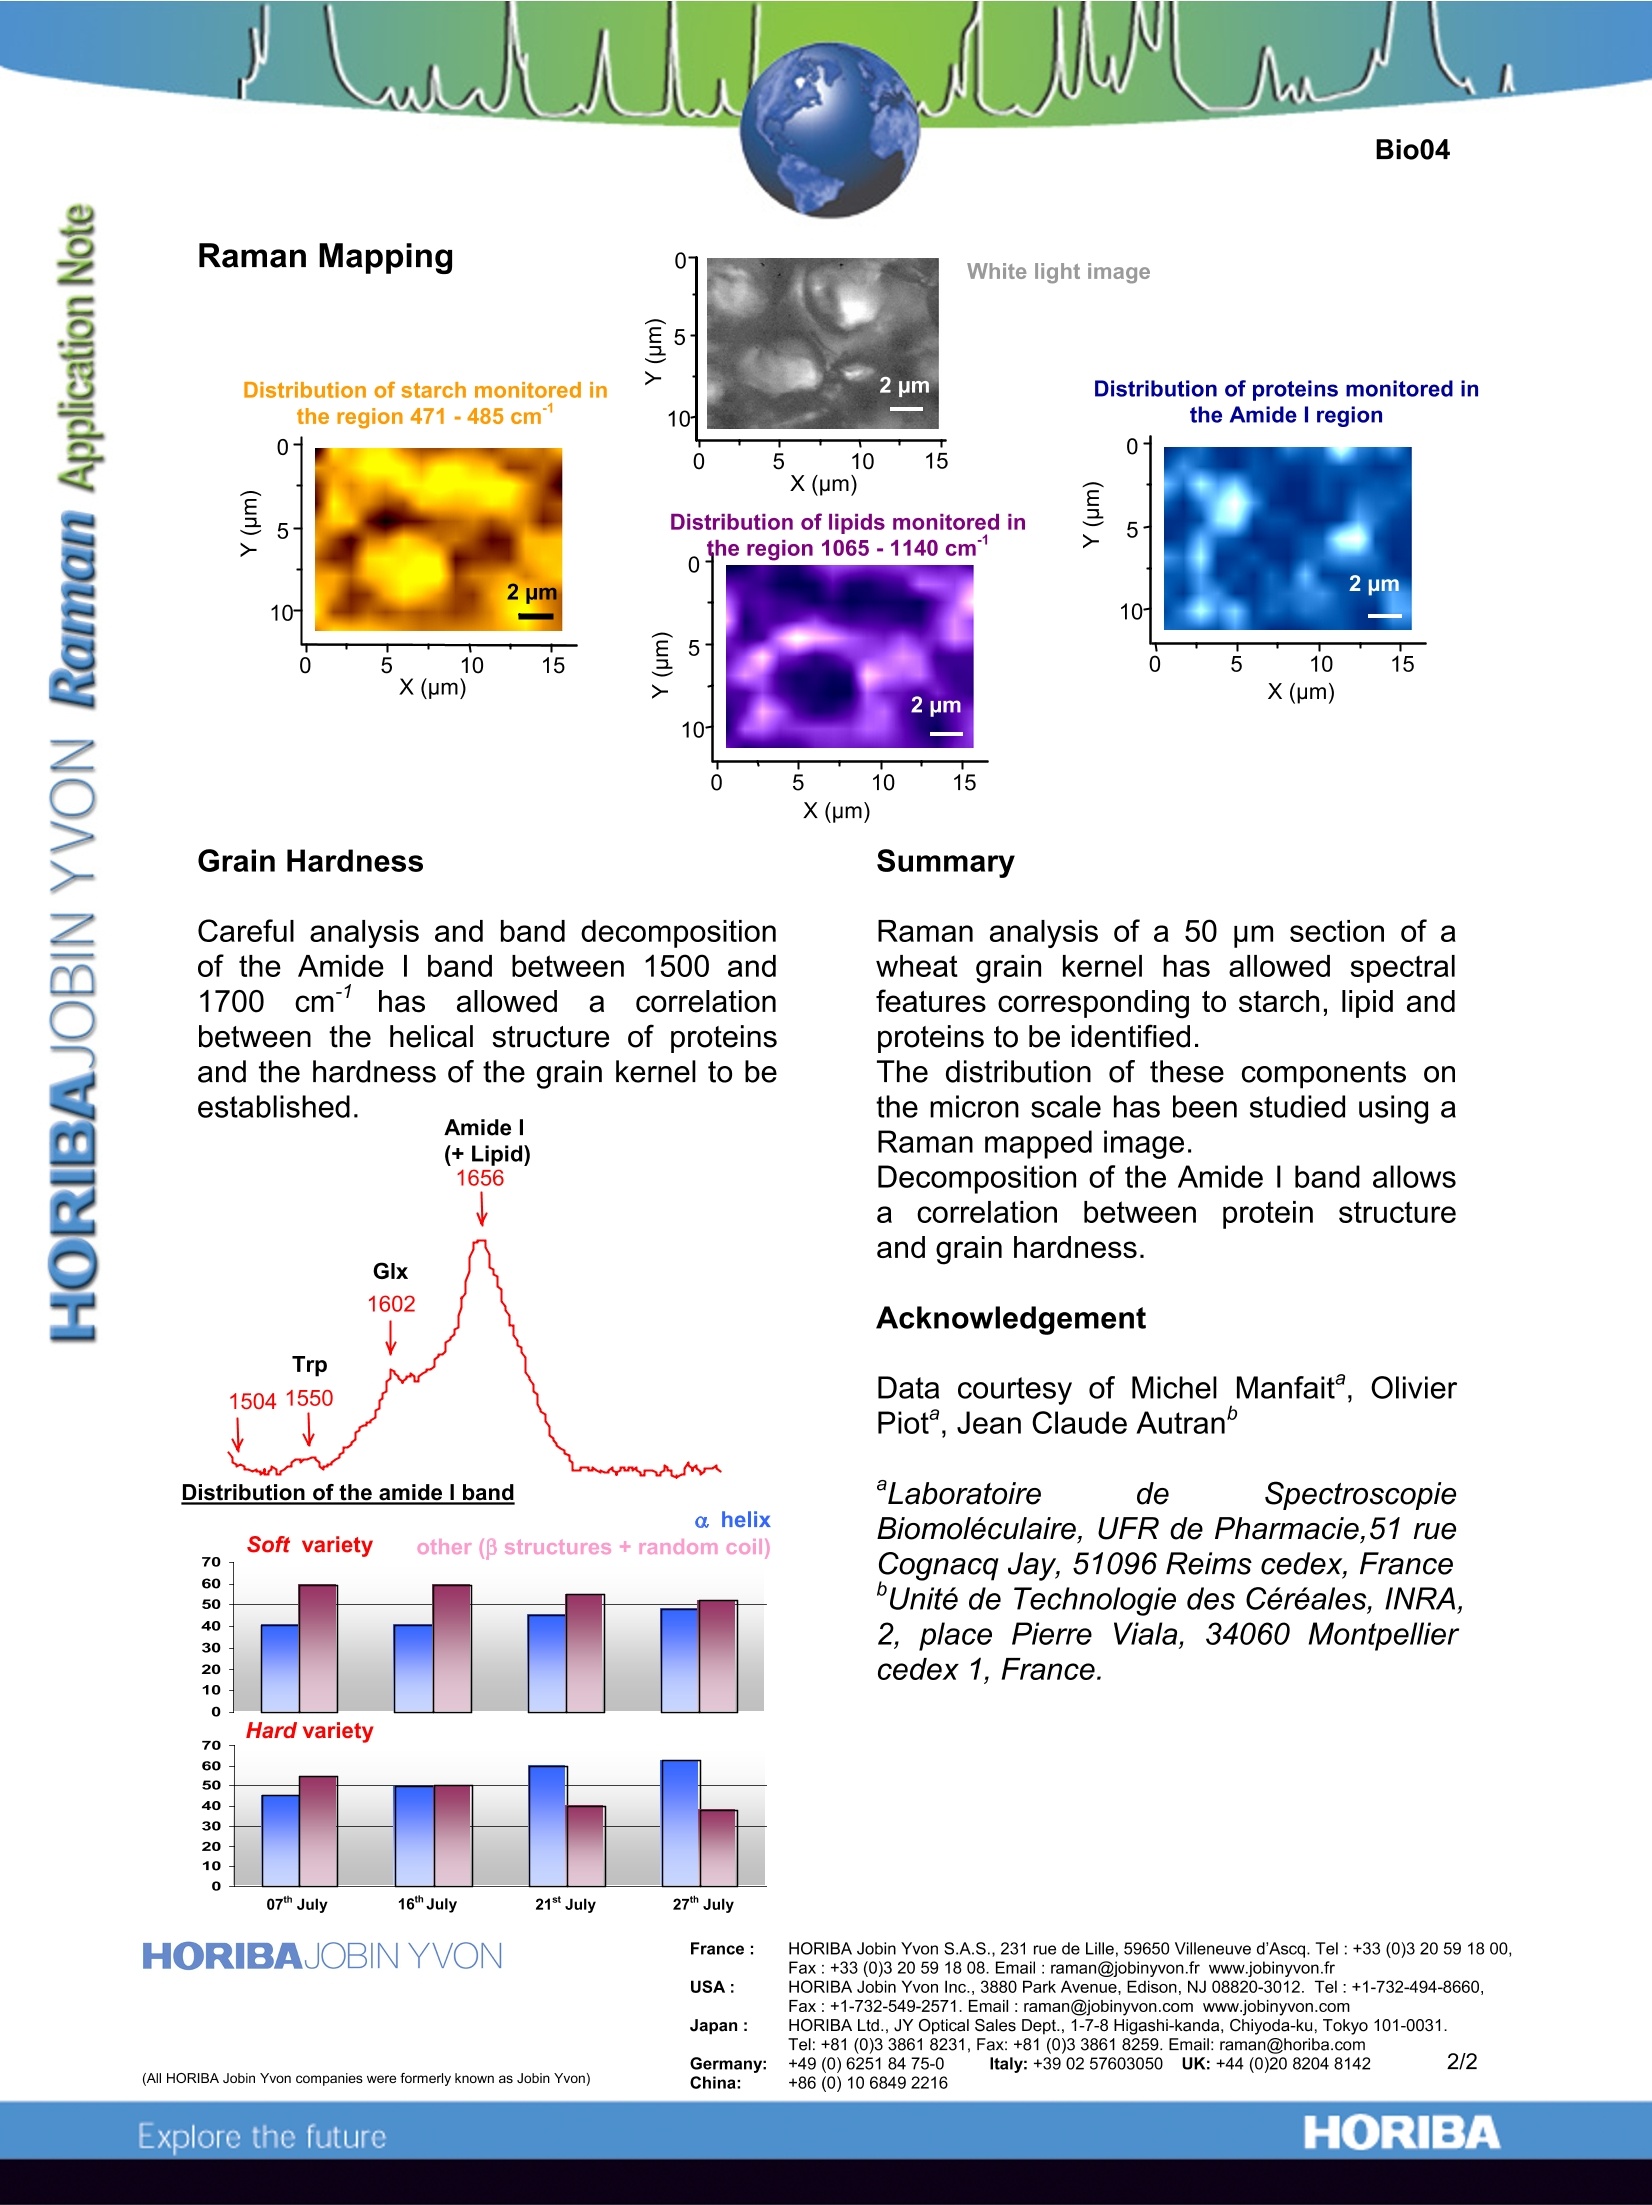
Raman analysis of a 50 μm section of a wheat grain kernel has allowed spectral features corresponding to starch, lipid and proteins to be identified.
The distribution of these components on the micron scale has been studied using a Raman mapped image.
Decomposition of the Amide I band allows a correlation between protein structure and grain hardness.
方案详情

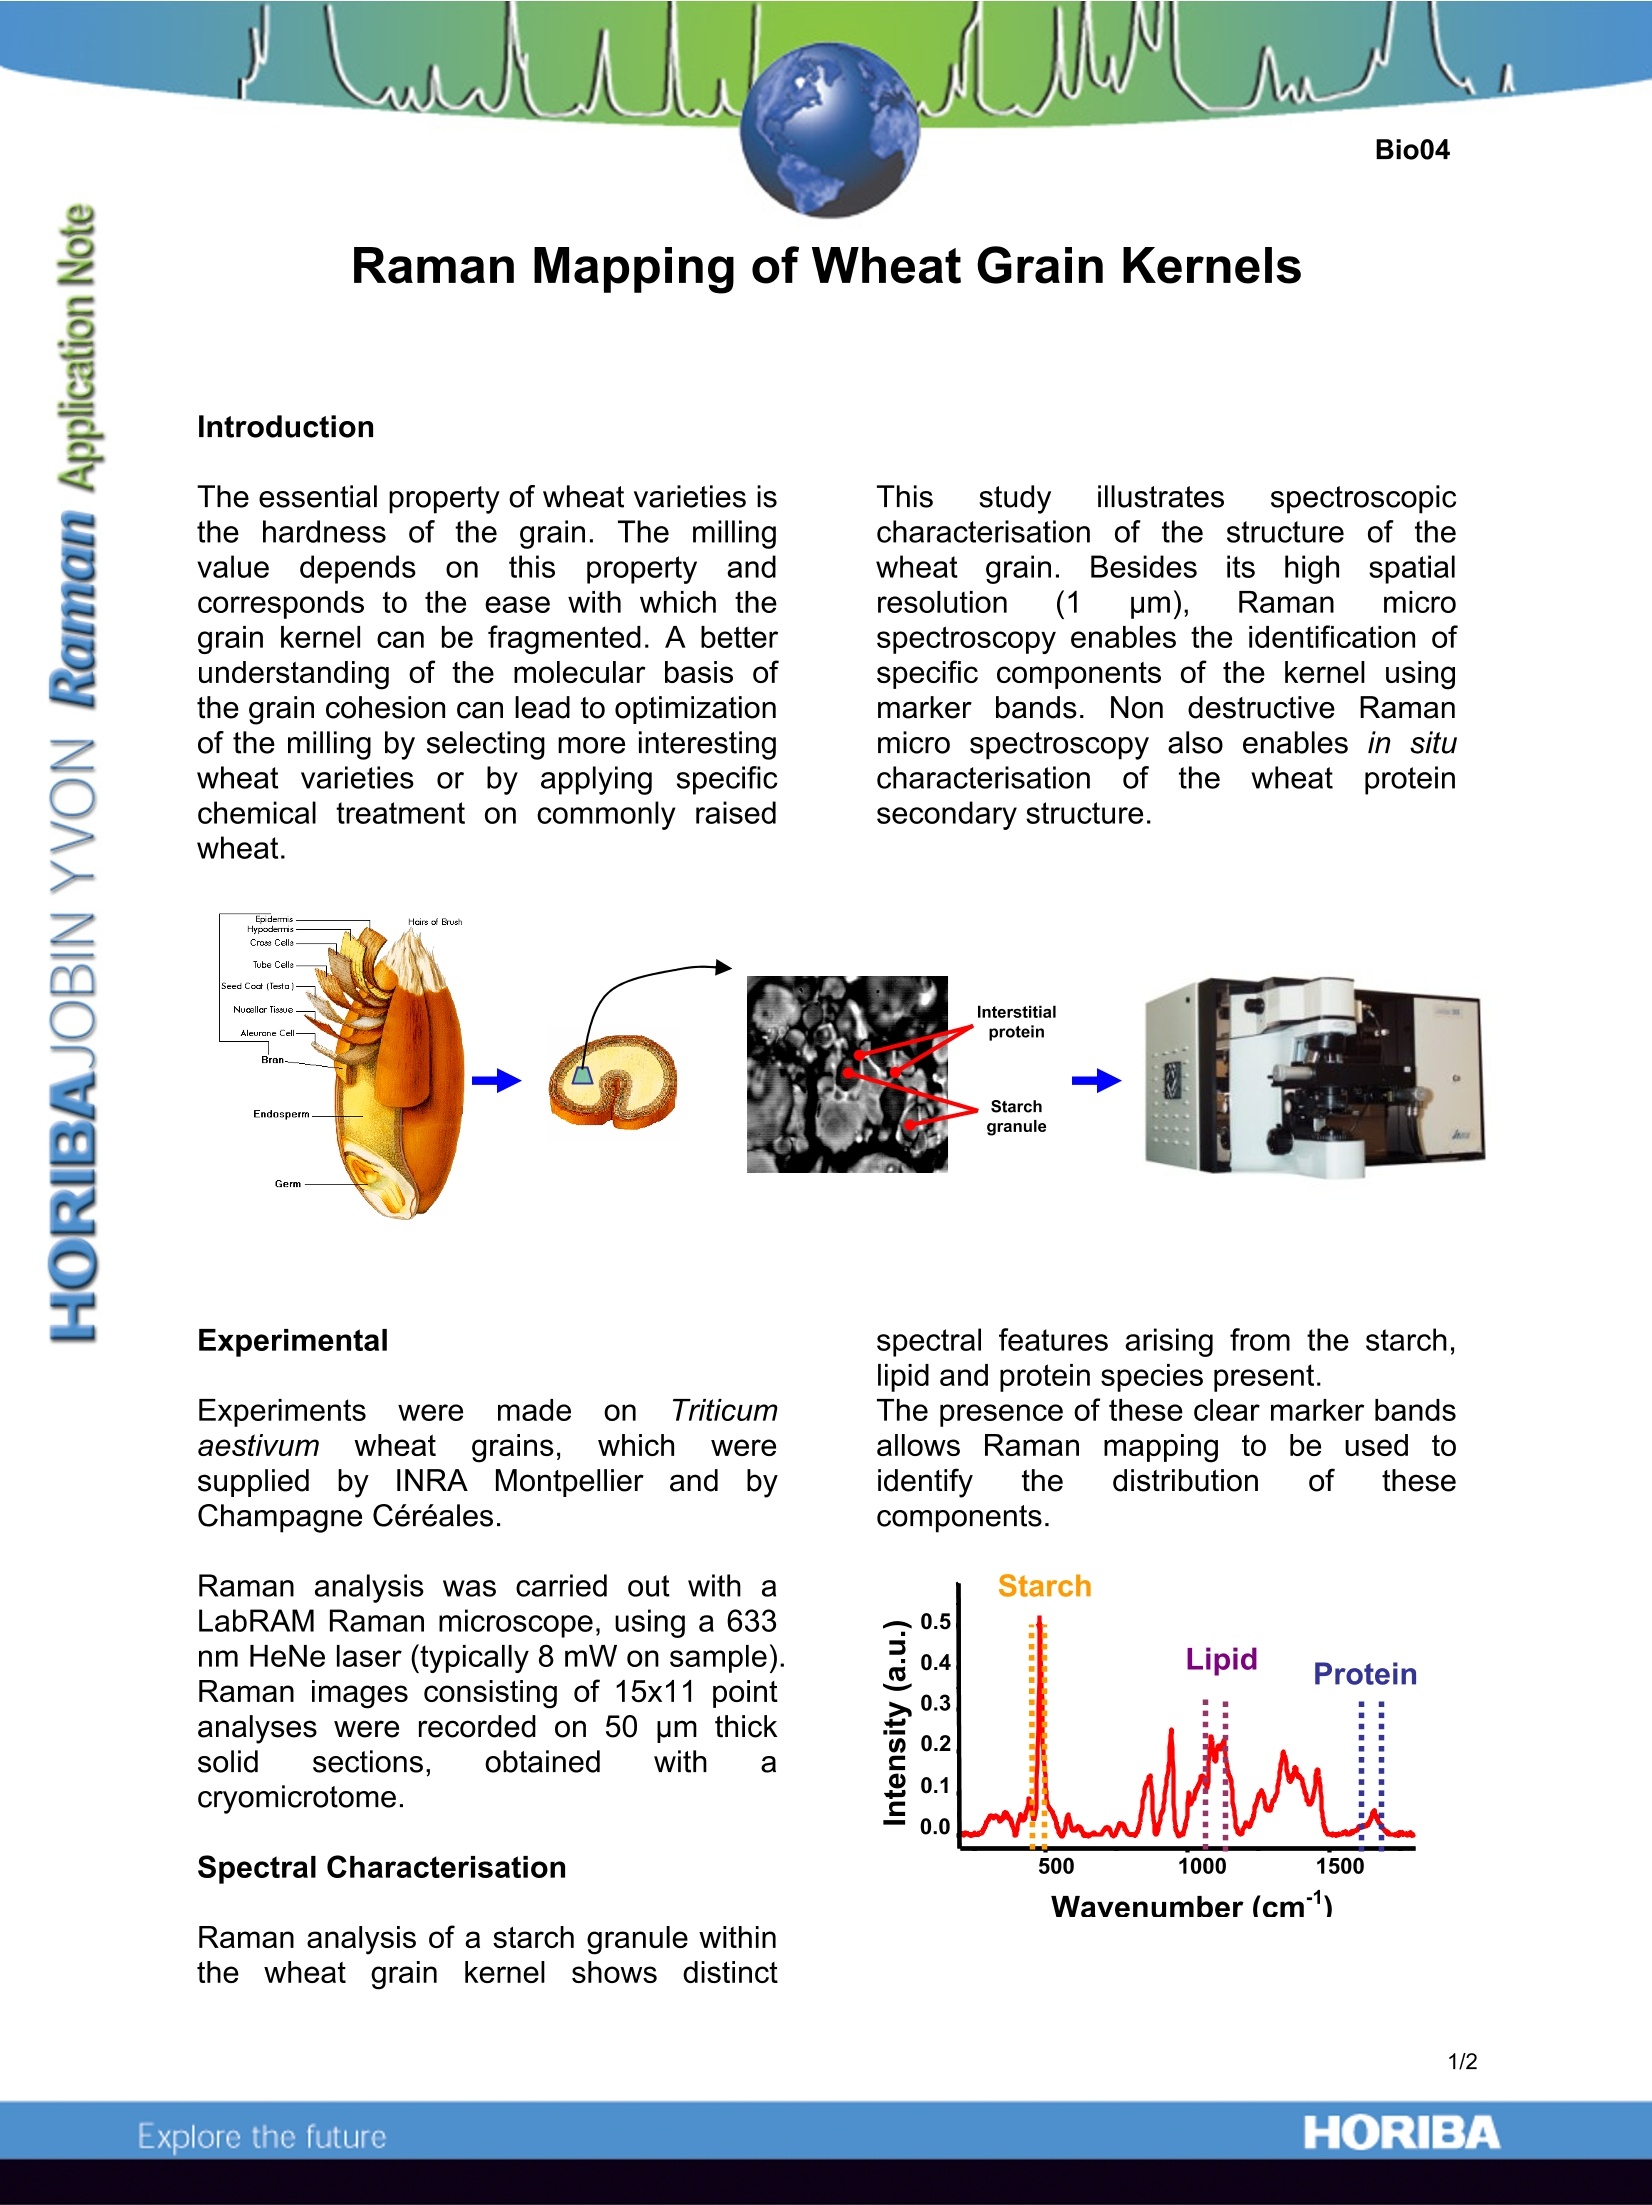
Raman Mapping of Wheat Grain Kernels The essential property of wheat varieties isthe hardness of the grain. The millingvalue dependss onthis property andcorresponds to the ease with which thegrain kernel can be fragmented. A betterunderstanding of the molecular basis ofthe grain cohesion can lead to optimizationof the milling by selecting more interestingwheat varieties or by applying specificchemical treatment on commonly raisedwheat. This studyillustrates spectroscopiccharacterisation of the structure of thewheat grain. Besides itsi high1:spatialresolution (1 um), Raman microspectroscopy enables the identification ofspecific components of the kernel usingmarker bands. Non destructive Ramanmicro spectroscopy also enables in situcharacterisation ofthewheat rproteinsecondary structure. ypode CrossC Experimental Experiments werenmadeecon Triticumaestivumwheat grains,which Weresuppliedby INRAAMontpellier andbyChampagne Cereales. Raman analysis was carried out with aLabRAM Raman microscope, using a 633nm HeNe laser (typically 8 mW on sample).Raman images consisting of 15x11 pointanalyses were recorded on 50 pm thicksolid sections. obtained with acryomicrotome. Spectral Characterisation Raman analysis of a starch granule withinthewheat grain kernelshows distinct spectral features arising from the starch,lipid and protein species present. The presence of these clear marker bandsallows Raman mappingiia to be used toidentify the distribution f thesecomponents. Wavenumber (cm") Raman Mapping 0- White light image Distribution of starch monitored inthe region 471 -485 cm" Distribution of proteins monitored in x (um) Grain Hardness Summary Raman analysis of a 50 pm section of awheat grain kernel has allowed spectralfeatures corresponding to starch, lipid andproteins to be identified. The distribution of these components onthe micron scale has been studied using aRaman mapped image. Decomposition of the AmideI band allowsa correlation between protein structureand grain hardness. Acknowledgement Data courtesy of Michel Manfait, OlivierPiot, Jean Claude Autran° Laboratoire de SpectroscopieBiomoleculaire, UFR de Pharmacie,51 rueCognacq Jay, 51096 Reims cedex, FranceUnite de Technologie des Cereales,INRA,2, place Pierre Viala, 34060 Montpelliercedex 1, France. France : HORIBA Jobin Yvon S.A.S., 231 rue de Lille, 59650 Villeneuve d'Ascq. Tel:+33 (0)3 20 59 18 00 ( F ax:+33 (0 ) 3 20 59 18 08. E m ail : r a man@jobinyvon.fr www.jobinyvon.fr ) , HORIBA Jobin Yvon Inc., 3880 Park Avenue, Edison, NJ 08820-3012. Tel:+1-732-494-8660, Fax:+1-732-549-2571.Email : raman@jobinyvon.com www.jobinyvon.comJapan: HORIBA Ltd., JY Optical Sales Dept., 1-7-8 Higashi-kanda, Chiyoda-ku, Tokyo 101-0031.Tel:+81 (0)33861 8231,Fax: +81 (0)3 3861 8259. Email: raman@horiba.com Germany: +49 (0)62518475-0 Italy: +39 0257603050 UK: +44 (0)20 8204 8142 2/2 ORIBAExplore the future (All HORIBA Jobin Yvon companies were formerly known as Jobin Yvon)China: +() ORIBAExplore the future Raman analysis of a 50 µm section of a wheat grain kernel has allowed spectral features corresponding to starch, lipid and proteins to be identified. The distribution of these components on the micron scale has been studied using a Raman mapped image. Decomposition of the Amide I band allows a correlation between protein structure and grain hardness.
确定
还剩1页未读,是否继续阅读?

HORIBA(中国)为您提供《小麦核中化学组成检测方案(激光拉曼光谱)》,该方案主要用于饲料中理化分析检测,参考标准--,《小麦核中化学组成检测方案(激光拉曼光谱)》用到的仪器有
相关方案
更多