


方案详情
文
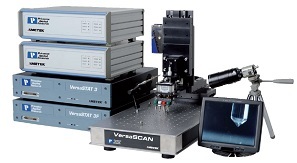
光谱电化学有机结合电化学和光谱技术。Gamry的光谱电化学系统将分光光度计和Gamry电化学工作站有机结合。每个系统都采用了微形CCD光谱仪,USB3.0通信和温度补偿。115E和115U能够轻松配置吸收或发射测试。其中钨光源光谱范围200-2500纳米。具备200-1100纳米的钨光源,可以和D2和W的光源兼容。光源包括安全快门。
方案详情

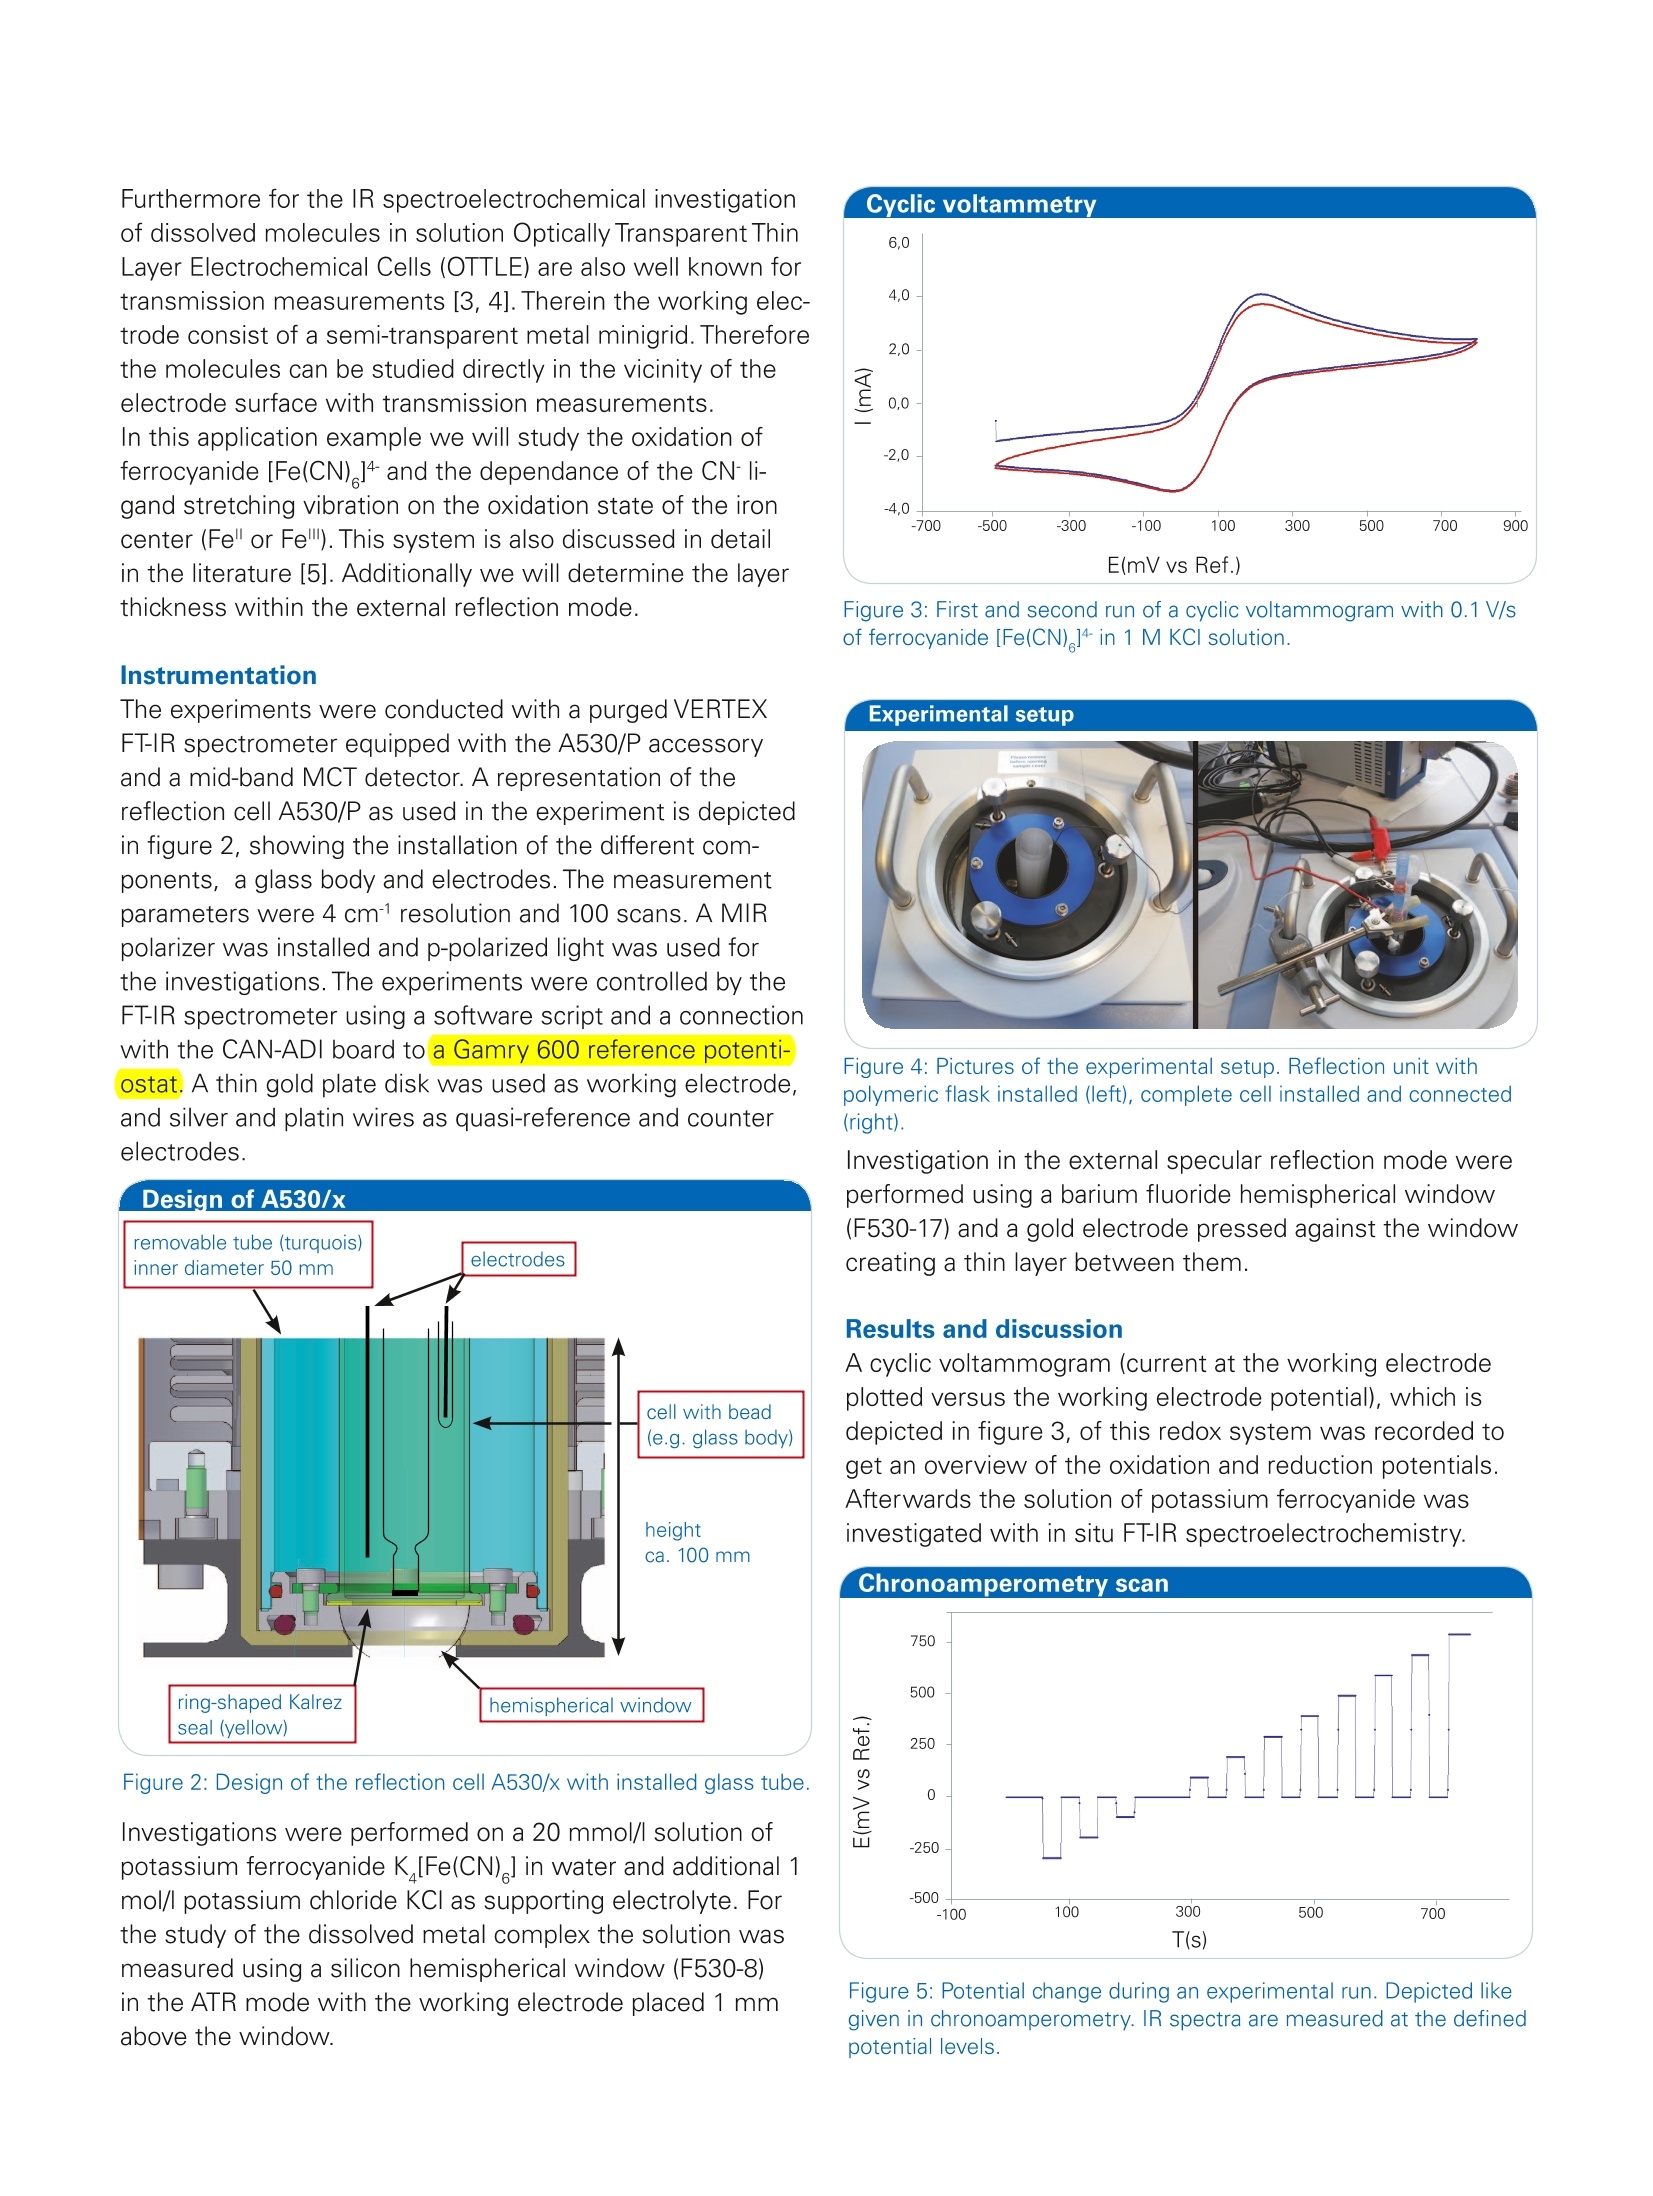
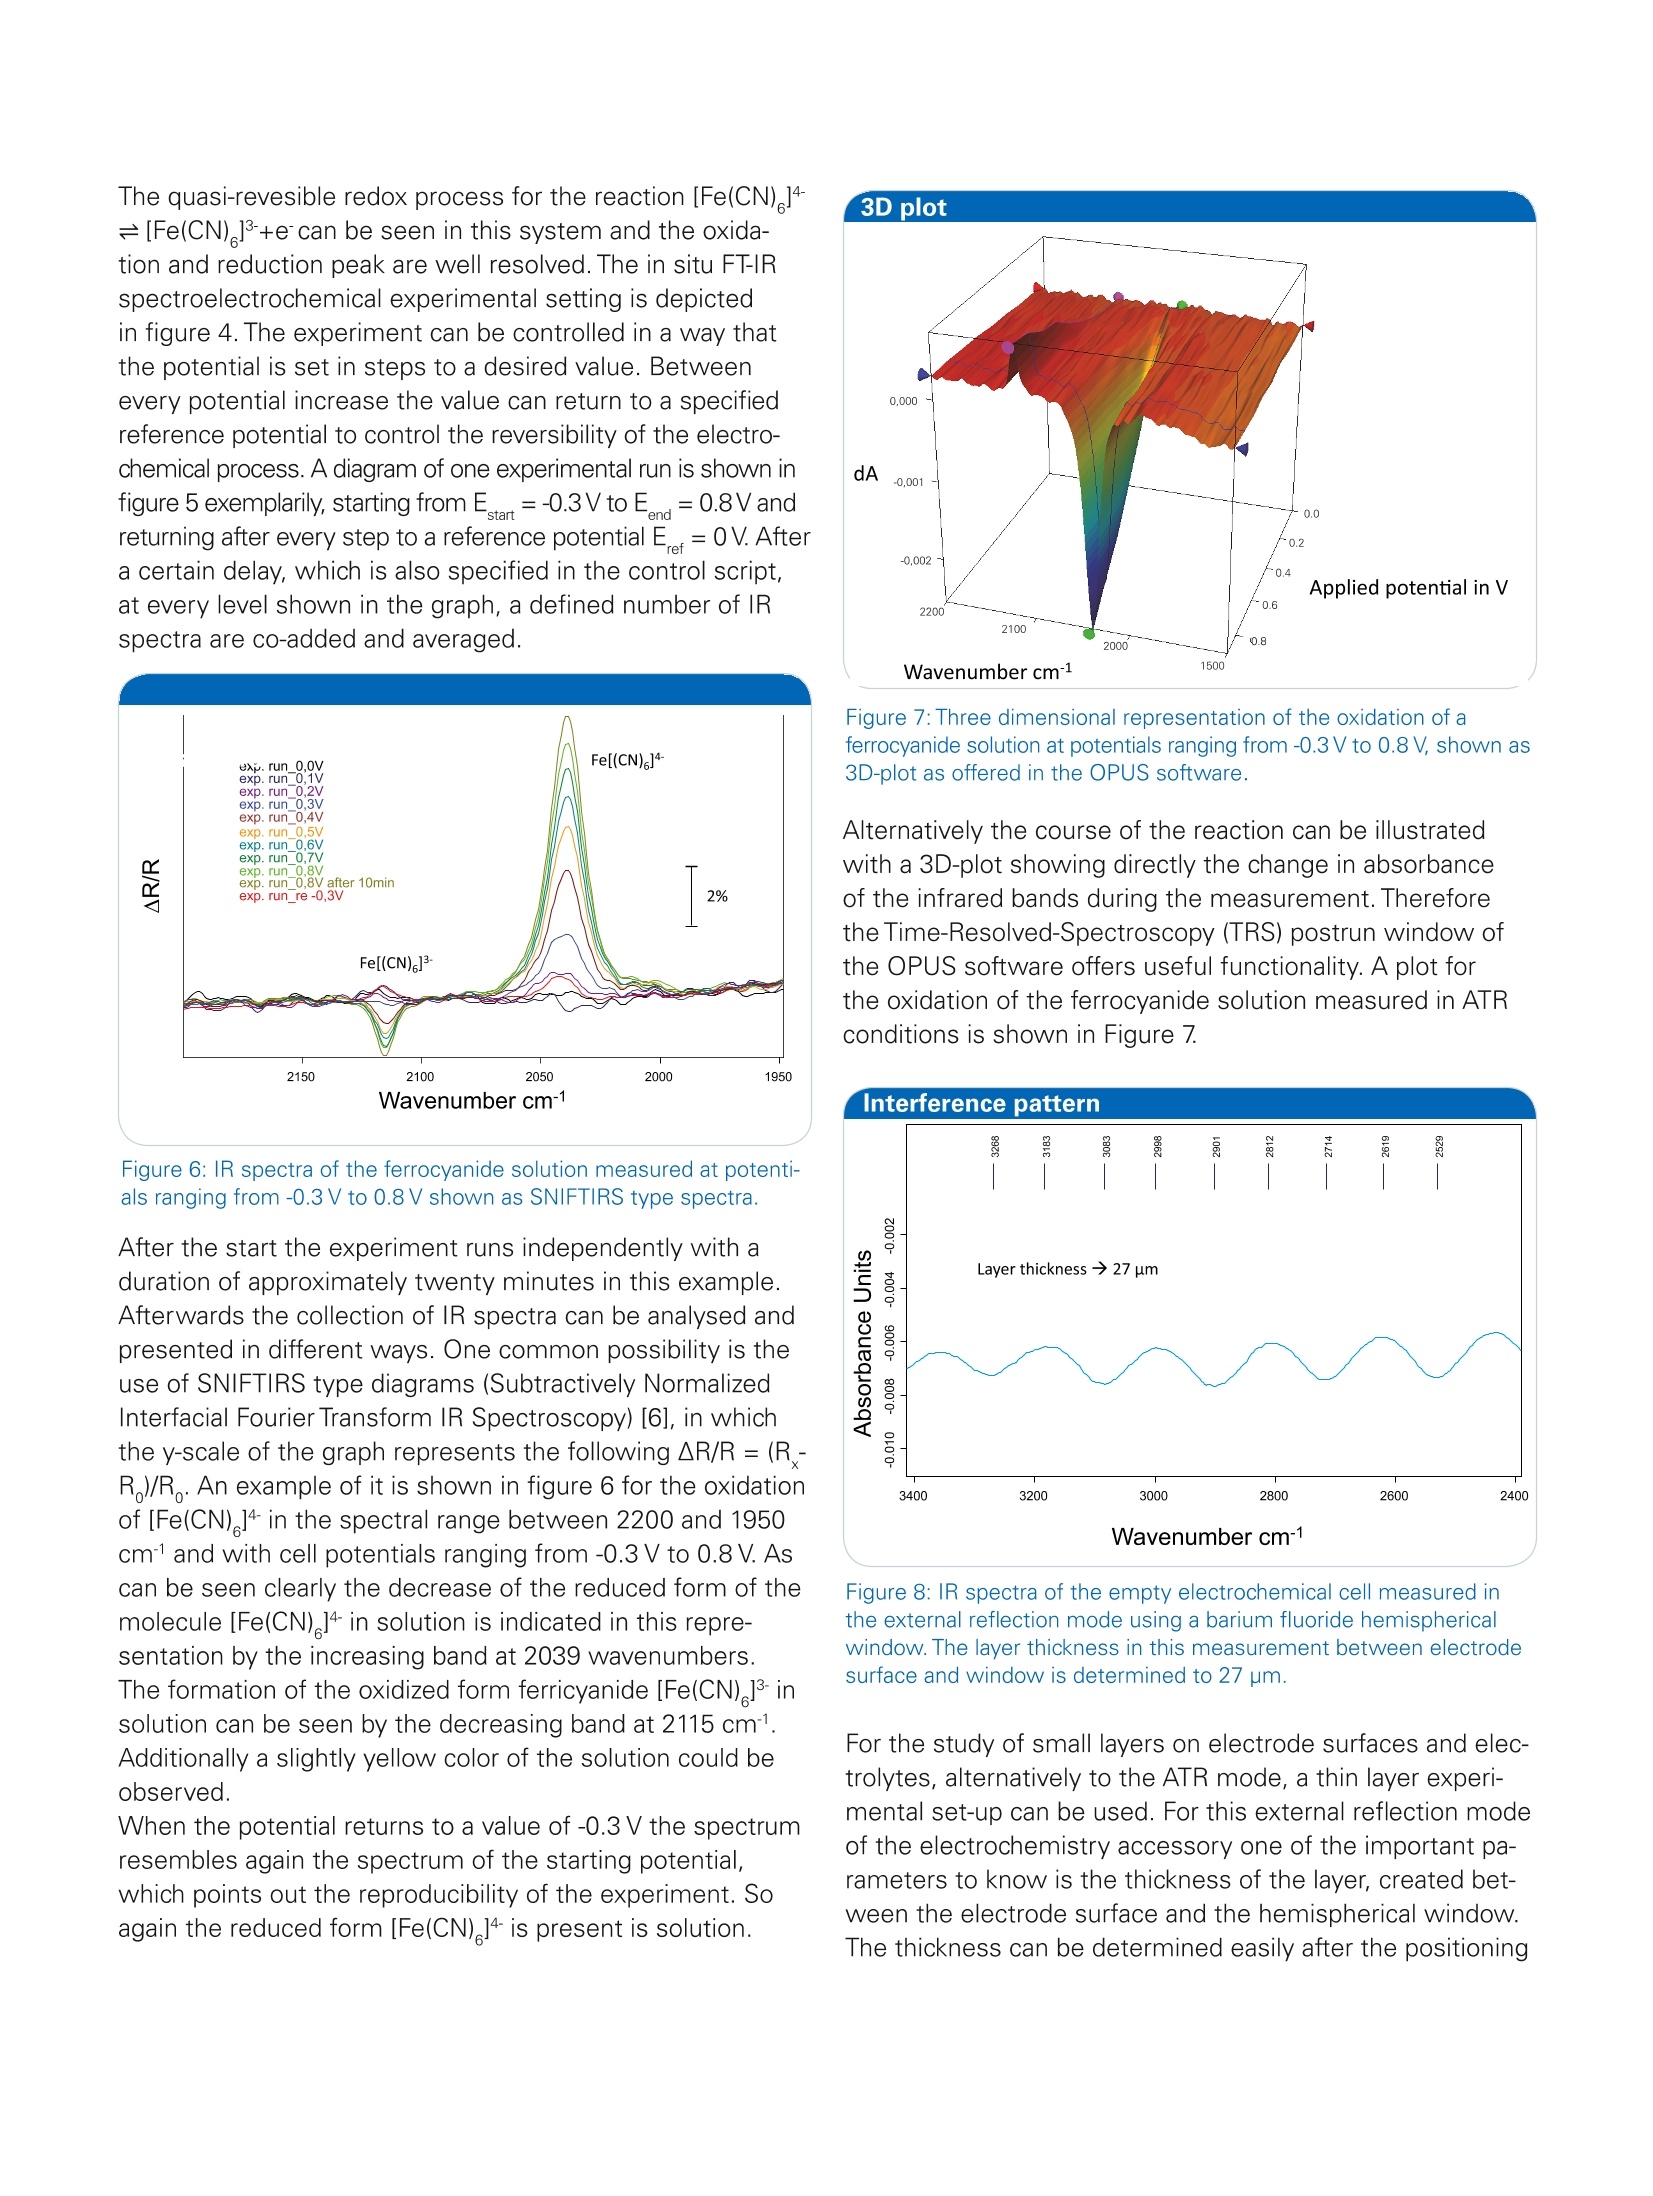
Bruker Optics is continually improving its products and reserves the right to change specifications without notice.◎ 2015 Bruker Optics BOPT-40004000757-01 Application Note #AN125 In Situ FT-IR Spectroelectrochemistry: Experimental Set-up for the Investigations of Solutes and Electrode Surfaces Electrochemical investigations are a very current topic inresearch. In recent times advancement in technology andindustry results in a world-wide increasing energy consump-tion. A future requirement to face this trend is the develop-ment of high capacity and as well low weight rechargeablebatteries for energy storage. Therefore studies of electrolytesystems or electrode surfaces are of great importance forpossible further improvements. Also in other fields, like biochemistry or catalysis,electroche-mistry is of great benefit to get access to information of mo-lecules, depending on an applied electrochemical potential.For example of the redox-active center in biomolecules [1],the reaction behavior of catalysts or the formation of carbonoxides during alcohol oxidation. The combination of FT-IR spectroscopy with electrochemi-stry offers insight in the molecular change and the reactionprocess of the studied molecules in addition to the electro-chemical response of the experiment. This valuable me-thod can be applied for investigations of electrolytes or ofelectrode surfaces.With the BRUKER A530/x reflection unitprepared for electrochemical cells the opportunity is givento study both [2]. For an external IR reflection-absorbancespectroscopy (IRRAS) set-up a thin layer configuration isused which allows the study of the electrolyte and theelectrode surface. Alternatively an internal reflection ATRset-up can be used to analyze the electrode surface direct-ly with limited influence of the electrolyte (see figure 1). Keywords Instrumentation and Software Electrode surface VERTEX Electrolyte A530/x reflection unit Internal reflection Potentiostat External reflection CAN-ADI board Potential modulation VB-script potentiostat control FT-IR spectroelectro- chemistry Figure 1: Different measurement modes of the A530/x reflection unit.On the left side external reflection (materials: CaF,, BaF,), on the rightside internal reflection (materials: Ge, Si). Furthermore for the IR spectroelectrochemical investigationof dissolved molecules in solution Optically Transparent ThinLayer Electrochemical Cells (OTTLE) are also well known fortransmission measurements [3, 4]. Therein the working elec-trode consist of a semi-transparent metal minigrid.Thereforethe molecules can be studied directly in the vicinity of theelectrode surface with transmission measurements. In this application example we will study the oxidation of ferrocyanide [Fe(CN)]4 and the dependance of the CN- li- gand stretching vibration on the oxidation state of the iron center (Fe"or Fe). This system is also discussed in detail in the literature [5].Additionally we will determine the layer thickness within the external reflection mode. Instrumentation The experiments were conducted with a purged VERTEXFT-IR spectrometer equipped with the A530/P accessoryand a mid-band MCT detector. A representation of thereflection cell A530/P as used in the experiment is depictedin figure 2, showing the installation of the different com-ponents, a glass body and electrodes. The measurementparameters were 4 cm1 resolution and 100 scans. A MIRpolarizer was installed and p-polarized light was used forthe investigations. The experiments were controlled by theFT-IR spectrometer using a software script and a connectionwith the CAN-ADI board to a Gamry 600 reference potenti-ostat. A thin gold plate disk was used as working electrode,and silver and platin wires as quasi-reference and counterelectrodes. Figure 2: Design of the reflection cell A530/x with installed glass tube. Investigations were performed on a 20 mmol/l solution ofpotassium ferrocyanide K [Fe(CN) ] in water and additional 1mol/l potassium chloride KCl as supporting electrolyte. Forthe study of the dissolved metal complex the solution wasmeasured using a silicon hemispherical window (F530-8)in the ATR mode with the working electrode placed 1 mmabove the window. Figure 3: First and second run of a cyclic voltammogram with 0.1 V/sof ferrocyanide [Fe(CN)]4 in 1 M KCI solution. Figure 4: Pictures of the experimental setup. Reflection unit withpolymeric flask installed (left), complete cell installed and connected(right). Investigation in the external specular reflection mode wereperformed using a barium fluoride hemispherical window(F530-17) and a gold electrode pressed against the windowcreating a thin layer between them. Results and discussion A cyclic voltammogram (current at the working electrodeplotted versus the working electrode potential), which isdepicted in figure 3, of this redox system was recorded toget an overview of the oxidation and reduction potentials.Afterwards the solution of potassium ferrocyanide wasinvestigated with in situ FT-IR spectroelectrochemistry. Figure 5: Potential change during an experimental run. Depicted likegiven in chronoamperometry. IR spectra are measured at the definedpotential levels. The quasi-revesible redox process for the reaction [Fe(CN) ]4=[Fe(CN)+e can be seen in this system and the oxida-tion and reduction peak are well resolved. The in situ FT-IRspectroelectrochemical experimental setting is depictedin figure 4. The experiment can be controlled in a way thatthe potential is set in steps to a desired value. Betweenevery potential increase the value can return to a specifiedreference potential to control the reversibility of the electro-chemical process. A diagram of one experimental run is shown infigure 5 exemplarily, starting from Estart =-0.3V to Eend=0.8Vandreturning after every step to a reference potential E =0V. Aftera certain delay, which is also specified in the control script,at every level shown in the graph, a defined number of IRspectra are co-added and averaged. Figure 6: IR spectra of the ferrocyanide solution measured at potenti-als ranging from -0.3 V to 0.8 V shown as SNIFTIRS type spectra. After the start the experiment runs independently with aduration of approximately twenty minutes in this example.Afterwards the collection of IR spectra can be analysed andpresented in different ways. One common possibility is theuse of SNIFTIRS type diagrams (Subtractively NormalizedInterfacial Fourier Transform IR Spectroscopy) [6], in whichthe y-scale of the graph represents the following R/R=(R -R )/R. An example of it is shown in figure 6 for the oxidationof [Fe(CN) ]4 in the spectral range between 2200 and 1950cm- and with cell potentials ranging from -0.3 V to 0.8V. Ascan be seen clearly the decrease of the reduced form of themolecule [Fe(CN) ]4 in solution is indicated in this repre-sentation by the increasing band at 2039 wavenumbers.The formation of the oxidized form ferricyanide[Fe(CN)] insolution can be seen by the decreasing band at 2115 cm1.Additionally a slightly yellow color of the solution could beobserved.When the potential returns to a value of -0.3 V the spectrum resembles again the spectrum of the starting potential,which points out the reproducibility of the experiment. Soagain the reduced form [Fe(CN)]4 is present is solution. Figure 7: Three dimensional representation of the oxidation of aferrocyanide solution at potentials ranging from -0.3 V to 0.8V, shown as3D-plot as offered in the OPUS software. Alternatively the course of the reaction can be illustratedwith a 3D-plot showing directly the change in absorbanceof the infrared bands during the measurement. Thereforethe Time-Resolved-Spectroscopy (TRS) postrun window ofthe OPUS software offers useful functionality. A plot forthe oxidation of the ferrocyanide solution measured in ATRconditions is shown in Figure 7. Figure 8: IR spectra of the empty electrochemical cell measured inthe external reflection mode using a barium fluoride hemisphericalwindow. The layer thickness in this measurement between electrodesurface and window is determined to 27 um. For the study of small layers on electrode surfaces and elec-trolytes, alternatively to the ATR mode, a thin layer experi-mental set-up can be used. For this external reflection modeof the electrochemistry accessory one of the important pa-rameters to know is the thickness of the layer, created bet-ween the electrode surface and the hemispherical window.The thickness can be determined easily after the positioning of the metal working electrode on top of the hemisphericalwindow (low refractive material) and prior to the addition ofthe electrolyte. For the determination the interferences areused which arise from the IR beam path going through theflat surface of the hemispherical window of the cell. Figure 7shows the interference pattern without electrolyte in the cellwhich calculates a layer thickness of 27 pm. The path lengthcan be determined easily with the Layer Thickness functionas integrated in the OPUS software.By doubling this valuefor the IR path (in and out of the electrochemical cell), theIR beam would penetrate about 50 pm of the electrolytesolution during the measurement. The electrochemical oxidation of a metallic complex, ferrocy-anide [Fe(CN)]4 was studied with FT-IR spectroelectroche-mistry. This combined analysis method offers the possibilityto investigate the molecular change of this compounddepending on the applied electrochemical potential. Theoxidation to ferricyanide [Fe(CN)]-was illustrated in theform of a SNIFTIRS spectrum and a 3D-plot with the OPUSsoftware. One main advantage of the set-up reported hereis, that the potentiostat and the spectrometer are connectedby the CAN-ADI board and a VB-script for an all-over commu-nication is used. After setting the experimental parametersand the desired potential procedure, the measurement canbe simply started in OPUS and will run automatically. Theresulting spectra will be well sorted and assigned to theircorresponding potential for subsequent evaluation. In theend, the technical realization of the combination of FT-IRspectroscopy and electrochemical investigations makes thein situ monitoring of electrochemical processes easy andreliable. ( References ) ( [ 1 ] C . Berth o mi e u , L . M a rbo u t i n , F . D u pe y ra t, P . Bo u y er,Bio po ly mer s 2 006 , 82(4), 3 63 - 367 . ) ( [ 2 ] Br u ke r Prod u ct No t e M 14 0 -0 8 / 1 2 : A 5 3 0/P o r A 53 0/ V Refl e ction U nit p repared fo r E l ectrochemica l Cell. ) ( [ 3 ] B ru ker Ap pl i c a ti on N ote AN40 (D . A . M o ss , W. M ante l e ): F T -IR S p ec tro e le c tr och e m is t r y of P r ot e ins; ) [4] S. R. Domingos, H. Luyten ,F. van Anrooij, H.J. Sanders,B. H. Bakker, W. J. Buma, F. Hartl, S. Woutersen, Rev. Sci.Instrum. 2013,84,033103. ( [5] S. M. R os end ahl, F. B o r o nd i cs, T . E . M a y, T . M . Pede r s en an d l . J . Bu r gess Ana l . C he m. 2 011, 8 3 (10),3 63 2 -363 9 . ) ( [6] A. Ka bbabi, R . F a u re , R. D ur a nd , B . Bede n , F. Hahn, J. - M. Leg e r , C. L a m y, J . E lec t roan a l . C hem. 19 9 8 , 444, 1 -5 3. ) Bruker Optics Inc. Billerica, MA· USAPhone +1 (978) 439-9899Fax +1 (978) 663-9177info@brukeroptics.com www.bruker.com/optics Bruker Optik GmbH Ettlingen· DeutschlandPhone +49 (7243) 504-2000Fax+49 (7243)504-2050info@brukeroptics.de Bruker Hong Kong Ltd. ( Hong Kong P hone +852 2796-6100Fax +852 2796-6109 hk@brukeroptics.com.hk ) GAMRY Reference 600+软件功能强大,操作简便。硬件设计独特,性能稳定。GAMRY Reference 600+电化学综合测试仪可以满足电池、材料表征、生物传感器、电化学机理、点分析化学、腐蚀与防护、痕量物质检测、电化学合成等多种电化学研究领域。对每种测试都提供了完美的解决方案。GAMRY Reference 600+技术优势:(1) 电流分辨率高,20 aA,有实验数据证实。低电流到pA。(2) 仪器的背景电流小,<2 μV rms。(3) 仪器的高阻抗测试/低阻抗测试性能好,100TOHM, 0.1 mOHM 等。(4) 软件友好,容易学习,和功能全;可以扩展任何需要的电化学测量。(5) 再加一台仪器,可以和SECM, IMPS/IMVS 等兼容。(6) 和RAMNAN, UV, TEM, EQCM, RDE 等联用。(7) 浮地设计最好,可以和高压釜合用。(8) 有温度测试模块。(9) 软件自动编程,进行电化学测量。(10) EIS阻抗频率范围:10μHz到5 MHzReference 600+是典型的科学研究级电化学分析仪器,它使用USB接口,可以直接与便携式计算机和台式计算机连接,支持功能强大的Gamry应用软件包,例如DC105直流腐蚀软件包,PHE200物理电化学软件包,EIS300电化学阻抗谱软件包等,几乎涵盖所有电化学分析方法。Reference 600+电化学综合测试仪的输出电流范围从±600 mA至±60 pA,拥有11档电流范围和档位快速补偿能力。Reference 600+的输出电压为±22V,恒电位扫描电压为±11V。进行CV实验时,最快的扫描速率能达到1200V/s。这些特点保证了Reference 600+能够适应高腐蚀速率及具有良好导电能力溶液的电化学体系。Reference 600+的直接信号综合电路允许EIS频率扫描范围从10μHz到5 MHz,在1MHz情况下进行EIS测量时的误差小于2%,是真正意义上的高频电化学交流阻抗测试系统。强大的电压和电流信号过滤系统能保证在嘈杂的环境中得到稳定安静的测试环境。优异的稳定性保证即使电脑运行其他程序时也可正常工作。Reference 600+提供了独一无二的结合能力,具有电流中断和阳极反馈IR补偿能力。 Reference 600+ 的电化学软件Gamry为Reference600设计了一套完备的电化学应用软件程序。电化学试验在Gamry FrameworkTM上进行,其数据在电化学分析软件Echem AnalysTM中进行处理。PWR800电化学能源软件包PWR800软件包为测试和表征能源存储和转化期间以及材料领域提供了标准测试技术。我们将大功率循环伏安,充电,放电,循环充放电,以及其他常用大电流测试组合起来。当然,您同样也可以采用Gamry序列测试将所需要的特殊测试按顺序组合起来。EIS电化学阻抗谱EIS对各种各样的应用来说是一个功能强大的工具,对PWR800软件极好的补充。Gamry开发的EIS软件—易于使用、程序简洁。它提供了许多不同EIS测试技术,包括恒电位、恒电流、混合控制模式。可使用单一正弦波测量,也可利用多重正弦波进行快速EIS的测量。同样来自于Gamry’s扩展软件包PHE200 物理电化学—一般电化学研究软件包。PV220 脉冲伏安—标准和可定制的脉冲实验。DC105 直流腐蚀—腐蚀测试过程中遇到的素有标准技术。ESA410 电化学信号分析—电化学噪声信号的获取和分析。EN120 电化学噪声—简单的噪声软件。EFM140 EFM—模拟Tafel常数和腐蚀速率。CPT110 临界点蚀温度—ASTM标准化测试。VFP600 可视前面板—基础电化学控制,成本低廉。
确定

还剩2页未读,是否继续阅读?

产品配置单
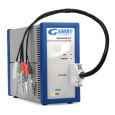
北京亿诚恒达科技有限公司为您提供《聚合物材料中成分检测方案(电化学工作站)》,该方案主要用于其他中成分检测,参考标准--,《聚合物材料中成分检测方案(电化学工作站)》用到的仪器有Reference 600电化学恒电位仪
推荐专场
相关方案
更多
该厂商其他方案
更多