


Greases are important lubricating systems that are very interesting to a rheologist since they often exhibit strongly time-dependent behavior [thixotropy], and are able to shear thin by several orders of magnitude in terms of they are to function as lubricants, and keep moving surfaces apart from each other, even at high relative velocities. Traditionally greases are measured in terms of base oil viscosity, pumpability [Lincoln Ventmeter] and via a penetrometer [amongst other tests!]. These test types all provide a single number or data points can be obtained under varying circumstances of say temperature or in that an unworked sample is compared with a worked sample, but too often the results form only a relative measure of the grease.
方案详情

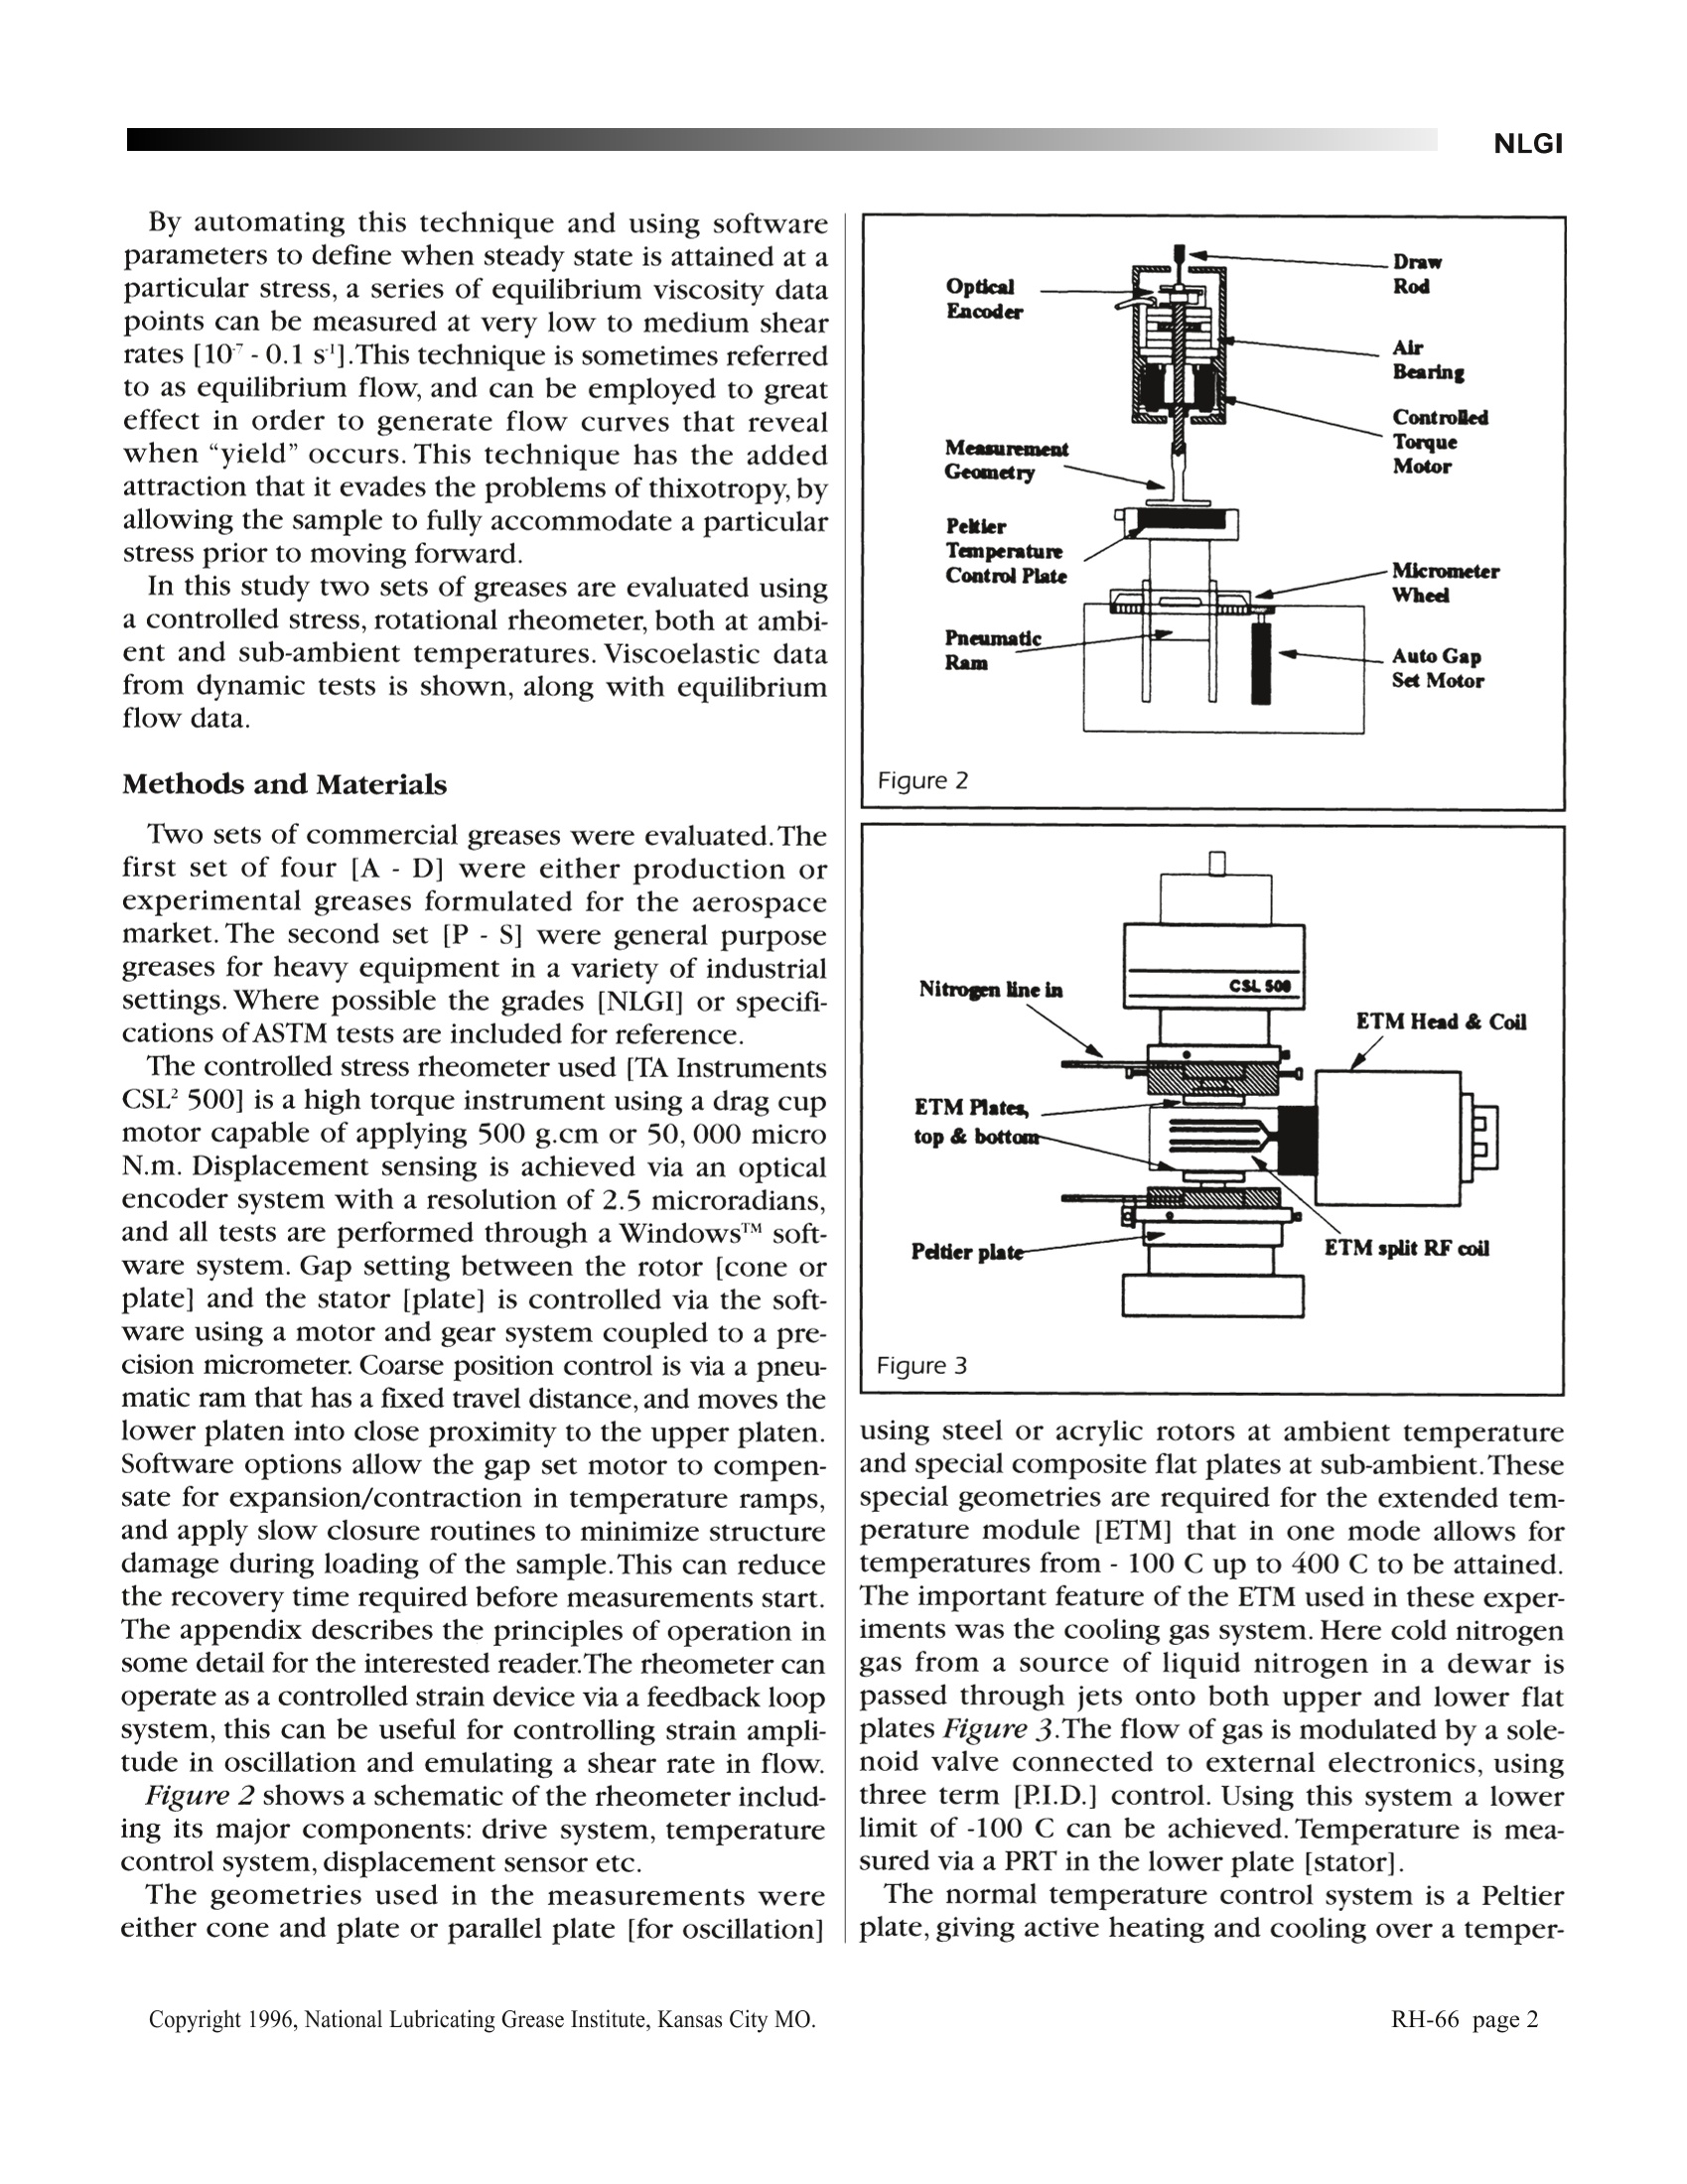
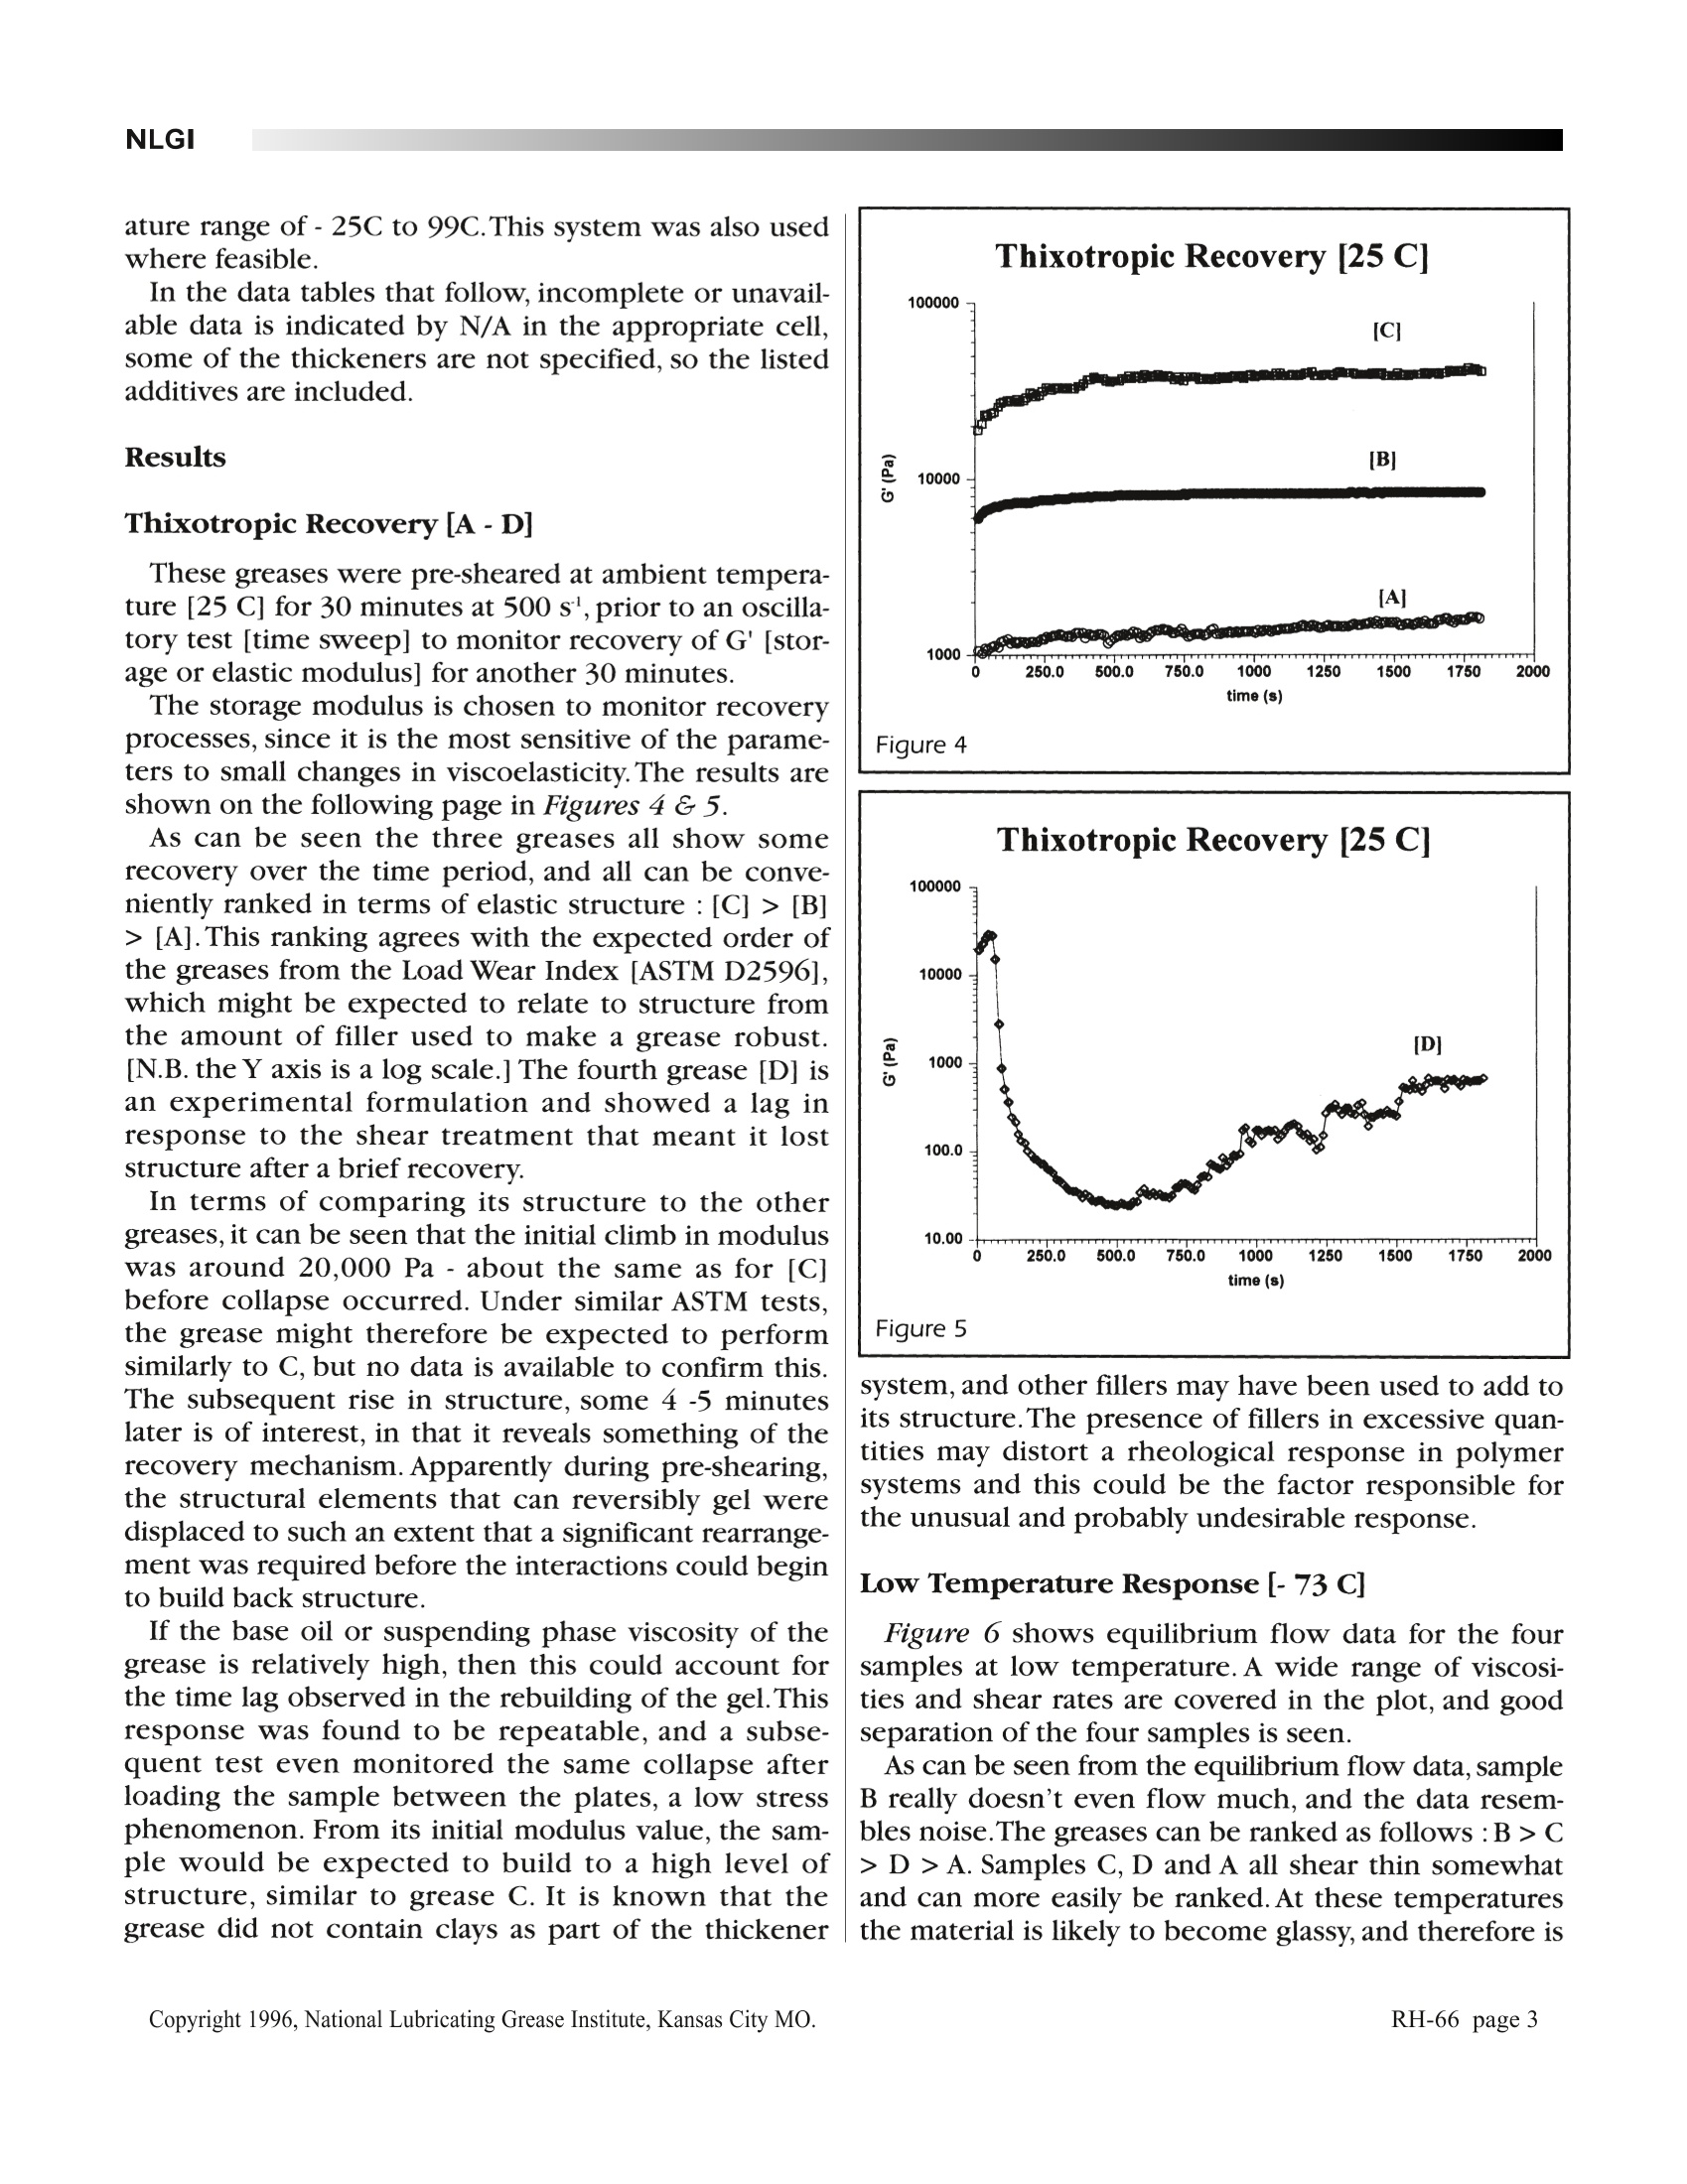
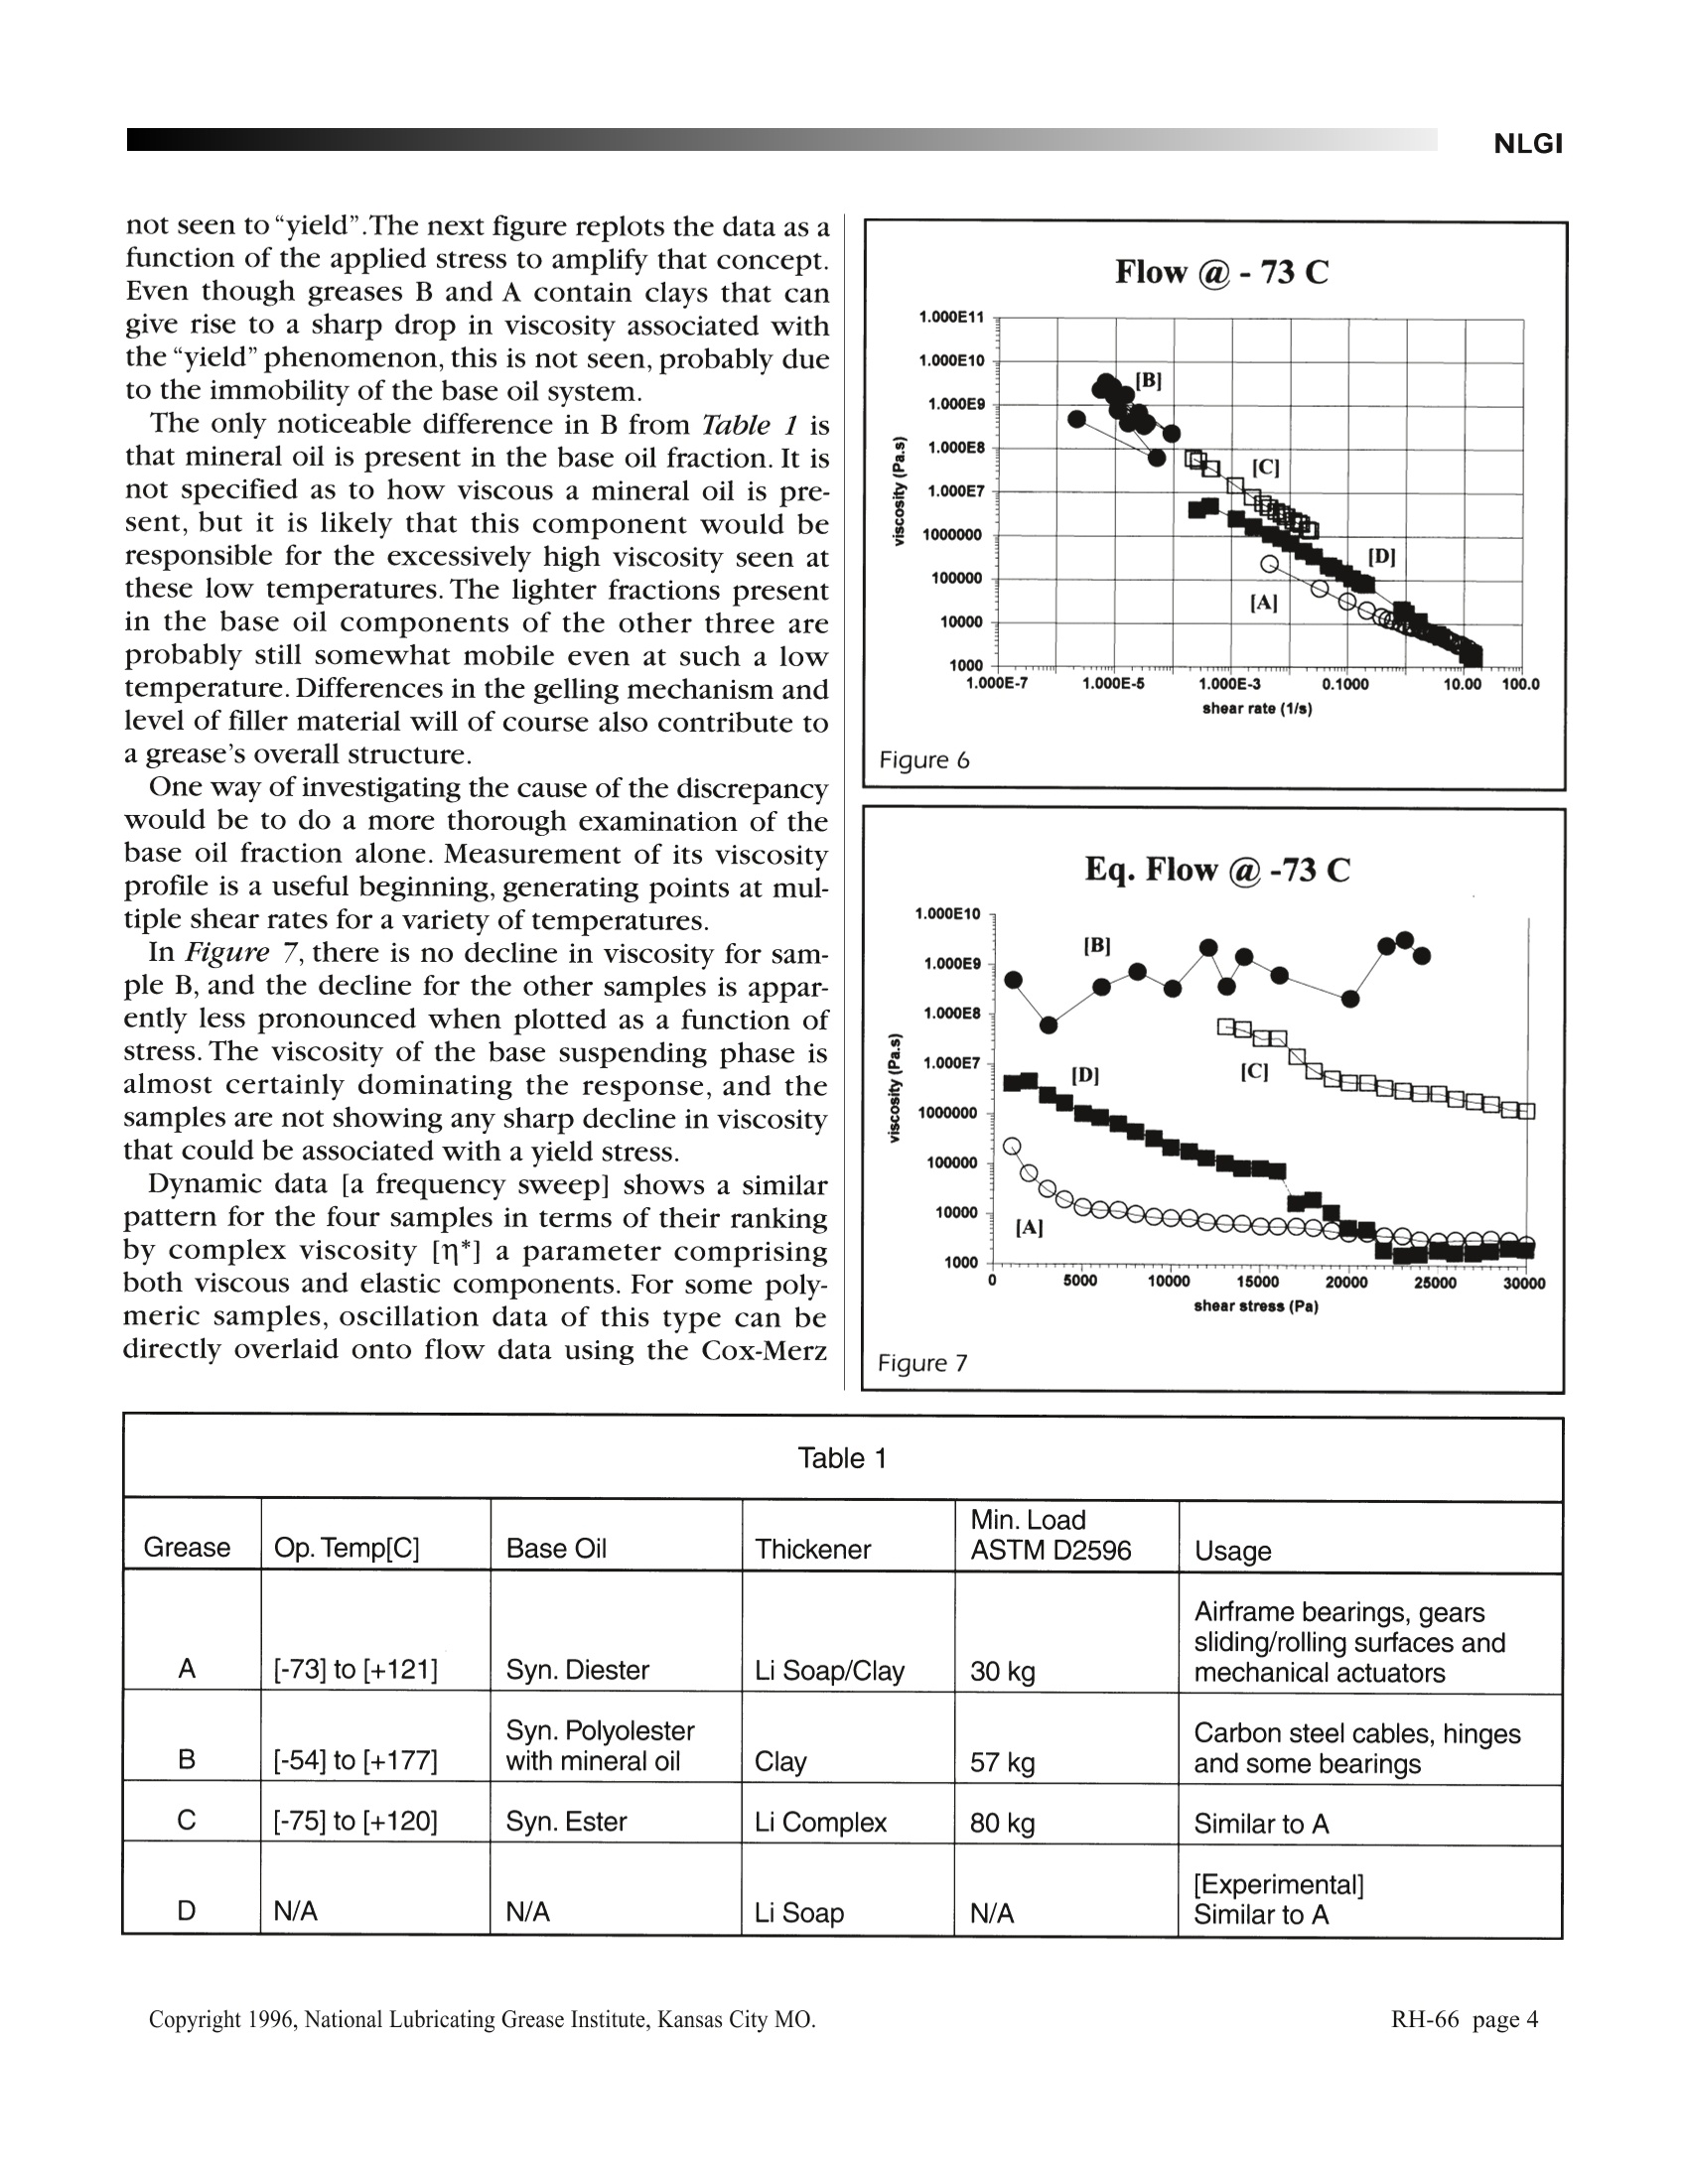
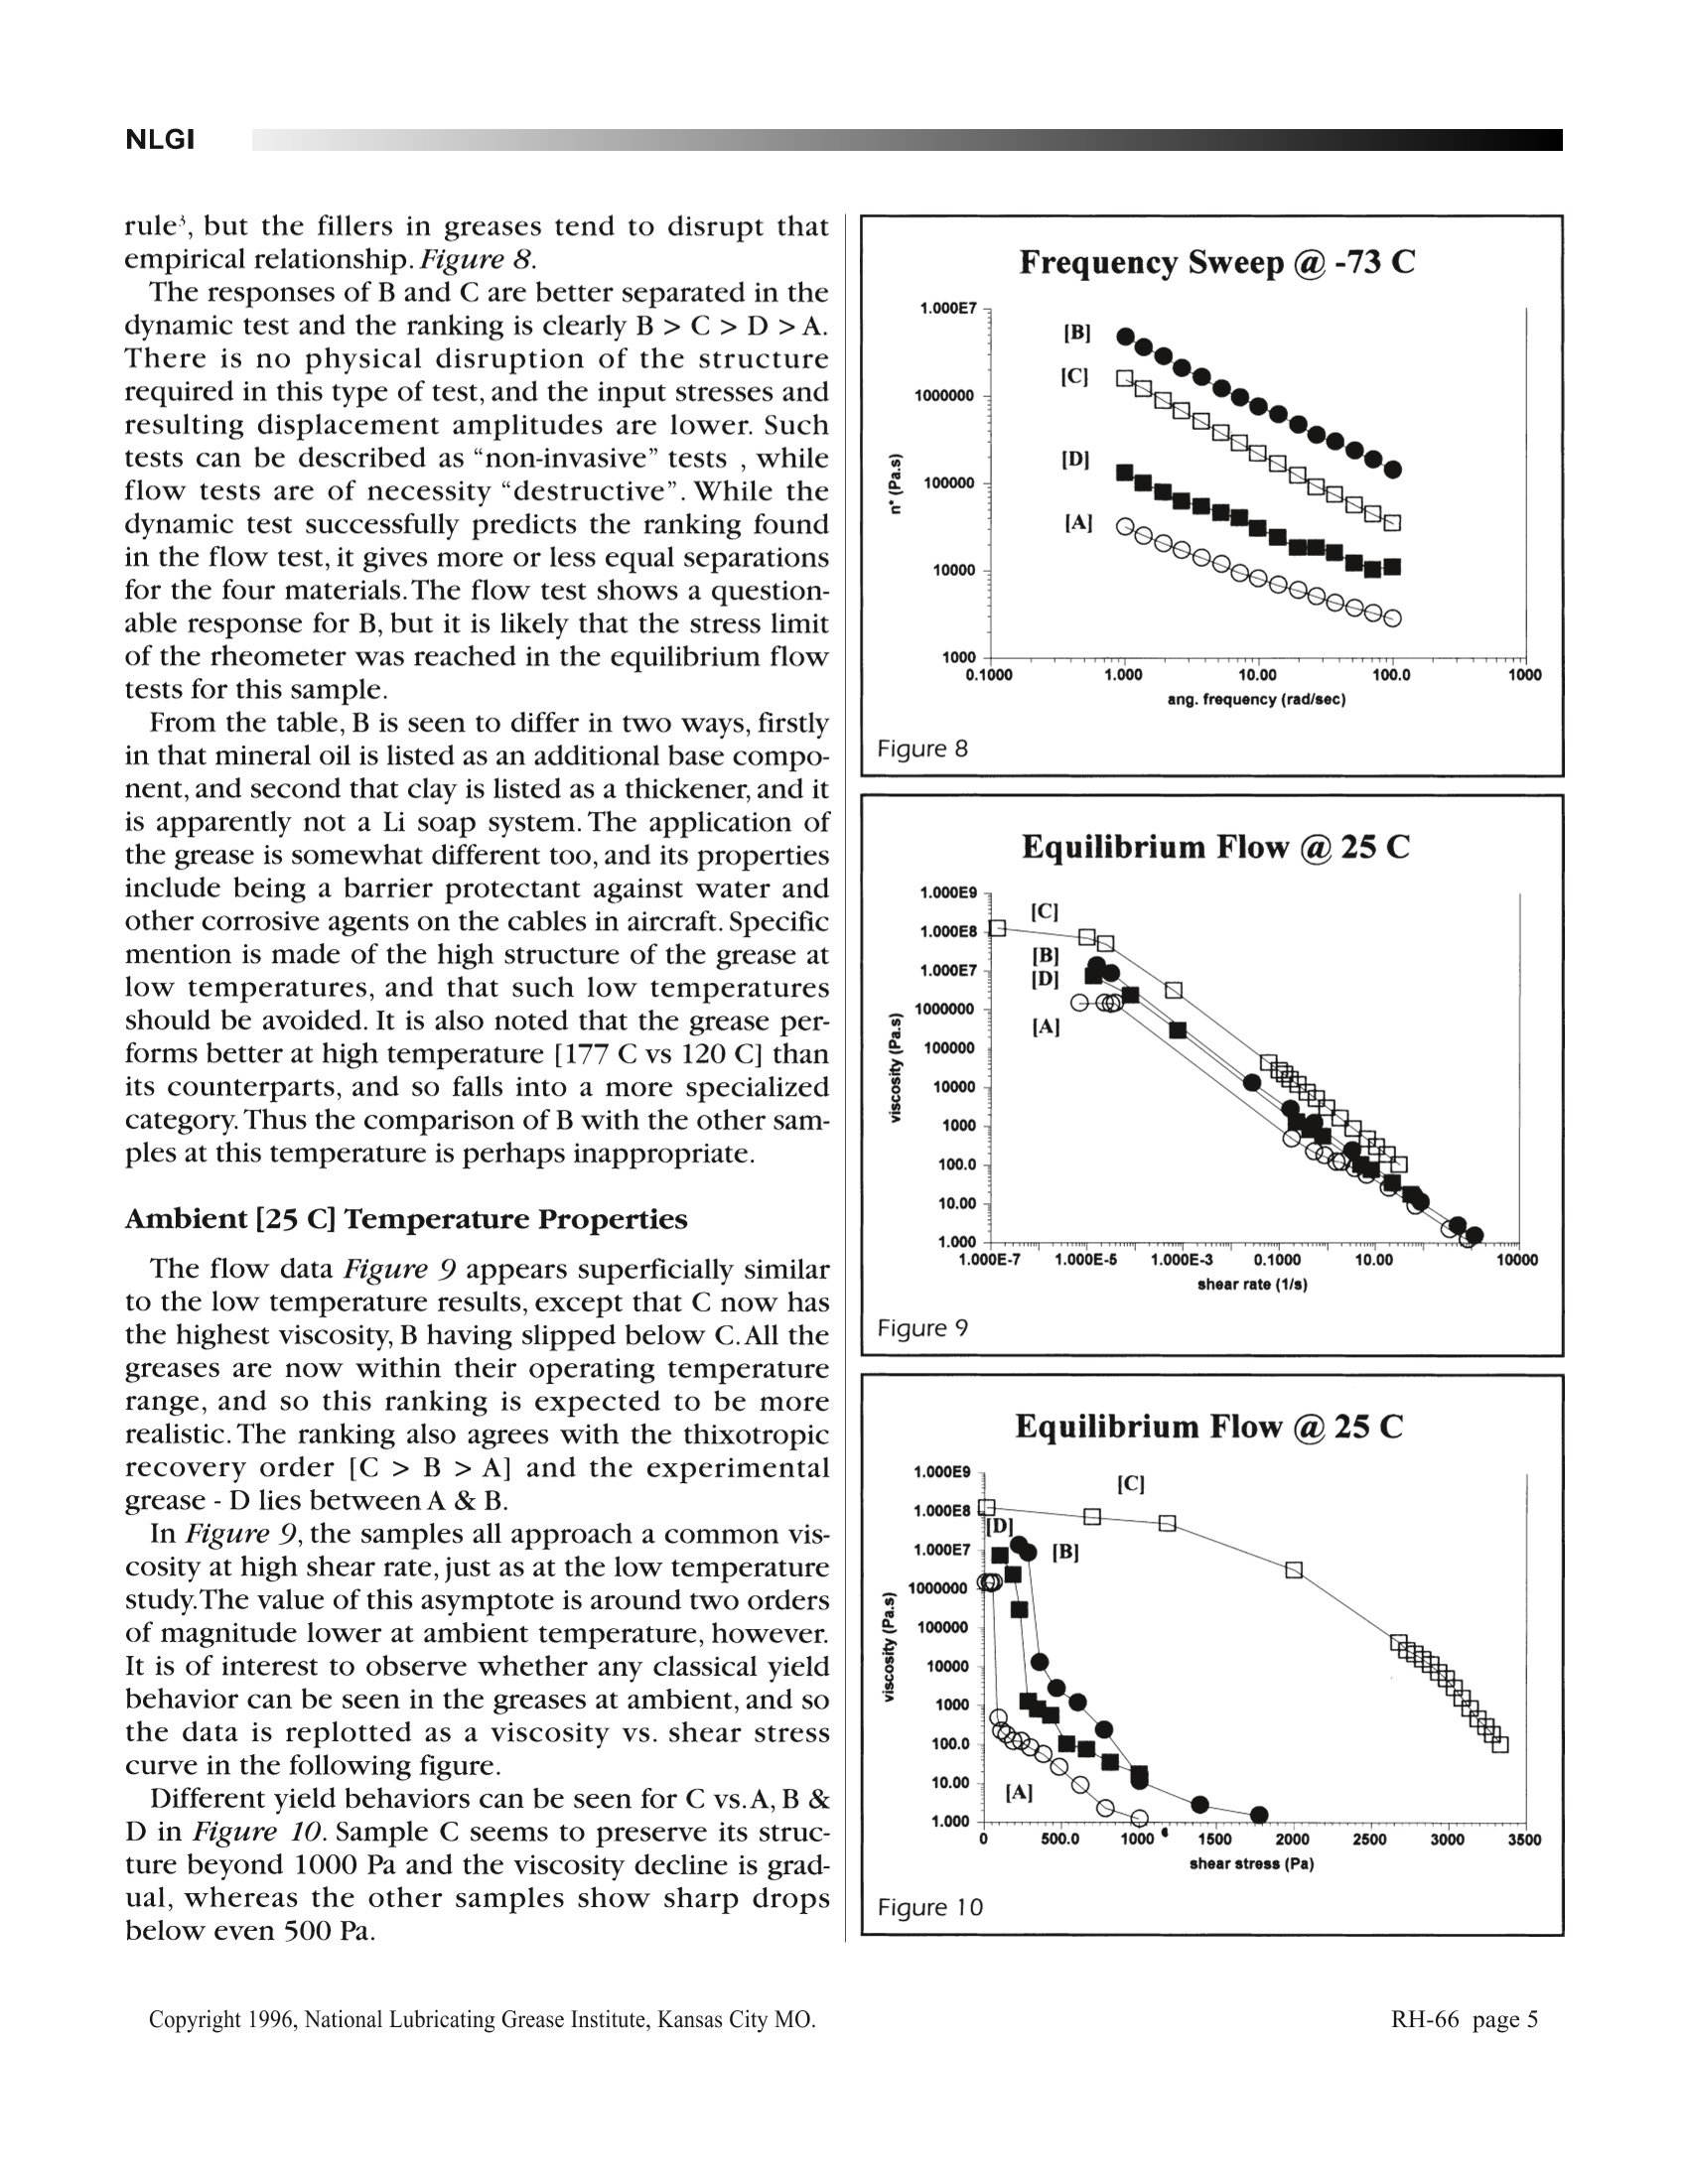
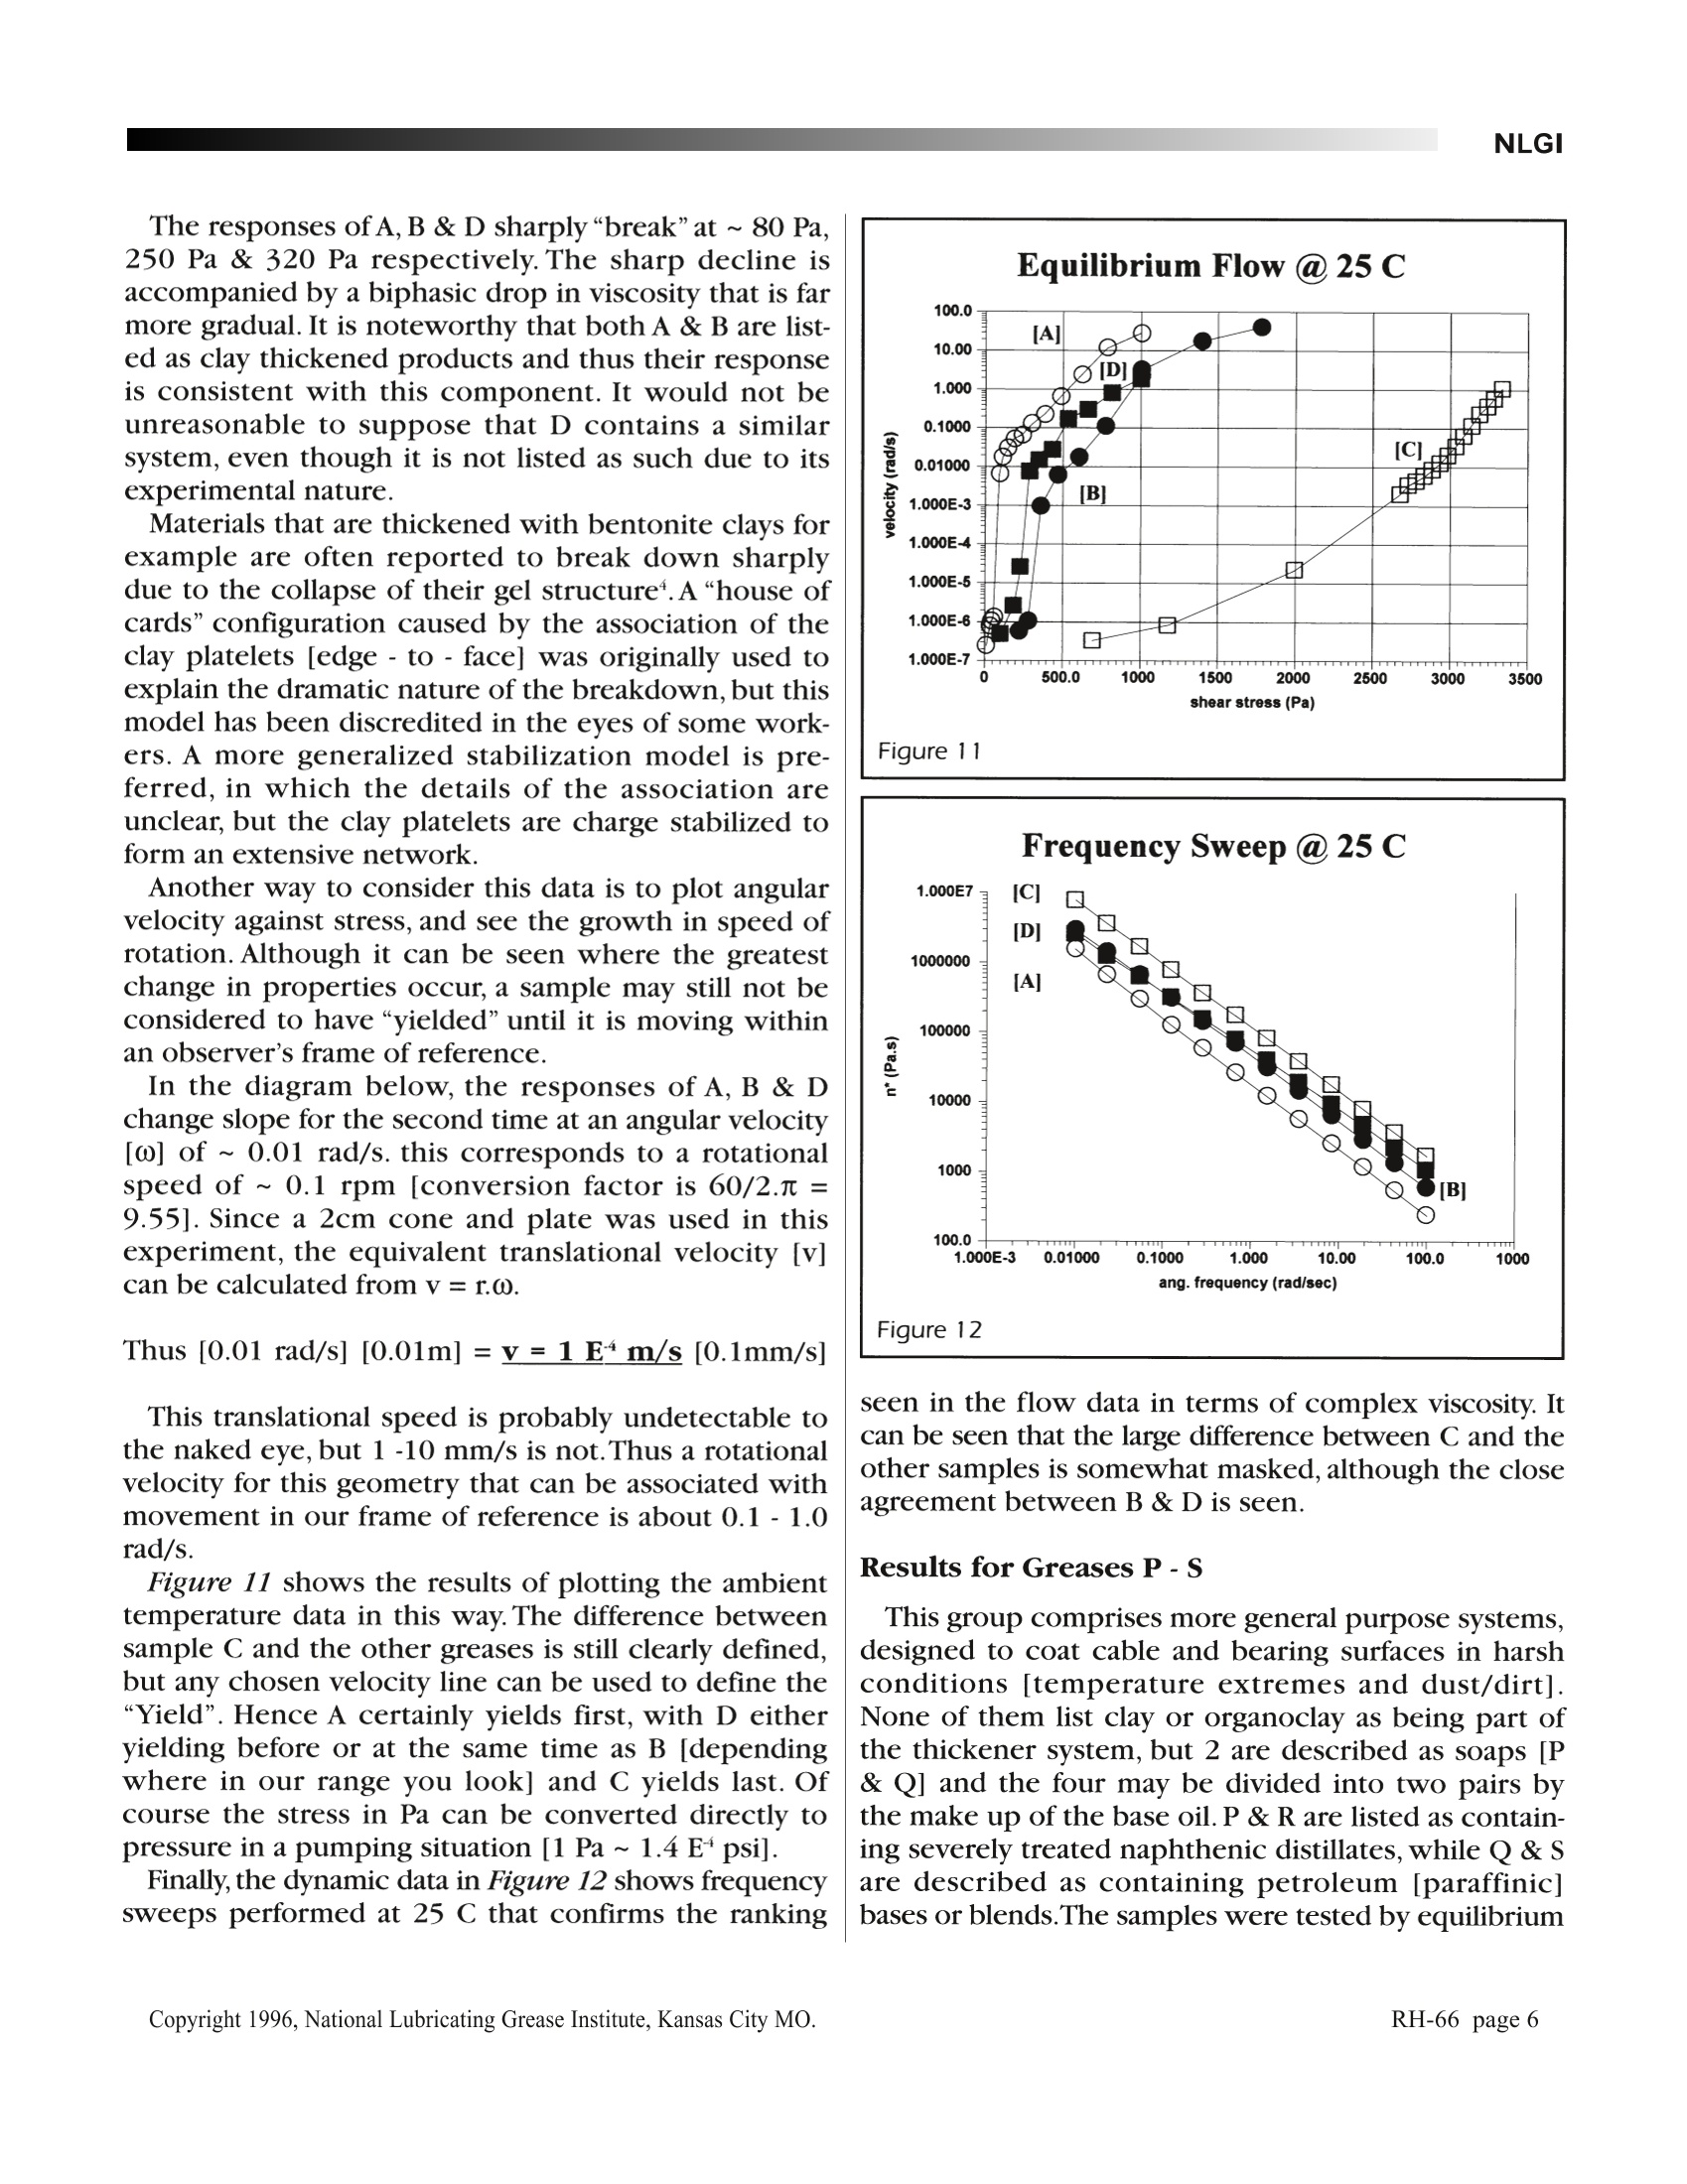
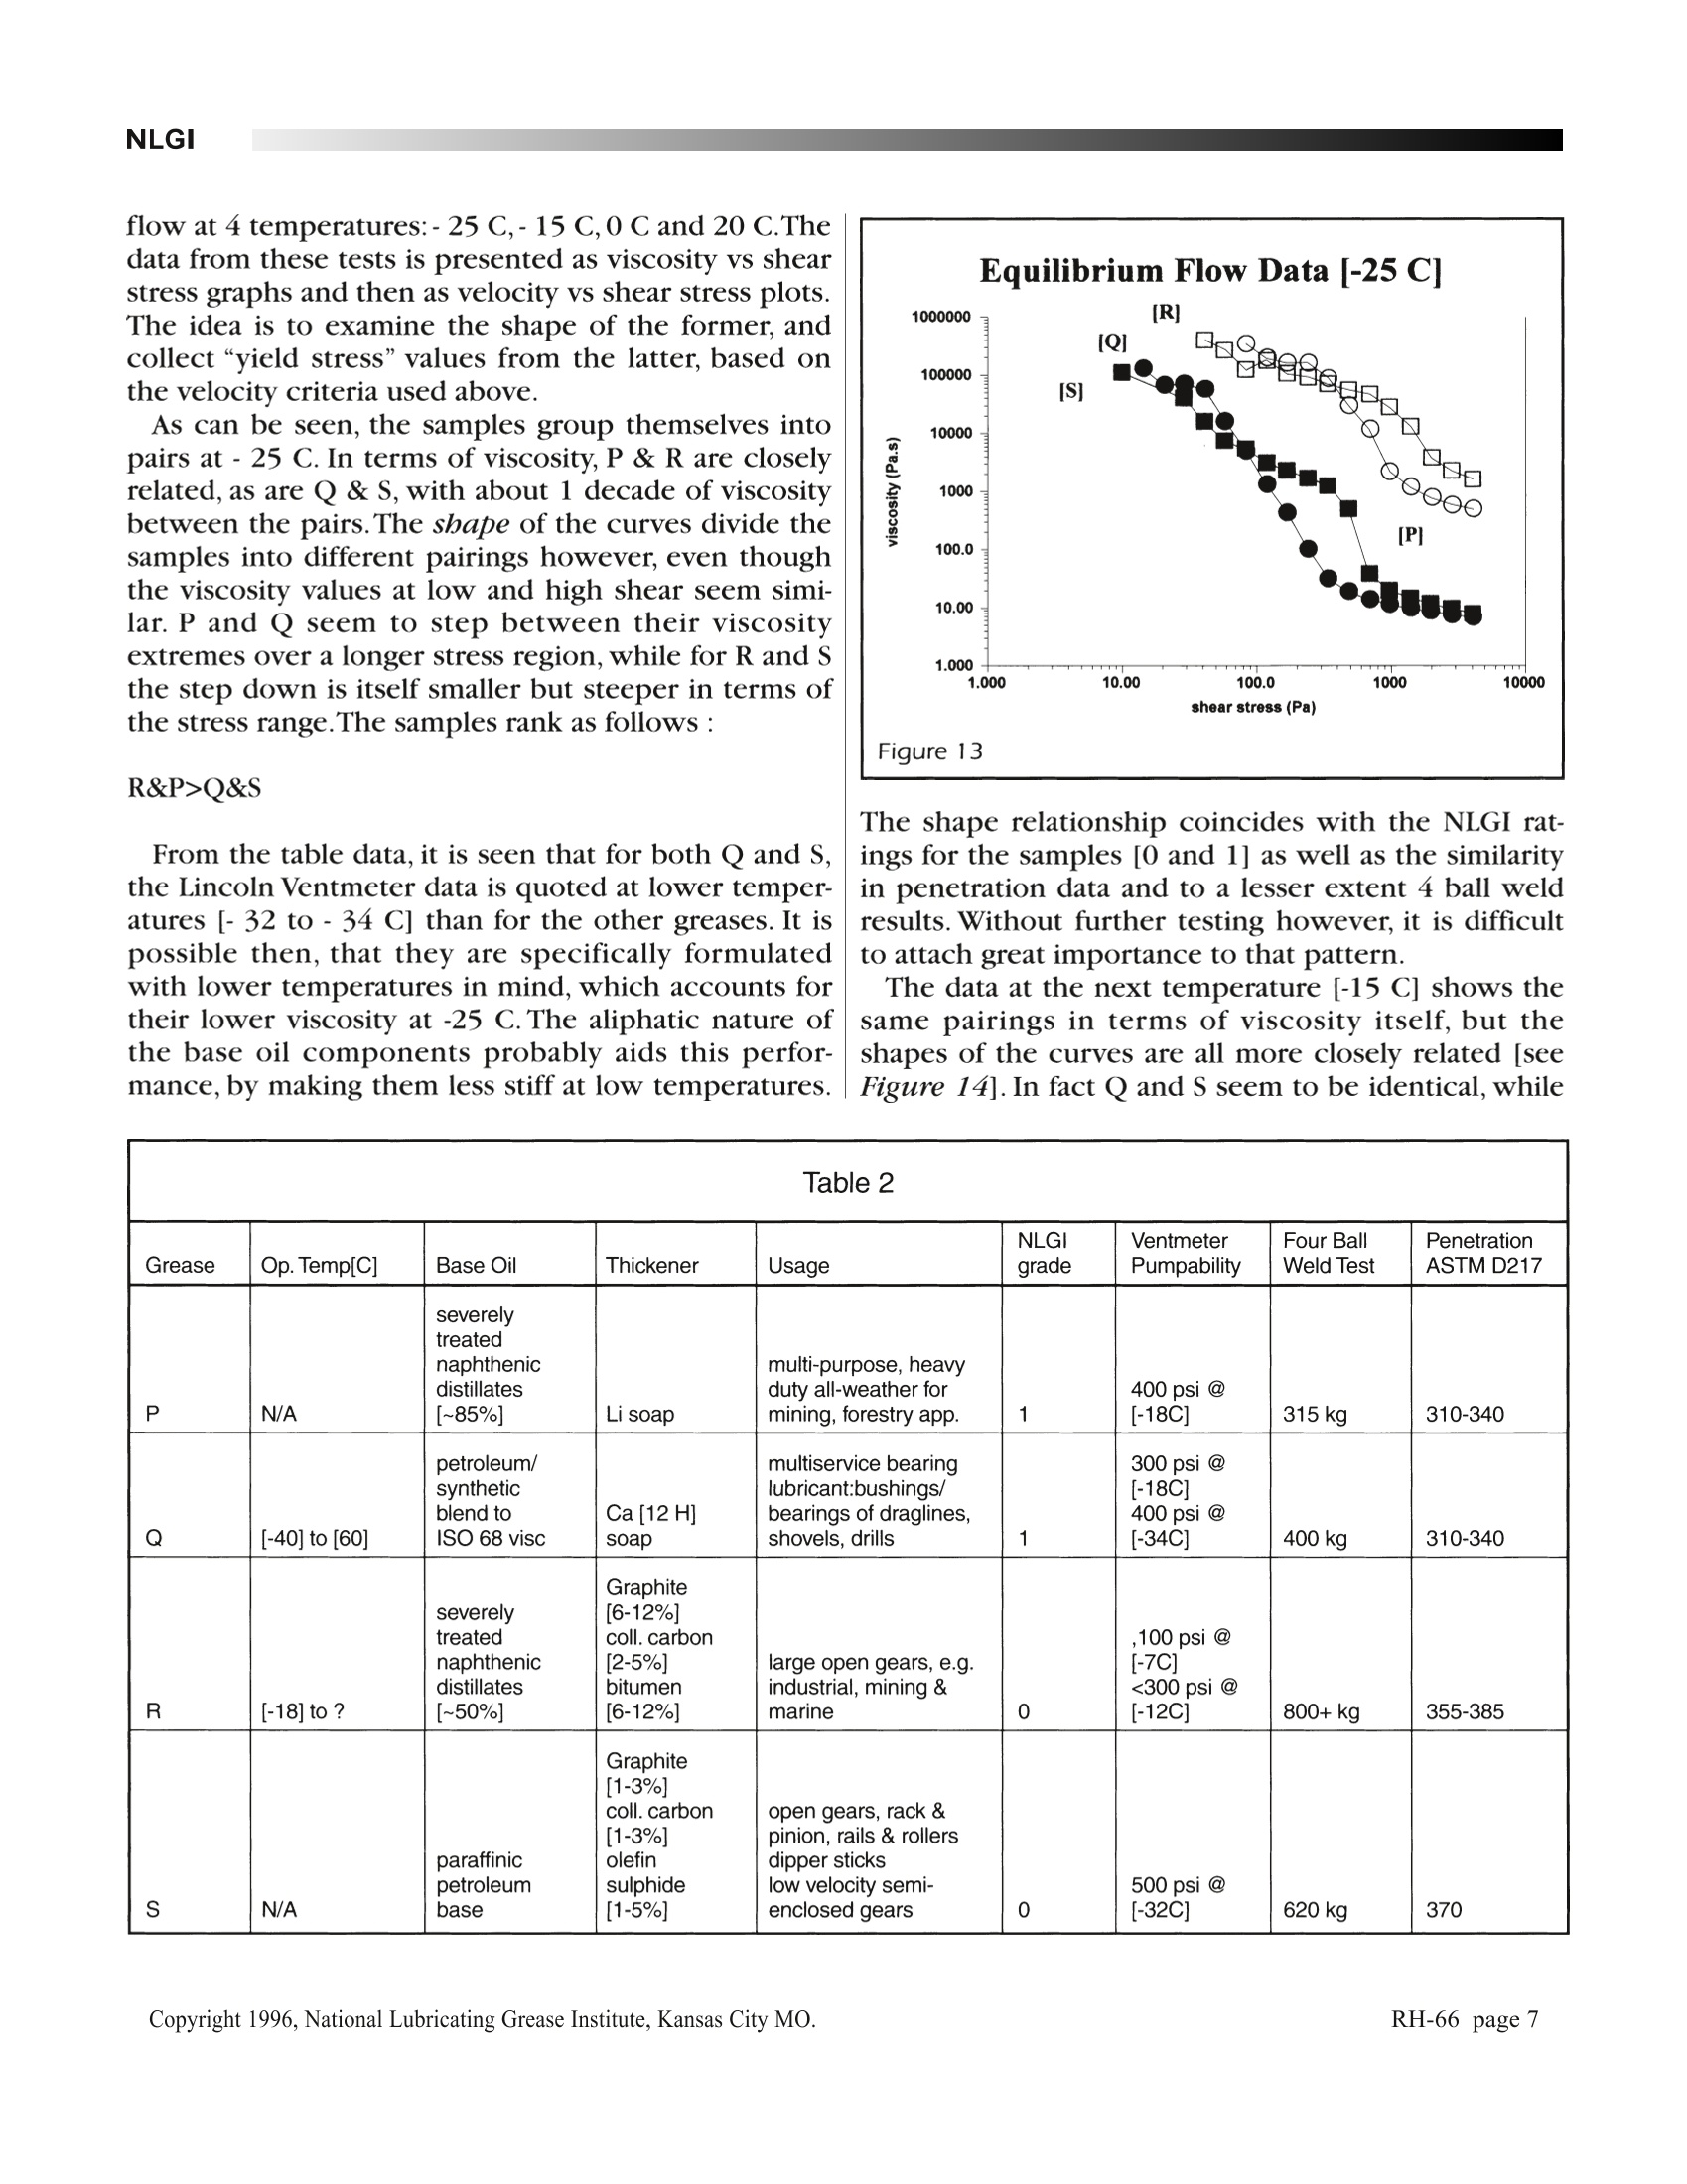
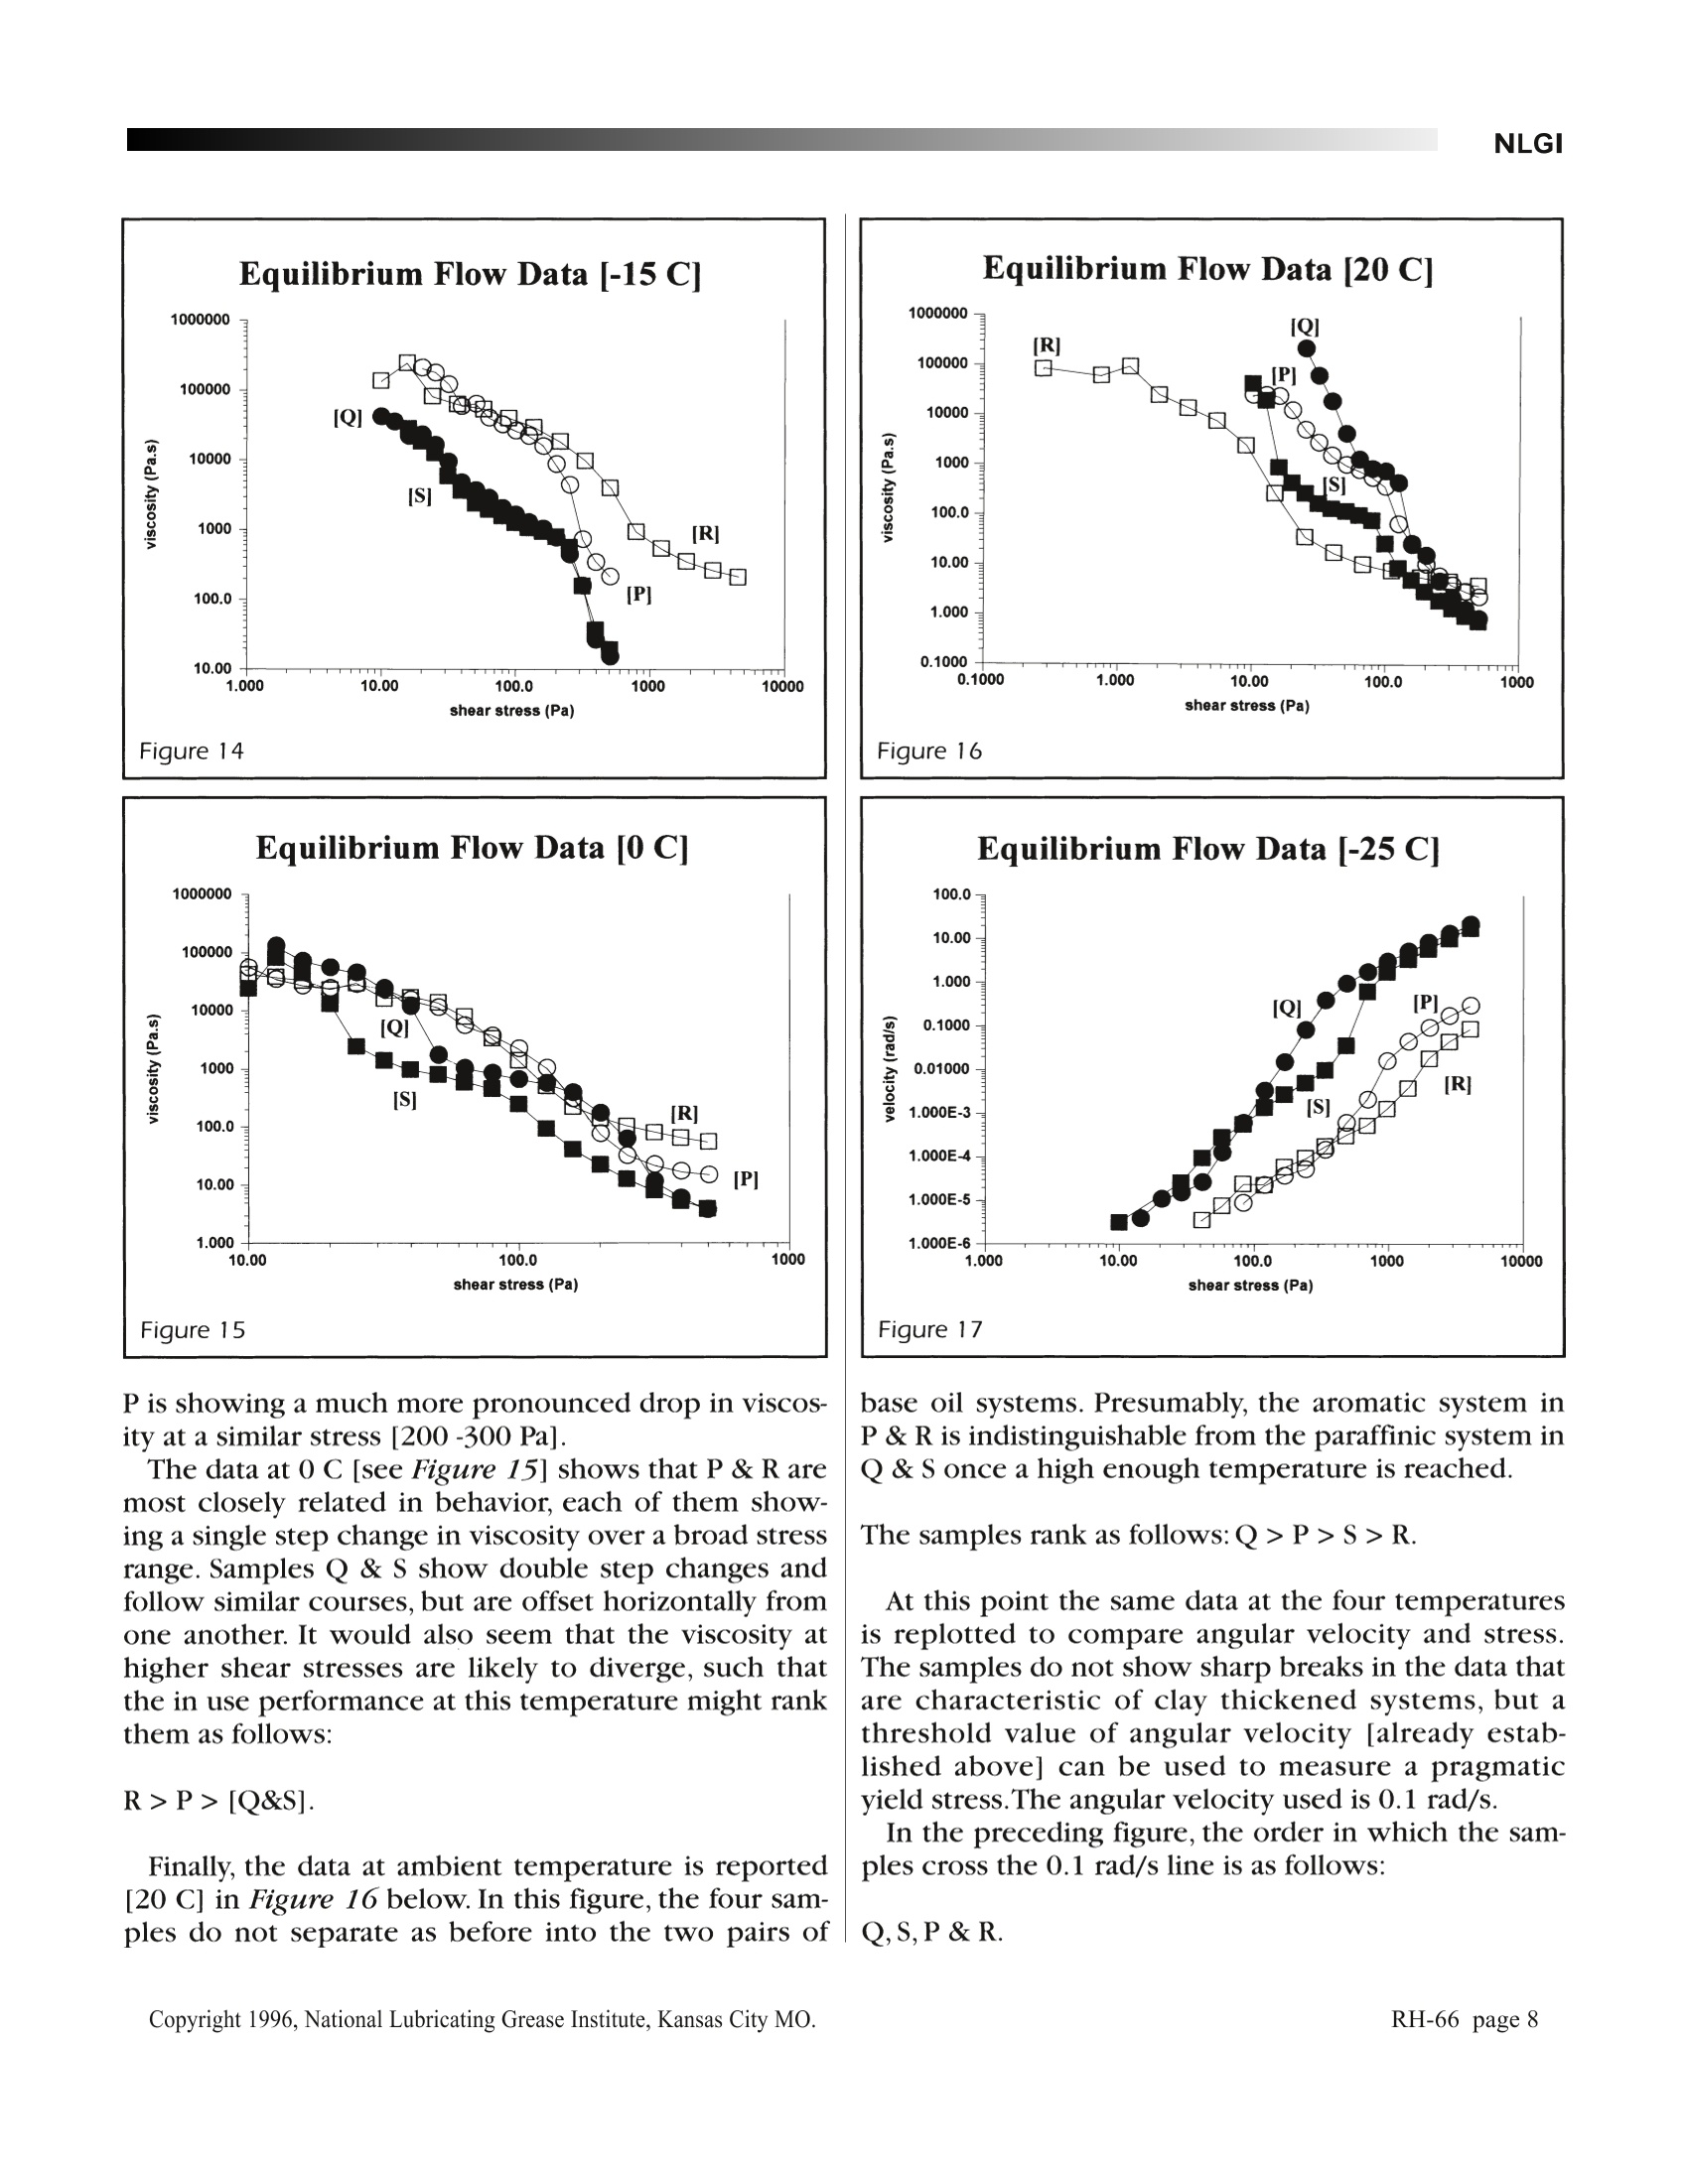
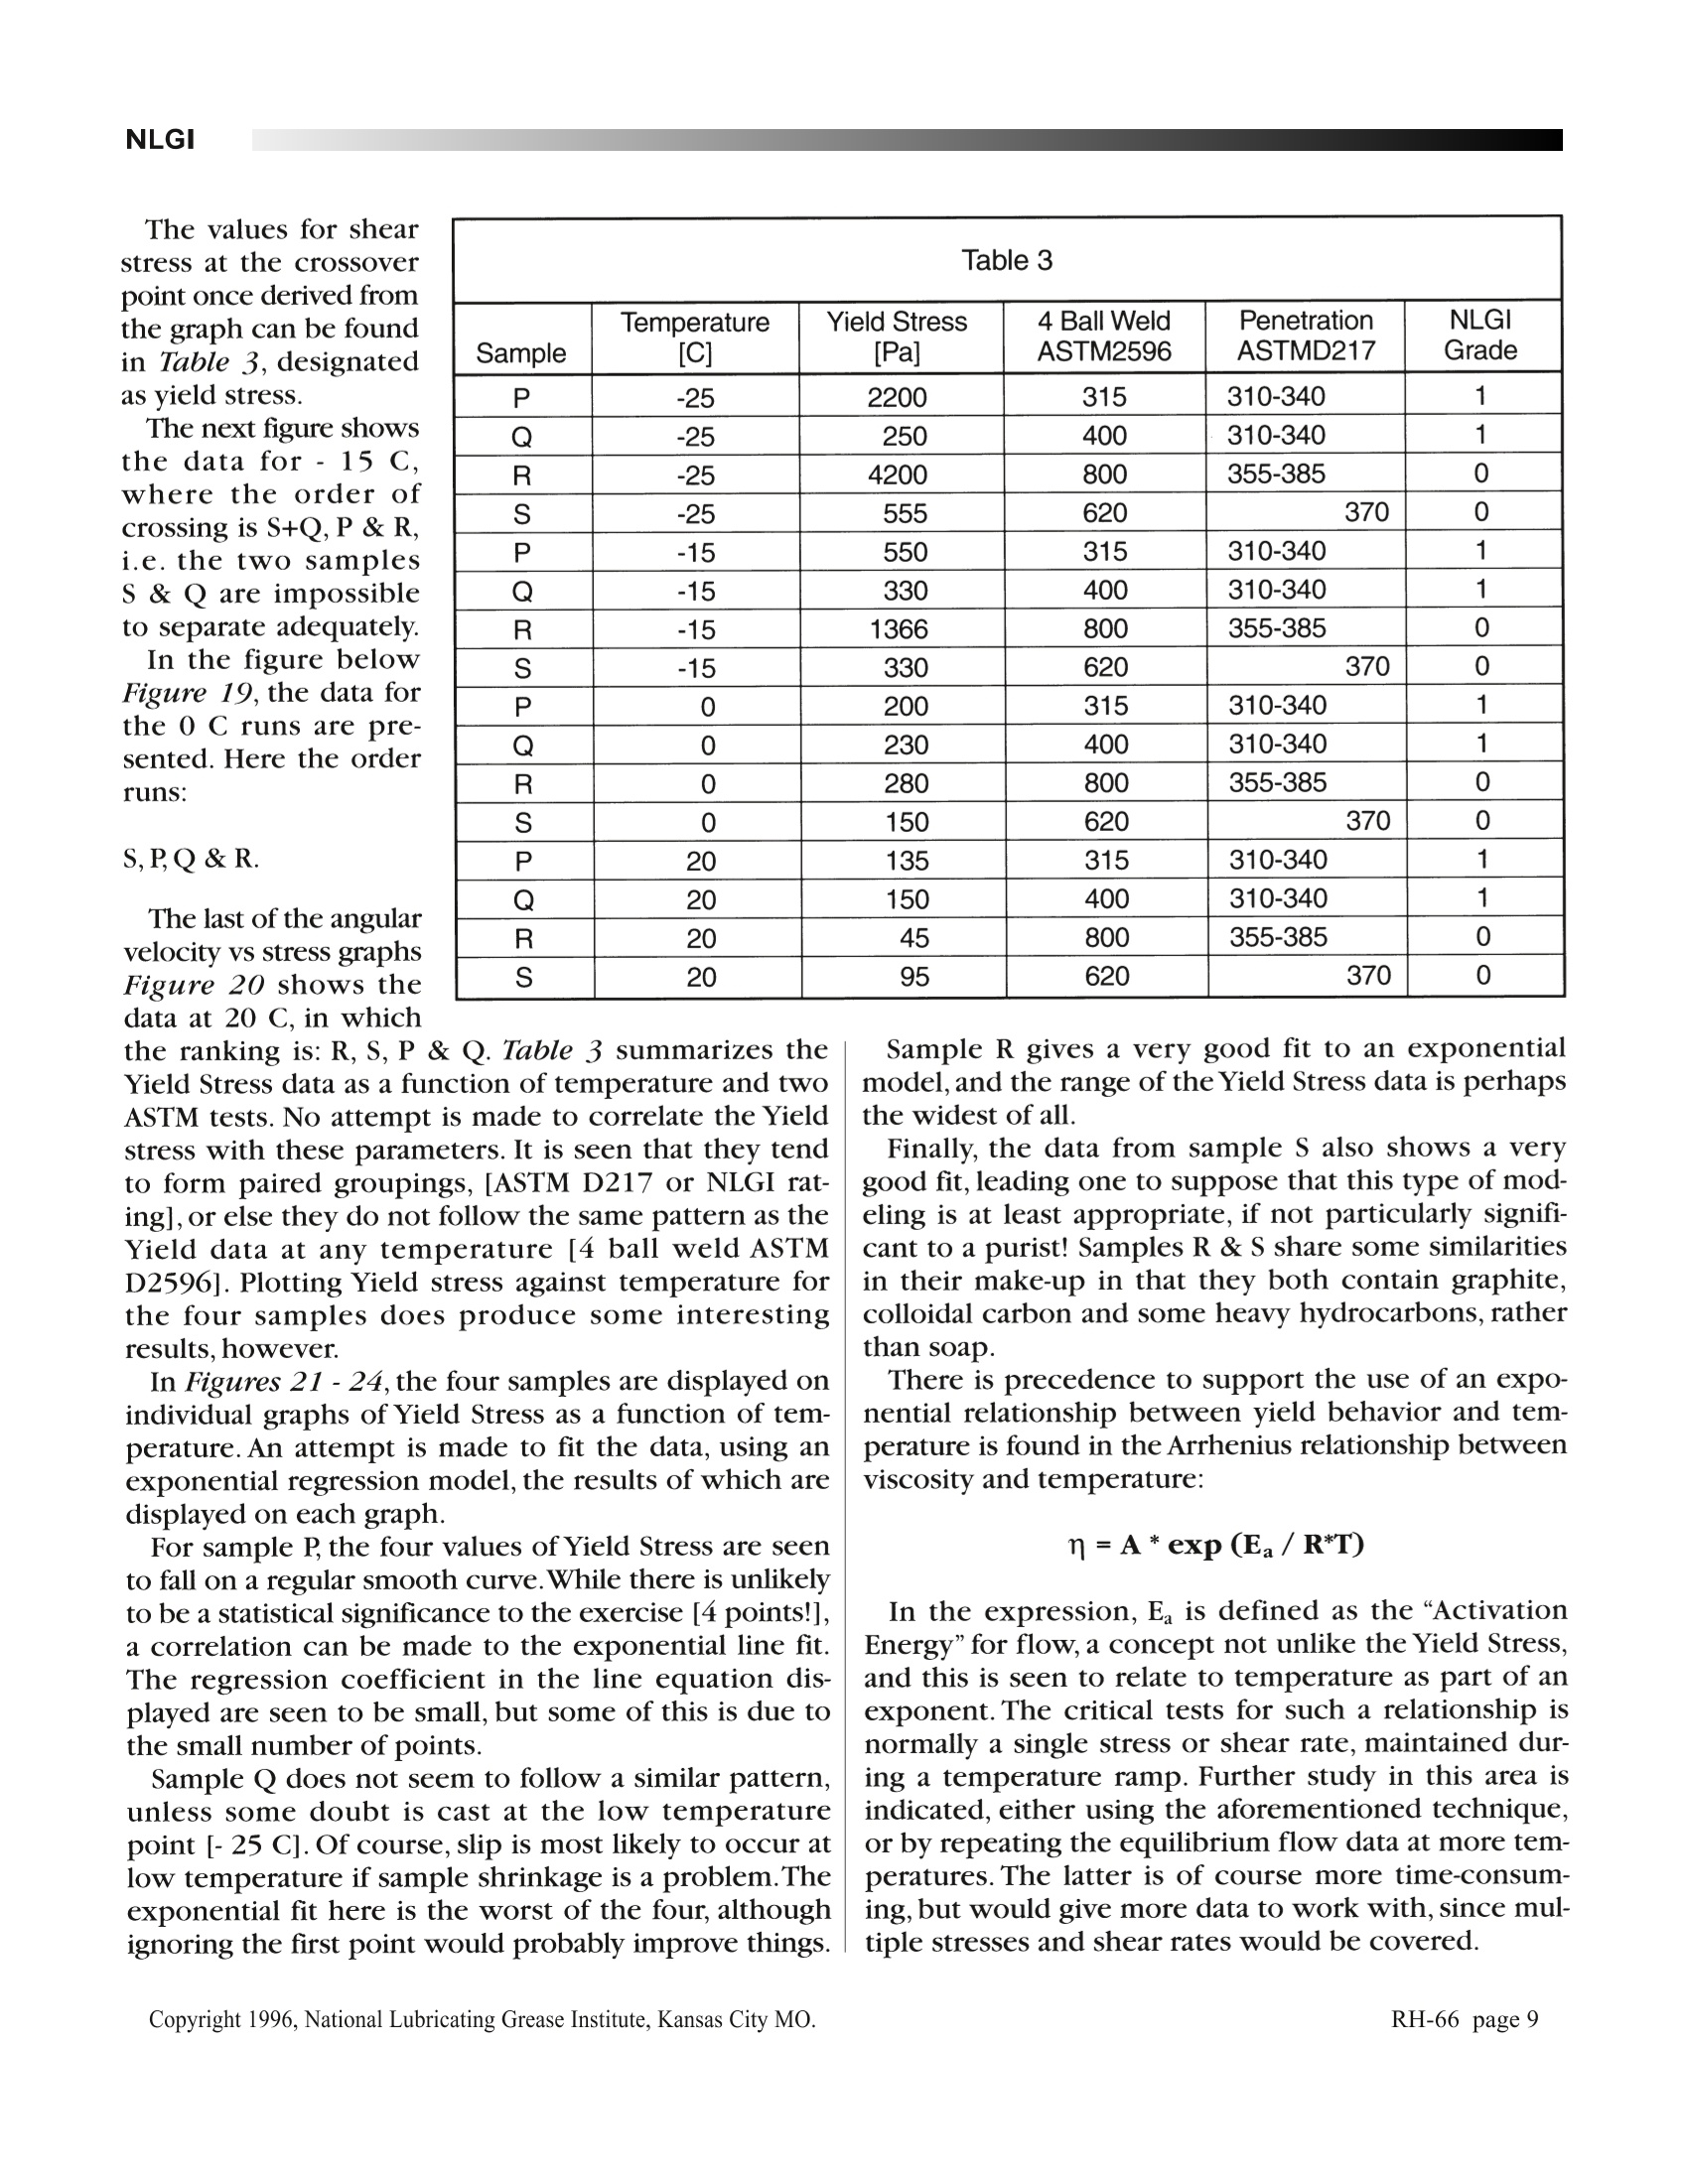
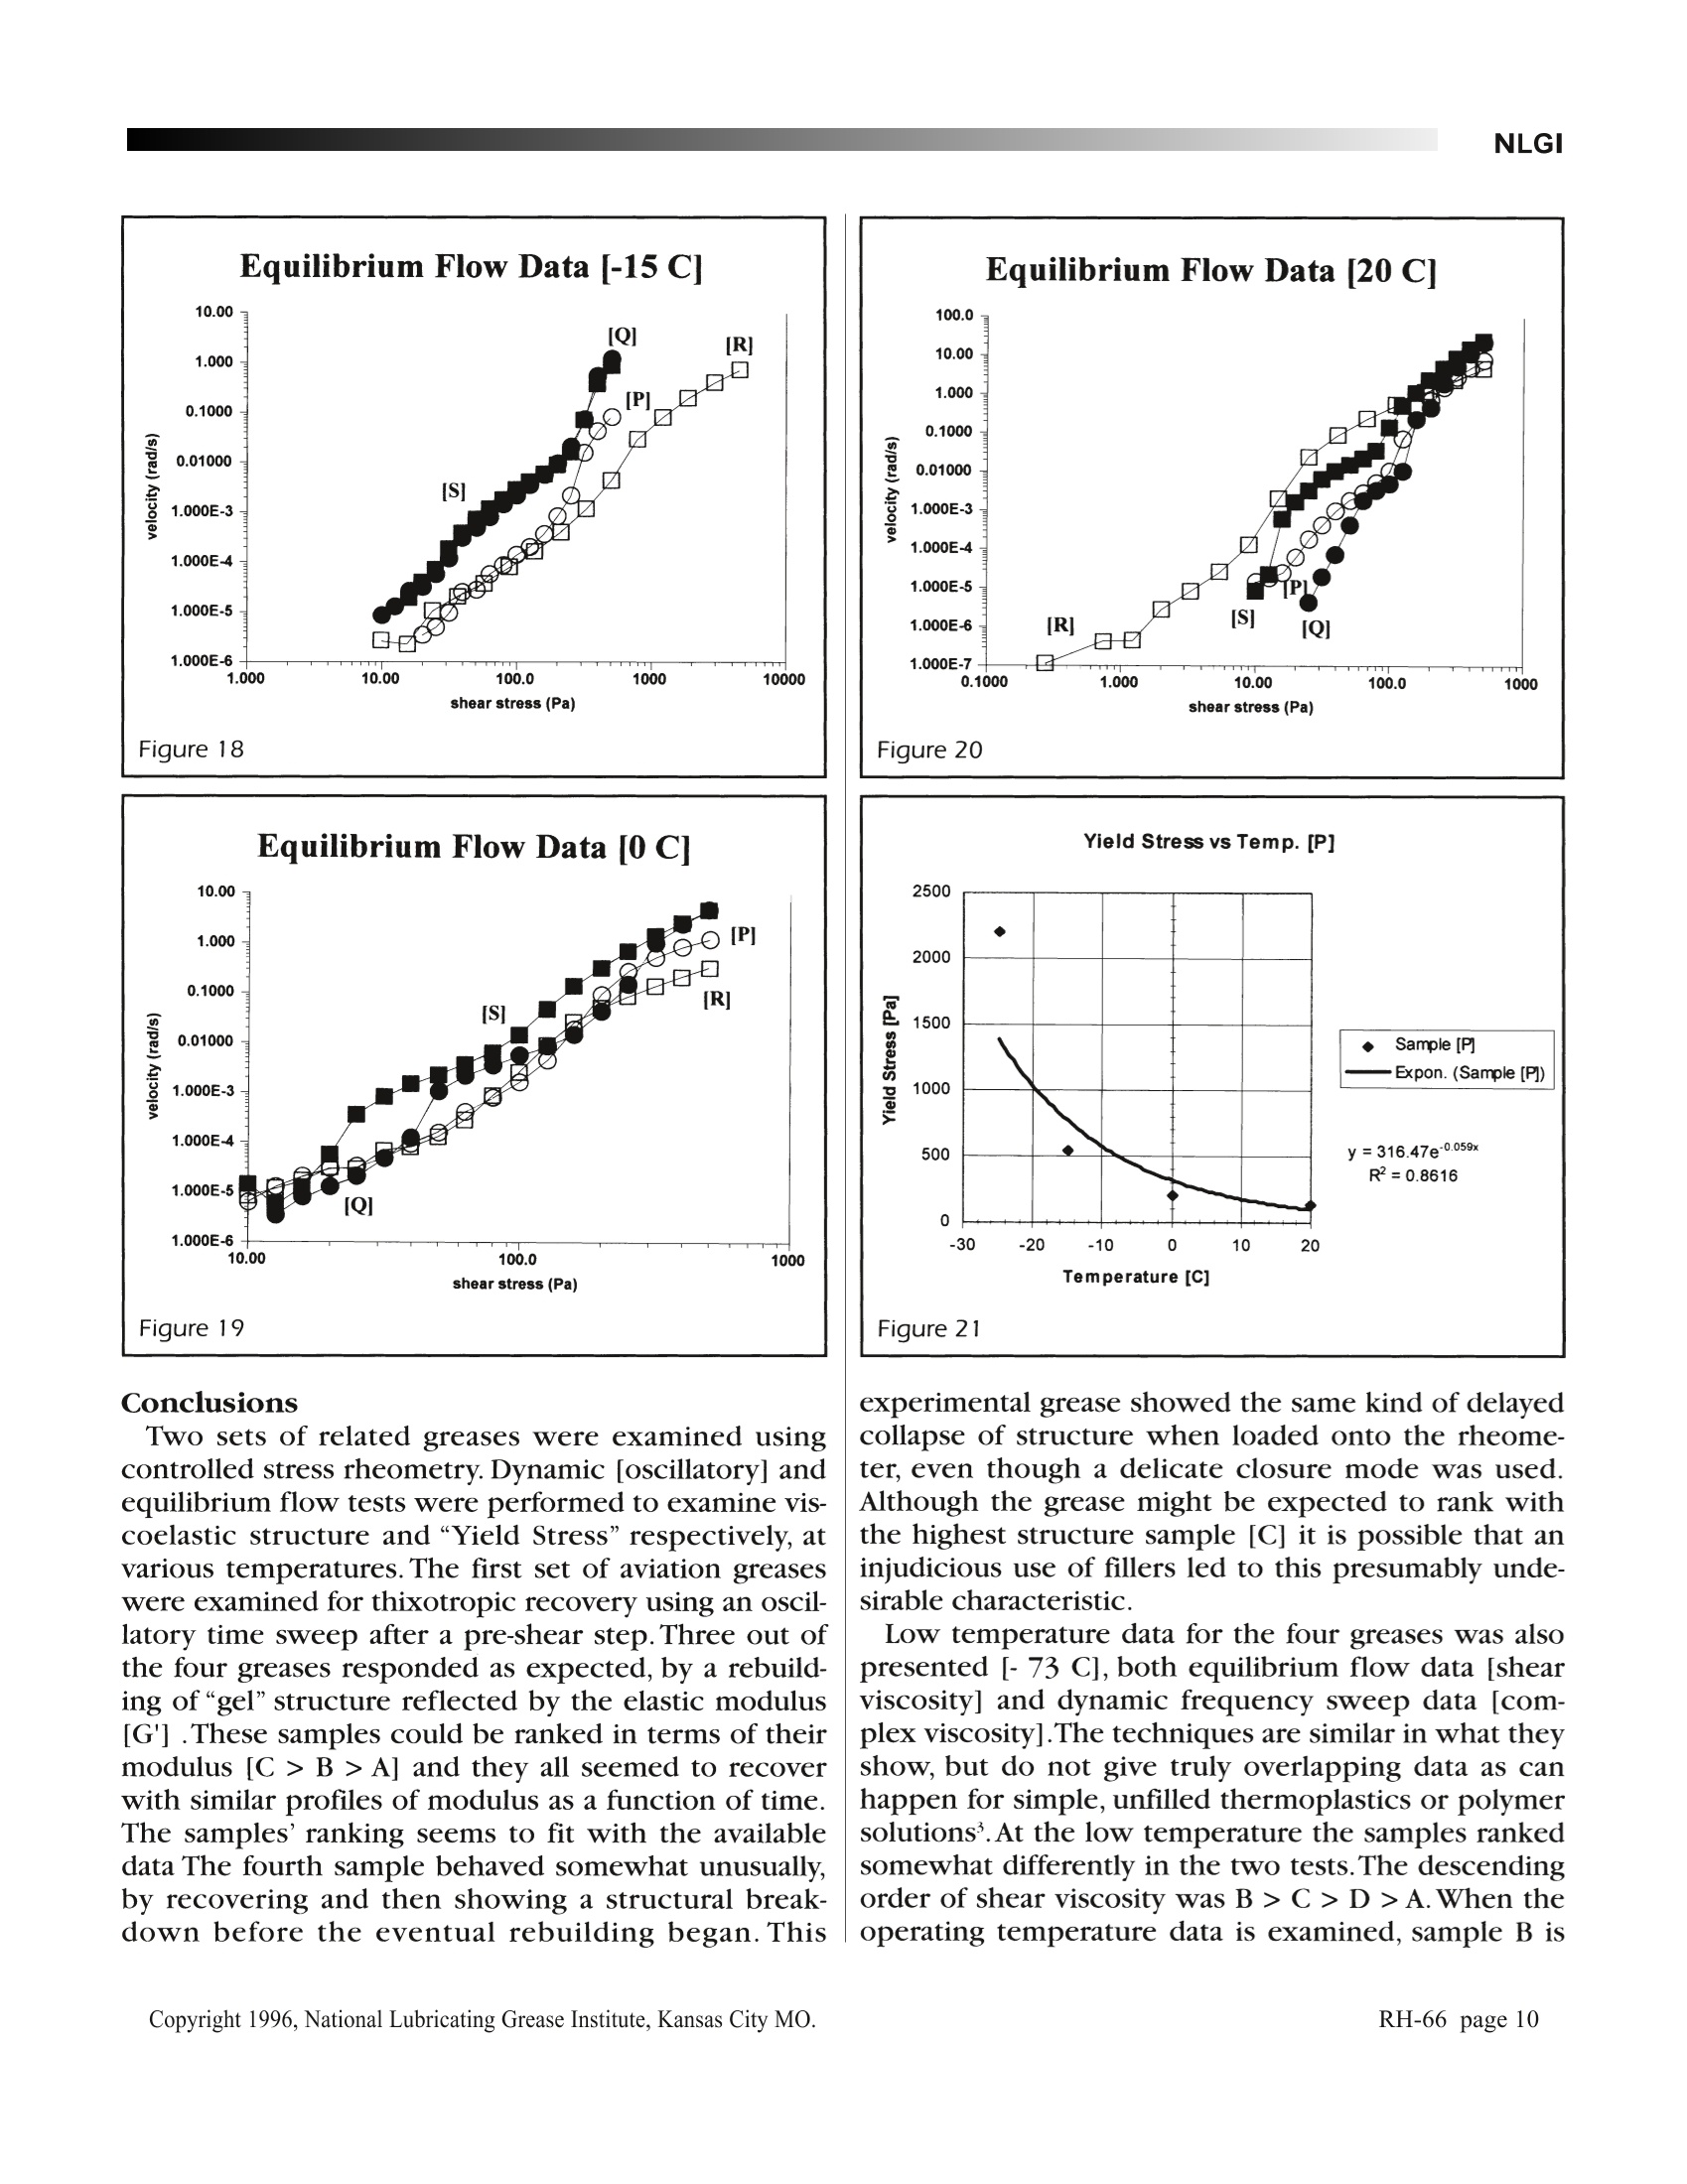
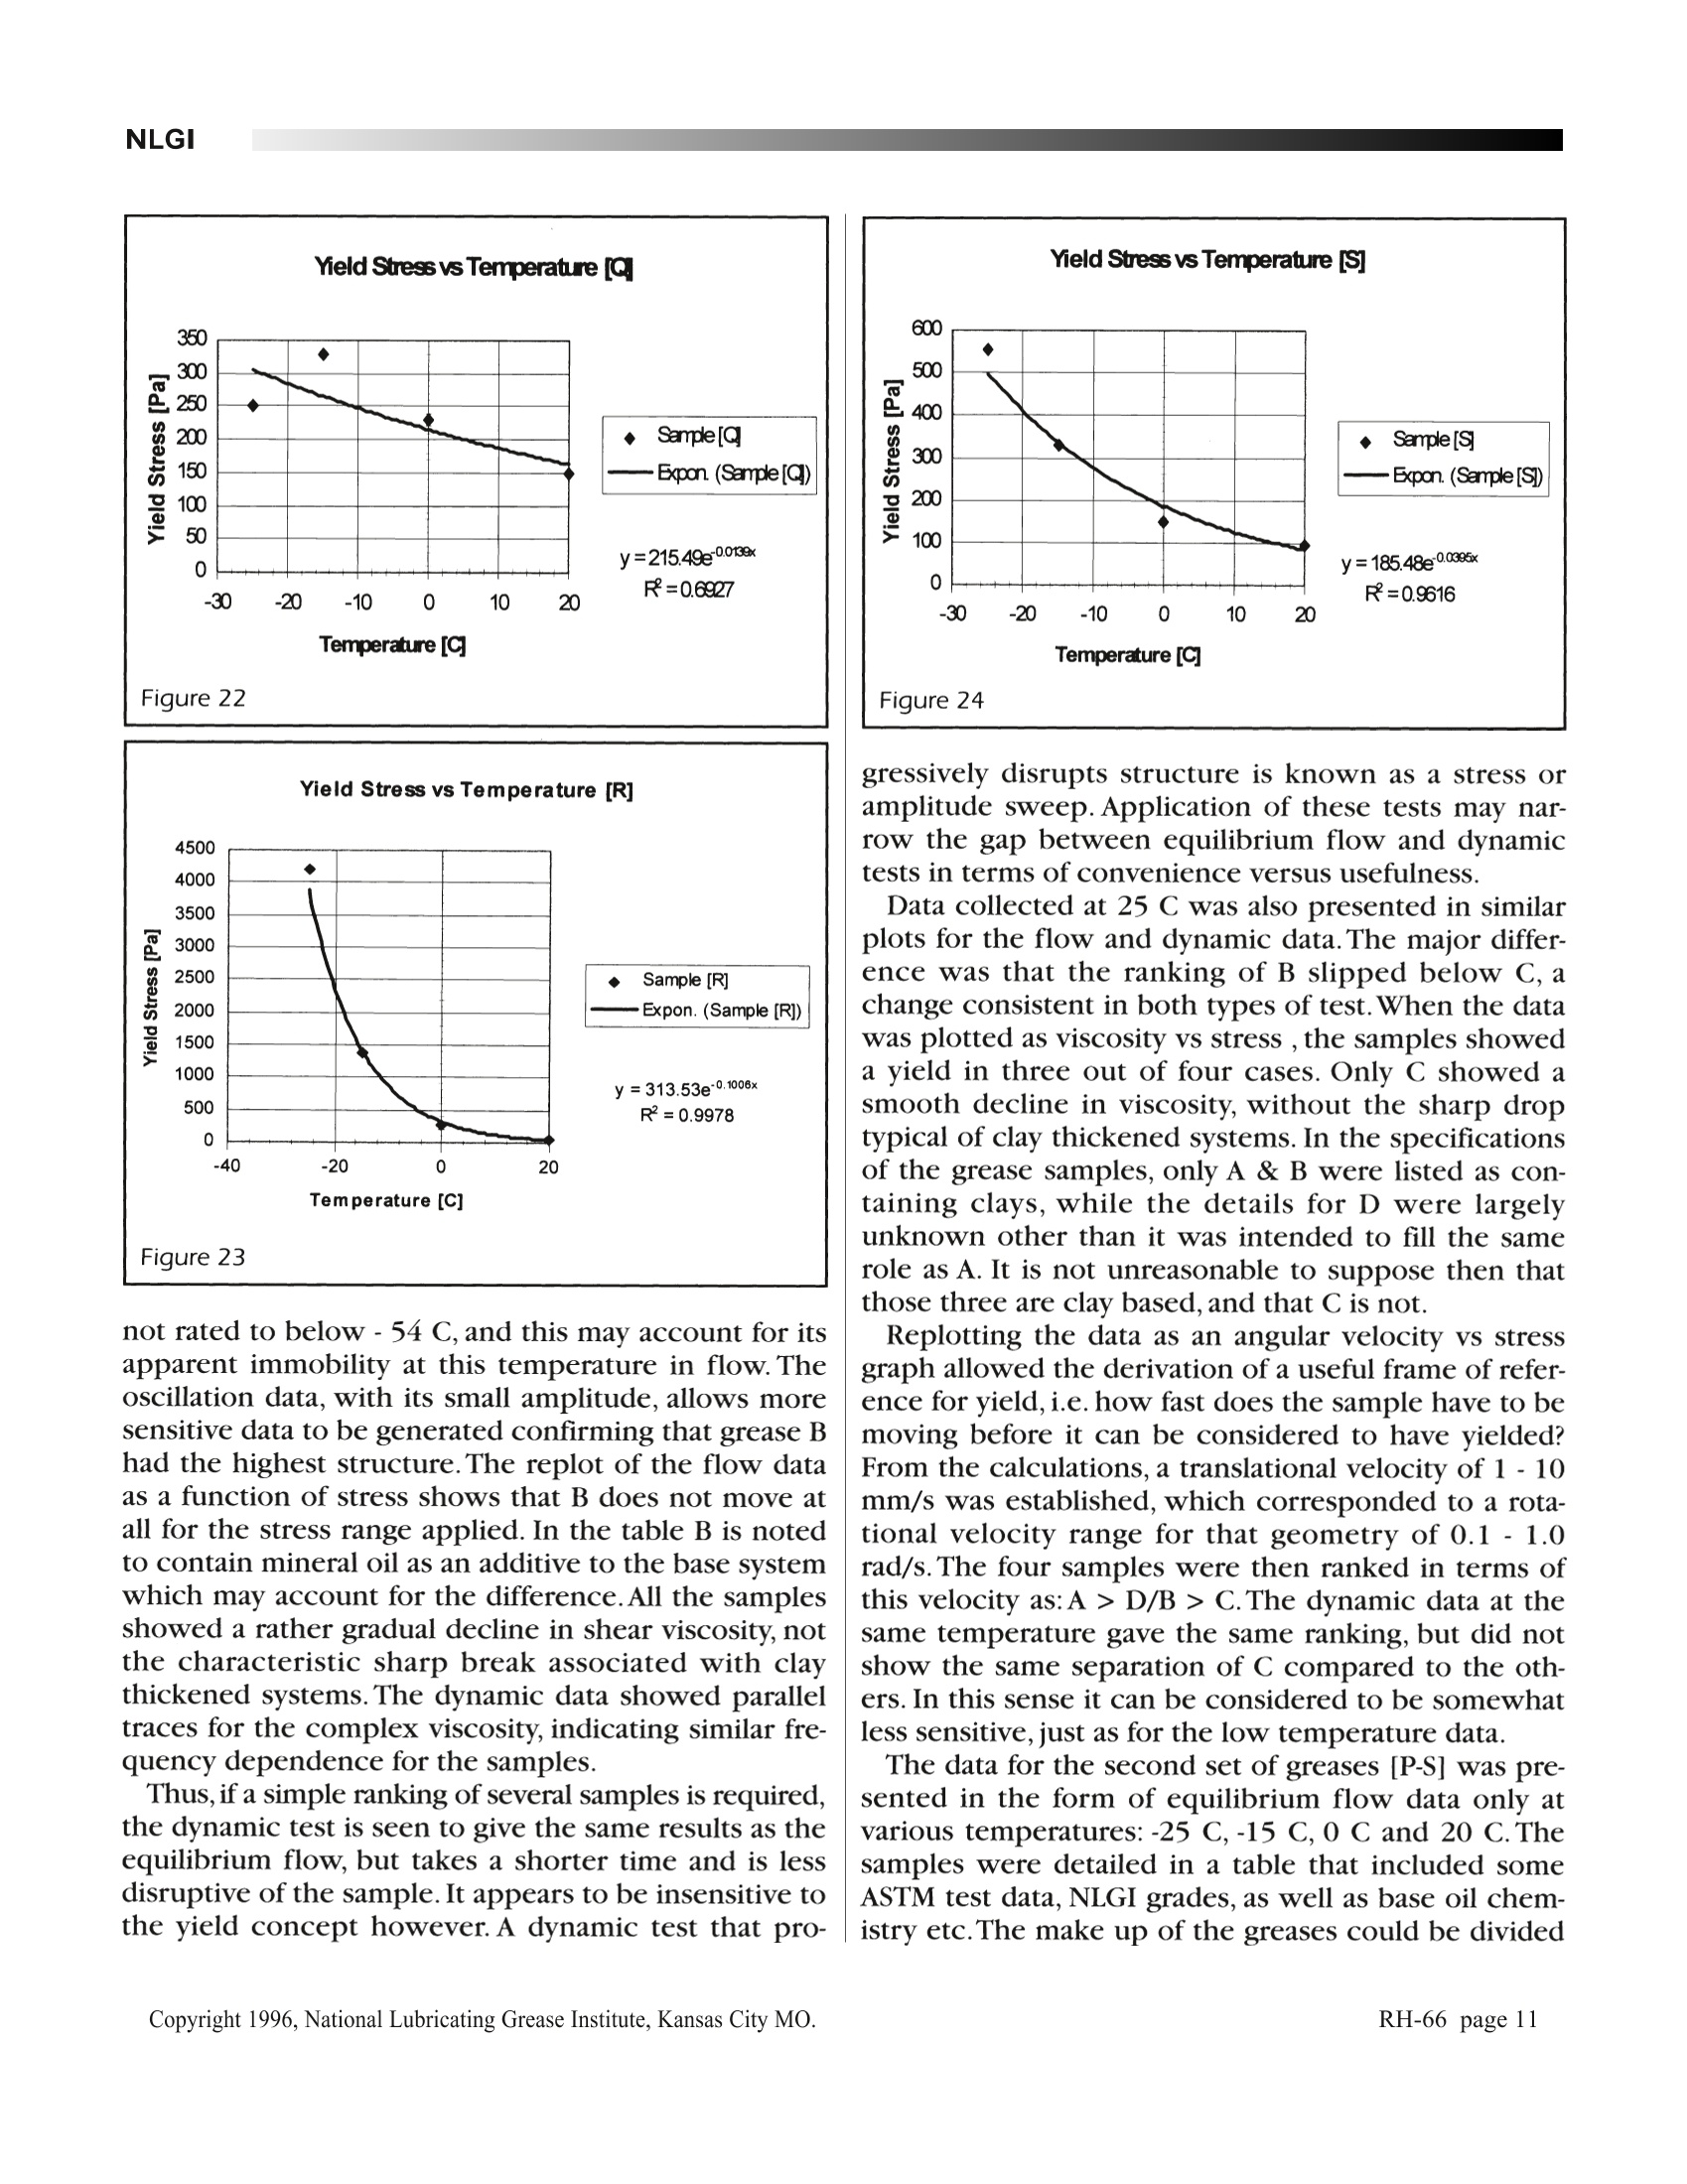
NLGI Controlled Stress Rheometry as aTool to Measure Grease Structureand Yield at Various Temperatures By Peter Whittingstall, TA Instruments Inc. Presented at NLGI's 63rd Annual Meeting, October; 1996, Scottsdale,Arizona, USA The maximum resistance to flow [viscosity] of asample at a given temperature, will be encounteredafter it is allowed to rest and thixotropic effects havetime to build the maximum gel structure.An investiga-reases are important lubricating systems thattion of the at rest structure can give the“apparentGare very interesting to a rheologist since theyyield stress”.This is of great importance, as it deter-often exhibit strongly time-dependent behaviormines whether a material will pump successfully. The[thixotropy], and are able to shear thin by severalLincoln Ventmeter can be used to determine pressure-orders of magnitude in terms of their viscosity. Thisflow relationships in a tube [or pipe] but again theshear thinning is of course vital if they are to functionresults can be affected by the amount of time an oper-as lubricants, and keep moving surfaces apart fromator is prepared to wait. Gow' presented stress relax-each other, even at high relative velocities.Traditionallyation data that monitored the decline in relaxationgreases are measured in terms of base oil viscosity, 'lessnmodulus [or less precisely“structure"] with time.Thepumpability [Lincoln Ventmeter] and via a penetrome-problem with a stress relaxation test is that theter [amongst other tests!]. These test types all provide aacquired data [stress] is by definition dropping steadi-single number or data point that is indirectly related toly into the noise as the test proceeds. Controlled stressviscosity. Multiple data points can be obtained underrheometry with its step change test equivalent, thevarying circumstances of say temperature or in that ancreep test, is better suited to long timescale experiu-nworked sample is compared with a worked sample,ments since the strain data grows with time untilbut too often the results form only a relative measuresteady state is reached, whereoupon the test mf the grease. In an ideay beal situation, a profile of datapoints shousld be obtaitopped.ned for any given sample, show-The steady state condition is defiined as the ng its absoluslope ofte response to stress at a variety of rele-the output strain vor compliant tempance [streratures.ain/stre Controllss] lineed stress rheometry can fillreaching a constant value. This gradient is usthis need by subjecting aed to small sample of grease to adirectly calculate the viscosity and the shear rate atdefined stress field. In this paper, two groups of fourwhich it is measured Figure 1.related greases are studied to obtain viscosity data andviscoelastic information.CGow presented a useful review comparing penetra-CSteaompliancedy Statetion data on greases of a wide range of NLGI grades to Achievedcontrolled rate viscometry,controlled stress viscome-try and stress relaxation data. The thixotropic natureof greases gives an investigator a“moving goalpost”problem if the viscoelastic structure or the viscosity isSlotpeo be m=1easure/nd, in 。that the results obtained will beprofoundly influenced by the sample’s shear history. n JThe method of sample loading into a cone and plateIntercepor parallel plate mteasuring system can affect theresults obtained, and the time constants associatedewith certain greases may mean that minutes or hours timLhave to pass before the “at rest”structure is regained.It is important therefore to minimize variation in this Figure 1shear history of the sample prior to measurement. By automating this technique and using softwareparameters to define when steady state is attained at aparticular stress, a series of equilibrium viscosity datapoints can be measured at very low to medium shearrates [10 -0.1 s].This technique is sometimes referredto as equilibrium flow, and can be employed to greateffect in order to generate flow curves that revealwhen“yield”occurs. This technique has the addedattraction that it evades the problems of thixotropy, byallowing the sample to fully accommodate a particularstress prior to moving forward. In this study two sets of greases are evaluated usinga controlled stress, rotational rheometer, both at ambi-ent and sub-ambient temperatures. Viscoelastic datafrom dynamic tests is shown, along with equilibriumflow data. Methods and Materials Two sets of commercial greases were evaluated.Thefirst set of four [A - D] were either production orexperimental greases formulated for the aerospacemarket. The second set [P-S] were general purposegreases for heavy equipment in a variety of industrialsettings. Where possible the grades [NLGI] or specifi-cations of ASTM tests are included for reference. The controlled stress rheometer used [TA InstrumentsCSL’500] is a high torque instrument using a drag cupmotor capable of applying 500 g.cm or 50,000 microN.m. Displacement sensing is achieved via an opticalencoder system with a resolution of 2.5 microradians,and all tests are performed through a WindowsTM soft-ware system. Gap setting between the rotor [cone orplate] and the stator [plate] is controlled via the soft-ware using a motor and gear system coupled to a pre-cision micrometer. Coarse position control is via a pneu-matic ram that has a fixed travel distance,and moves thelower platen into close proximity to the upper platen.Software options allow the gap set motor to compen-sate for expansion/contraction in temperature ramps,and apply slow closure routines to minimize structuredamage during loading of the sample.This can reducethe recovery time required before measurements start.The appendix describes the principles of operation insome detail for the interested reader.The rheometer canoperate as a controlled strain device via a feedback loopsystem, this can be useful for controlling strain ampli-tude in oscillation and emulating a shear rate in flow. Figure 2 shows a schematic of the rheometer includ-ing its major components: drive system, temperaturecontrol system, displacement sensor etc. The geometries used in the measurements wereeither cone and plate or parallel plate [for oscillation] Figure 2 using steel or acrylic rotors at ambient temperatureand special composite flat plates at sub-ambient.Thesespecial geometries are required for the extended tem-perature module [ETM] that in one mode allows fortemperatures from-100 C up to 400 C to be attained.The important feature of the ETM used in these exper-iments was the cooling gas system. Here cold nitrogengas from a source of liquid nitrogen in a dewar ispassed through jets onto both upper and lower flatplates Figure 3.The flow of gas is modulated by a sole-noid valve connected to external electronics, usingthree term [P.I.D.] control.Using this system a lowerlimit of -100 C can be achieved. Temperature is mea-sured via a PRT in the lower plate [stator]. The normal temperature control system is a Peltierplate, giving active heating and cooling over a temper- ature range of - 25C to 99C.This system was also usedwhere feasible. In the data tables that follow, incomplete or unavail-able data is indicated by N/A in the appropriate cell,some of the thickeners are not specified, so the listedadditives are included. Results Thixotropic Recovery [A-D] These greases were pre-sheared at ambient tempera-ture [25 C] for 30 minutes at 500 s',prior to an oscilla-tory test [time sweep] to monitor recovery of G' [stor-age or elastic modulus] for another 30 minutes. The storage modulus is chosen to monitor recoveryprocesses, since it is the most sensitive of the parame-ters to small changes in viscoelasticity.The results areshown on the following page in Figures4 G 5. As can be seen the three greases all show somerecovery over the time period, and all can be conve-niently ranked in terms of elastic structure : [C]>[B]> [A]. This ranking agrees with the expected order ofthe greases from the Load Wear Index [ASTM D2596],which might be expected to relate to structure fromthe amount of filler used to make a grease robust.[N.B. the Y axis is a log scale.] The fourth grease [D] isan experimental formulation and showed a lag inresponse to the shear treatment that meant it loststructure after a brief recovery. In terms of comparing its structure to the othergreases, it can be seen that the initial climb in moduluswas around 20,000 Pa- about the same as for [C]before collapse occurred. Under similar ASTM tests,the grease might therefore be expected to performsimilarly to C, but no data is available to confirm this.The subsequent rise in structure, some 4 -5 minuteslater is of interest, in that it reveals something of therecovery mechanism.Apparently during pre-shearing,the structural elements that can reversibly gel weredisplaced to such an extent that a significant rearrange-ment was required before the interactions could beginto build back structure. If the base oil or suspending phase viscosity of thegrease is relatively high, then this could account forthe time lag observed in the rebuilding of the gel. Thisresponse was found to be repeatable, and a subse-quent test even monitored the same collapse afterloading the sample between the plates, a low stressphenomenon. From its initial modulus value, the sam-ple would be expected to build to a high level ofstructure, similar to grease C. It is known that thegrease did not contain clays as part of the thickener Figure 4 system,and other fillers may have been used to add toits structure.The presence of fillers in excessive quan-tities may distort a rheological response in polymersystems and this could be the factor responsible forthe unusual and probably undesirable response. Low Temperature Response [-73 C] Figure 6 shows equilibrium flow data for the foursamples at low temperature. A wide range of viscosities and shear rates are covered in the plot, and goodseparation of the four samples is seen. As can be seen from the equilibrium flow data, sampleB really doesn’t even flow much, and the data resem-bles noise.The greases can be ranked as follows :B > C> D > A. Samples C, D and A all shear thin somewhatand can more easily be ranked.At these temperaturesthe material is likely to become glassy,and therefore is not seen to“yield”.The next figure replots the data as afunction of the applied stress to amplify that concept.Even though greases B and A contain clays that cangive rise to a sharp drop in viscosity associated withthe“yield”phenomenon, this is not seen, probably dueto the immobility of the base oil system. The only noticeable difference in B from Table 1 isthat mineral oil is present in the base oil fraction. It isnot specified as to how viscous a mineral oil is pre-sent, but it is likely that this component would beresponsible for the excessively high viscosity seen atthese low temperatures. The lighter fractions presentin the base oil components of the other three areprobably still somewhat mobile even at such a lowtemperature.Differences in the gelling mechanism andlevel of filler material will of course also contribute toa grease’s overall structure. One way of investigating the cause of the discrepancywould be to do a more thorough examination of thebase oil fraction alone. Measurement of its viscosityprofile is a useful beginning, generating points at mul-tiple shear rates for a variety of temperatures. In Figure 7, there is no decline in viscosity for sam-ple B, and the decline for the other samples is appar-ently less pronounced when plotted as a function ofstress.The viscosity of the base suspending phase isalmost certainly dominating the response, and thesamples are not showing any sharp decline in viscositythat could be associated with a yield stress. Dynamic data [a frequency sweep] shows a similarpattern for the four samples in terms of their rankingby complex viscosity [n*] a parameter comprisingboth viscous and elastic components. For some poly-meric samples, oscillation data of this type can bedirectly overlaid onto flow data using the Cox-Merz Table 1 Grease Op. Temp[C] Base Oil Thickener Min. Load ASTM D2596 Usage A [-73] to [+121] Syn. Diester Li Soap/Clay 30 kg Airframe bearings, gearssliding/rolling surfaces and mechanical actuators B [-54] to[+177] Syn. Polyolester with mineral oil Clay 57 kg Carbon steel cables, hingesand some bearings C [-75]to [+120] Syn. Ester Li Complex 80 kg Similar to A D N/A N/A Li Soap N/A [Experimental]Similar to A rule’, but the fillers in greases tend to disrupt thatempirical relationship. Figure 8. The responses of B and C are better separated in thedynamic test and the ranking is clearly B> C >D >A.There is no physical disruption of the structurerequired in this type of test, and the input stresses andresulting displacement amplitudes are lower. Suchtests can be described as“non-invasive"tests ,whileflow tests are of necessity“destructive".While thedynamic test successfully predicts the ranking foundin the flow test, it gives more or less equal separationsfor the four materials. The flow test shows a question-able response for B, but it is likely that the stress limitof the rheometer was reached in the equilibrium flowtests for this sample. From the table, B is seen to differ in two ways, firstlyin that mineral oil is listed as an additional base compo-nent, and second that clay is listed as a thickener, and itis apparently not a Li soap system. The application ofthe grease is somewhat different too, and its propertiesinclude being a barrier protectant against water andother corrosive agents on the cables in aircraft. Specificmention is made of the high structure of the grease atlow temperatures,and that such low temperaturesshould be avoided. It is also noted that the grease per-forms better at high temperature [177 C vs 120 C] thanits counterparts, and so falls into a more specializedcategory. Thus the comparison of B with the other sam-ples at this temperature is perhaps inappropriate. Ambient [25 C] Temperature Properties The flow data Figure 9 appears superficially similarto the low temperature results, except that C now hasthe highest viscosity, B having slipped below C.All thegreases are now within their operating temperaturerange, and so this ranking is expected to be morerealistic. The ranking also agrees with the thixotropicrecovery order [C> B> A] and the experimentalgrease- D lies between A & B. In Figure 9, the samples all approach a common vis-cosity at high shear rate, just as at the low temperaturestudy.The value of this asymptote is around two ordersof magnitude lower at ambient temperature,however.It is of interest to observe whether any classical yieldbehavior can be seen in the greases at ambient, and sothe data is replotted as a viscosity vs. shear stresscurve in the following figure. Different yield behaviors can be seen for C vs.A, B &D in Figure 10. Sample C seems to preserve its struc-ture beyond 1000 Pa and the viscosity decline is grad-ual, whereas the other samples show sharp dropsbelow even 500 Pa. Figure 8 The responses of A, B & D sharply“break”at ~ 80 Pa,250 Pa & 320 Pa respectively. The sharp decline isaccompanied by a biphasic drop in viscosity that is farmore gradual. It is noteworthy that both A & B are list-ed as clay thickened products and thus their responseis consistent with this component. It would not beunreasonable to suppose that D contains a similarsystem, even though it is not listed as such due to itsexperimental nature. Materials that are thickened with bentonite clays forexample are often reported to break down sharplydue to the collapse of their gel structuref. A"house ofcards” configuration caused by the association of theclay platelets [edge -to-face] was originally used toexplain the dramatic nature of the breakdown, but thismodel has been discredited in the eyes of some work-ers. A more generalized stabilization model is pre-ferred, in which the details of the association areunclear, but the clay platelets are charge stabilized toform an extensive network. Another way to consider this data is to plot angularvelocity against stress, and see the growth in speed ofrotation. Although it can be seen where the greatestchange in properties occur, a sample may still not beconsidered to have“yielded”until it is moving withinan observer’s frame of reference. In the diagram below, the responses of A, B & Dchange slope for the second time at an angular velocity[ω] of ~ 0.01 rad/s.this corresponds to a rotationalspeed of ~ 0.1 rpm [conversion factor is 60/2.元 =9.55]. Since a 2cm cone and plate was used in thisexperiment, the equivalent translational velocity [v]can be calculated from v= r.ω. This translational speed is probably undetectable tothe naked eye,but 1 -10 mm/s is not.Thus a rotationalvelocity for this geometry that can be associated withmovement in our frame of reference is about 0.1 - 1.0rad/s. Figure 11 shows the results of plotting the ambienttemperature data in this way. The difference betweensample C and the other greases is still clearly defined,but any chosen velocity line can be used to define the“Yield”. Hence A certainly yields first, with D eitheryielding before or at the same time as B [dependingwhere in our range you look] and C yields last. Ofcourse the stress in Pa can be converted directly topressure in a pumping situation [1 Pa~ 1.4 E4psil. Finally, the dynamic data in Figure 12 shows frequencysweeps performed at 25 C that confirms the ranking Figure 11 seen in the flow data in terms of complex viscosity. Itcan be seen that the large difference between C and theother samples is somewhat masked, although the closeagreement between B & D is seen. Results for Greases P-S This group comprises more general purpose systems,designed to coat cable and bearing surfaces in harshconditions [temperature extremes and dust/dirt].None of them list clay or organoclay as being part ofthe thickener system, but 2 are described as soaps [P& Q] and the four may be divided into two pairs bythe make up of the base oil. P & R are listed as contain-ing severely treated naphthenic distillates, while Q & Sare described as containing petroleum [paraffinic]bases or blends.The samples were tested by equilibrium flow at 4 temperatures:-25 C,-15 C,0 C and 20 C.Thedata from these tests is presented as viscosity vs shearstress graphs and then as velocity vs shear stress plots.The idea is to examine the shape of the former, andcollect“yield stress"values from the latter, based onthe velocity criteria used above. As can be seen, the samples group themselves intopairs at -25 C. In terms of viscosity, P & R are closelyrelated, as are Q & S, with about 1 decade of viscositybetween the pairs. The shape of the curves divide thesamples into different pairings however, even thoughthe viscosity values at low and high shear seem simi-lar. P and Q seem to step between their viscosityextremes over a longer stress region, while for R and Sthe step down is itself smaller but steeper in terms ofthe stress range.The samples rank as follows : R&P>Q&S From the table data, it is seen that for both Q and S,the Lincoln Ventmeter data is quoted at lower temper-atures [- 32 to -34 C] than for the other greases. It ispossible then, that they are specifically formulatedwith lower temperatures in mind, which accounts fortheir lower viscosity at -25 C. The aliphatic nature ofthe base oil components probably aids this perfor-mance, by making them less stiff at low temperatures. The shape relationship coincides with the NLGI rat-ings for the samples [0 and 1] as well as the similarityin penetration data and to a lesser extent 4 ball weldresults. Without further testing however, it is difficultto attach great importance to that pattern. The data at the next temperature [-15 C] shows thesame pairings in terms of viscosity itself, but theshapes of the curves are all more closely related [seeFigure 14]. In fact Q and S seem to be identical, while Table 2 Grease Op. Temp[C] Base Oil Thickener Usage NLGIgrade VentmeterPumpability Four BallWeld Test PenetrationASTM D217 P N/A severelytreatednaphthenicdistillates[~85%] Li soap multi-purpose, heavyduty all-weather for mining, forestry app. 1 400 psi @[-18C] 315 kg 310-340 Q [-40] to [60] petroleum/syntheticblend to ISO 68 visc Ca[12 H]soap multiservice bearinglubricant:bushings/bearings of draglines,shovels, drills 1 300 psi @[-18C]400 psi @[-34C] 400 kg 310-340 R [-18] to ? severelytreatednaphthenicdistillates[~50%] Graphite[6-12%]coll. carbon[2-5%]bitumen [6-12% large open gears, e.g.industrial, mining &marine ,100 psi @[-7C]<300 psi @-12C] 800+kg 355-385 S N/A paraffinicpetroleumbase Graphite1-3%]coll. carbon[1-3%]olefinsulphide[1-5%1 open gears, rack &pinion, rails & rollersdipper stickslow velocity semi- enclosed gears 500 psi @「-32C] 620 kg 370 P is showing a much more pronounced drop in viscos-ity at a similar stress [200 -300 Pa]. The data at 0 C [see Figure 15] shows that P & R aremost closely related in behavior, each of them show-ing a single step change in viscosity over a broad stressrange. Samples Q & S show double step changes andfollow similar courses, but are offset horizontally fromone another. It would also seem that the viscosity athigher shear stresses are likely to diverge, such thatthe in use performance at this temperature might rankthem as follows: R>P>[Q&S]. Finally, the data at ambient temperature is reported[20 C] in Figure 16 below. In this figure, the four sam-ples do not separate as before into the two pairs of base oil systems. Presumably, the aromatic system inP & R is indistinguishable from the paraffinic system inQ& S once a high enough temperature is reached. The samples rank as follows:Q>P>S>R. At this point the same data at the four temperaturesis replotted to compare angular velocity and stress.The samples do not show sharp breaks in the data thatare characteristic of clay thickened systems, but athreshold value of angular velocity [already estab-lished above] can be used to measure a pragmaticyield stress.The angular velocity used is 0.1 rad/s. In the preceding figure,the order in which the sam-ples cross the 0.1 rad/s line is as follows: ( Q,S,P & R. ) The values for shearstress at the crossoverpoint once derived fromthe graph can be foundin Table 3, designatedas yield stress. The next figure showsthe data for - 15 C,where the order ofcrossing is S+Q,P & R,i.e. the two samplesS & Q are impossibleto separate adequately. In the figure belowFigure 19, the data forthe 0 C runs are pre-sented. Here the orderruns: S,P,Q & R. The last of the angularvelocity vs stress graphsFigure 20 shows thedata at 20 C, in which Table 3 Sample Temperature [C] Yield Stress[Pa] 4 Ball WeldASTM2596 PenetrationASTMD217 NLGI Grade P -25 2200 315 310-340 1 Q -25 250 400 310-340 1 R -25 4200 800 355-385 0 S -25 555 620 370 P -15 550 315 310-340 1 Q) -15 330 400 310-340 1 R -15 1366 800 355-385 0 S -15 330 620 370 0 P 200 315 310-340 1 Q 230 400 310-340 1 R 280 800 355-385 0 S 150 620 370 P 20 135 315 310-340 1 Q 20 150 400 310-340 1 R 20 45 800 355-385 S 20 95 620 370 the ranking is: R, S, P & Q. Table 3 summarizes theYield Stress data as a function of temperature and twoASTM tests. No attempt is made to correlate the Yieldstress with these parameters. It is seen that they tendto form paired groupings,[ASTM D217 or NLGI rat-ing], or else they do not follow the same pattern as theYield data at any temperature [4 ball weld ASTMD2596]. Plotting Yield stress against temperature forthe four samples does produce some interestingresults, however. In Figures 21-24, the four samples are displayed onindividual graphs of Yield Stress as a function of tem-perature. An attempt is made to fit the data, using anexponential regression model, the results of which aredisplayed on each graph. For sample P, the four values of Yield Stress are seento fall on a regular smooth curve.While there is unlikelyto be a statistical significance to the exercise [4 points!],a correlation can be made to the exponential line fit.The regression coefficient in the line equation dis-played are seen to be small, but some of this is due tothe small number of points. Sample Q does not seem to follow a similar pattern,unless some doubt is cast at the low temperaturepoint[-25 C]. Of course, slip is most likely to occur atlow temperature if sample shrinkage is a problem.Theexponential fit here is the worst of the four, althoughignoring the first point would probably improve things. Sample R gives a very good fit to an exponentialmodel,and the range of the Yield Stress data is perhapsthe widest of all. Finally, the data from sample S also shows a verygood fit, leading one to suppose that this type of mod-eling is at least appropriate, if not particularly signifi-cant to a purist! Samples R & S share some similaritiesin their make-up in that they both contain graphite,colloidal carbon and some heavy hydrocarbons, ratherthan soap. There is precedence to support the use of an expo-nential relationship between yield behavior and tem-perature is found in the Arrhenius relationship betweenviscosity and temperature: In the expression, Ea is defined as the“ActivationEnergy”for flow, a concept not unlike the Yield Stress,and this is seen to relate to temperature as part of anexponent. The critical tests for such a relationship isnormally a single stress or shear rate, maintained dur-ing a temperature ramp. Further study in this area isindicated, either using the aforementioned technique,or by repeating the equilibrium flow data at more tem-peratures. The latter is of course more time-consum-ing, but would give more data to work with, since mul-tiple stresses and shear rates would be covered. Figure 20 Conclusions Two sets of related greases were examined usingcontrolled stress rheometry. Dynamic [oscillatory] andequilibrium flow tests were performed to examine vis-coelastic structure and“Yield Stress”respectively, atvarious temperatures. The first set of aviation greaseswere examined for thixotropic recovery using an oscil-latory time sweep after a pre-shear step. Three out ofthe four greases responded as expected, by a rebuild-ing of“gel”structure reflected by the elastic modulus[G'].These samples could be ranked in terms of theirmodulus [C > B > A] and they all seemed to recoverwith similar profiles of modulus as a function of time.The samples'ranking seems to fit with the availabledata The fourth sample behaved somewhat unusually,by recovering and then showing a structural break-down before the eventual rebuilding began. This experimental grease showed the same kind of delayedcollapse of structure when loaded onto the rheome-ter, even though a delicate closure mode was used.Although the grease might be expected to rank withthe highest structure sample [C] it is possible that aninjudicious use of fillers led to this presumably unde-sirable characteristic. Low temperature data for the four greases was alsopresented [-73 C], both equilibrium flow data [shearviscosity] and dynamic frequency sweep data [com-plex viscosity].The techniques are similar in what theyshow, but do not give truly overlapping data as canhappen for simple, unfilled thermoplastics or polymersolutions. At the low temperature the samples rankedsomewhat differently in the two tests.The descendingorder of shear viscosity was B>C>D> A. When theoperating temperature data is examined, sample B is not rated to below -54 C, and this may account for itsapparent immobility at this temperature in flow. Theoscillation data, with its small amplitude, allows moresensitive data to be generated confirming that grease Bhad the highest structure.The replot of the flow dataas a function of stress shows that B does not move atall for the stress range applied. In the table B is notedto contain mineral oil as an additive to the base systemwhich may account for the difference.All the samplesshowed a rather gradual decline in shear viscosity, notthe characteristic sharp break associated with claythickened systems. The dynamic data showed paralleltraces for the complex viscosity, indicating similar fre-quency dependence for the samples. Thus, if a simple ranking of several samples is required,the dynamic test is seen to give the same results as theequilibrium flow, but takes a shorter time and is lessdisruptive of the sample. It appears to be insensitive tothe yield concept however. A dynamic test that pro- gressively disrupts structure is known as a stress oramplitude sweep.Application of these tests may nar-row the gap between equilibrium flow and dynamictests in terms of convenience versus usefulness. Data collected at 25 C was also presented in similarplots for the flow and dynamic data.The major differ-ence was that the ranking of B slipped below C, achange consistent in both types of test. When the datawas plotted as viscosity vs stress , the samples showeda yield in three out of four cases. Only C showed asmooth decline in viscosity, without the sharp droptypical of clay thickened systems. In the specificationsof the grease samples, only A & B were listed as con-taining clays, while the details for D were largelyunknown other than it was intended to fill the samerole as A. It is not unreasonable to suppose then thatthose three are clay based, and that C is not. Replotting the data as an angular velocity vs stressgraph allowed the derivation of a useful frame of refer-ence for yield, i.e. how fast does the sample have to bemoving before it can be considered to have yielded?From the calculations, a translational velocity of 1 -10mm/s was established, which corresponded to a rota-tional velocity range for that geometry of 0.1 - 1.0rad/s. The four samples were then ranked in terms ofthis velocity as:A> D/B> C.The dynamic data at thesame temperature gave the same ranking, but did notshow the same separation of C compared to the oth-ers.In this sense it can be considered to be somewhatless sensitive, just as for the low temperature data. The data for the second set of greases [P-S] was pre-sented in the form of equilibrium flow data only atvarious temperatures: -25 C, -15 C, 0 C and 20 C. Thesamples were detailed in a table that included someASTM test data, NLGI grades, as well as base oil chem-istry etc.The make up of the greases could be divided into two categories, depending upon the aromatic oraliphatic character of the base oil. The samples as plotted out graphically tended to fol-low the same pattern at the various temperatures.Samples P & R tended to pair up, as did samples S & Q,the former being consistently higher in viscosity thanthe latter. The high viscosity pair comprised the naph-thenic distillate base oil system, while the paraffinicpetroleum systems formed the low viscosity pair. Atthe two lowest temperatures [-25C &-15C], the pairswere well separated, but at the higher temperaturesthe pairs lay closer together. None of the greasesshowed a sharp breakdown in viscosity, consistentwith a true“Yield Stress”but using the technique of athreshold velocity [0.1 rad/s], the yield point can becalculated from each graph. The yield data as a function of temperature was pre-sented in Table 3 along with the ASTM test results andNLGI grade information.All four graphs were replottedas angular velocity vs. stress and then four moregraphs of yield stress as a function of temperaturewere plotted [one for each sample]. Three out of thefour samples produced data that could be fitted to anexponential curve with moderate to very good stan-dard values for R²[0.86 -0.998] with the fourth [Q]showing a less ordered data set. It is possible that thelow temperature data was subject to artifact [e.g. slip]since the other points appeared to form a similarcurve by eye.The curve fitting routine is not a seriousstatistical exercise however, since the number of datapoints is very small [n = 4]. It is interesting that theexponential fit does give passable results, since theArrhenius equation relates viscosity and flow with theactivation energy [Ea],similar in concept to the“YieldStress". Further work is suggested in order to supportthe relationship between yield stress and temperatureby interpolating more temperature points. The advan-tages of being able to predict useful viscosity and tem-perature ranges are clear. The use of controlled stress rheometry is seen to beable to rank grease samples in terms of flow curves at agiven temperature, as opposed to a single point result.The flow curves allow an observer to predict whichsamples will perform best at a given temperature andwhether it will pump, by converting stress in Pascalsto appropriate units [e.g. p.s.i.].A further advantage isthe ability to directly measure angular velocity and,from the geometry factors, calculate translationalvelocity. Any relevant reference frame of velocity canbe chosen to determine when the sample is respond-ing to the stress. Both dynamic and equilibrium flow curves can be used to simply rank the samples as ascreening procedure, but the latter is the preferredmethod, albeit a more longwinded one. While con-trolled stress rheometry is not expected to replace theASTM protocols, it is a useful tool to provide absoluteinformation about the viscosity of a sample underdefined conditions of shear and temperature. References 1. Gow G., Judges 5 :5,The Time Factor in Rheology,Paper Presented at the 55th NLGI Annual Meetingin Tampa 1988 2. Barnes H.A. and Walters K.,The Yield Stress Myth?,Rheol.Acta24323-326 1985 3. Cox W.P. and Merz E. H., Correlation of dynamicand steady flow viscosities.,J. Polym. Sci. 28 619-622 1958 4. Van Olphen H.,“Clay Colloid Chemistry”, JohnWiley & Sons. NY 1963 About the Author Dr. Peter Whittingstall, BS (Biochemistry-Honors) Imperial College of Science, Tech-nology and Medicine, London University,1983; Associate of the Royal College ofScience [A.R.C.S.J; PhD (Biophysics) ImperialCollege of Science, Technology and Medi-cine, London University, 1987. From 1987 to1990, Post-doctoral Research Associate, Univer-sity of Southern California. 1990-1991 Appli-cations Specialist, Carri-Med PLC; 1991-1992Western Regional Manager,Carri-Med Amer-icas, Inc. From 1993 to present, Technical Manager [Rheology], TA Instruments, Inc. Undergraduate thesis dealt with impeller design for improvingaeration/agitation of viscous fermentation broths in stirred reactors.PhD in Biophysics dealt primarily with the physiochemistry oferythrocyte aggregation and its effect uponwhole blood viscosity ofnormal patients and those with various pathologies. The post doc-toral work at Southern California was a continuation of the abovehaemorheology investigation and extended into cellular deforma-bility research. The applications position at Carri-Med dealt with themuch broader fields of industrial rheology for paints, inks, foods, solidrocker fuels, consumer products and other important systems. Hiscurrent position includes all aspects of commercial rheology, andrheometer design.Member: The Society of Rheology (SOR) and TheSociety of Plastics Engineers (SPE). Editor’s Note: Peter Whittingstall was presented theNLGI Author award for this paper at the annualmeeting in Carlsbad, California. Copyright National Lubricating Grease Institute, Kansas City MO.RH- Greases are important lubricating systems that are very interesting to a rheologist since they often exhibit strongly time-dependent behavior [thixotropy], and are able to shear thin by several orders of magnitude in terms of they are to function as lubricants, and keep moving surfaces apart from each other, even at high relative velocities. Traditionally greases are measured in terms of base oil viscosity, pumpability [Lincoln Ventmeter] and via a penetrometer [amongst other tests!]. These test types all provide a single number or data points can be obtained under varying circumstances of say temperature or in that an unworked sample is compared with a worked sample, but too often the results form only a relative measure of the grease.
确定
还剩10页未读,是否继续阅读?

产品配置单

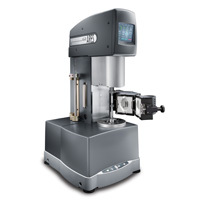
TA仪器为您提供《油脂中结构和屈服应力检测方案(流变仪)》,该方案主要用于其他中结构和屈服应力检测,参考标准--,《油脂中结构和屈服应力检测方案(流变仪)》用到的仪器有TA仪器ARES-G2 高级流变仪
推荐专场
相关方案
更多
该厂商其他方案
更多