


方案详情
文
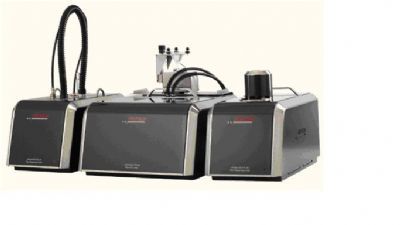
德国FRITSCH(飞驰)的激光粒度仪Analysette 22内置强劲的超声系统,可以达到完美的样品分散,对于陶瓷粉颗粒的粒径分布可以进行很好的测量
方案详情

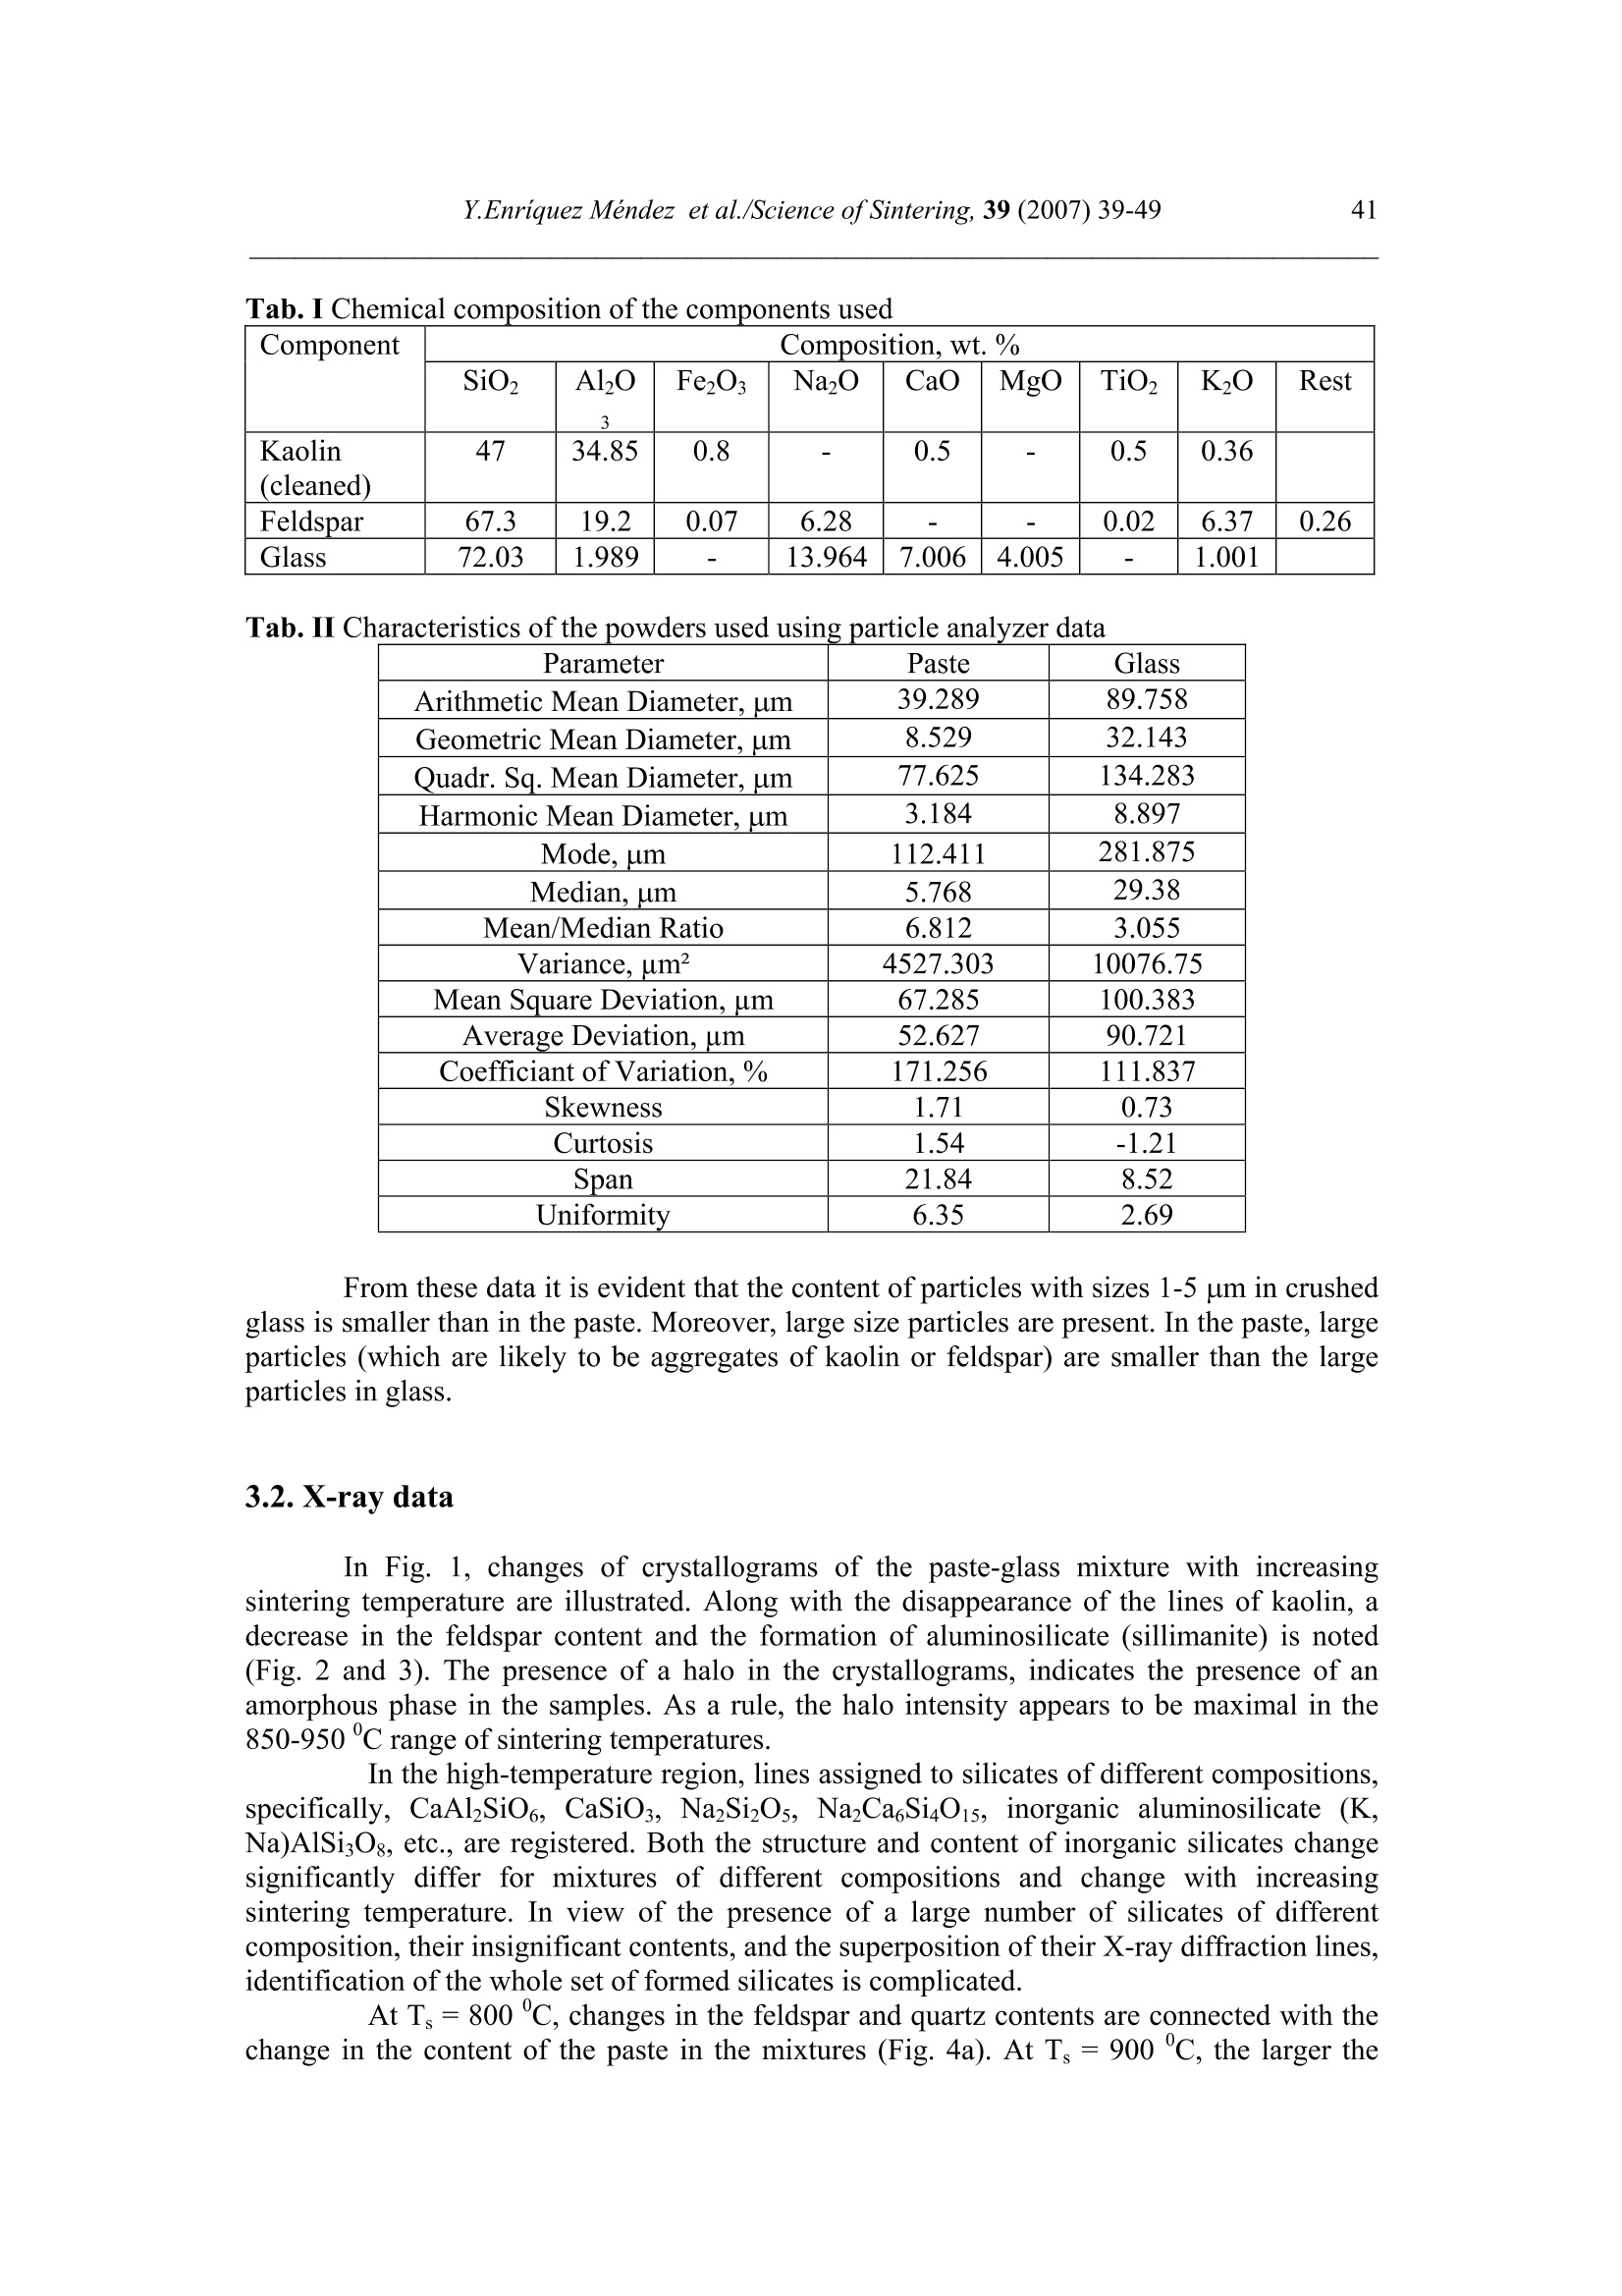
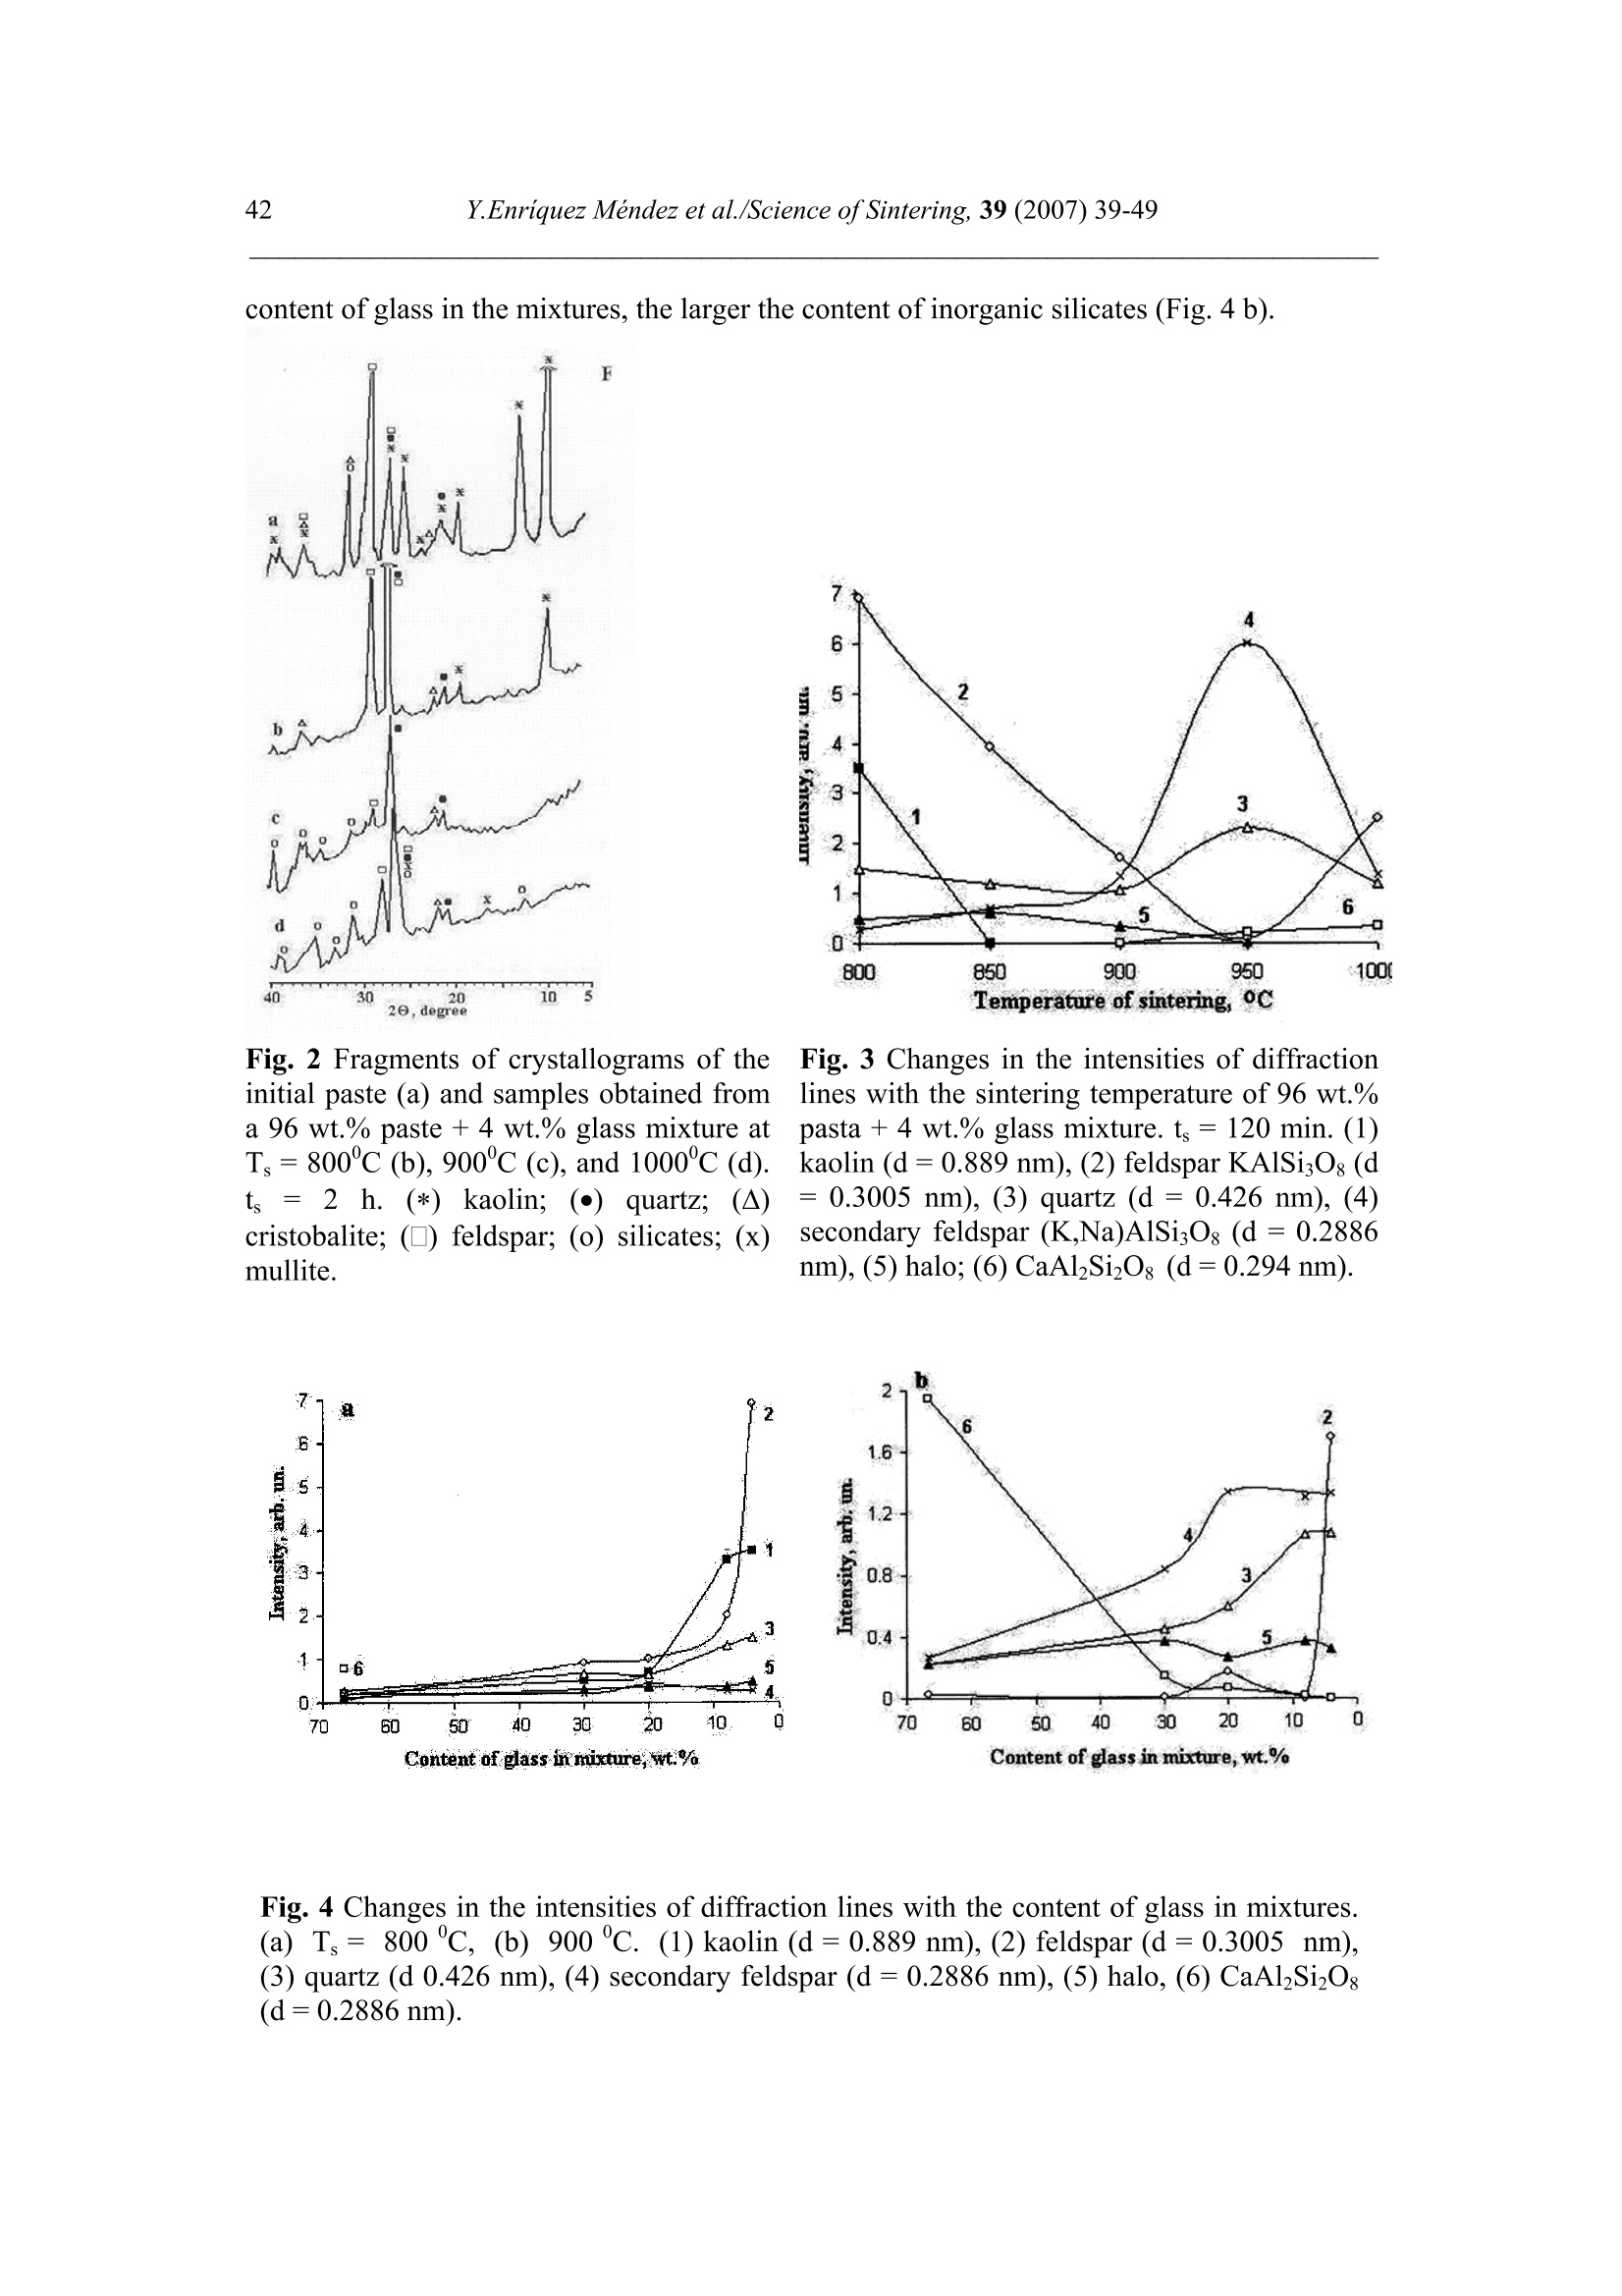
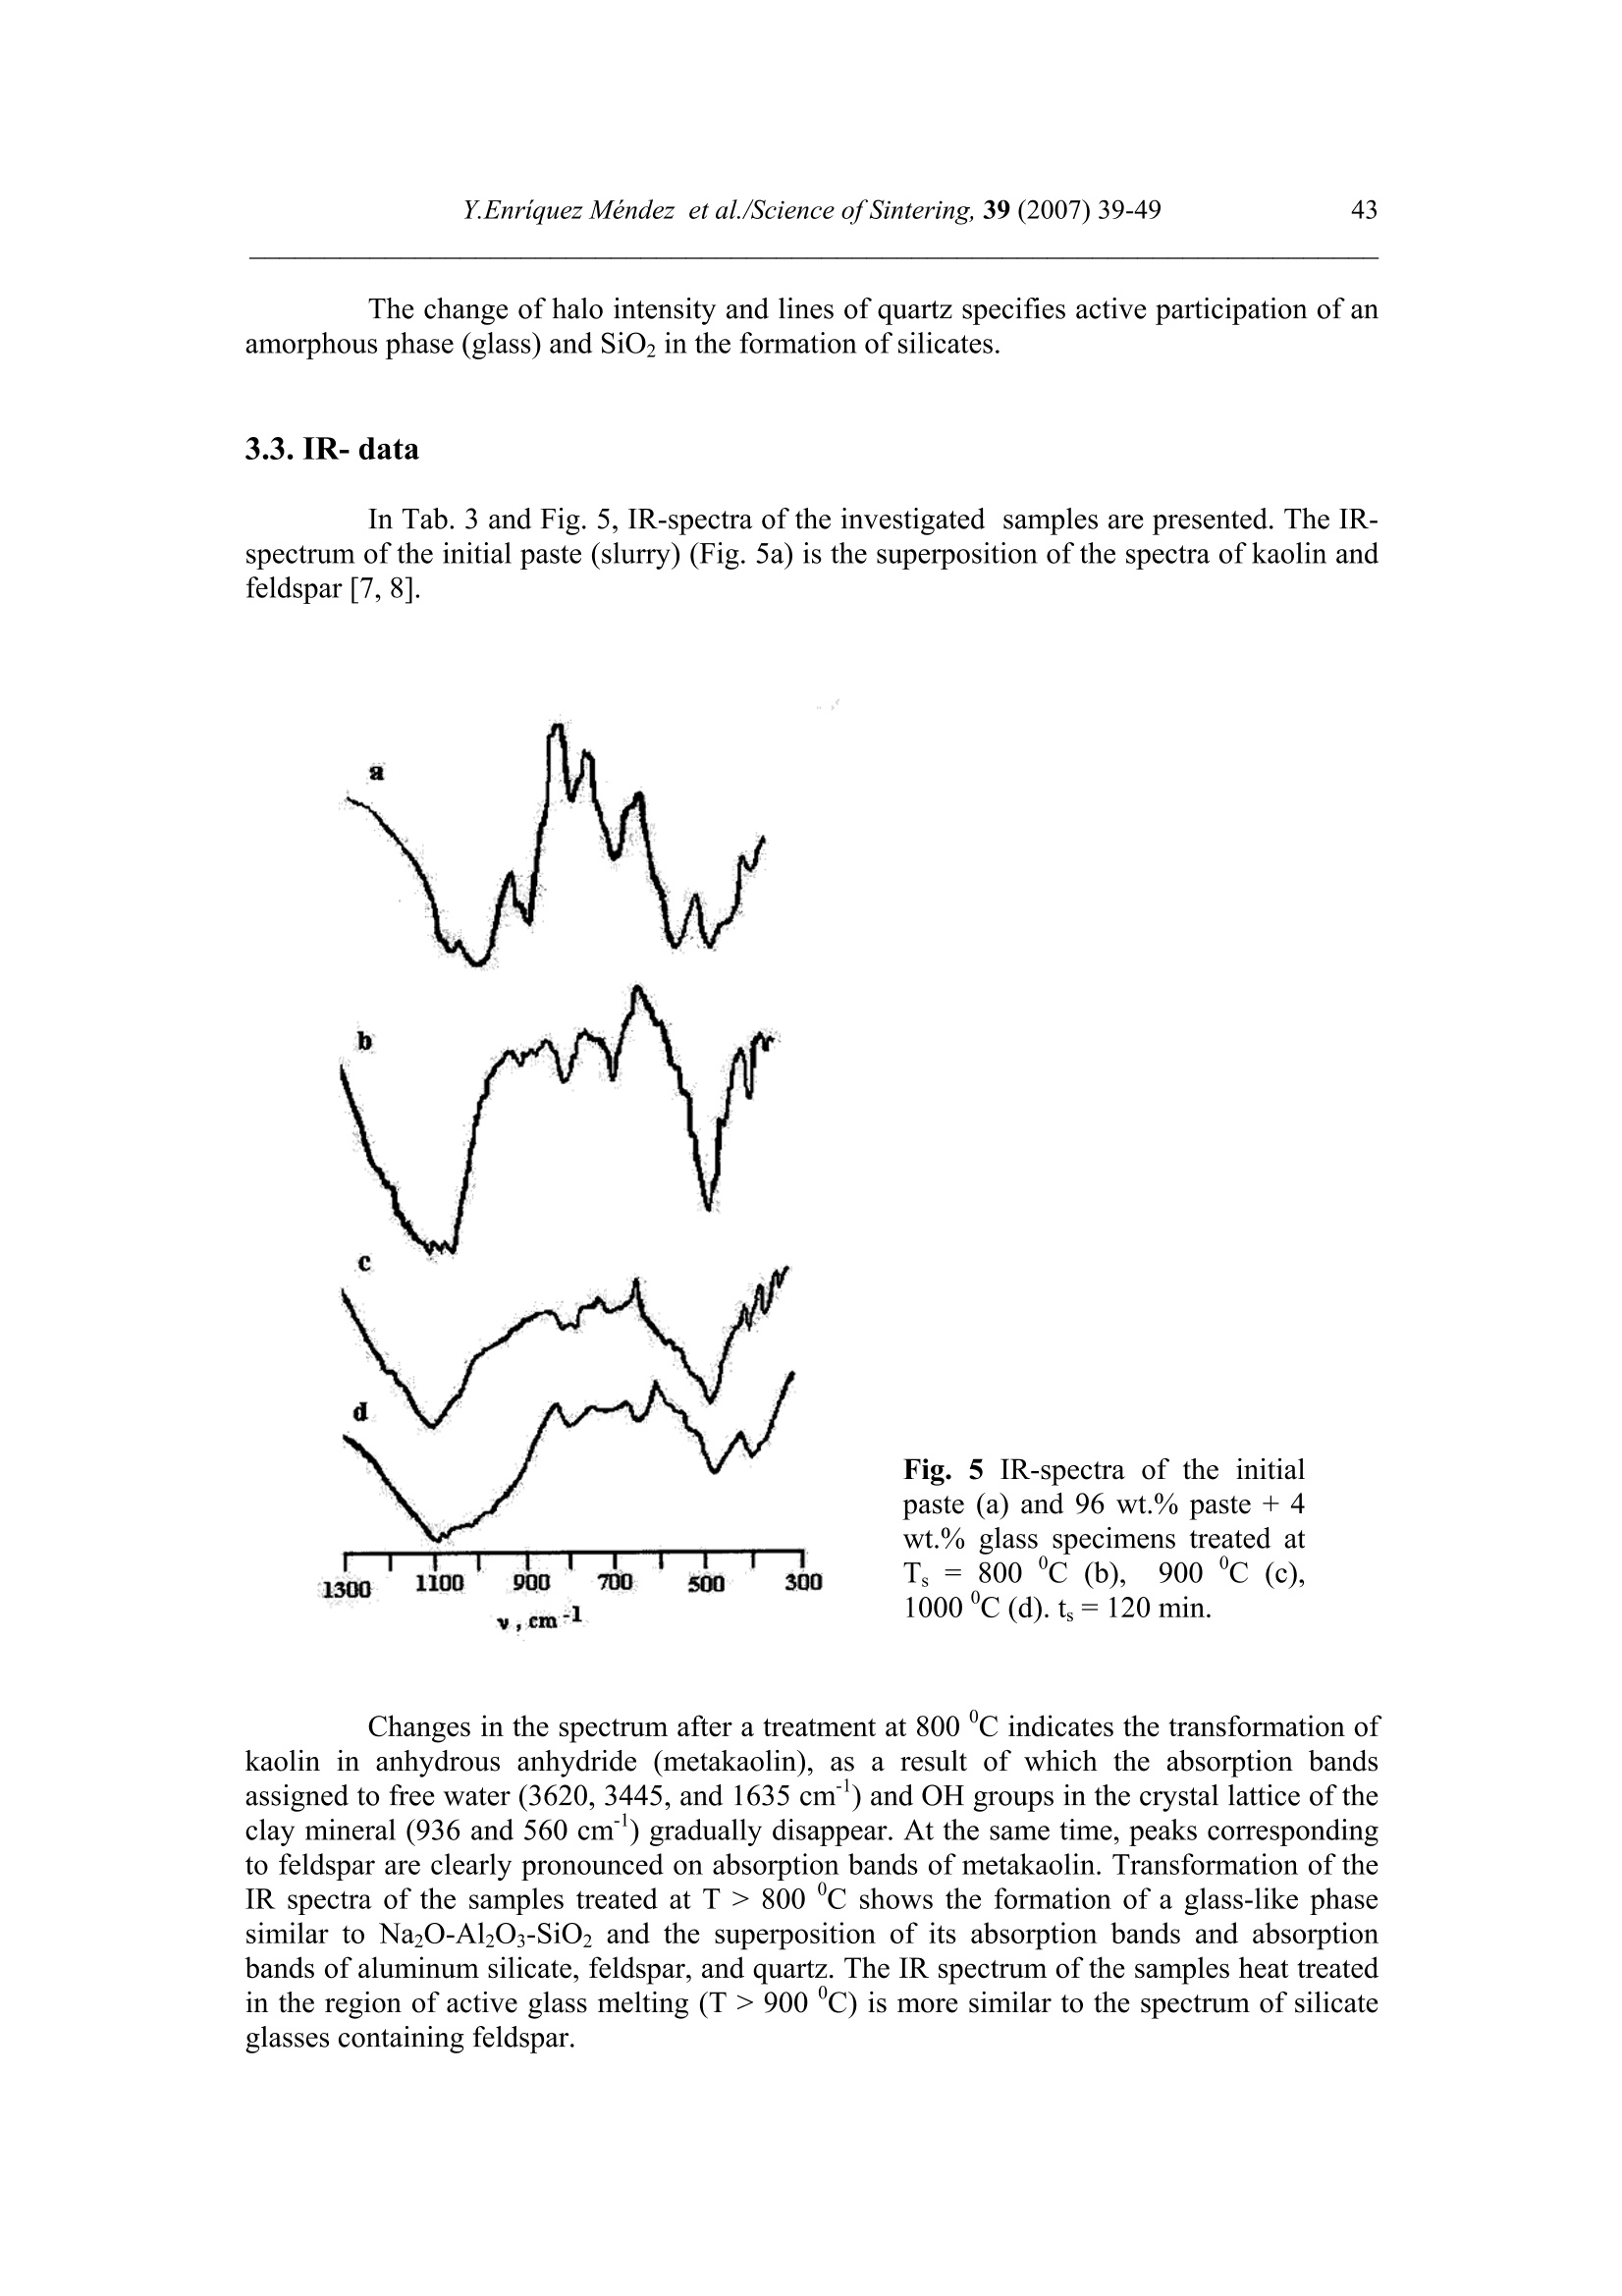
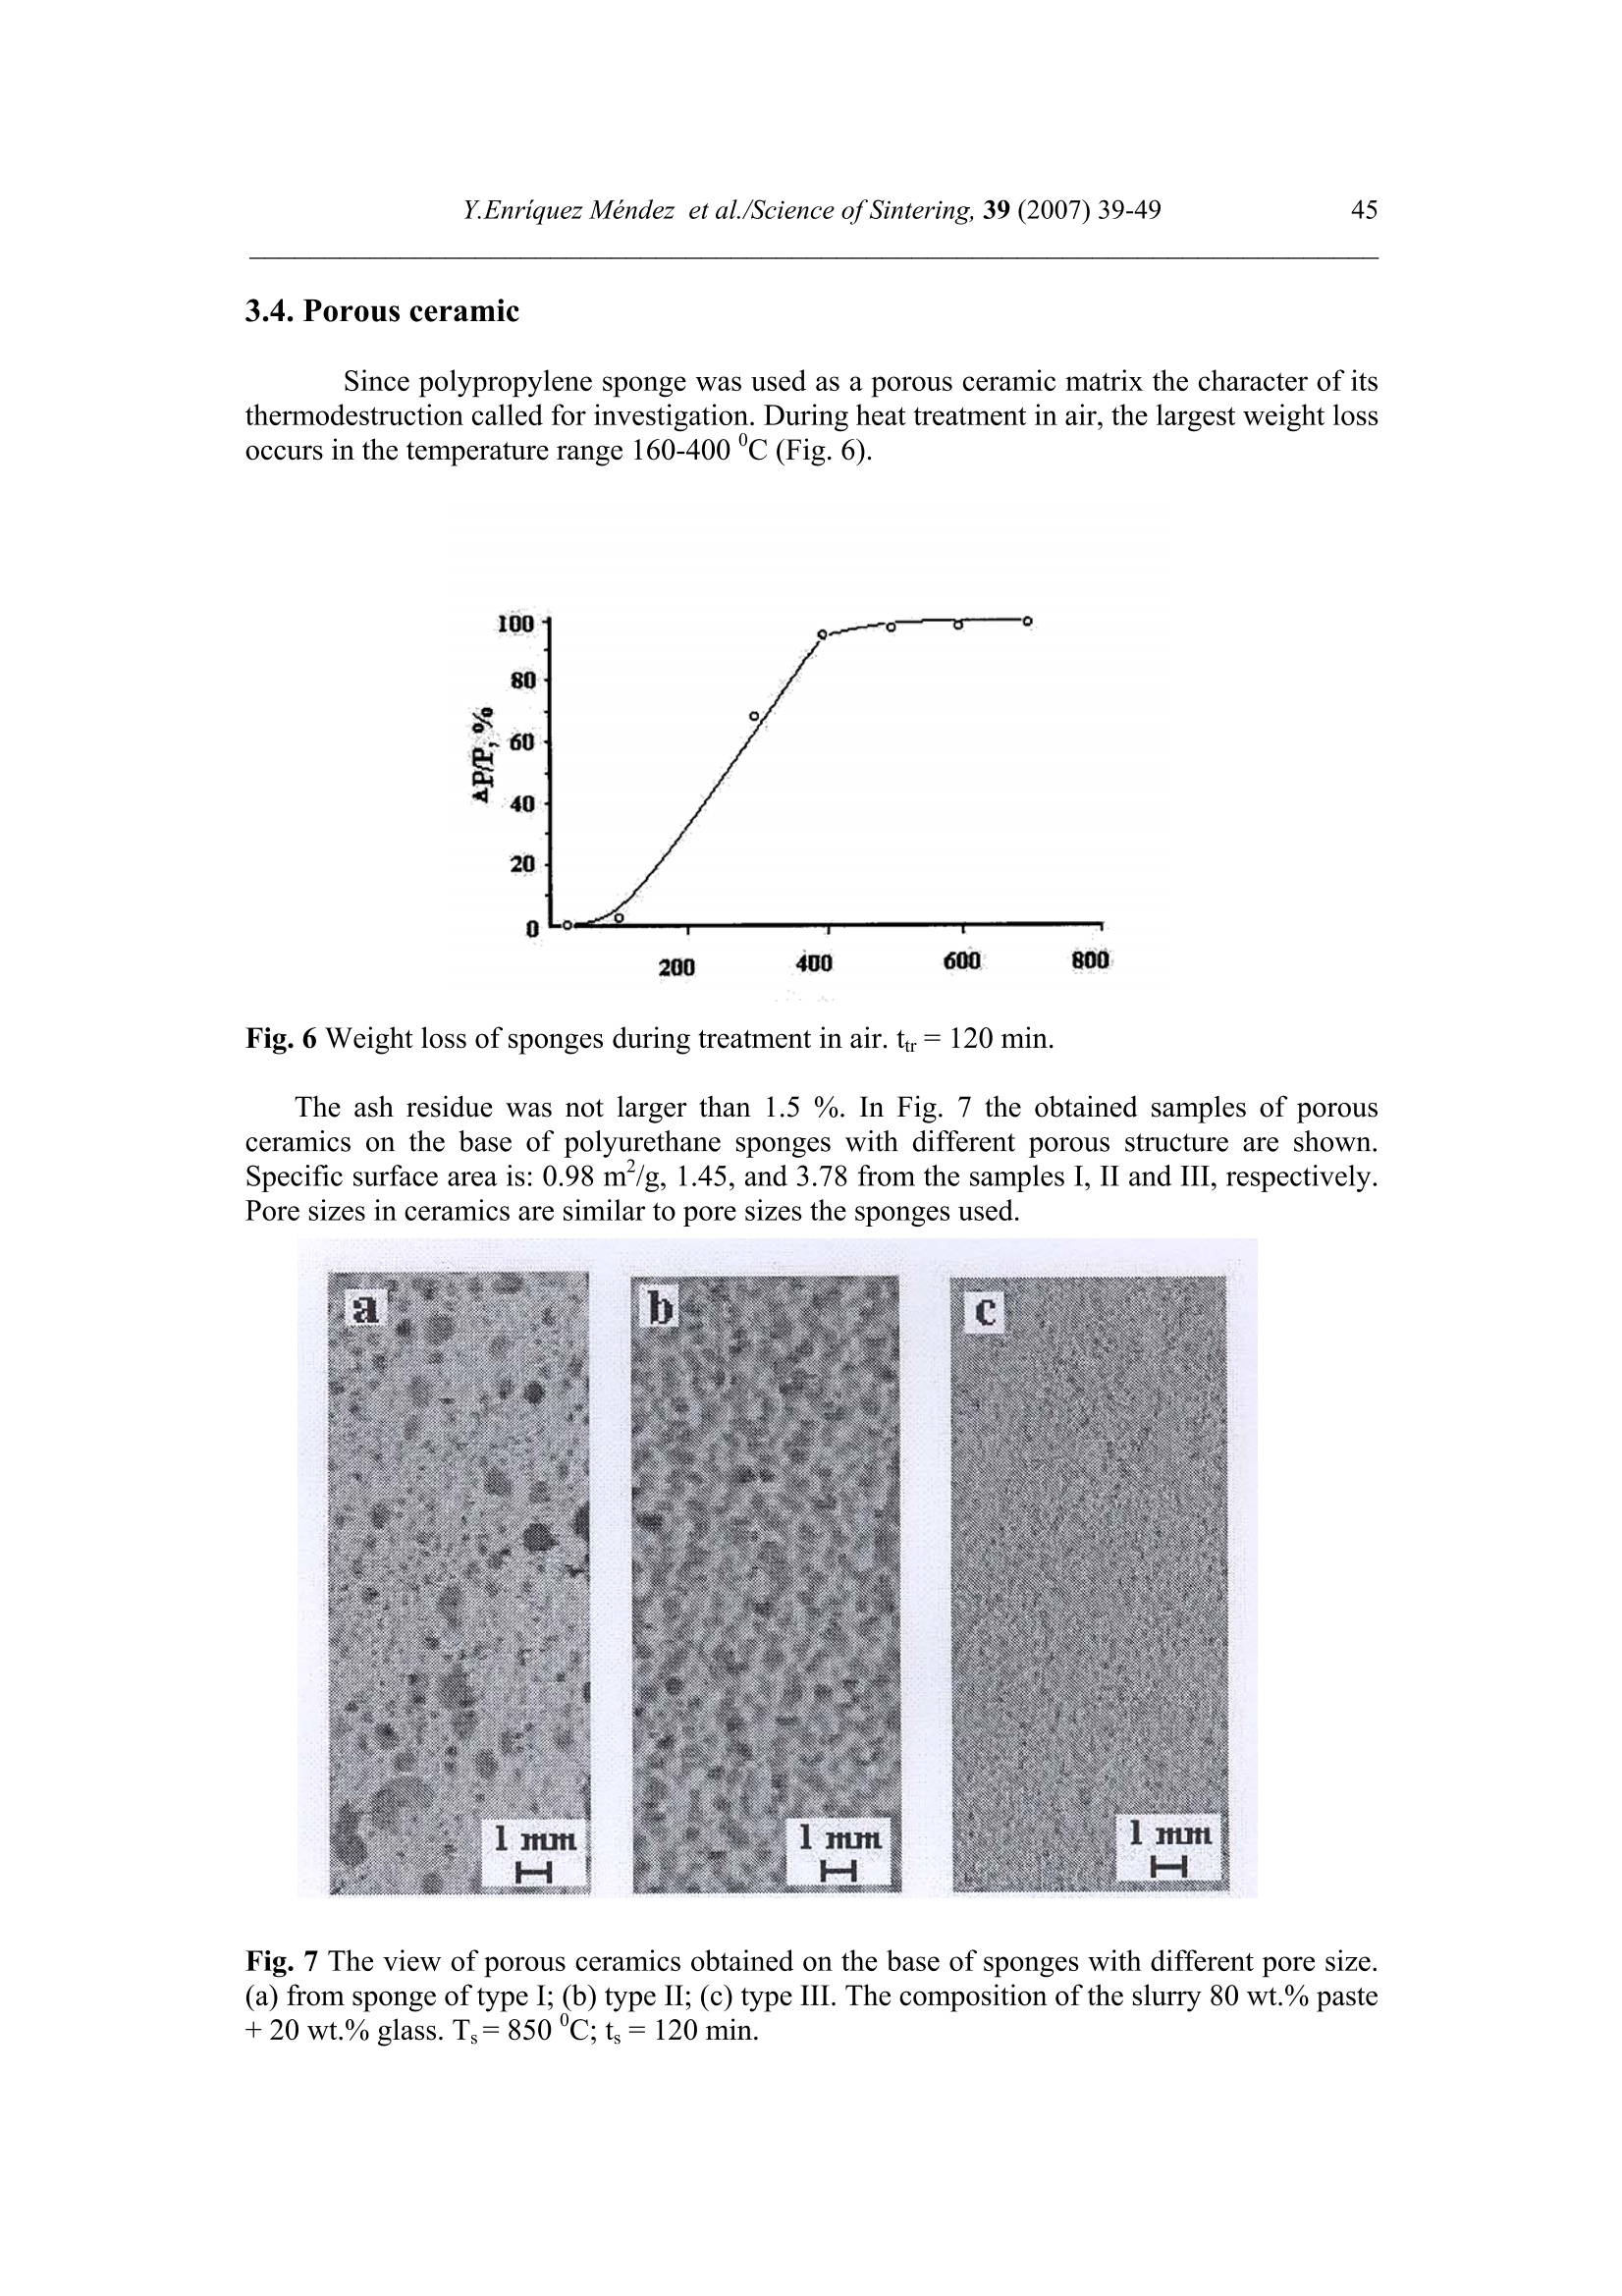
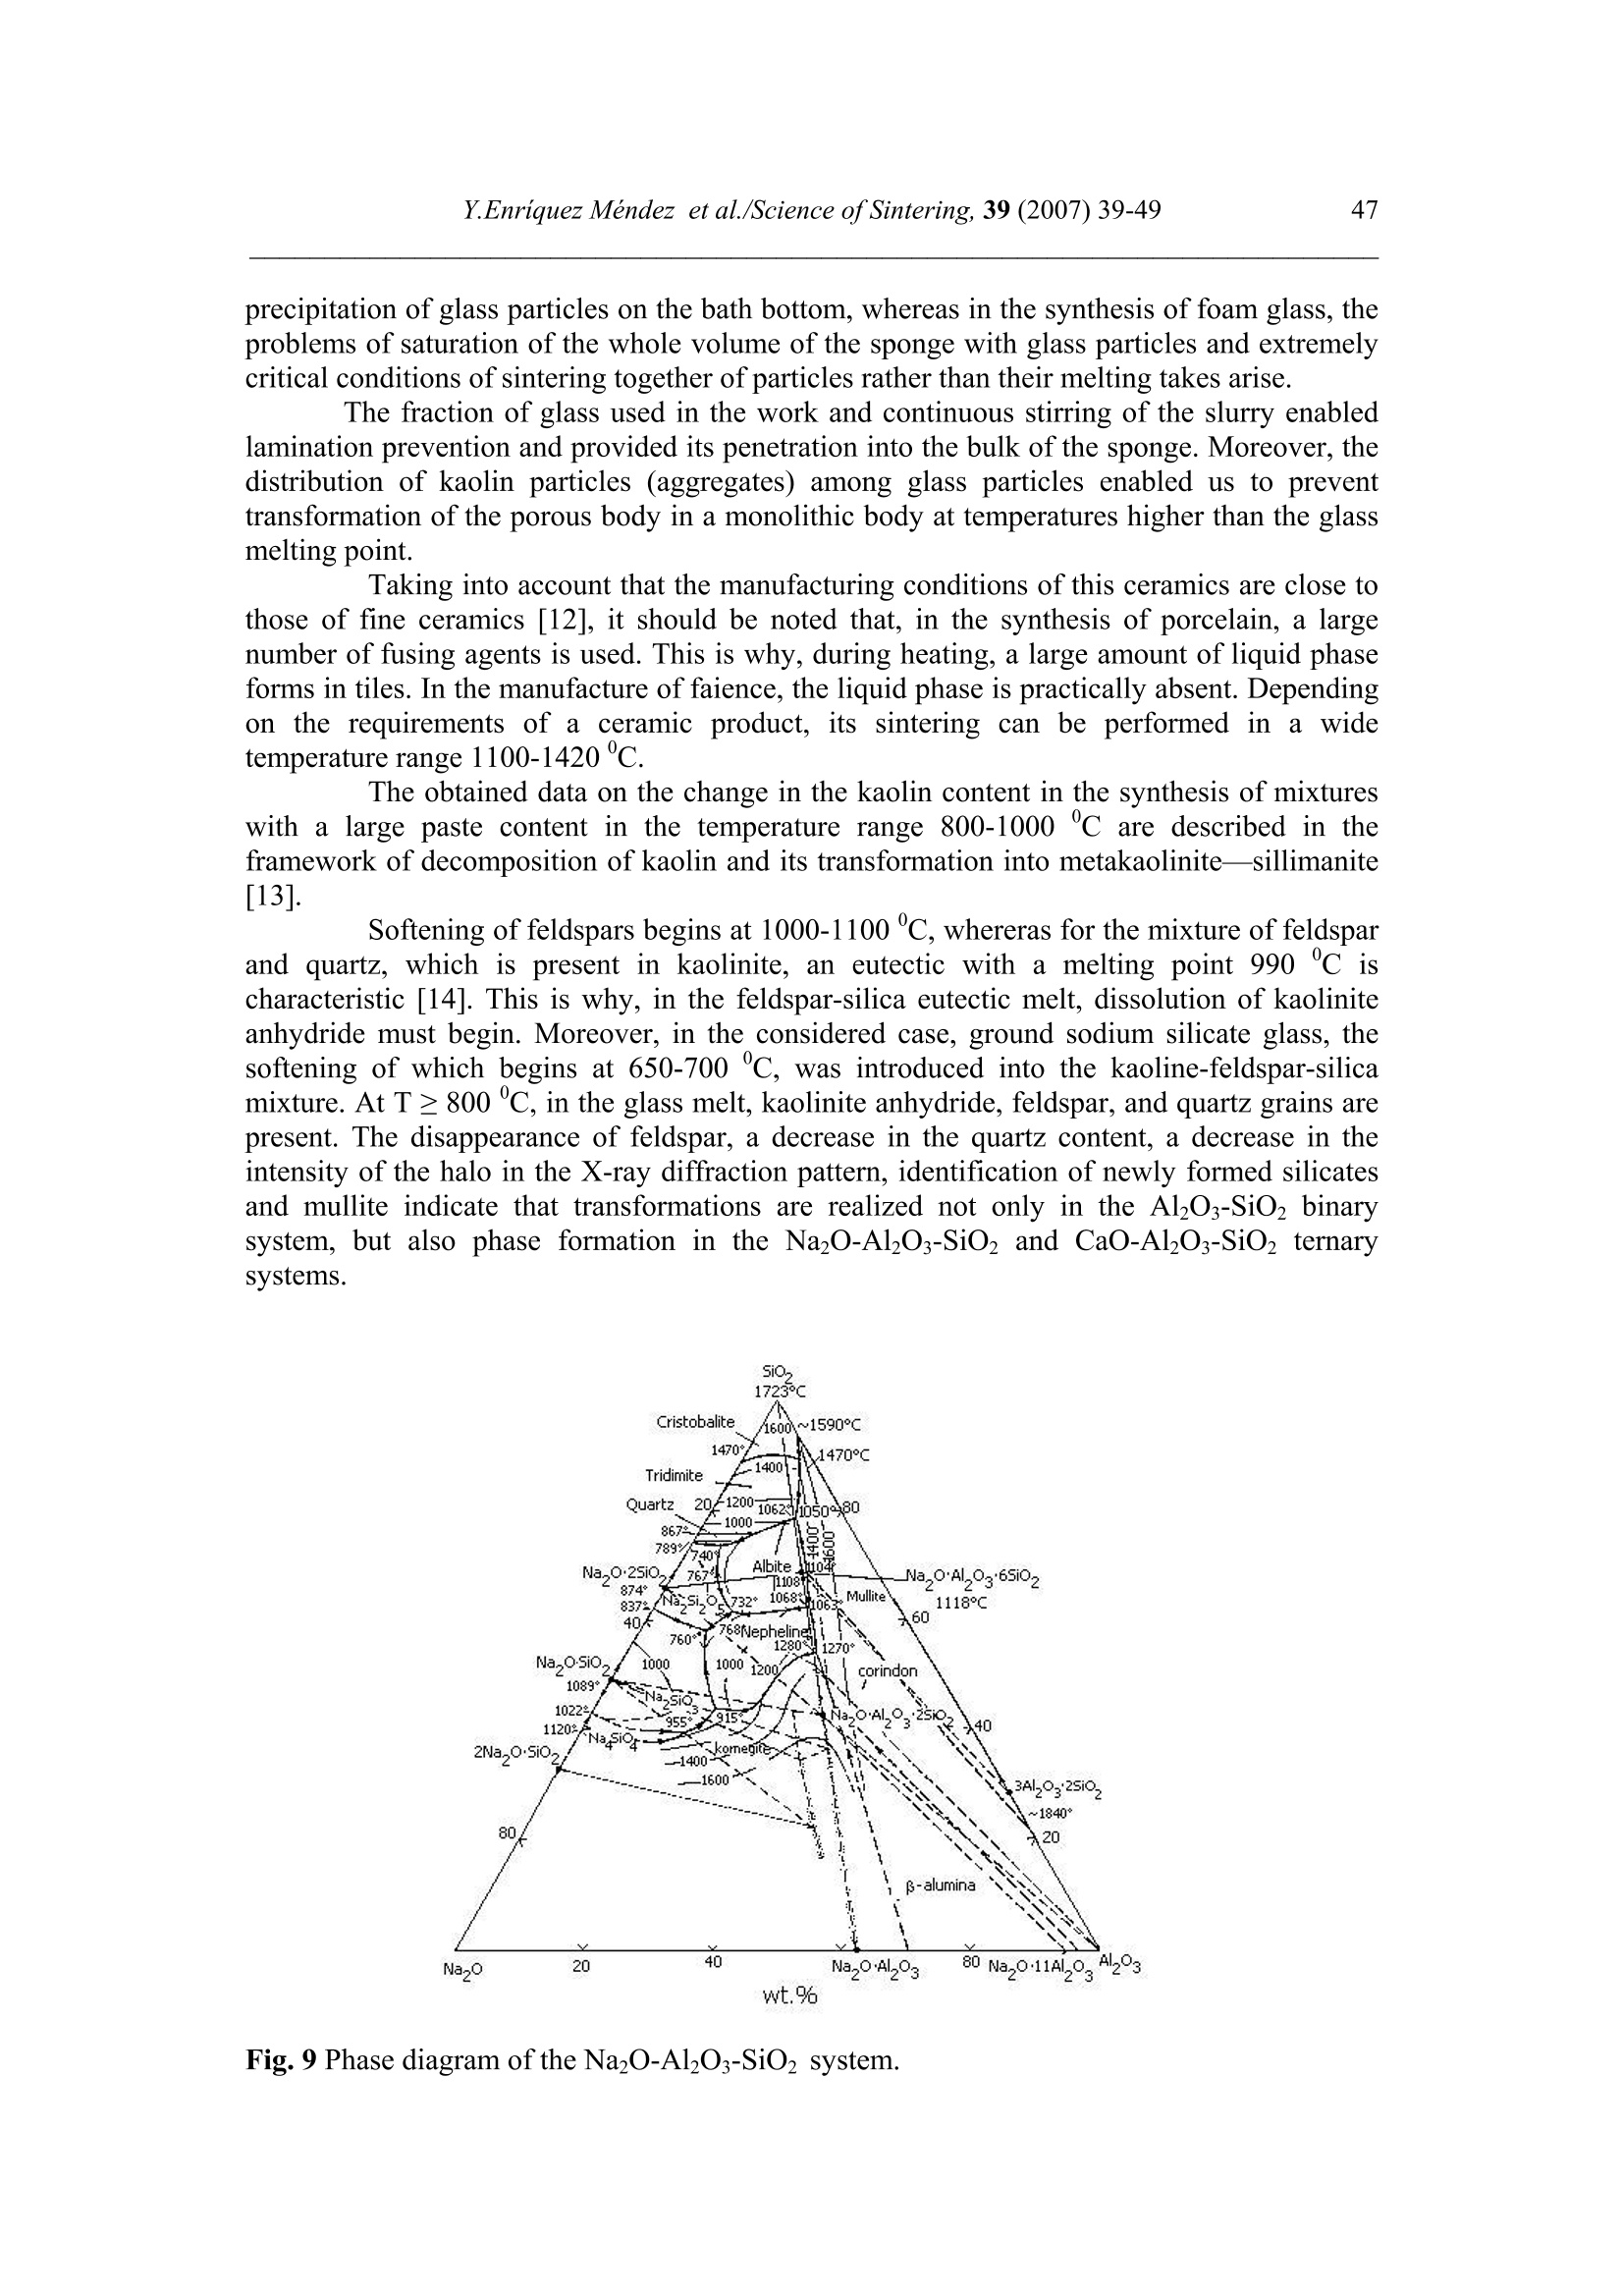
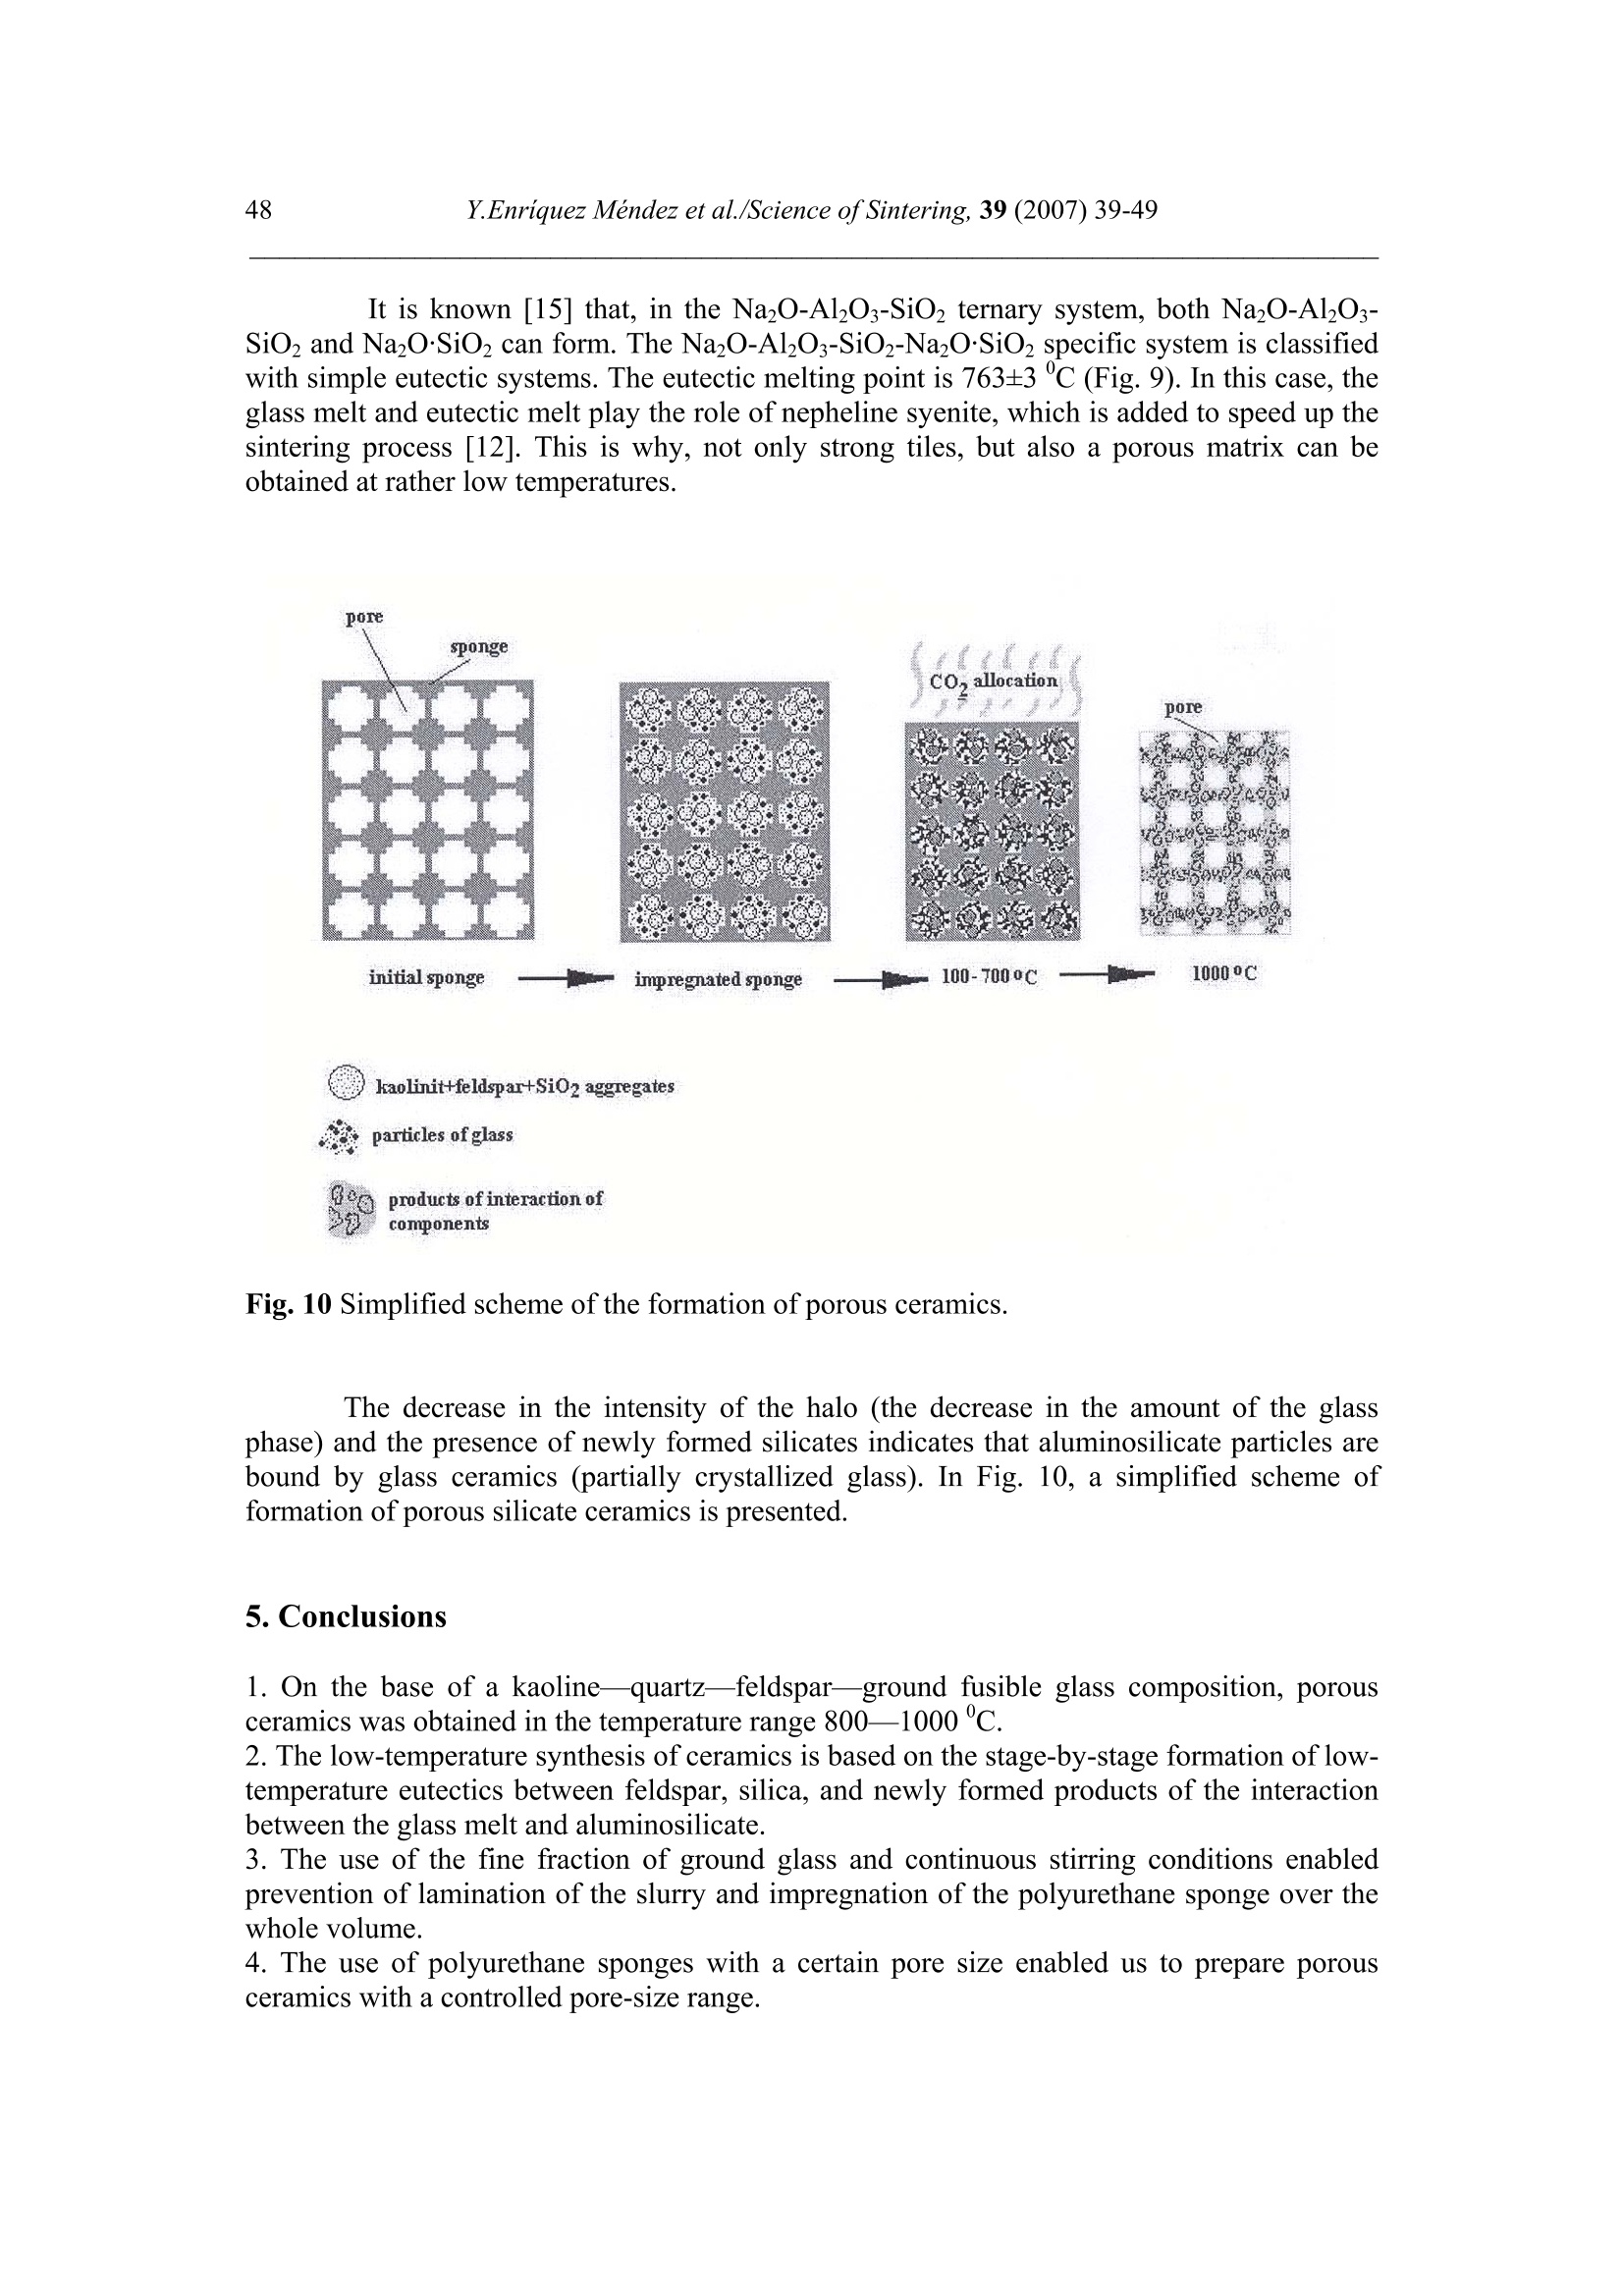
Science of Sintering, 39 (2007)39-49 40Y.Enriquez Mendez et al./Science of Sintering, 39 (2007) 39-49 Corresponding author: kakazey@hotmail.com DOI: 10.2298/SOS0701039M UDK 553.612:553.613:621.315.612:519.718 Low Temperature Synthesis of Porous Silicate Ceramics Y. Enriquez Mendez', M. Vlasoval*,I. Leon, M. G. Kakazey, M. Dominguez-Patino, L. Isaeva , T.Tomila’ The Autonomous University of the State of Morelos, Av. Universidad, 1001, Cuernavaca, Mexico The Institute for Problems of Materials Science, National Academy of Sciences ofUkraine, 3 Krzhyzhanovsky, Kiev, 252680, Ukraine Abstract: Impregnation ofa polyurethane sponge with kaolin, feldspar, silica, fusible glassslurry followed by temperature treatment in air in the temperature range 800-1000 "C leadsto the formation of aluminosilicate ceramics with a set pore size. The low-temperaturesynthesis of porous ceramics is based on the stage-by-stage formation of low-temperatureeutectics and thermodestruction of polyurethane sponge. Keywords: Kaolin, Feldspar, Glass, Polyurethane sponge, Synthesis. 1. Introduction Porous ceramics is extensively used in different fields of engineering [1-4]. Forporous ceramics used as a filtering material, its porous structure and properties connectedwith it, namely, pore size, permeability, specific surface area, etc., are of determiningsignificance. At present, the most extensively used manufacturing methods of porouspermeable ceramics are the following: processing of monofractional starting materials;foaming method; method of burning-out of additives; chemical method of pore formation[5-6]. Each manufacturing method of porous permeable ceramics has both advantages andessential disadvantages. Specifically, ceramics prepared by the foaming method and chemicalmethod of pore formation is characterized by low permeability due to predominantly closedporosity, whereas ceramics obtained by the method of burning-out of additives has aninhomogeneous porous structure, which is connected with the fact that a homogeneousdistribution of components in the volume of the mixture is difficult to obtain. This is why thesearch for new manufacturing technologies for porous ceramics is being continuously carriedout. The aim of the work is to perform low-temperature synthesis of kaolin-basedporous ceramics with a certain pore size by the method of burning-out of additives. Adecrease in the sintering temperature of ceramics is expected using fusible silicate additivesthat serve as a binder of metakaolin or sillimanite grains. Polyurethane sponge was chosen asa porous matrix. 2. Preparation of samples and experimental procedure In the work, a mixture of kaolin (35 wt.%) with feldspar (30 wt.%) and quartz(35 wt.%) additives was used. This mixture is referred to as the “paste". Such a mixture isusually used in manufacturing of art ceramics by the method of molding in gypsum molds.Feldspar serves as a diluent. Ground glass was introduced in the composition, and its contentwas varied from 4 to 80%. A slurry was prepared by adding water to the paste. To record structural-phase transformations proceeding during sintering and todetermine sintering conditions providing the synthesis of a strong product, the prepared slurrywas poured in gypsum moulds and held in them until separation from the moulds. Theobtained intermediate product in the form of disks 40 mm in diameter and 10 mm in thicknesswas dried under natural conditions. Then the disks were placed in a furnace. The sinteringtemperature was varied from 800 to 1000C. The sintering time ranged from 60 to 120 min.In the preparation of porous ceramics, polyurethane sponges of different pore size were used:(7+0.1) mm (I type), (0.5+2) mm (II type), and (0.1+1) mm (III type). The sponge wasimpregnated by the slurry with continuous stirring. The sponge size was 100 x 50 x 50 mm.After drying under natural conditions, the semiproduct was heat treated in a furnace in thetemperature range 800-1000℃. The heat treatment time was varied from 60 to 120 min. The structural-phase transformations were investigated by X-ray diffraction in Cu Koradiation (diffractometer Siemens D-500), IR spectroscopy (Specord M 80 spectrometer),electron microscopy (Jeol 6400), and the adsorption-structural static volume method (ASAP-2000M). Particle size was measured on a laser particle sizer in wet dispersing regimen withthe using of continuous stirring and ultrasound application (Analysette 22 COMPACT unit). 3. Results 3.1.Powder characteristics In Tab. I, kaolin, feldspar, and glass compositions are presented. In Tab. II and Fig. 1,characteristics of paste and glass powders are given. Fig. 1 Particle-size distribution in paste (a) and ground glass waste (b). Tab. I Chemical composition of the components used Component Composition, wt.% SiO2 Al203 Fe203 NazO CaO MgO TiO2 K2O Rest Kaolin (cleaned) 47 34.85 0.8 - 0.5 - 0.5 0.36 Feldspar 67.3 19.2 0.07 6.28 - 0.02 6.37 0.26 Glass 72.03 1.989 - 13.964 7.006 4.005 - 1.001 Tab. II Characteristics of the powders used using particle analyzer data Parameter Paste Glass Arithmetic Mean Diameter, um 39.289 89.758 Geometric Mean Diameter, um 8.529 32.143 Quadr. Sq. Mean Diameter, um 77.625 134.283 Harmonic Mean Diameter, um 3.184 8.897 Mode, um 112.411 281.875 Median, um 5.768 29.38 Mean/Median Ratio 6.812 3.055 Variance, um’ 4527.303 10076.75 Mean Square Deviation, um 67.285 100.383 Average Deviation, um 52.627 90.721 Coefficiant of Variation, % 171.256 111.837 Skewness 1.71 0.73 Curtosis 1.54 -1.21 Span 21.84 8.52 Uniformity 6.35 2.69 From these data it is evident that the content of particles with sizes 1-5 um in crushedglass is smaller than in the paste. Moreover, large size particles are present. In the paste, largeparticles (which are likely to be aggregates of kaolin or feldspar) are smaller than the largeparticles in glass. 3.2. X-ray data In Fig. 1, changes of crystallograms of the paste-glass mixture with increasingsintering temperature are illustrated. Along with the disappearance of the lines ofkaolin, adecrease in the feldspar content and the formation of aluminosilicate (sillimanite) is noted(Fig. 2 and 3). The presence of a halo in the crystallograms, indicates the presence of anamorphous phase in the samples. As a rule, the halo intensity appears to be maximal in the850-950℃ range of sintering temperatures. In the high-temperature region, lines assigned to silicates of different compositions,specifically, CaAlzSiO, CaSiOs, NazSizO5, NazCa,Si4O15, inorganic aluminosilicate (K,Na)AlSigO, etc., are registered. Both the structure and content of inorganic silicates changesignificantly differ for mixtures of different compositions and change with increasingsintering temperature. In view of the presence of a large number of silicates of differentcomposition, their insignificant contents, and the superposition of their X-ray diffraction lines,identification of the whole set of formed silicates is complicated. At Ts =800℃, changes in the feldspar and quartz contents are connected with thechange in the content of the paste in the mixtures (Fig. 4a). At Ts = 900C, the larger the content of glass in the mixtures, the larger the content of inorganic silicates (Fig. 4 b). Fig.2 Fragments of crystallograms of theinitial paste (a) and samples obtained froma 96 wt.% paste + 4 wt.% glass mixture atTs=800℃(b), 900c (c), and 1000c (d).ts= 2 h.(*) kaolin; ()quartz;(A)cristobalite; (口) feldspar; (o) silicates; (x)mullite. Fig. 3 Changes in the intensities of diffractionlines with the sintering temperature of 96 wt.%pasta + 4 wt.% glass mixture. ts=120 min. (1)kaolin (d=0.889 nm), (2) feldspar KAlSi;O:(d=0.3005 nm), (3) quartz (d=0.426 nm), (4)secondary feldspar (K,Na)AlSi30: (d=0.2886nm), (5) halo;(6) CaAl2Si2O:(d=0.294nm). Fig. 4 Changes in the intensities of diffraction lines with the content of glass in mixtures.(a) Ts= 800 ℃, (b) 900 ℃. (1) kaolin (d=0.889 nm), (2) feldspar (d=0.3005 nm),(3) quartz (d 0.426 nm), (4) secondary feldspar (d=0.2886 nm), (5) halo,(6) CaAlzSi2O:(d=0.2886nm). The change of halo intensity and lines of quartz specifies active participation of anamorphous phase (glass) and SiO2 in the formation of silicates. 3.3.IR-data In Tab. 3 and Fig.5, IR-spectra of the investigated samples are presented. The IR-spectrum of the initial paste (slurry) (Fig. 5a) is the superposition of the spectra of kaolin andfeldspar [7,8]. Fig. 5 IR-spectra of the initialpaste (a) and 96 wt.% paste + 4wt.% glass specimens treated atTs = 800℃ (b),,900 c (c),1000℃ (d). ts=120 min. Changes in the spectrum after a treatment at 800℃ indicates the transformation ofkaolin in anhydrous anhydride (metakaolin), as a result of which the absorption bandsassigned to free water (3620, 3445, and 1635 cm) and OH groups in the crystal lattice of theclay mineral (936 and 560 cm°) gradually disappear. At the same time, peaks correspondingto feldspar are clearly pronounced on absorption bands of metakaolin. Transformation of theIR spectra of the samples treated at T>800C shows the formation of a glass-like phasesimilar to NazO-Al2O3-SiO2 and the superposition of its absorption bands and absorptionbands of aluminum silicate, feldspar,and quartz. The IR spectrum of the samples heat treatedin the region of active glass melting (T > 900℃) is more similar to the spectrum of silicateglasses containing feldspar. Tab.III IR absorption bands in investigated samples. Samples -1v, cm Kaolin 3663s.1639m. 1036s.1120sh. 936m.914 m. 800790m. 695m. 556s. 470 m.430411370 Meta-kaolin 1068s.1150sh.1200sh.1260sh. 807m. 670w. not 480m.450m.430m. SiO2 (quartz) 1084s.1150sh. 798m.780 697w.652w. 520w. 466s. SiO2 (cristobalite) 1119s.1172sh. 800w. 619m. 496s. FeldsparCa[Al2Si2O:] 1141 1080}s.wd.1015 755 727}m.wd683 620m. {574s.602sh.537s. Glass Na2O-Al203-SiO, 1160s.wd.980sh. 800w. 580w. 480s. Slurry: Initial T=800c,t=120 min T=900℃,t=120 min. T=1000c,t=120 min. 3663s.1639m 1036s.1120sh. 990sh.1053s.1060sh.1100sh. 1100s.wd.950sh. 1100s.wd.1000sh. 936sh.904 m. 900w. 1800 790m. 800m. 800w.790w. 800w. 700m. 700m. 700w.690w. 640w. 570s.550sh.580sh. 620w. 470m.430sh. 400m.440sh.480s.550sh. 480s.wd.580sh.400w. 490s.wd.400m.580sh. Note: s. is a strong band, m. is middle, w. is weak, wd. is wide, sh. is shoulder. 3.4.Porous ceramic Since polypropylene sponge was used as a porous ceramic matrix the character of itsthermodestruction called for investigation. During heat treatment in air, the largest weight lossoccurs in the temperature range 160-400 ℃ (Fig. 6). Fig. 6 Weight loss of sponges during treatment in air. trr=120 min. The ash residue was not larger than 1.5 %. In Fig. 7 the obtained samples of porousceramics on the base of polyurethane sponges with different porous structure are shown.Specific surface area is: 0.98 m²/g, 1.45, and 3.78 from the samples I, II and III, respectively.Pore sizes in ceramics are similar to pore sizes the sponges used. Fig. 7 The view of porous ceramics obtained on the base of sponges with different pore size.(a) from sponge of type I;(b) type II; (c) type III.The composition of the slurry 80 wt.% paste+20 wt.% glass. T一=850c; ts=120 min. The internal surface of pores in ceramics of type I, II, and III is different (Fig.8). Inceramics of type I it has a "glazed" view in greater pores (Fig. 8 a’). In ceramics of type III,the surface view surface corresponds to a higher degree to a ceramic surface (Fig. 8 b’). Itshould be noted that, in all types of porous ceramics, depending on the pore size, bothextreme cases,and their combination can be observed. Fig. 8 Micrographs of the internal surface of pores for ceramics of type I (a, a’) and type IIIi(b, b’). According to the X-ray microanalysis data, as the pore size decreases, the number ofelements which enter the composition of aluminum silicate (Al, Fe, Ti) increases, and thenumber of elements which enter the composition of glass (Na, Ca,Mg) decreases. Taking intoaccount the disperse composition of glass and paste particles, it can be assumed that this iscaused by the difference between the particle size and the pore size. Large glass particlescannot penetrate into small pores, whereas small paste particles can easily enter them. The structural-phase reorganization of the components of the mixtures does notdiffer from that in pore-free ceramics. 4. Discussion Synthesis of porous silicate ceramics using porous polyurethane sponge is wellknown (foam rubber)[9,10]. Porous glass is most often obtained from ground brokendomestic and industrial glass by the foaming method [11]. However, in the preparation ofporous ceramics on the base of clay minerals, ground glass is not introduced into the slurry.The sintering temperature ranges from 1300 to 1500 ℃. At the same time, a polyurethanesponge is not used in the manufacturing of porous glass, since the formation of a porousstructure homogeneous over the volume with a homogeneous pore size fails, though thesintering temperature is not higher than 1000 C. In principle, this is caused by the size ofglass particles. In the preparation of ceramics one should avoid slurry lamination and precipitation of glass particles on the bath bottom, whereas in the synthesis of foam glass, theproblems of saturation of the whole volume of the sponge with glass particles and extremelycritical conditions of sintering together of particles rather than their melting takes arise. The fraction of glass used in the work and continuous stirring of the slurry enabledlamination prevention and provided its penetration into the bulk of the sponge.Moreover, thedistribution of kaolin particles (aggregates) among glass particles enabled us to preventtransformation of the porous body in a monolithic body at temperatures higher than the glassmelting point. Taking into account that the manufacturing conditions of this ceramics are close tothose of fine ceramics [12], it should be noted that, in the synthesis of porcelain, a largenumber of fusing agents is used. This is why, during heating, a large amount of liquid phaseforms in tiles. In the manufacture of faience, the liquid phase is practically absent. Dependingon the requirements of a ceramic product, its sintering can be performed in a widetemperature range 1100-1420 c. The obtained data on the change in the kaolin content in the synthesis of mixtureswith a large paste content in the temperature range 800-1000C are described in theframework of decomposition of kaolin and its transformation into metakaolinite-sillimanite[13]. Softening of feldspars begins at 1000-1100 ℃, whereras for the mixture of feldsparand quartz, which is present in kaolinite, an eutectic with a melting point 990℃ ischaracteristic [14]. This is why, in the feldspar-silica eutectic melt, dissolution of kaoliniteanhydride must begin. Moreover, in the considered case, ground sodium silicate glass, thesoftening of which begins at 650-700 C, was introduced into the kaoline-feldspar-silicamixture. At T≥800℃, in the glass melt, kaolinite anhydride, feldspar, and quartz grains arepresent. The disappearance of feldspar, a decrease in the quartz content, a decrease in theintensity of the halo in the X-ray diffraction pattern, identification of newly formed silicatesand mullite indicate that transformations are realized not only in the Alz3-SiO2 binarysystem, but also phase formation in the NazO-Al2O3-SiO2 and CaO-Al2O3-SiO2 ternarysystems. Fig. 9 Phase diagram of the NazO-Al2O3-SiO2 system. It is known [15] that, in the Na2O-Al2O3-SiO2 ternary system, both NazO-Al2O3-SiO and NazO.SiO2 can form. The NazO-Al2O3-SiO2-NazO.SiO2 specific system is classifiedwith simple eutectic systems. The eutectic melting point is 763±3 ℃ (Fig.9). In this case, theglass melt and eutectic melt play the role of nepheline syenite, which is added to speed up thesintering process [12]. This is why, not only strong tiles, but also a porous matrix can beobtained at rather low temperatures. Fig. 10 Simplified scheme of the formation of porous ceramics. The decrease in the intensity of the halo (the decrease in the amount of the glassphase) and the presence of newly formed silicates indicates that aluminosilicate particles arebound by glass ceramics (partially crystallized glass). In Fig. 10, a simplified scheme offormation of porous silicate ceramics is presented. 5. Conclusions 1. On the base of a kaolinequartz-feldspar-ground fusible glass composition, porousceramics was obtained in the temperature range 800-1000℃. 2. The low-temperature synthesis of ceramics is based on the stage-by-stage formation of low-temperature eutectics between feldspar, silica, and newly formed products of the interactionbetween the glass melt and aluminosilicate. 3. The use of the fine fraction of ground glass and continuous stirring conditions enabledprevention of lamination of the slurry and impregnation of the polyurethane sponge over thewhole volume. 4. The use of polyurethane sponges with a certain pore size enabled us to prepare porousceramics with a controlled pore-size range. References 1. Handbook of Advanced ceramics, v.II. Processing and their Applications. Eds. S.Somiya, F. Aldinger, N. Claussen, R.M. Spriggs, K. Uchino, K. Koumoto, M.Kaneno, Elsevier Acad. Press, Amsterdam, Tokyo, p.291-312. 2. A. Julbe, D. Farrusseng, C. Guizard, Catalysis Today 104 (2005) 102 3.S. Sharafat, N. Ghoniem, B. Williams, and J. Babcock, Presented at the 16 ANSTopical Meeting on the Technology of Fusion Energy, Madison WI, Sept. 14-16,2004. 4.T. Fend, R. Paal, P. Paal, O. Reutter, J. Bauer, B. Hoffschmidt, Solar EnergyMaterials& Solar Cell, 84 (2004)291. 5.I. Ya. Guzman, Refractory High-Porosity Ceramics, Metallurgy, Moscow, 1971. 6.I. P. Sepulveda, J.G.P. Binner, J. Eur.Ceram.Soc. 19 (1999)2059. 7. K. Nacamoto Infra-red Spectra of Inorganic and Coordinated Compounds. Wiley,New York, 1970. 8.Data Base of FTIR-spectra http//:www.chem.uni-postdam.de/tools/index.html 9.1N. I. Belomerya, V.V. Efimov, Vopr. Khim. Khim. Tekhnol., 1 (2004), 58. (inRussian) 10. Nettleship, Key Eng. Mater. 122 (1996)305. 11. V. V. Goryainov, Development of Ecologically Safe Utilization Technologies ofBroken Glass and Wastes of Metallurgical Works. PhD Thesis, Nizhnii Novgorod,2002. 12. P. P. Budnikov, A. S. Berezhnoi, I. A. Bulavin, G. P. Kalliga, G. V. Kukolev, and D.N. Poluboyarinov, Technology of Ceramics and Refractories, GIL po Stroitel'stvu,Arkhitekture IiStroitel'nym Materialam, Moscow, 1968. 13. W.D Kingery, ed., Introduction to ceramics, N.-Y., London, Wiley.1963. 14. S.K. Das, K. Dana, Thermochimica Acta 406 (2003) 199. 15.E.F. Osborn, A. Muan,in: E.M. Levin, C.R. Robbins, H.F. Mc Murdie, Phasediagrams for ceramists, USA, Columbus, 1964, Fig. 712. Caopacaj: mnpezhauuja nonuypemaHcko2 cyHhepa KnuHKepom o0 KaonuHa, penocnapa,cunuke u mon.bueo2 cmakna 3a KojuM cneou memnepamyphu mpemmaH y ea3oyxy ymemnepamypHom oncezy 800-1000℃ 00600u 0o qopmuparba anymuHocunuKamHe kepamukeca 3aoamoM benuyuhom nopa. HuckomemnepamypHa cuhme3a nopo3He Kepamuke 3acHobaHaje Ha qopmupaiby HucKo memnepamypheeymekmukeqasa noqaa u mepmuykojoecmpykuuju nonuypemaHcko2 cyHhepa. ( K/byuHe peyu: KaonuH, penocnap, cmakno, nonuypemaHcku cyhhep, cunme3a. )
确定
还剩9页未读,是否继续阅读?

产品配置单

北京飞驰科学仪器有限公司为您提供《高岭土、石英、长石的混合物(陶瓷)中低温合成过程检测方案(激光粒度仪)》,该方案主要用于非金属矿产中低温合成过程检测,参考标准--,《高岭土、石英、长石的混合物(陶瓷)中低温合成过程检测方案(激光粒度仪)》用到的仪器有德国FRITSCH(飞驰)A22大量程纳米激光粒度仪
推荐专场


相关方案
更多
该厂商其他方案
更多