


本文对肖特公司的ZERODUR零膨胀陶瓷的热膨胀性能进行了全面的描述。首先对线膨胀系数的测量进行了描述,然后详细说明了平均线膨胀系数和线膨胀系数的均匀性,并对约200片ZERODUR镜片进行了测试评价并给出了质量统计分析。本文最后对热循环和低温环境对热膨胀系数的影响进行了总结。
方案详情

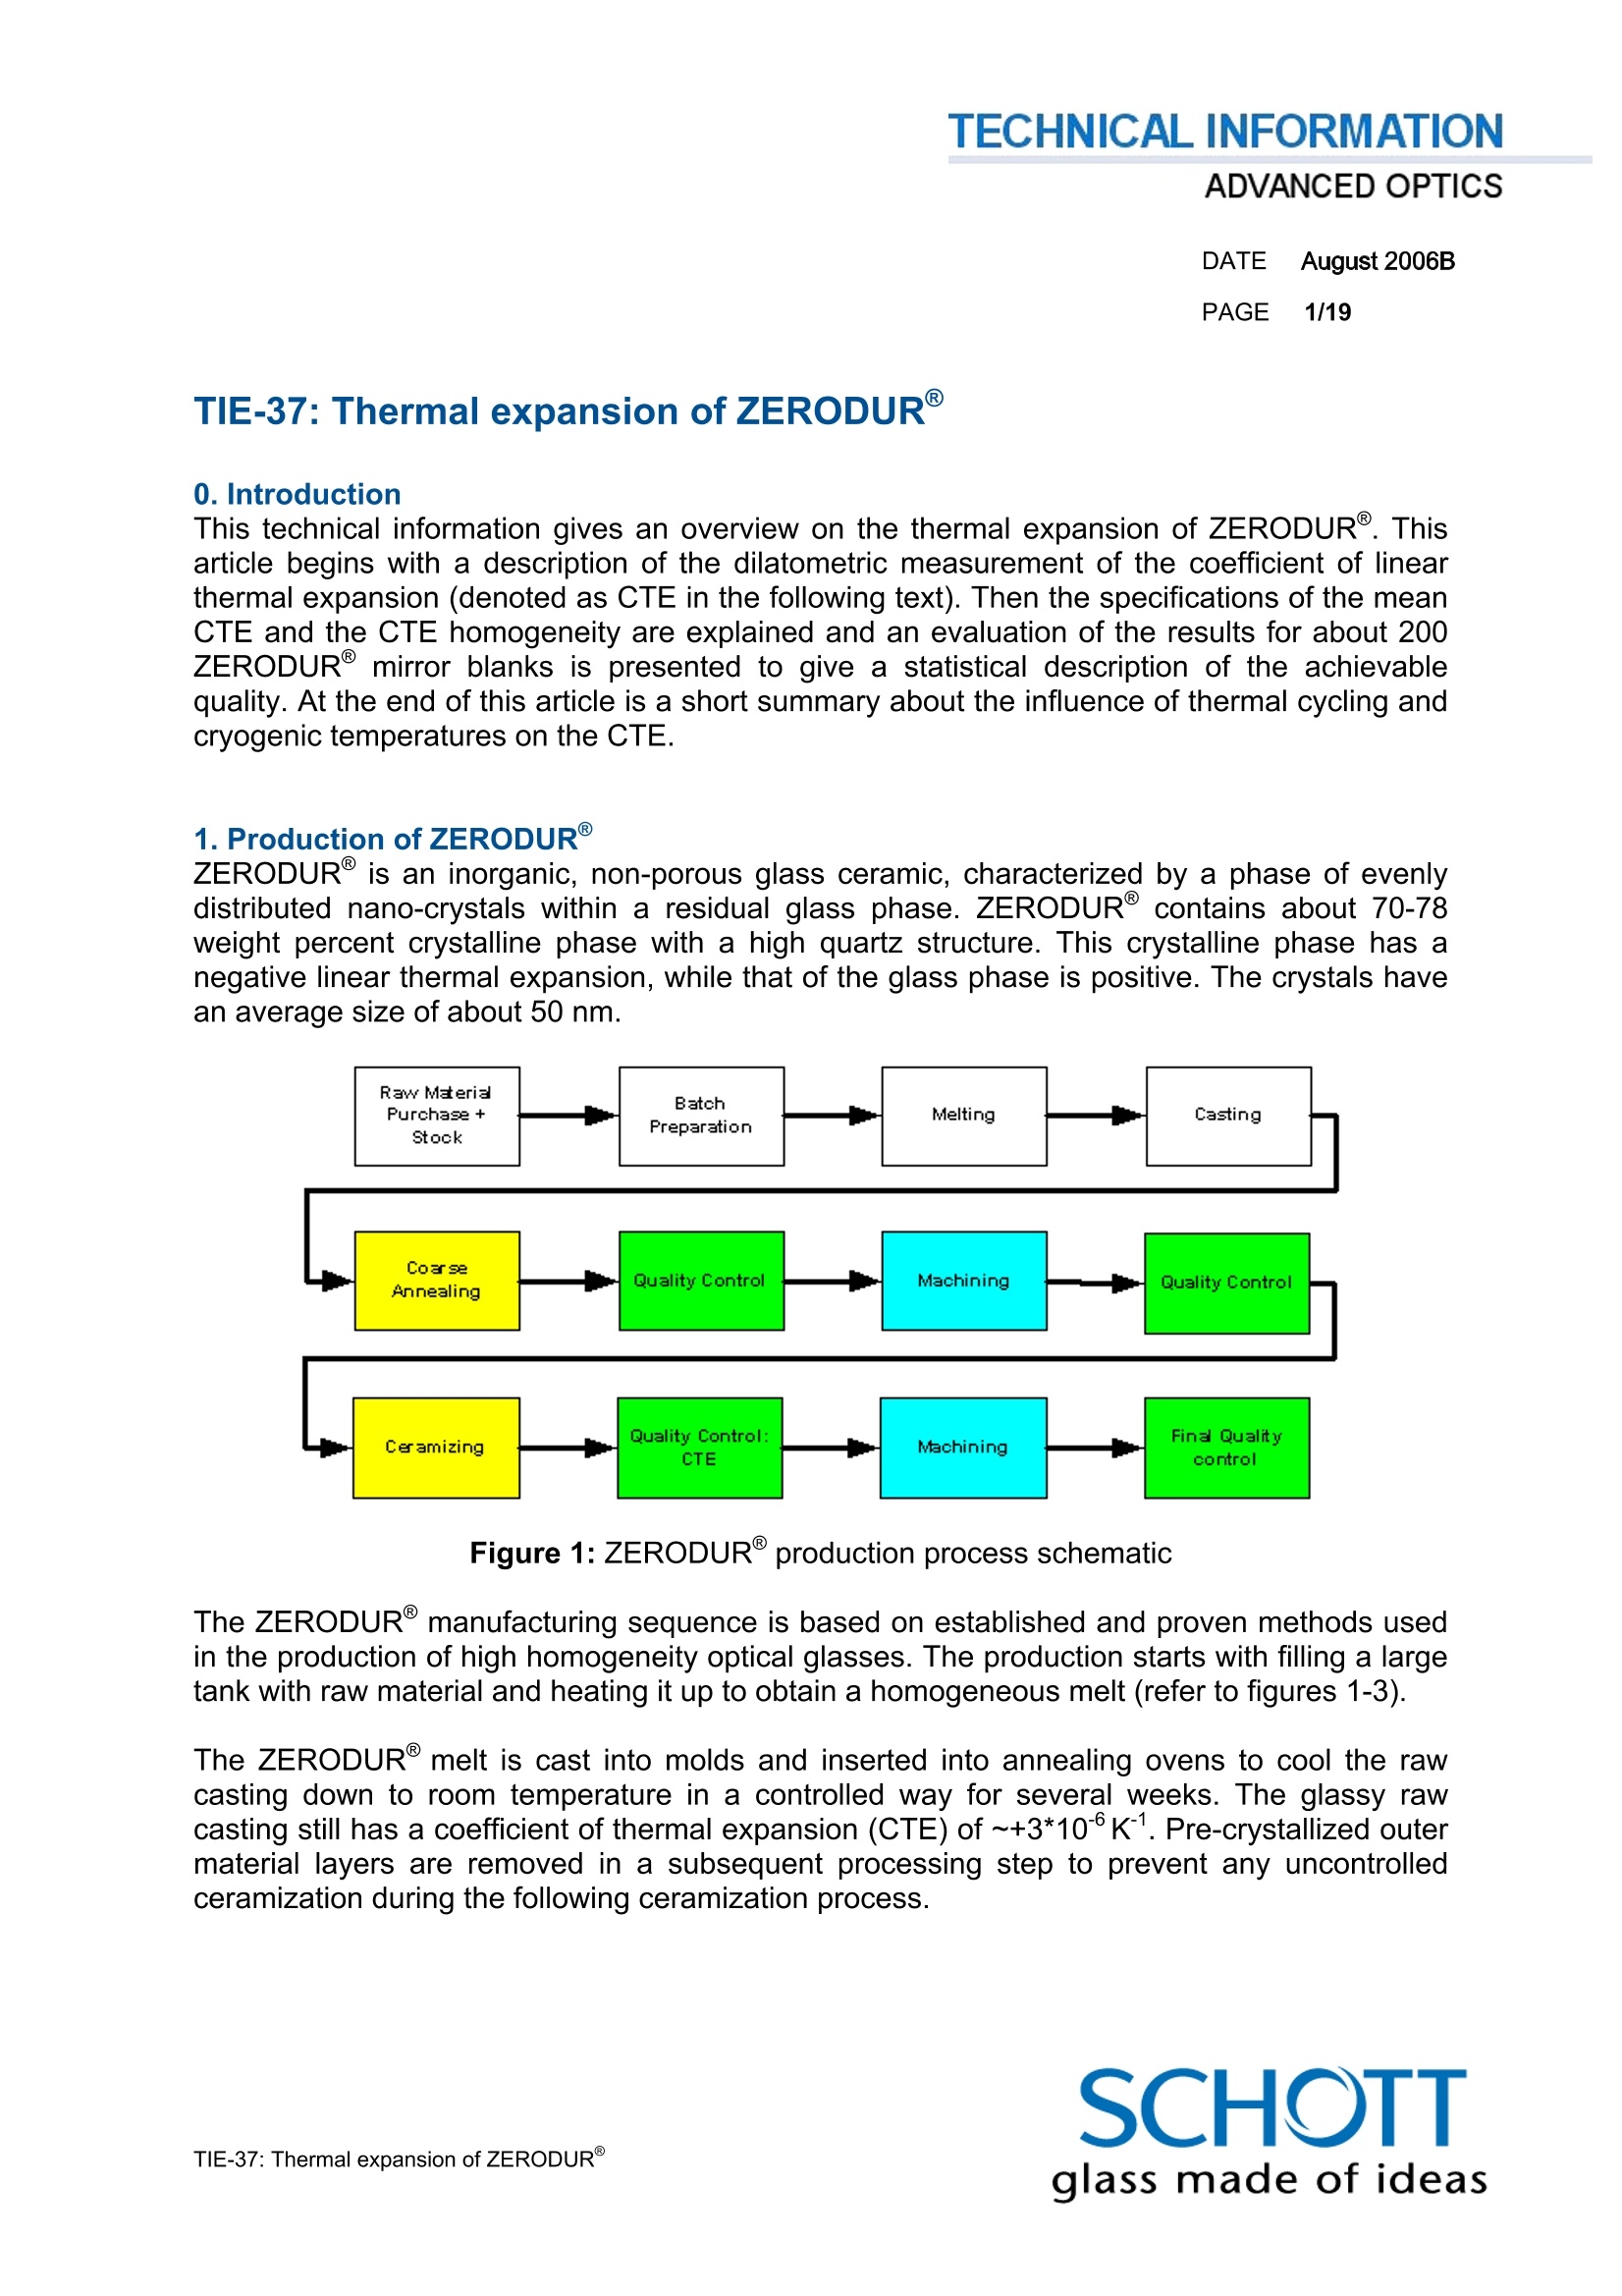
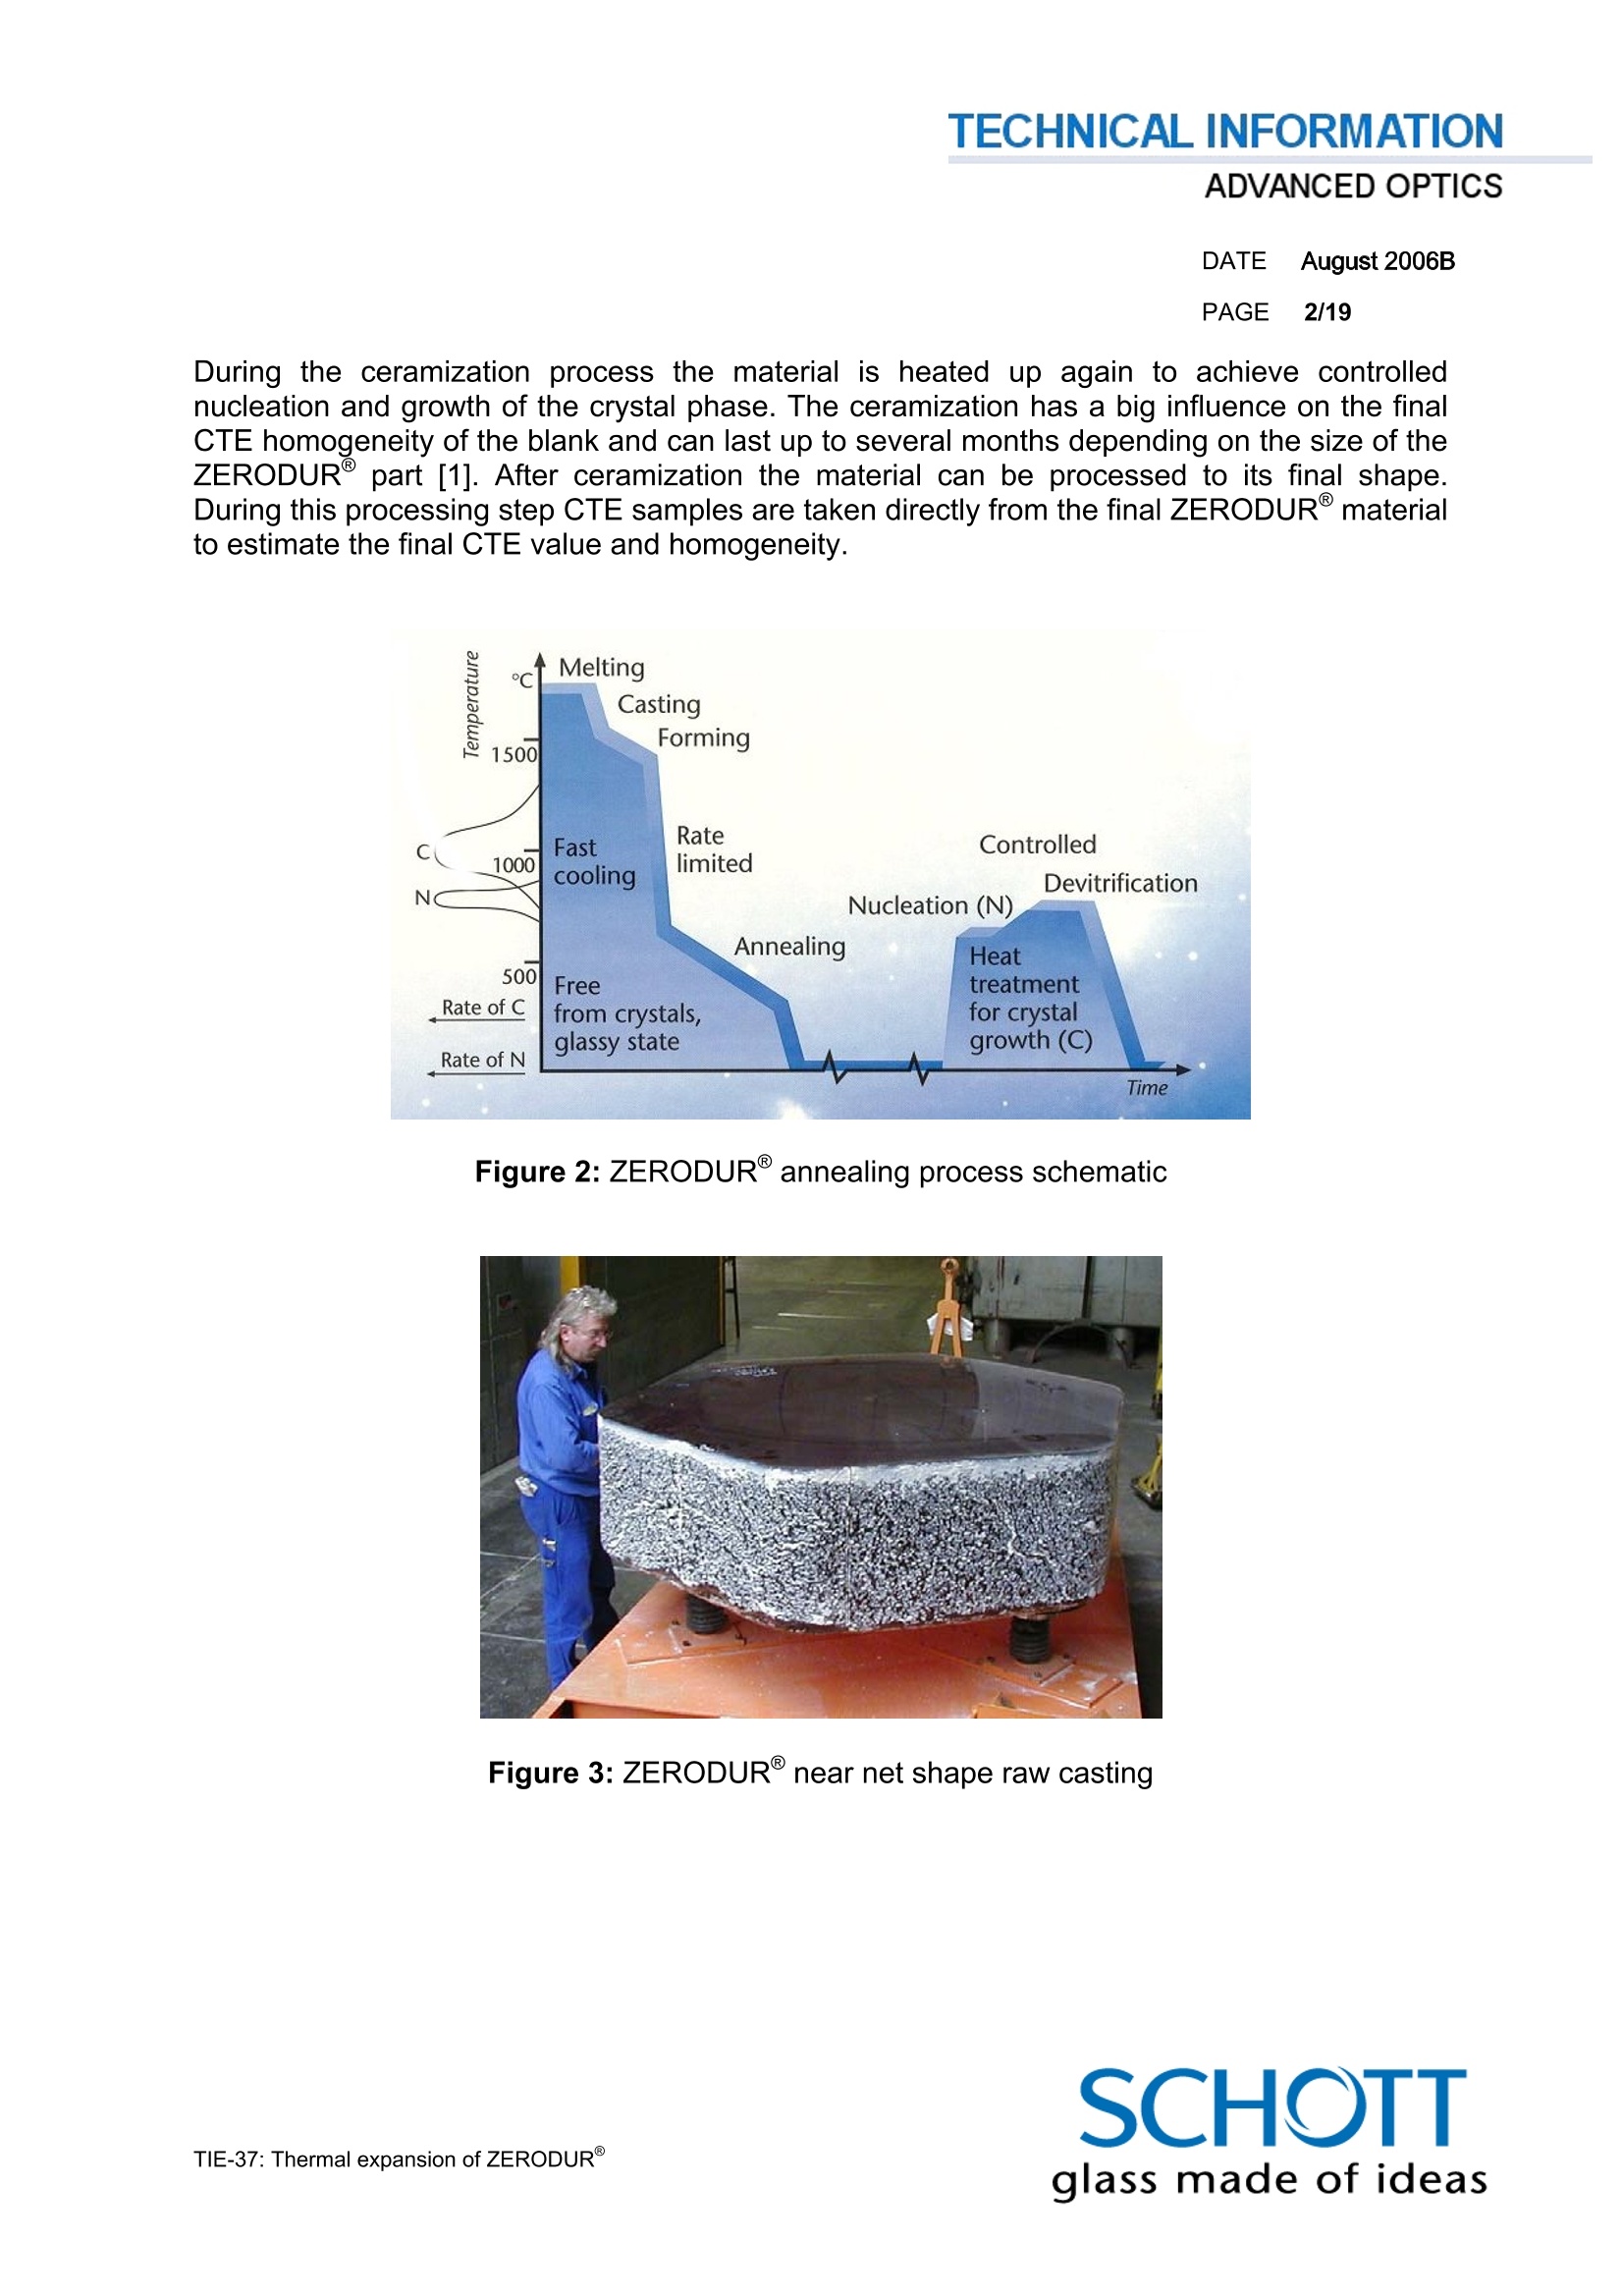
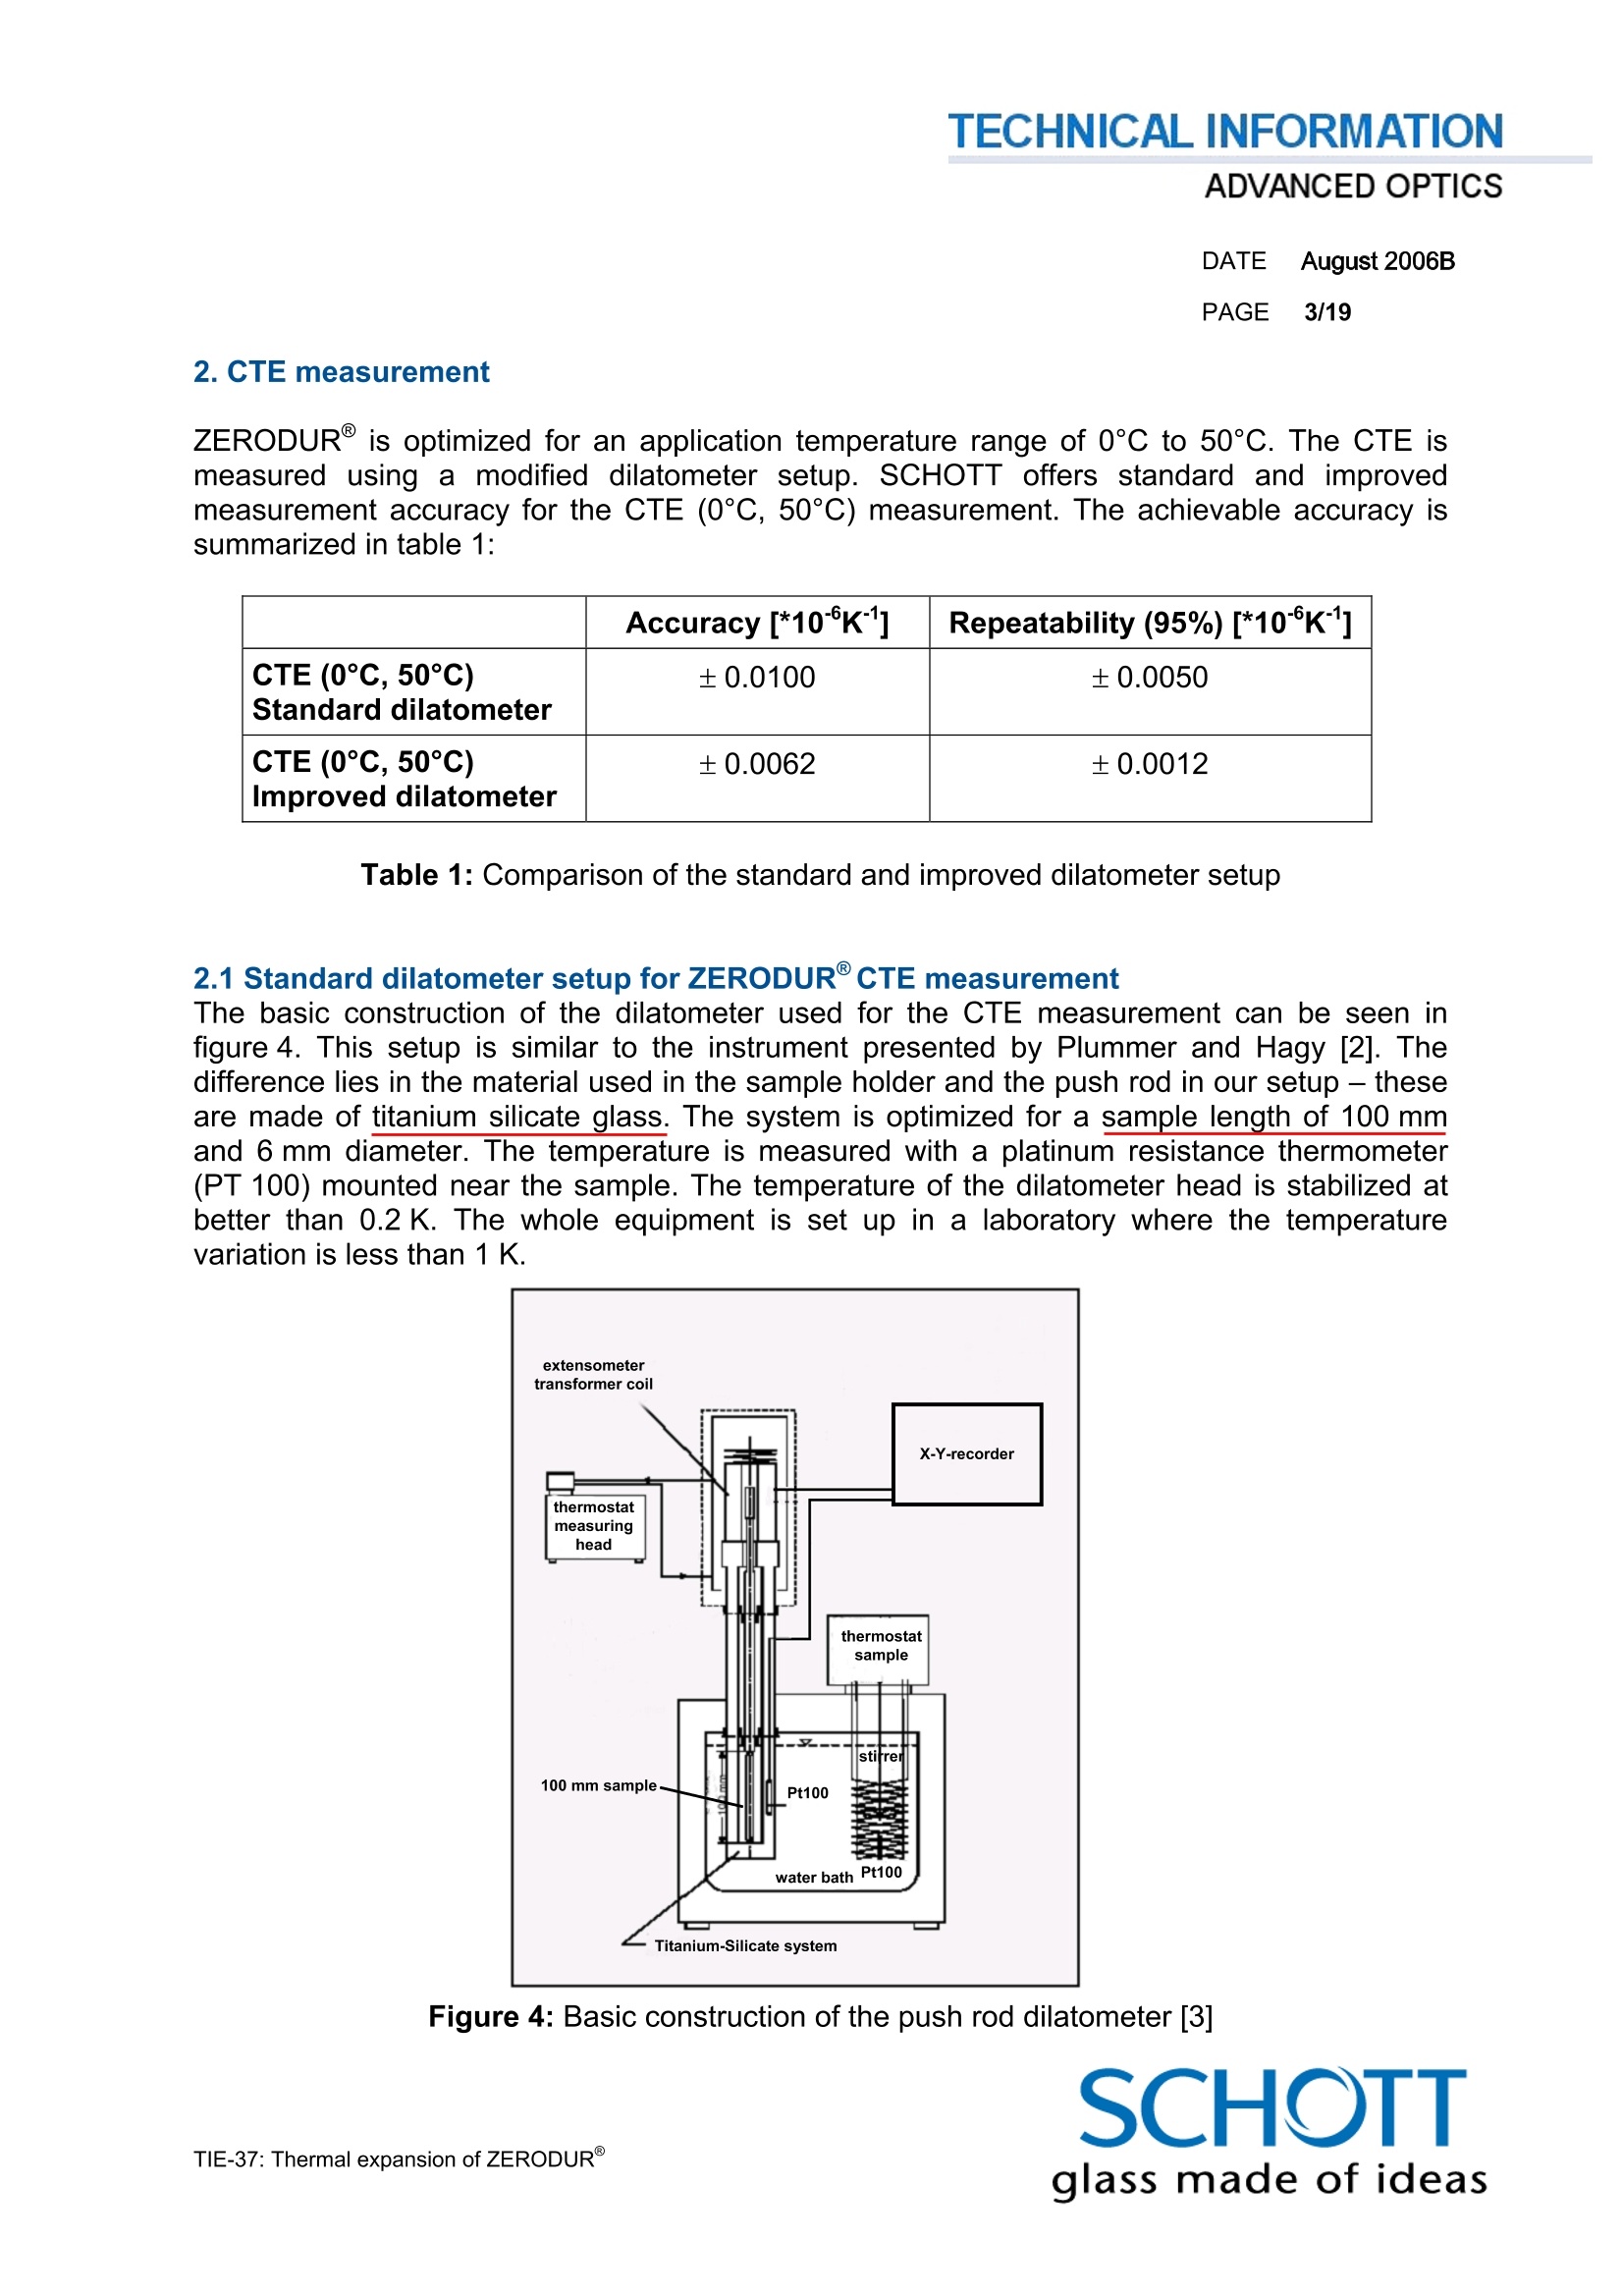
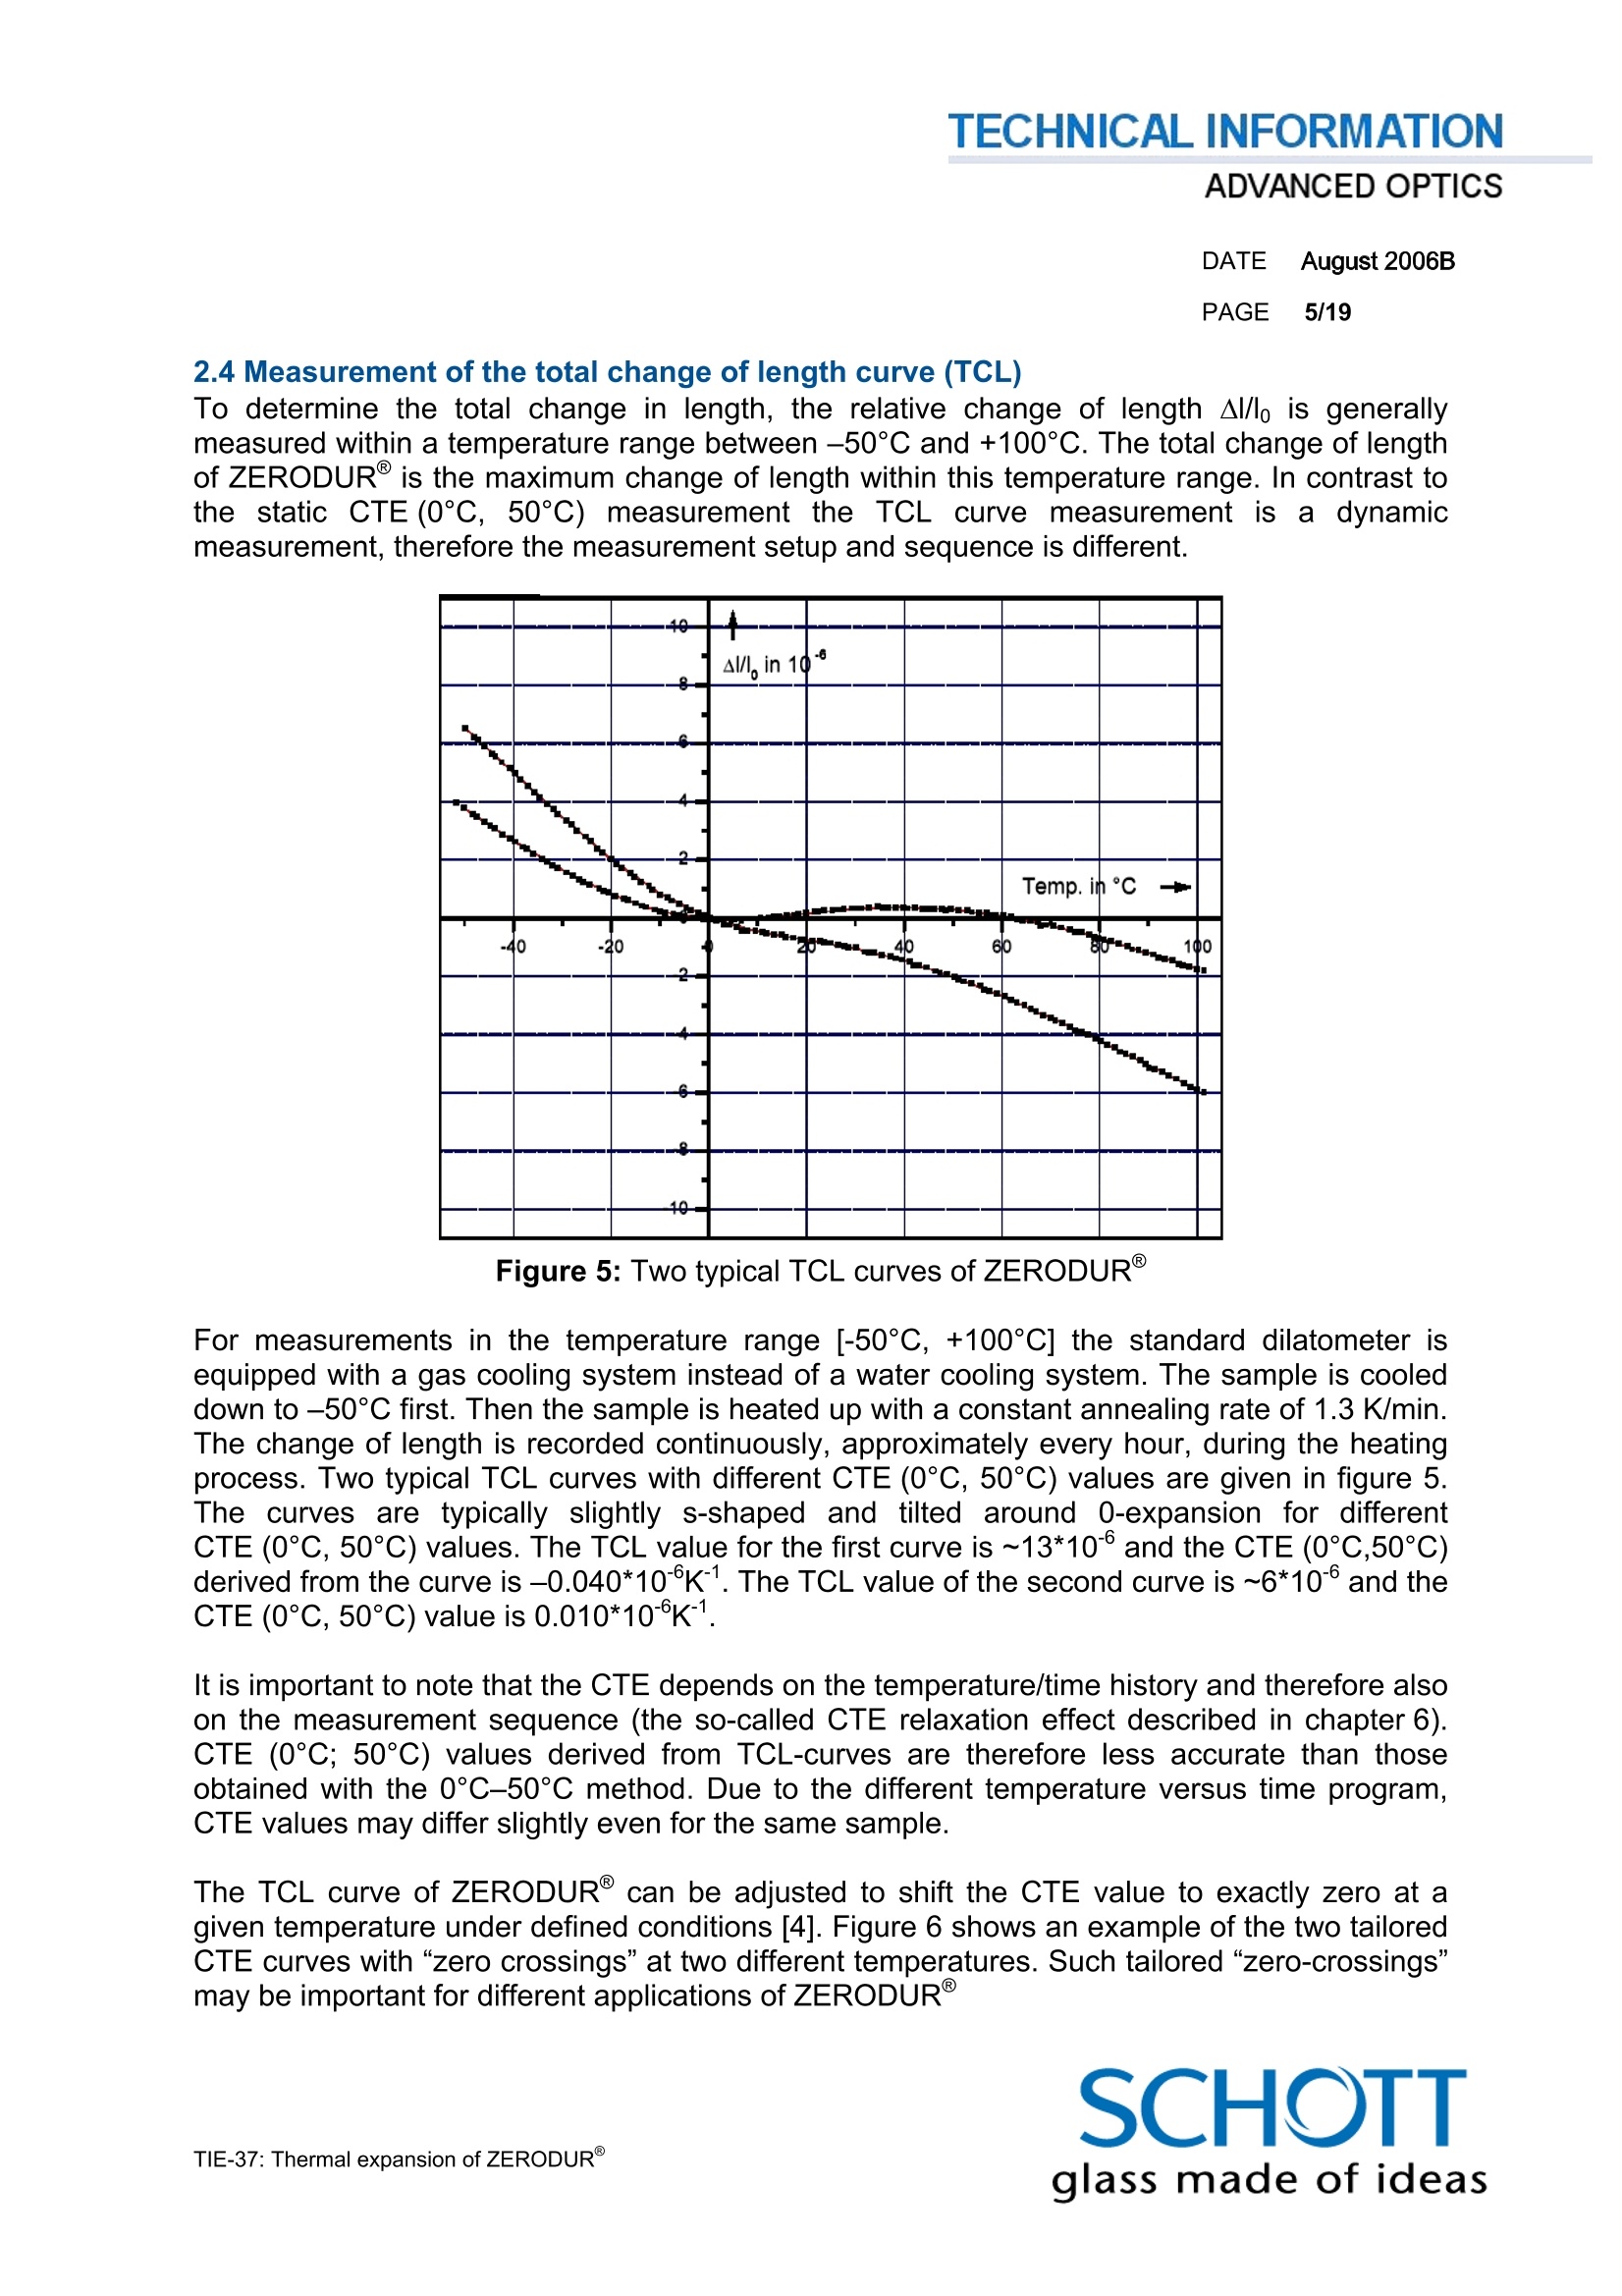
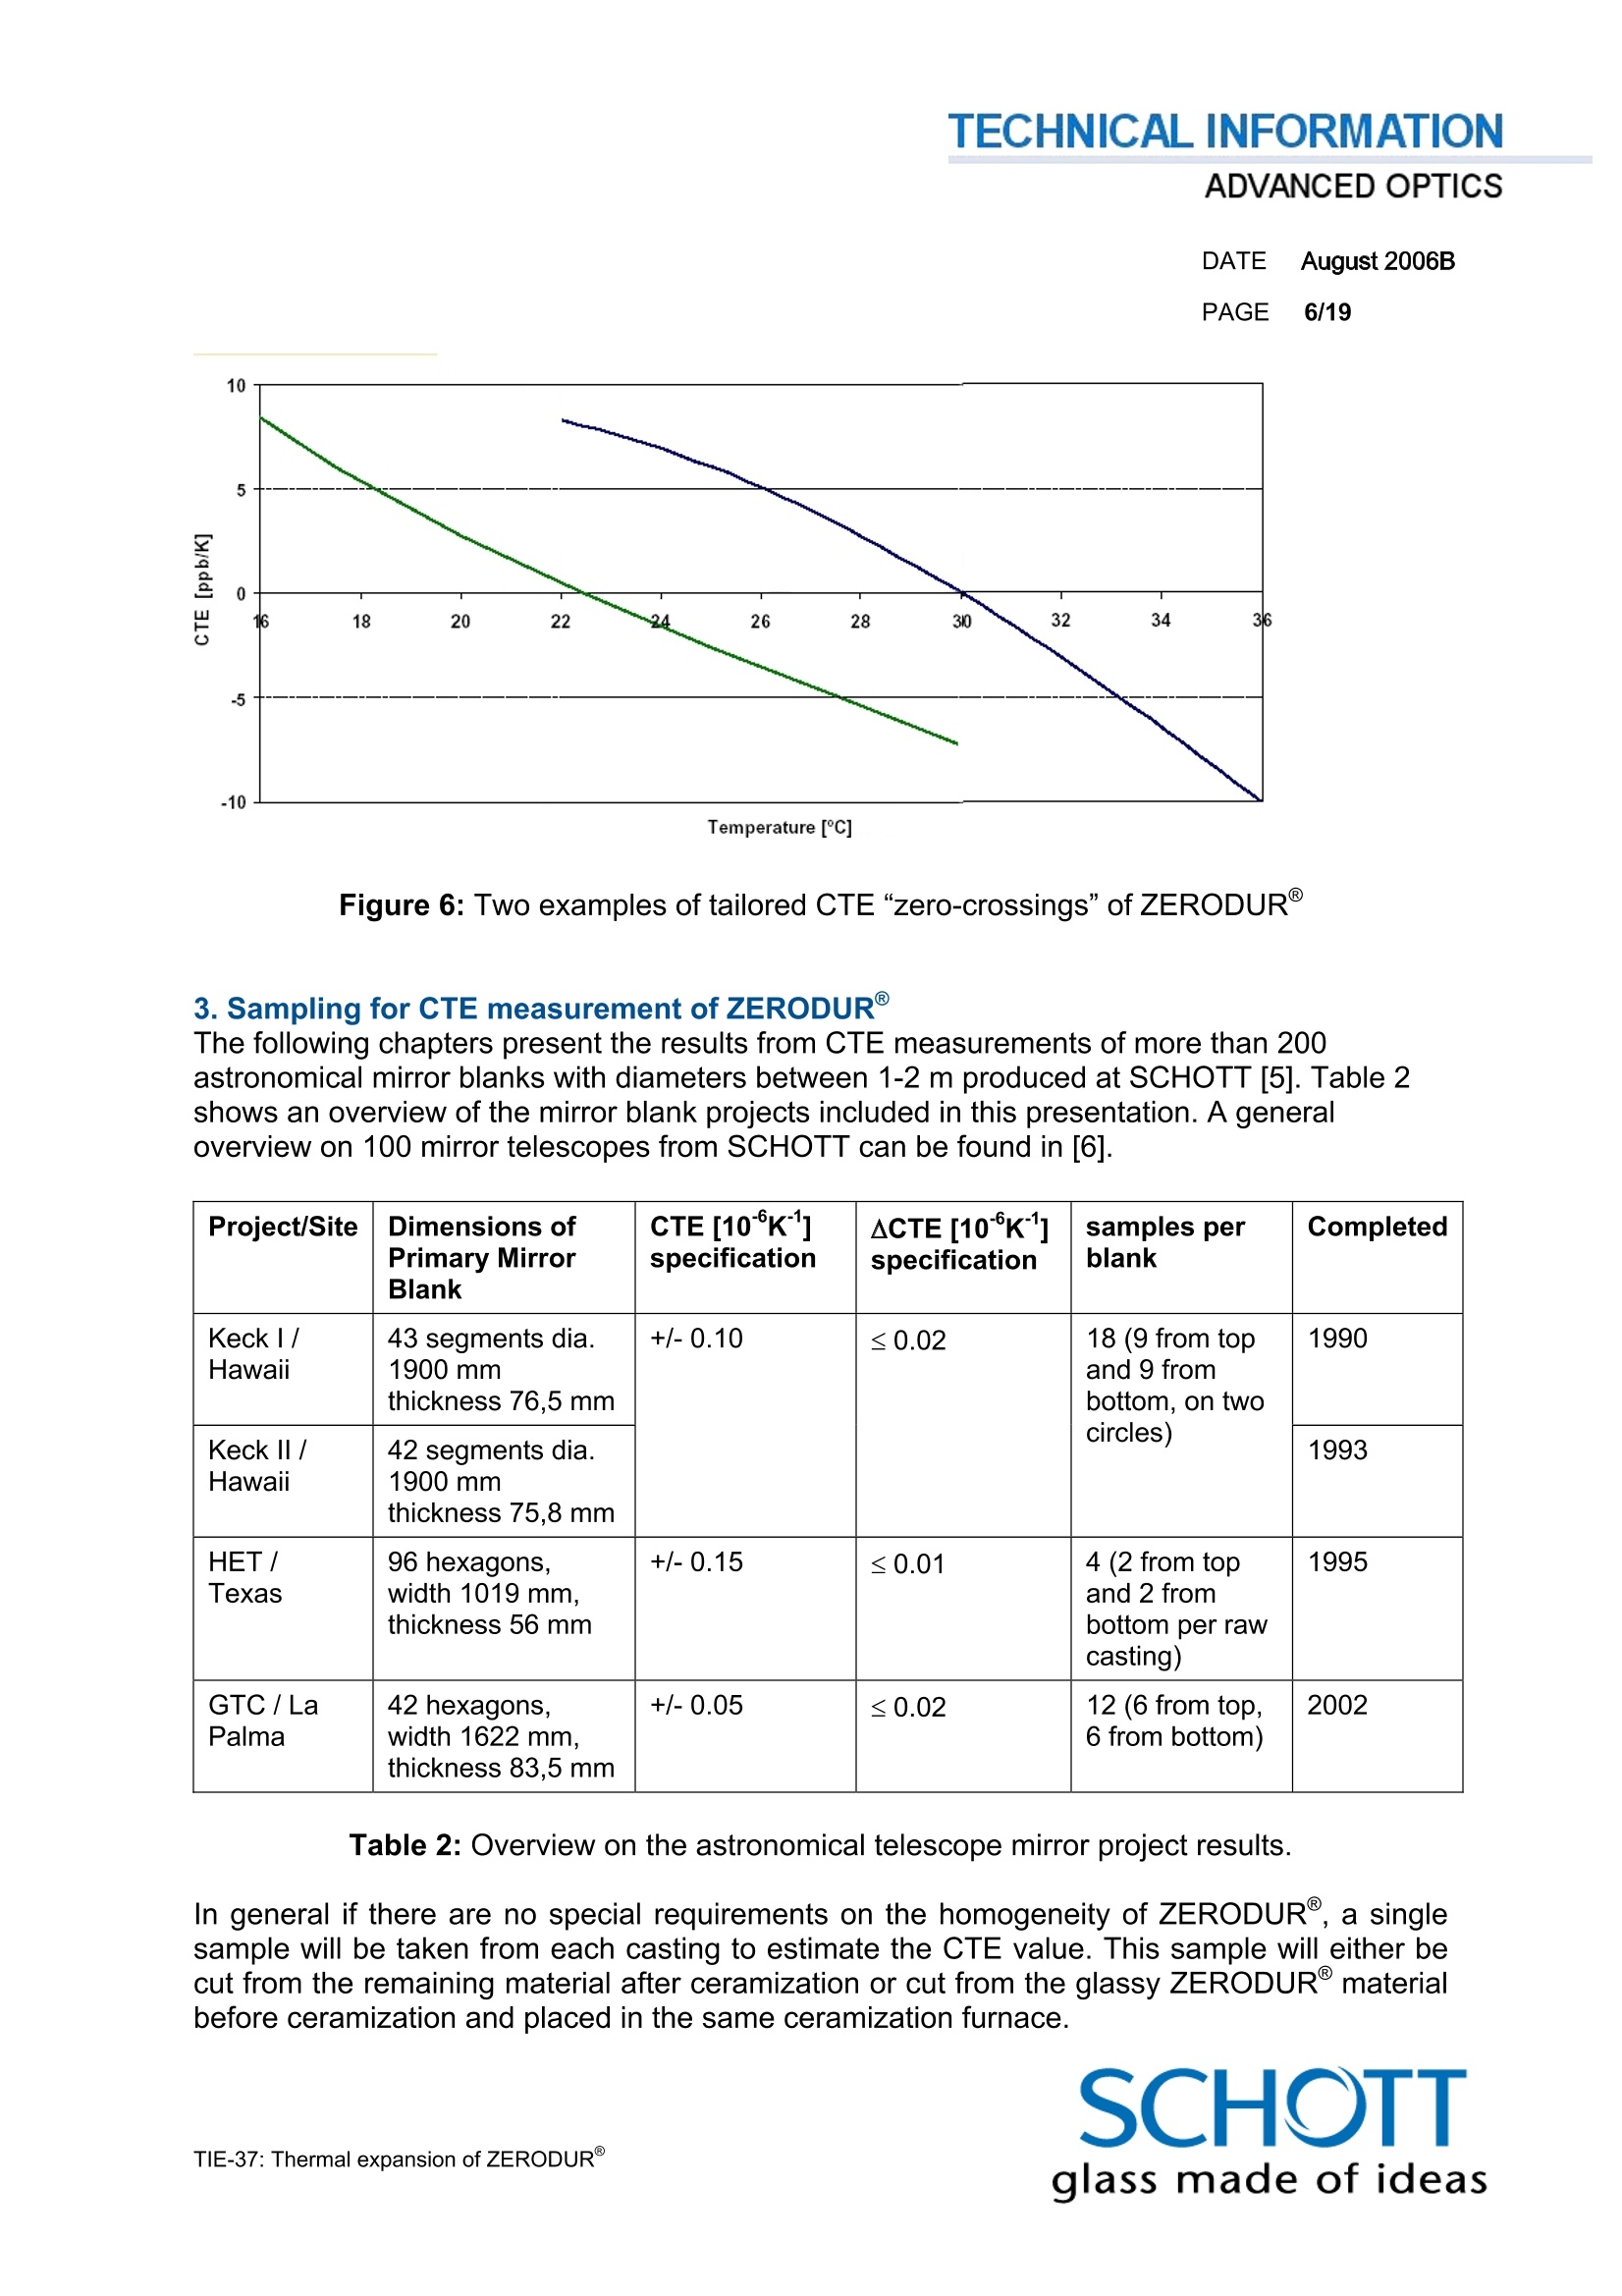
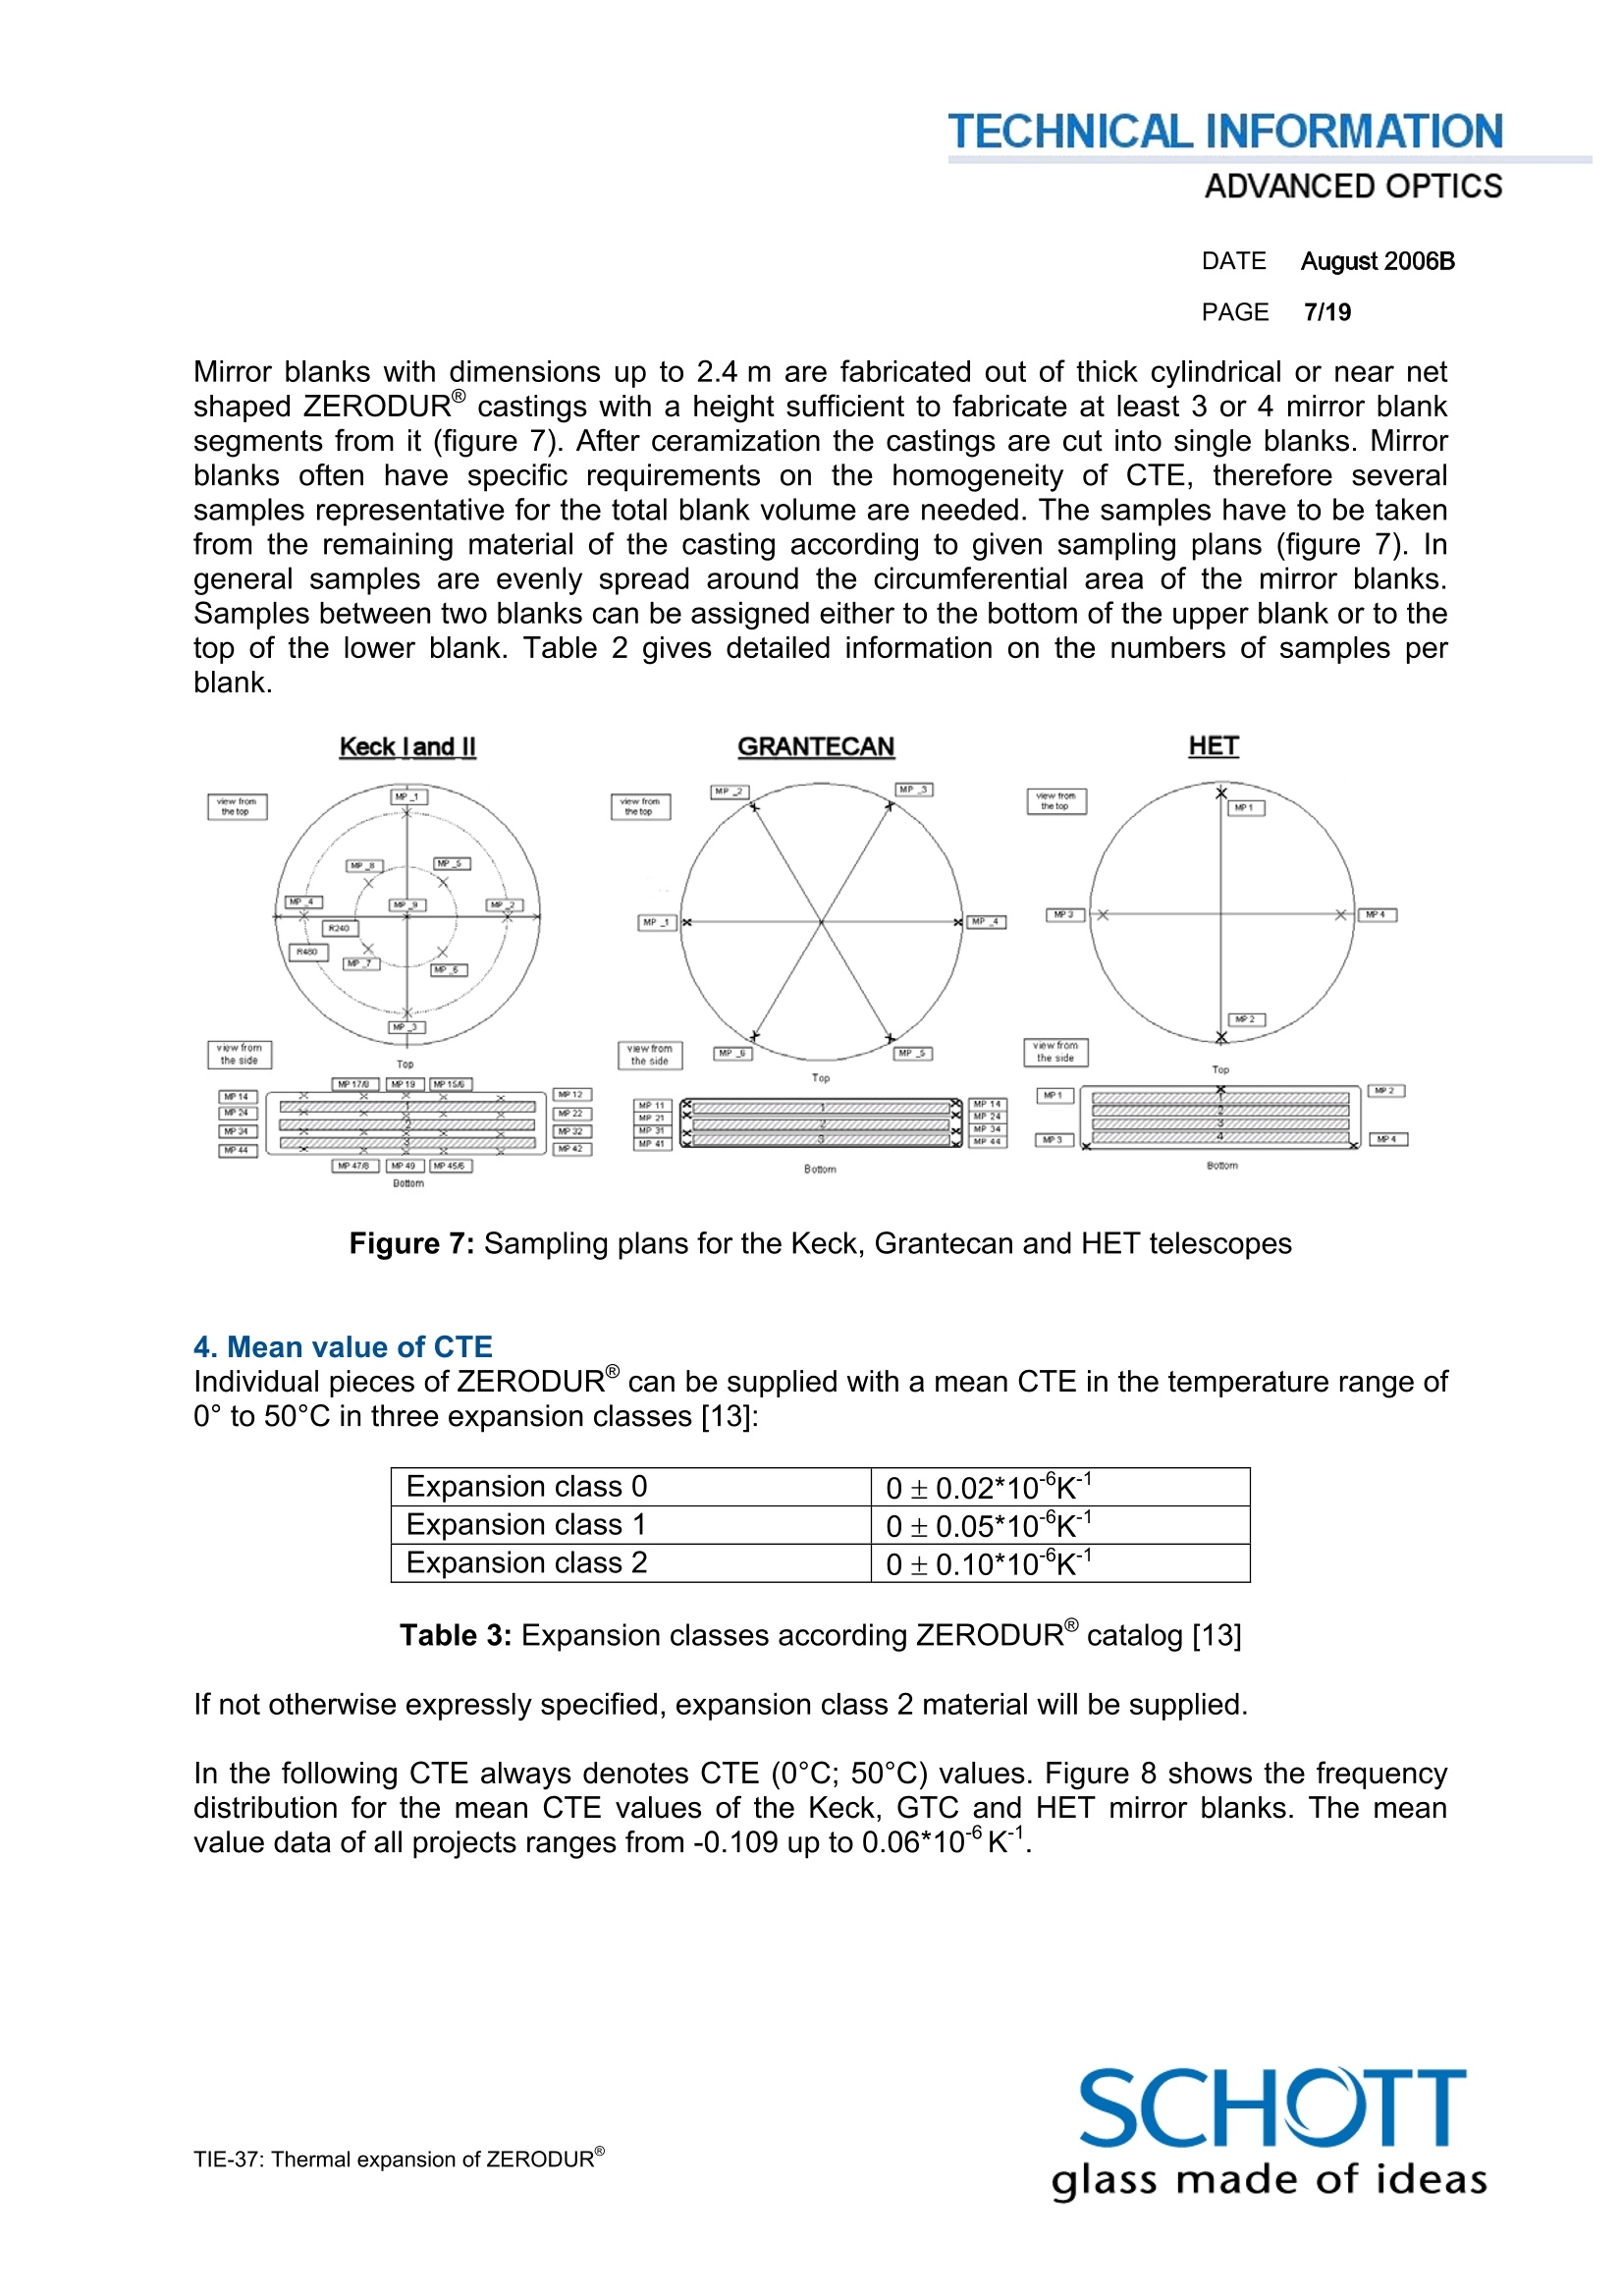
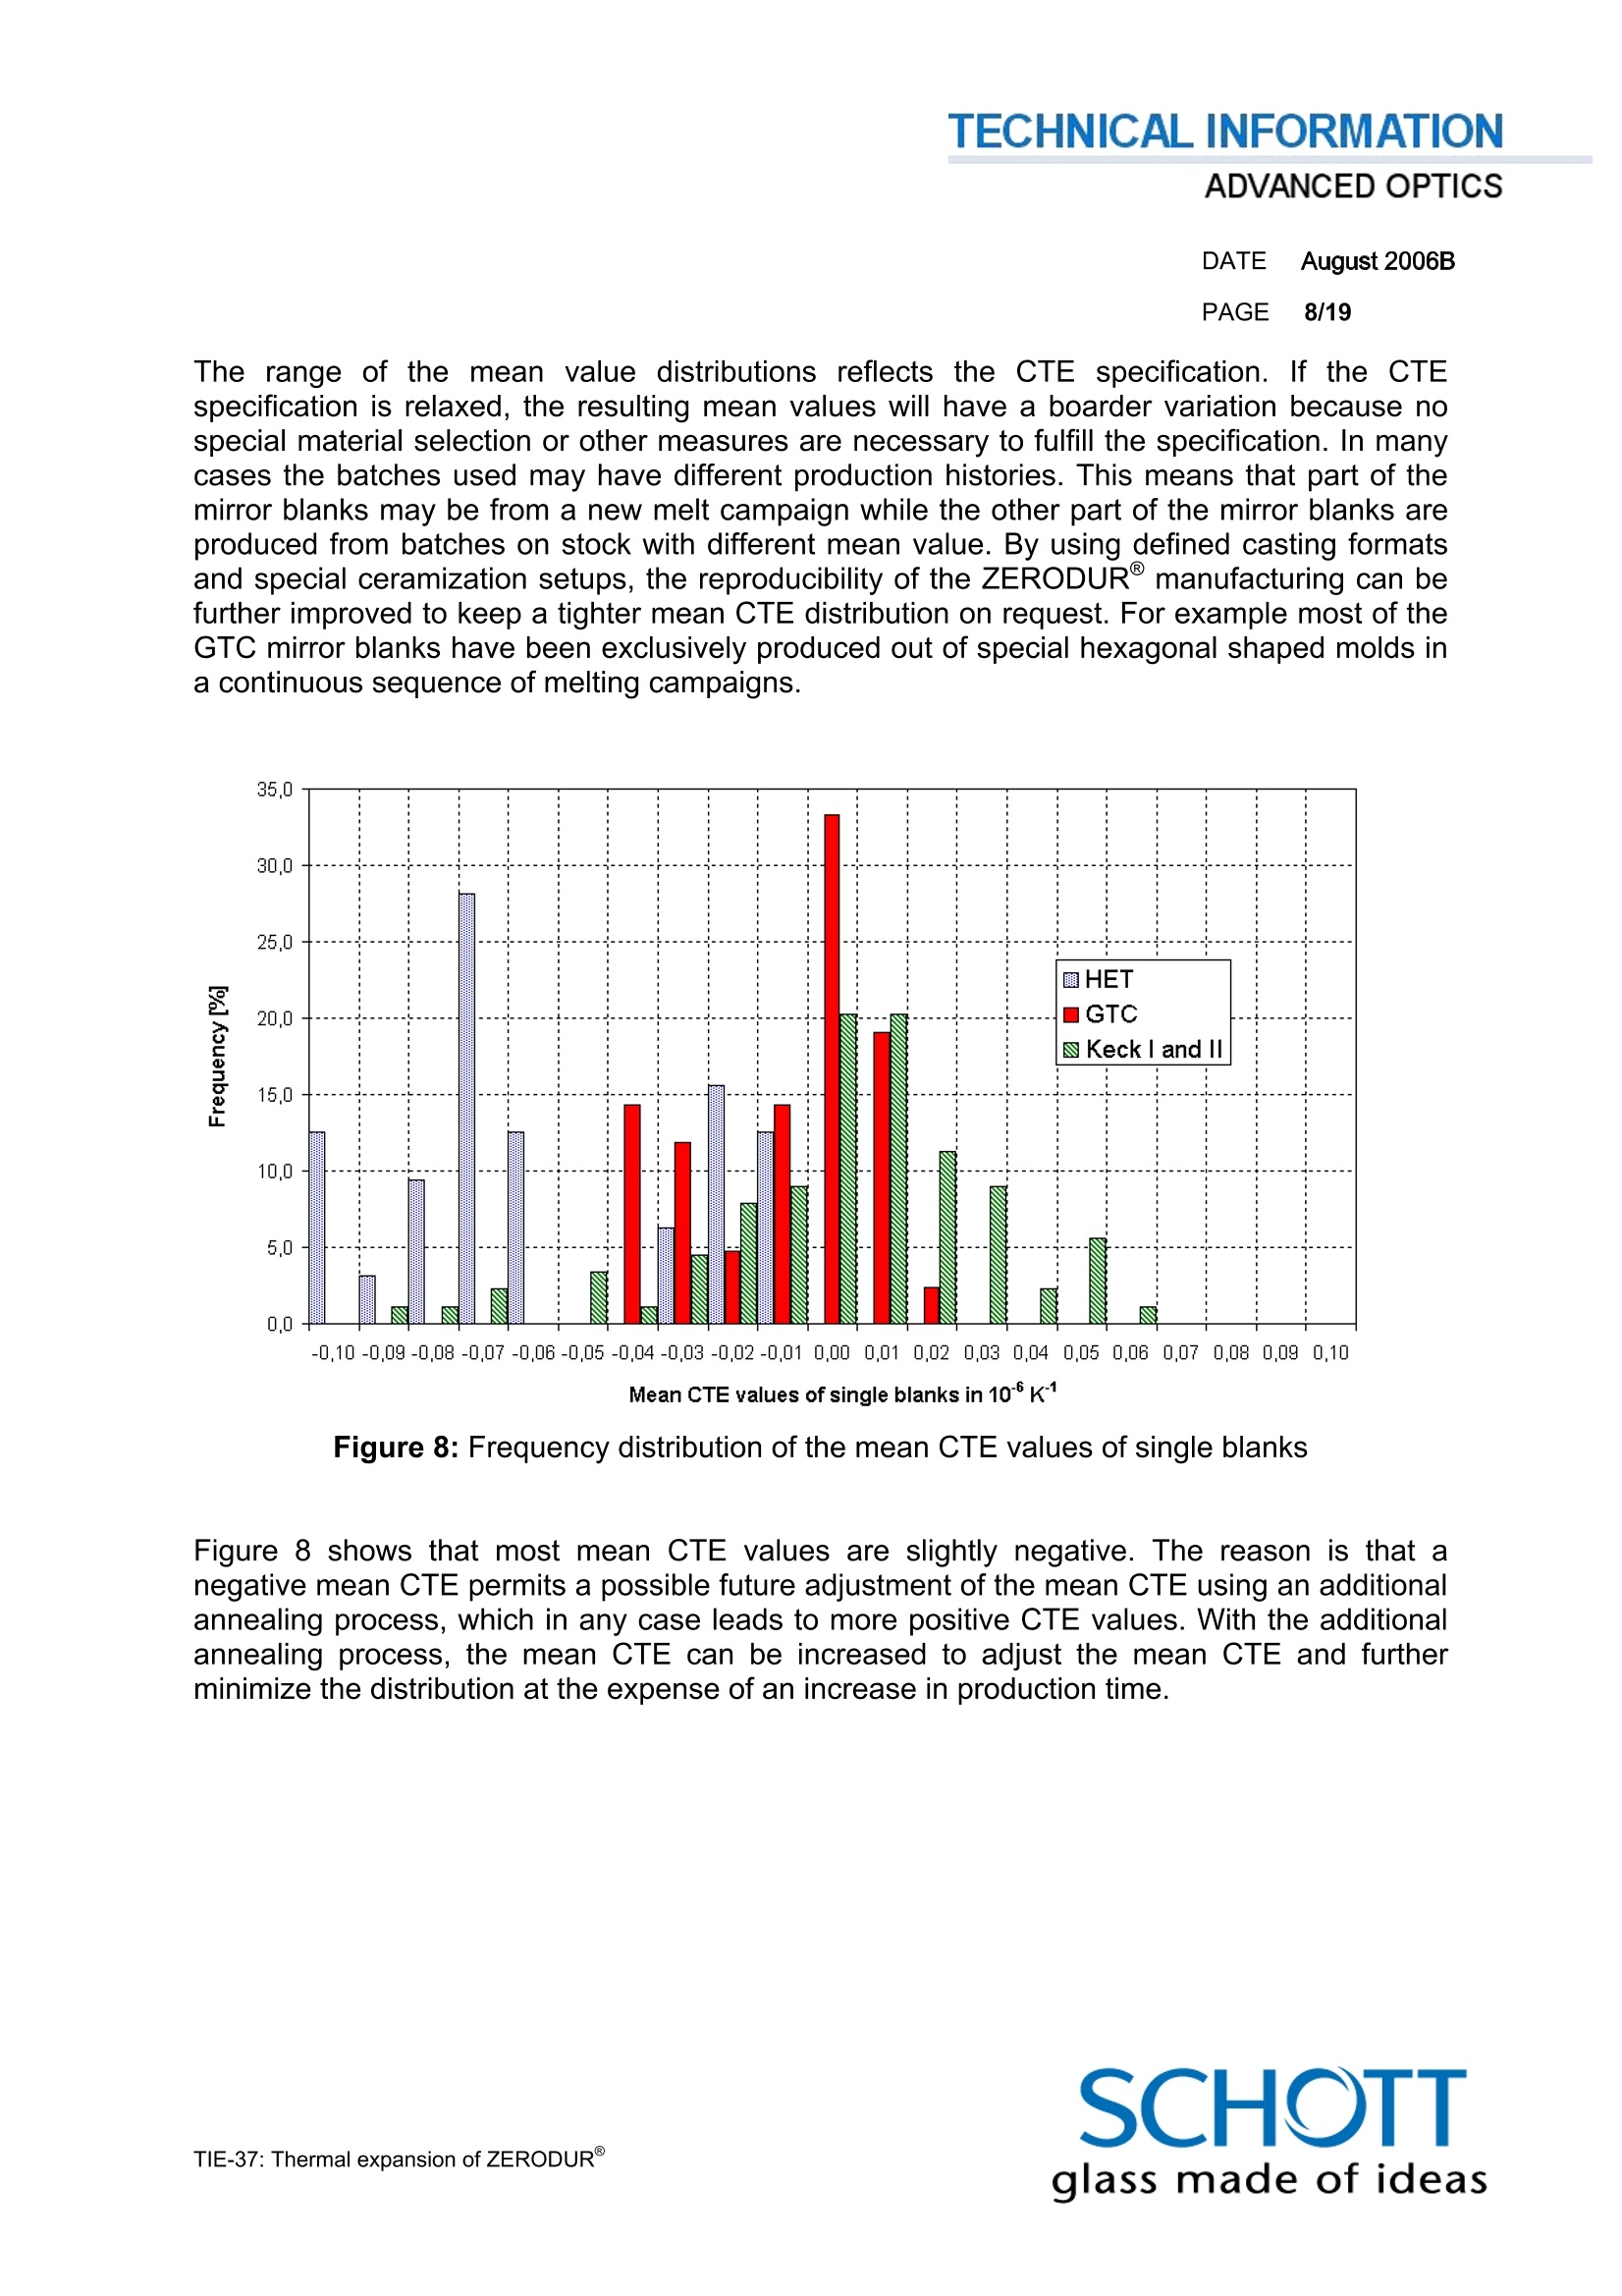
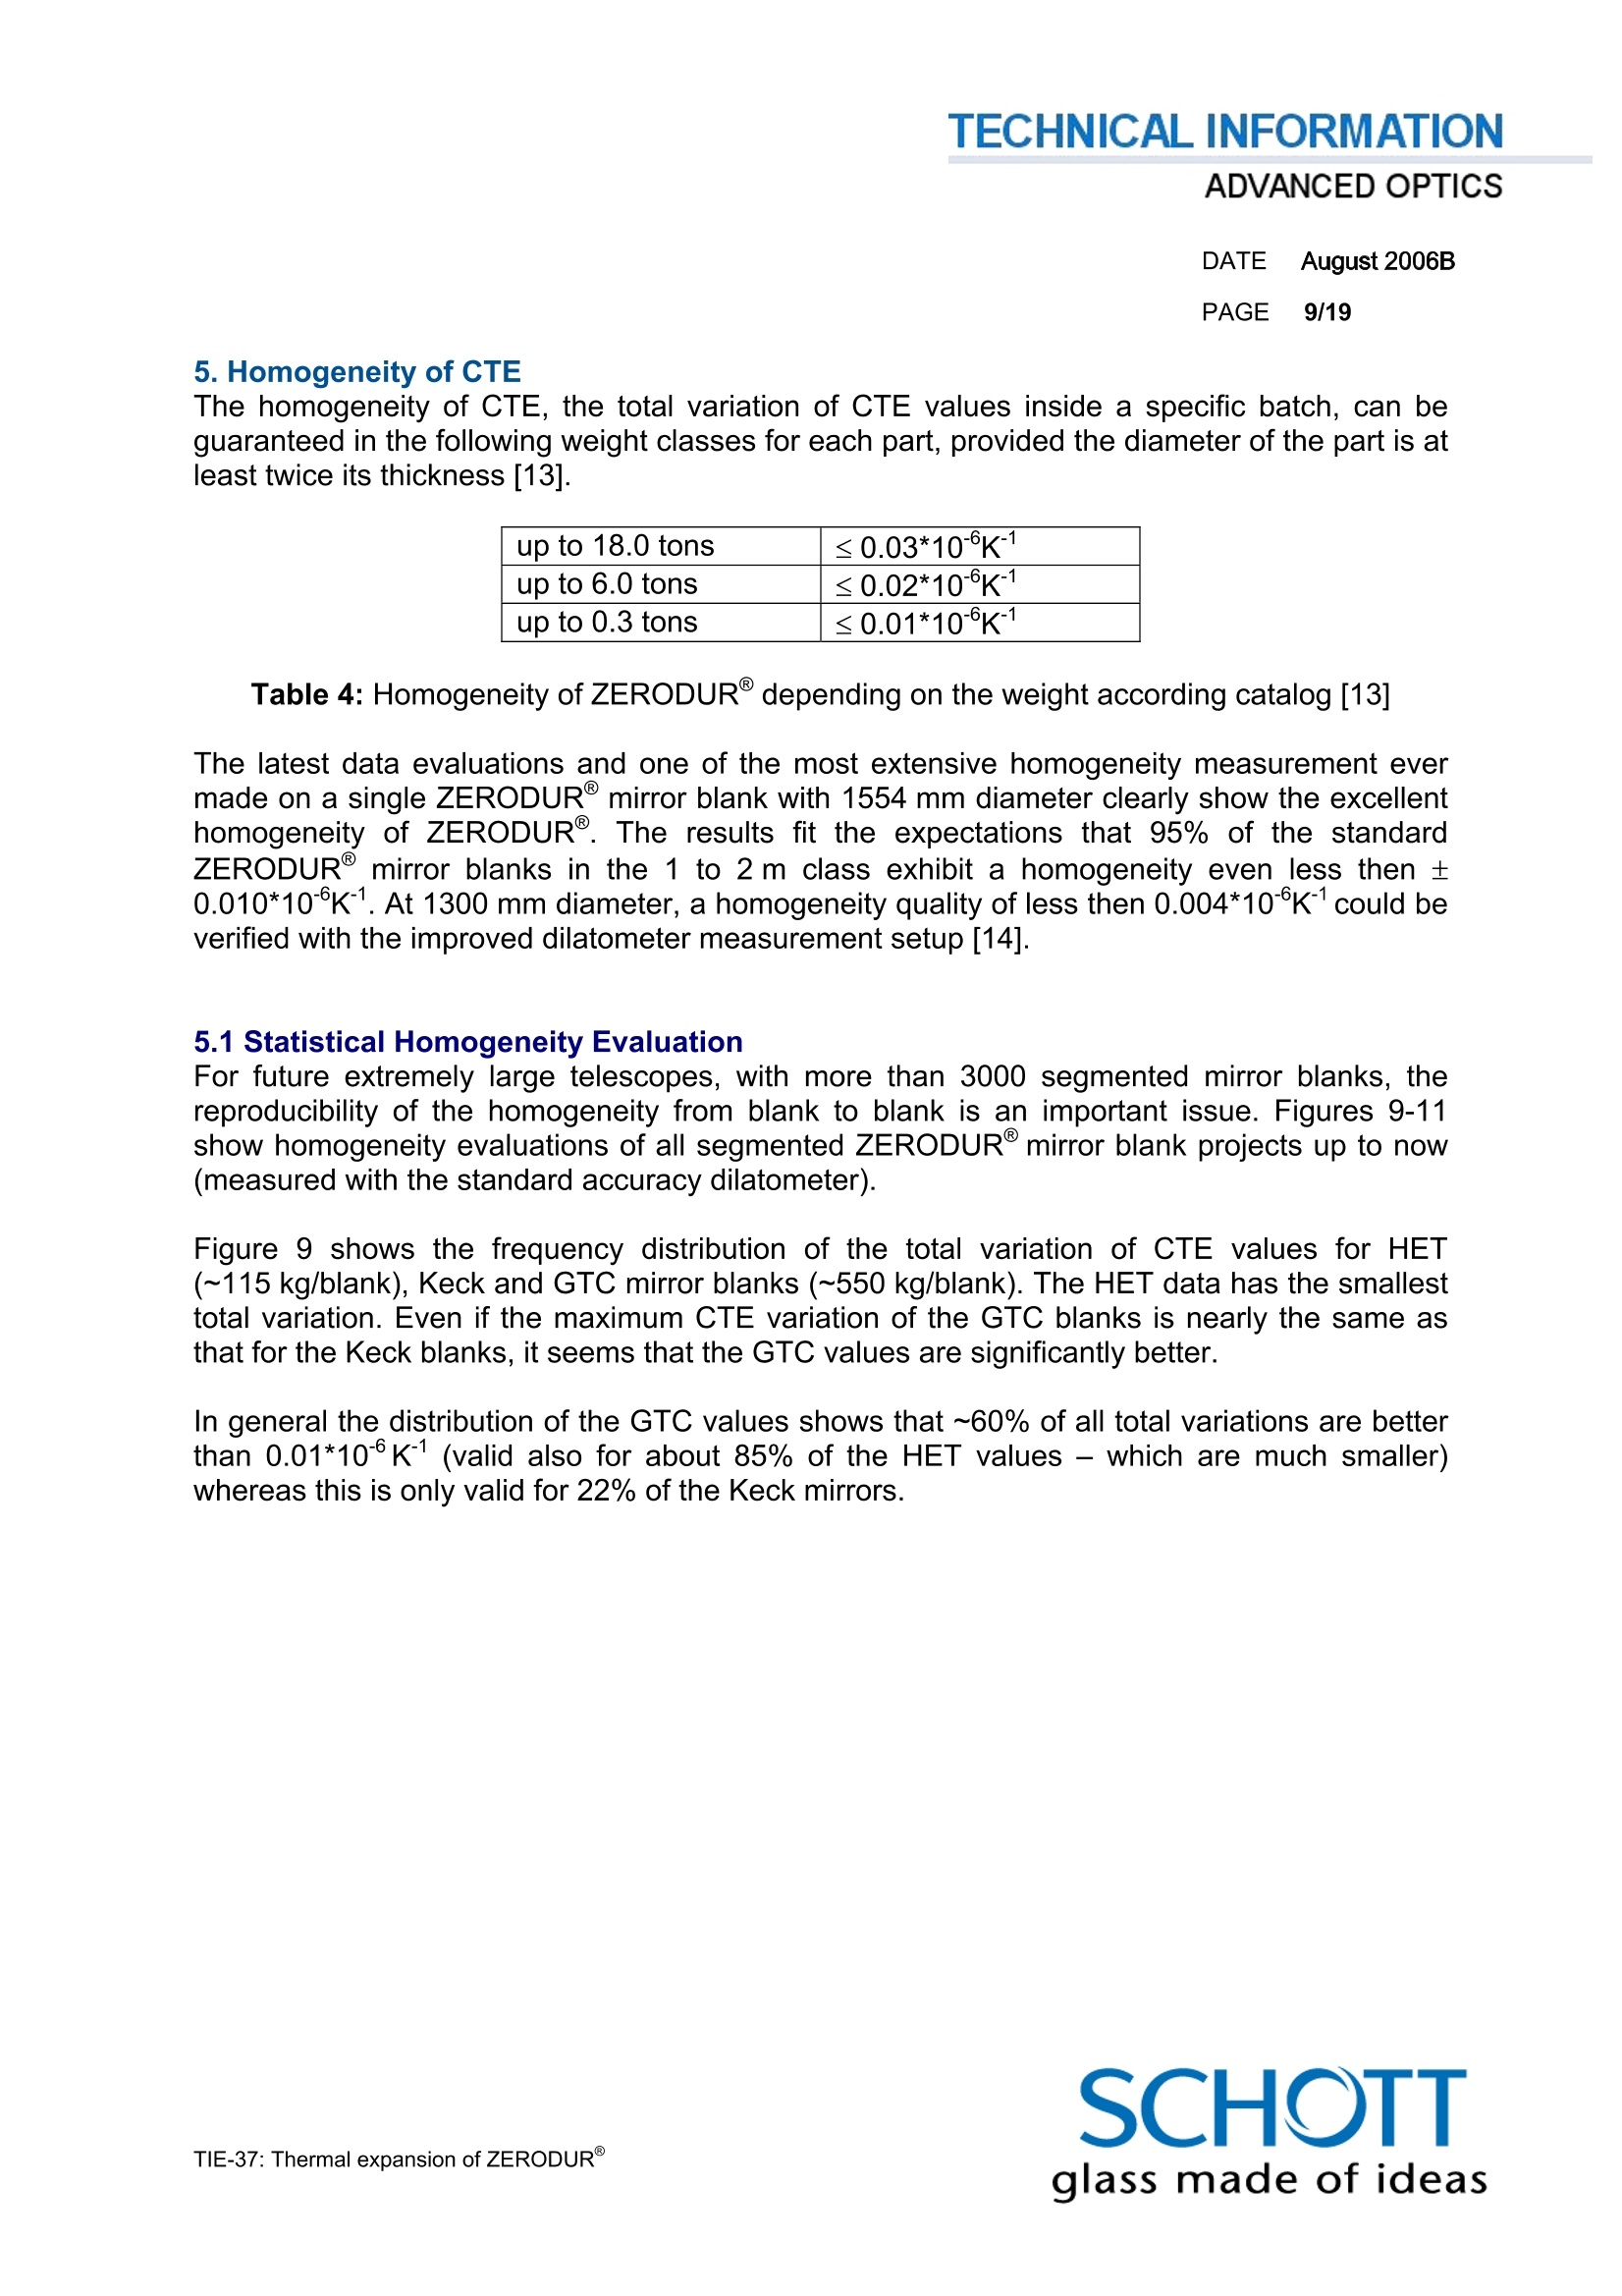
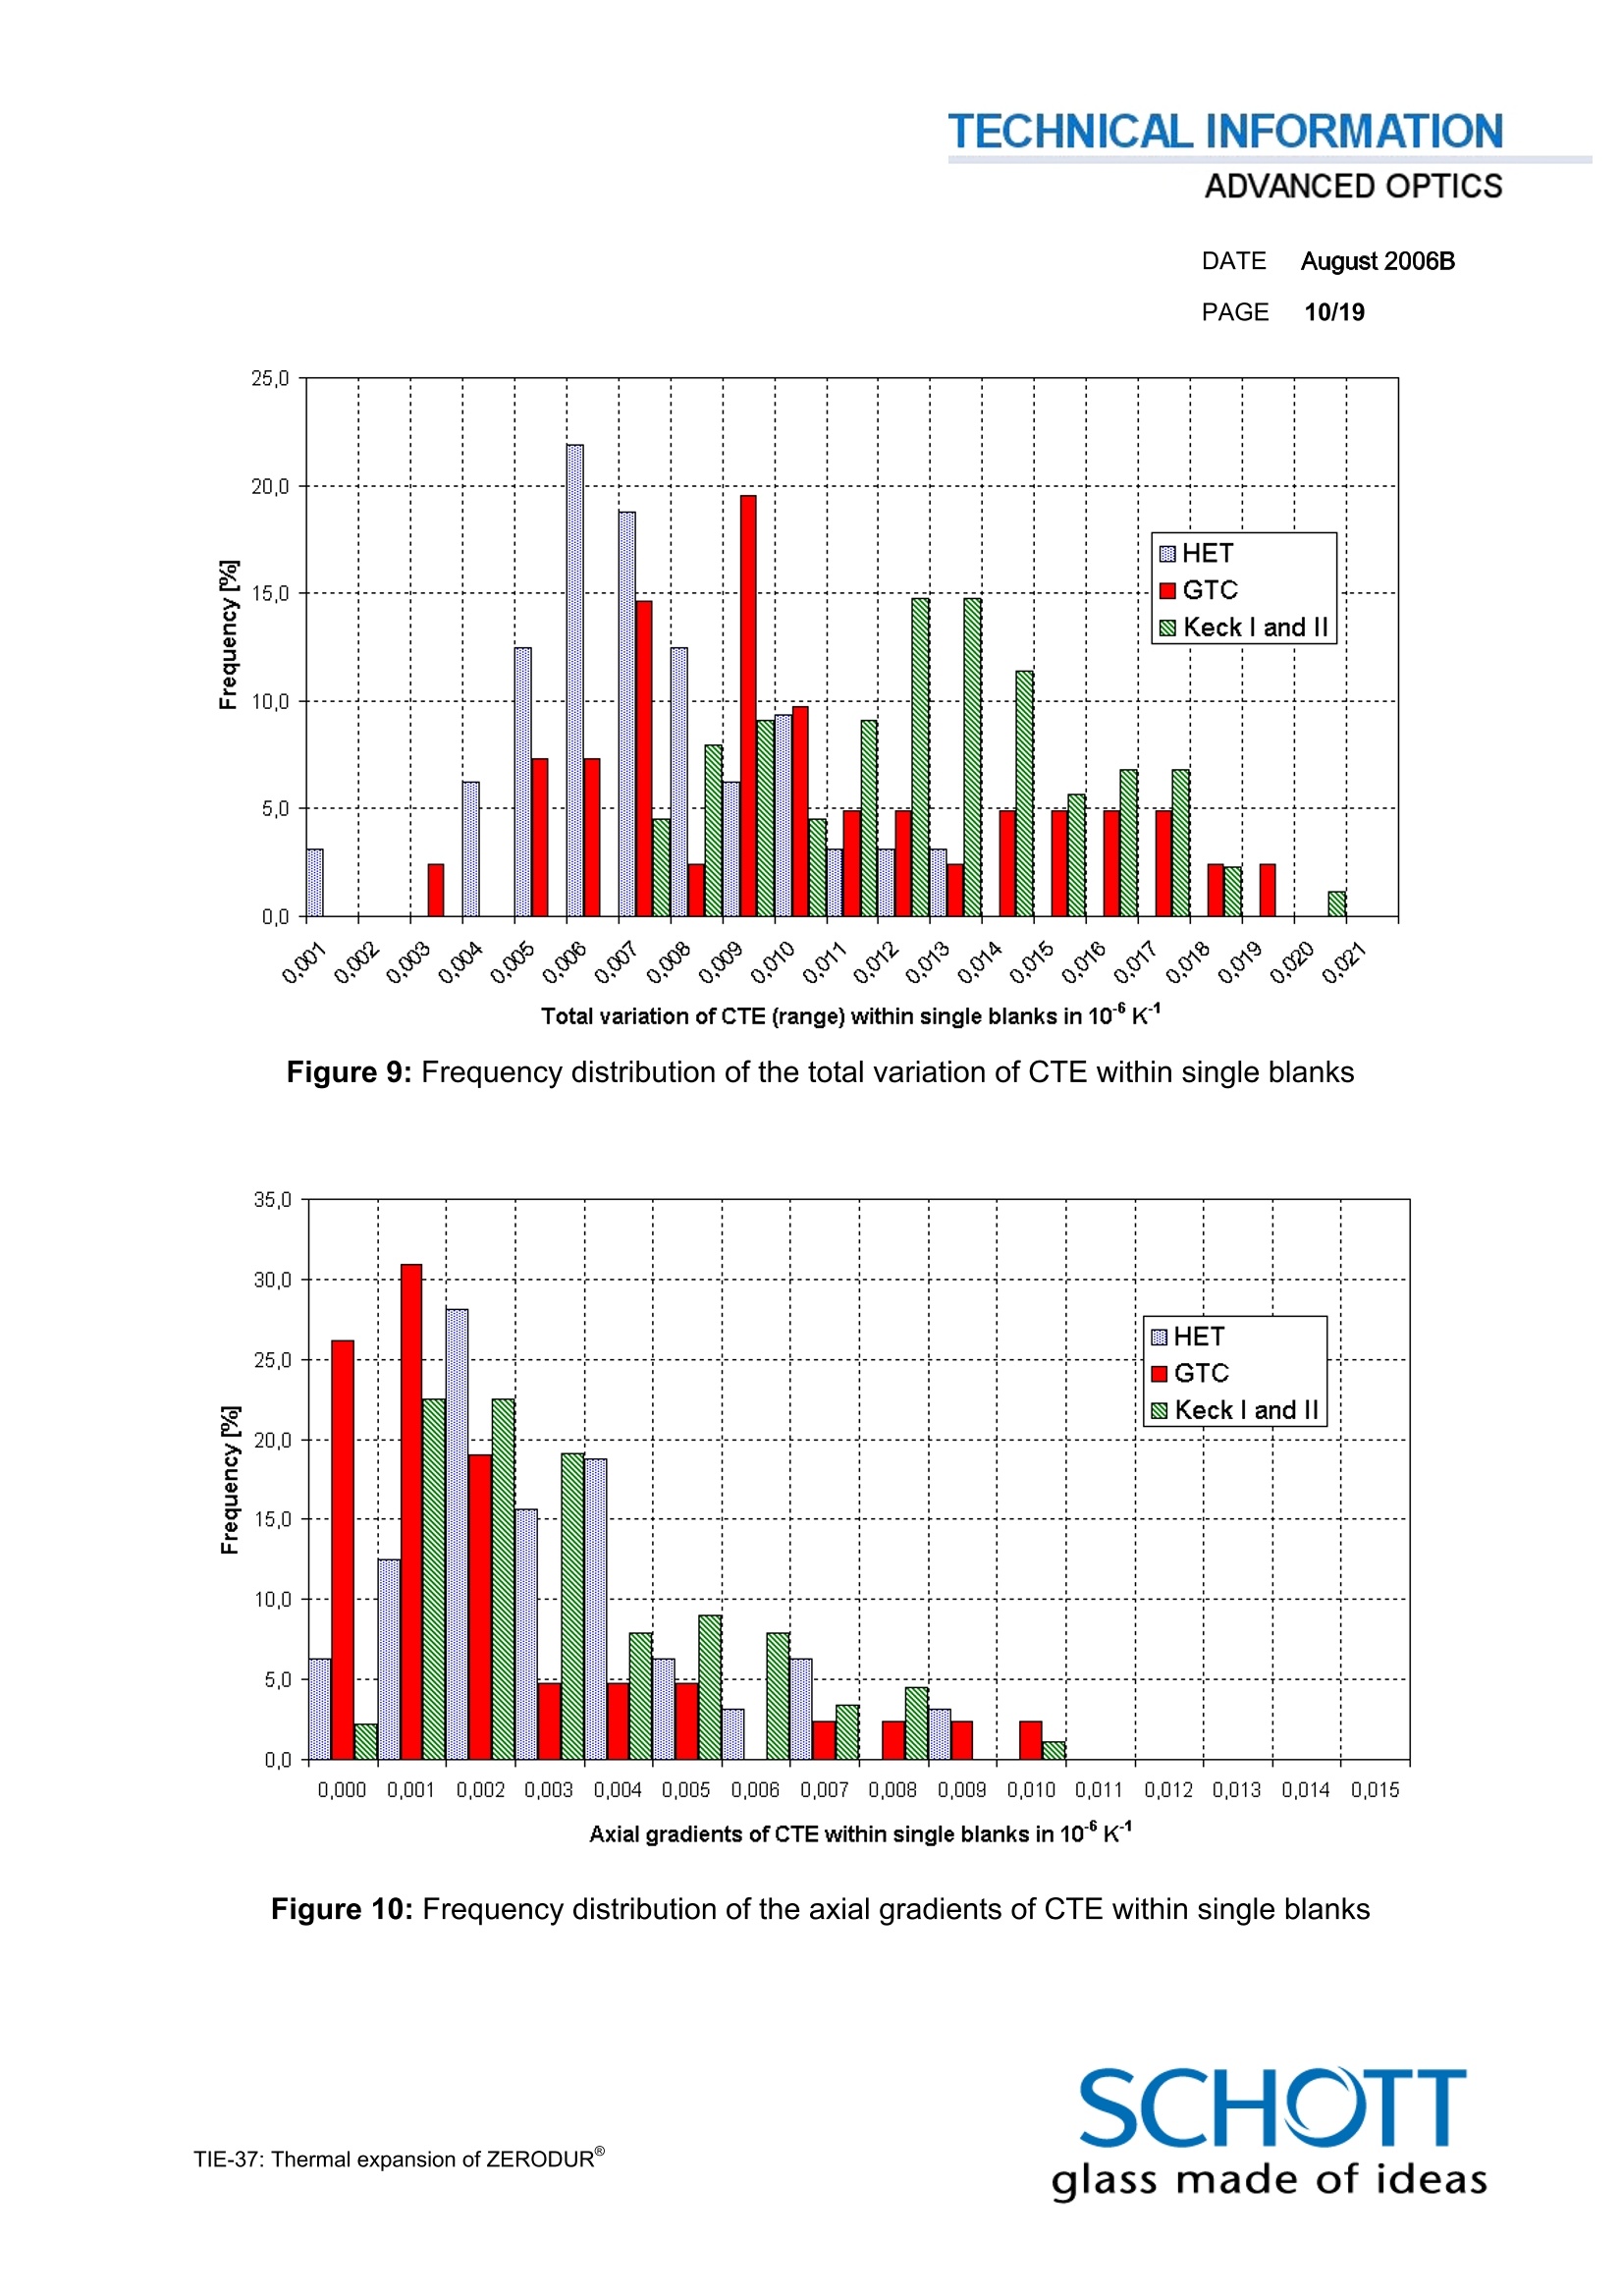
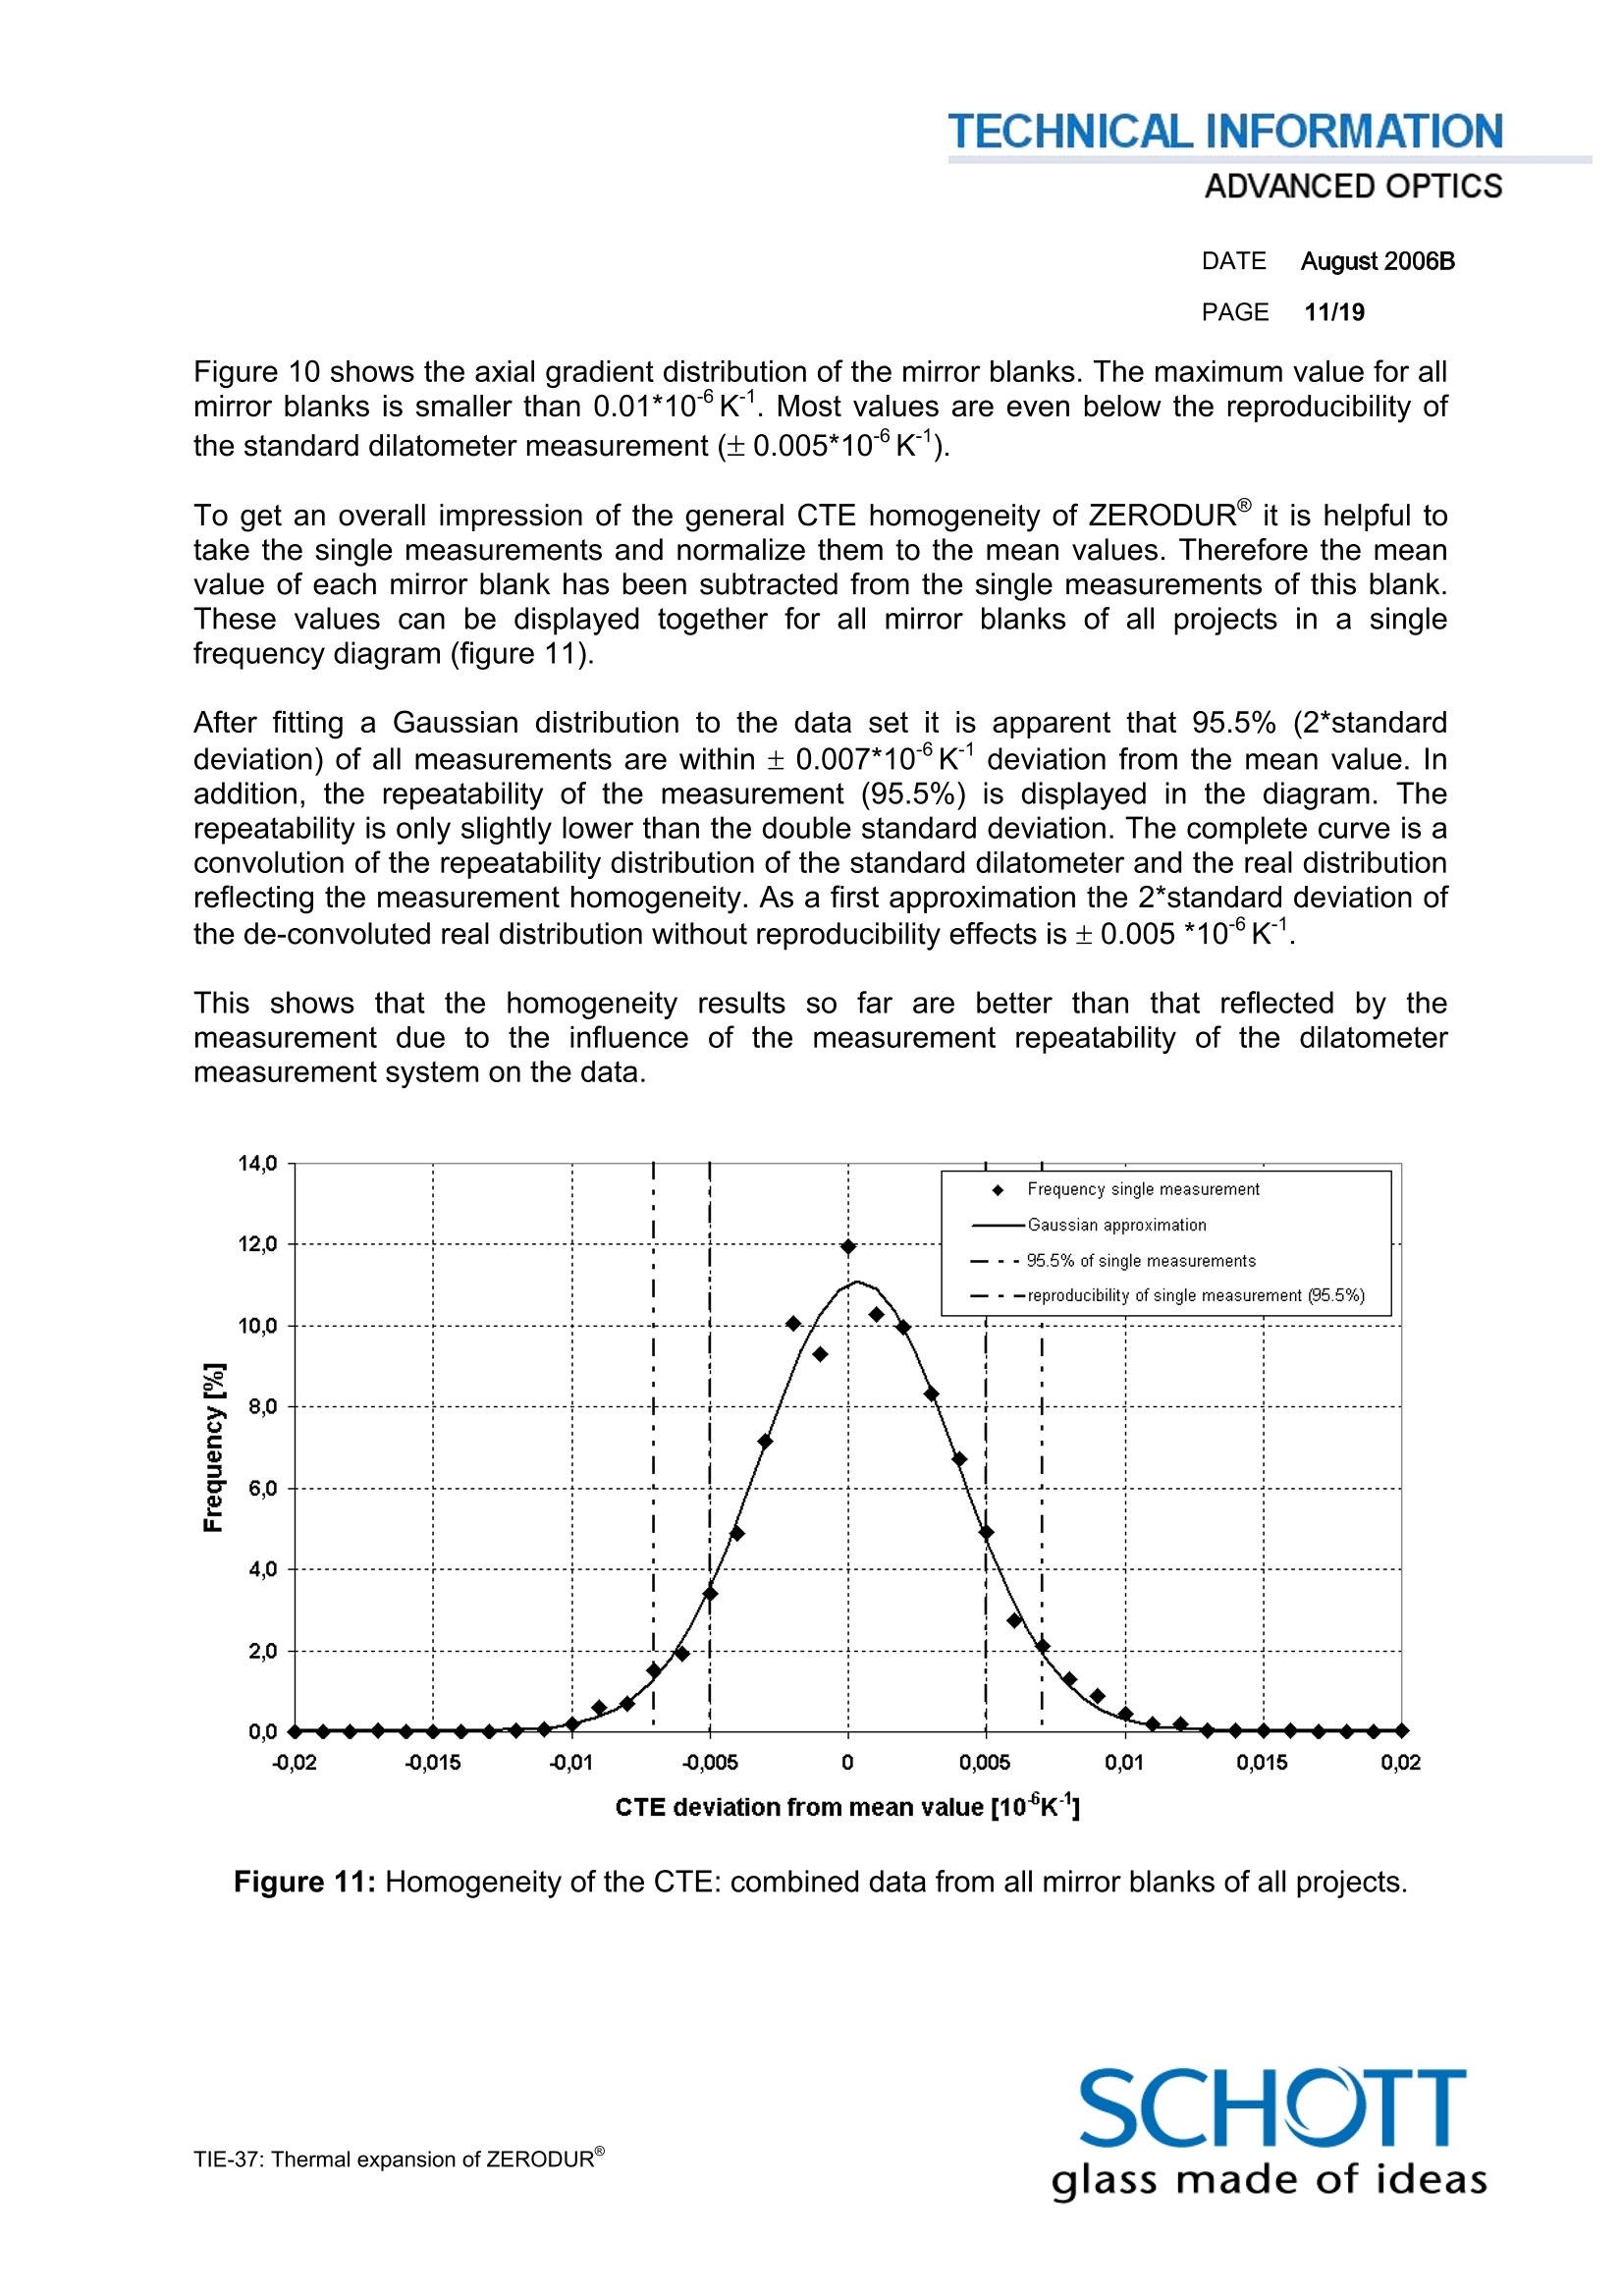
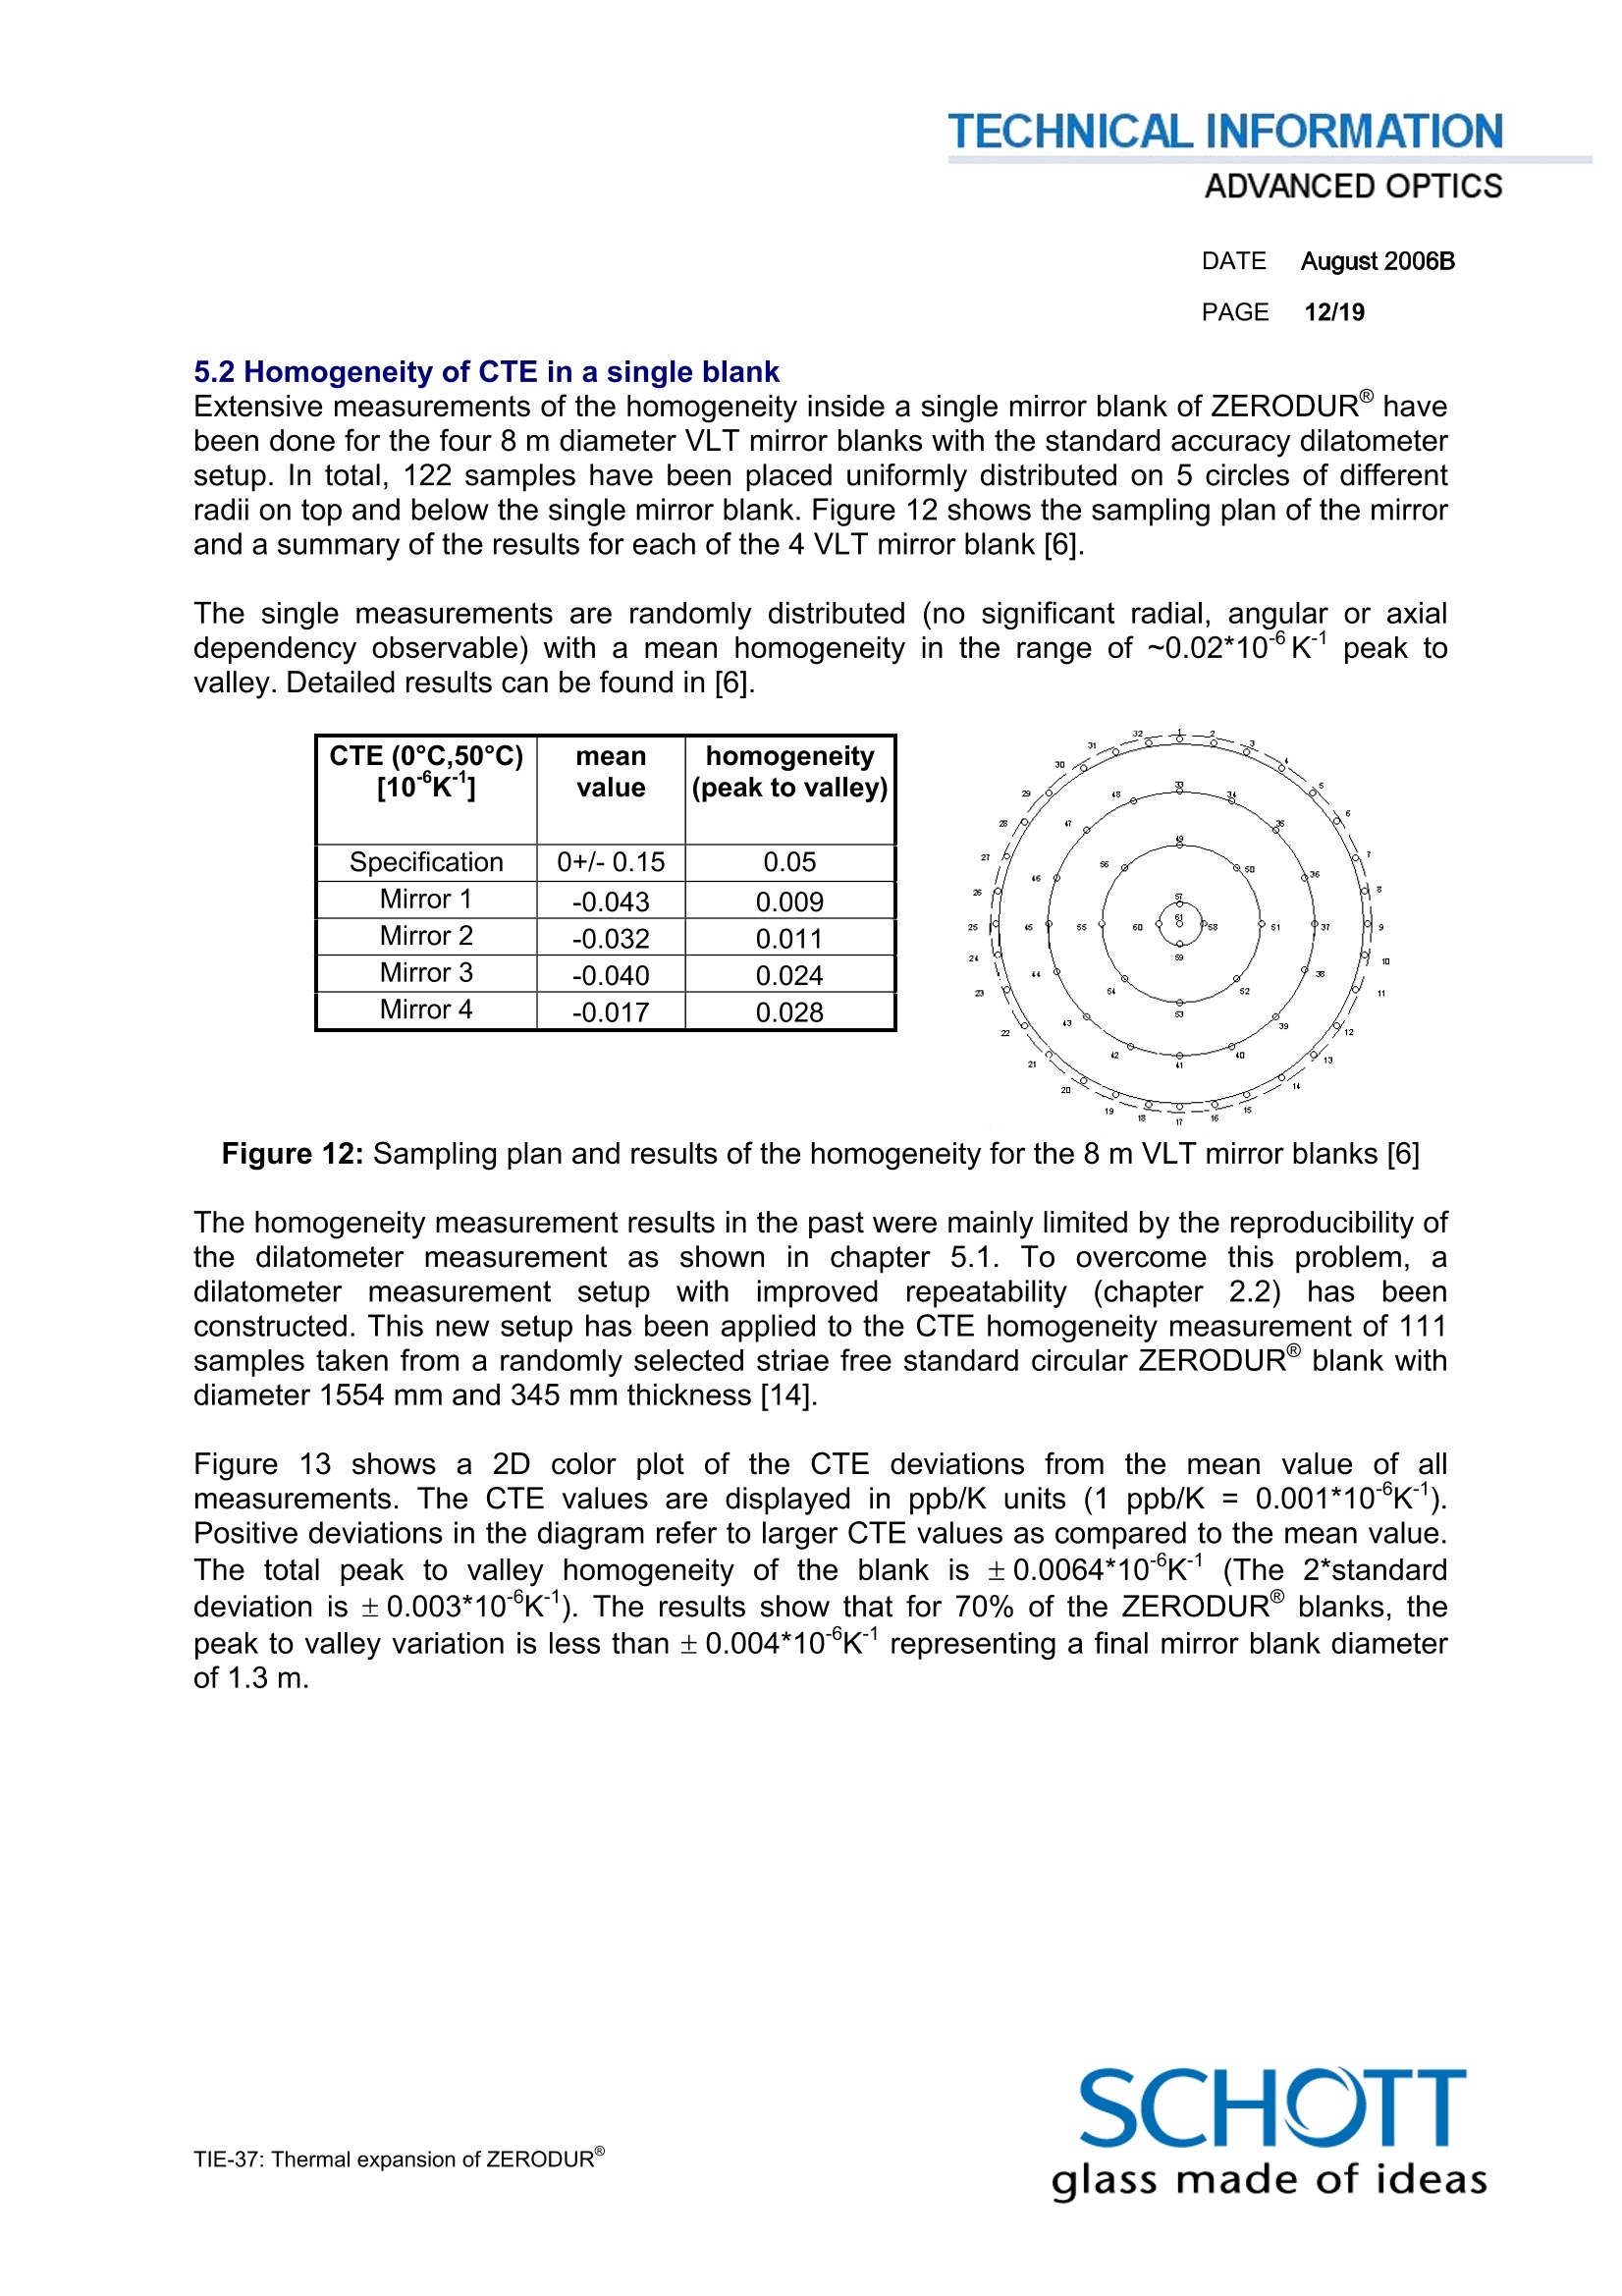
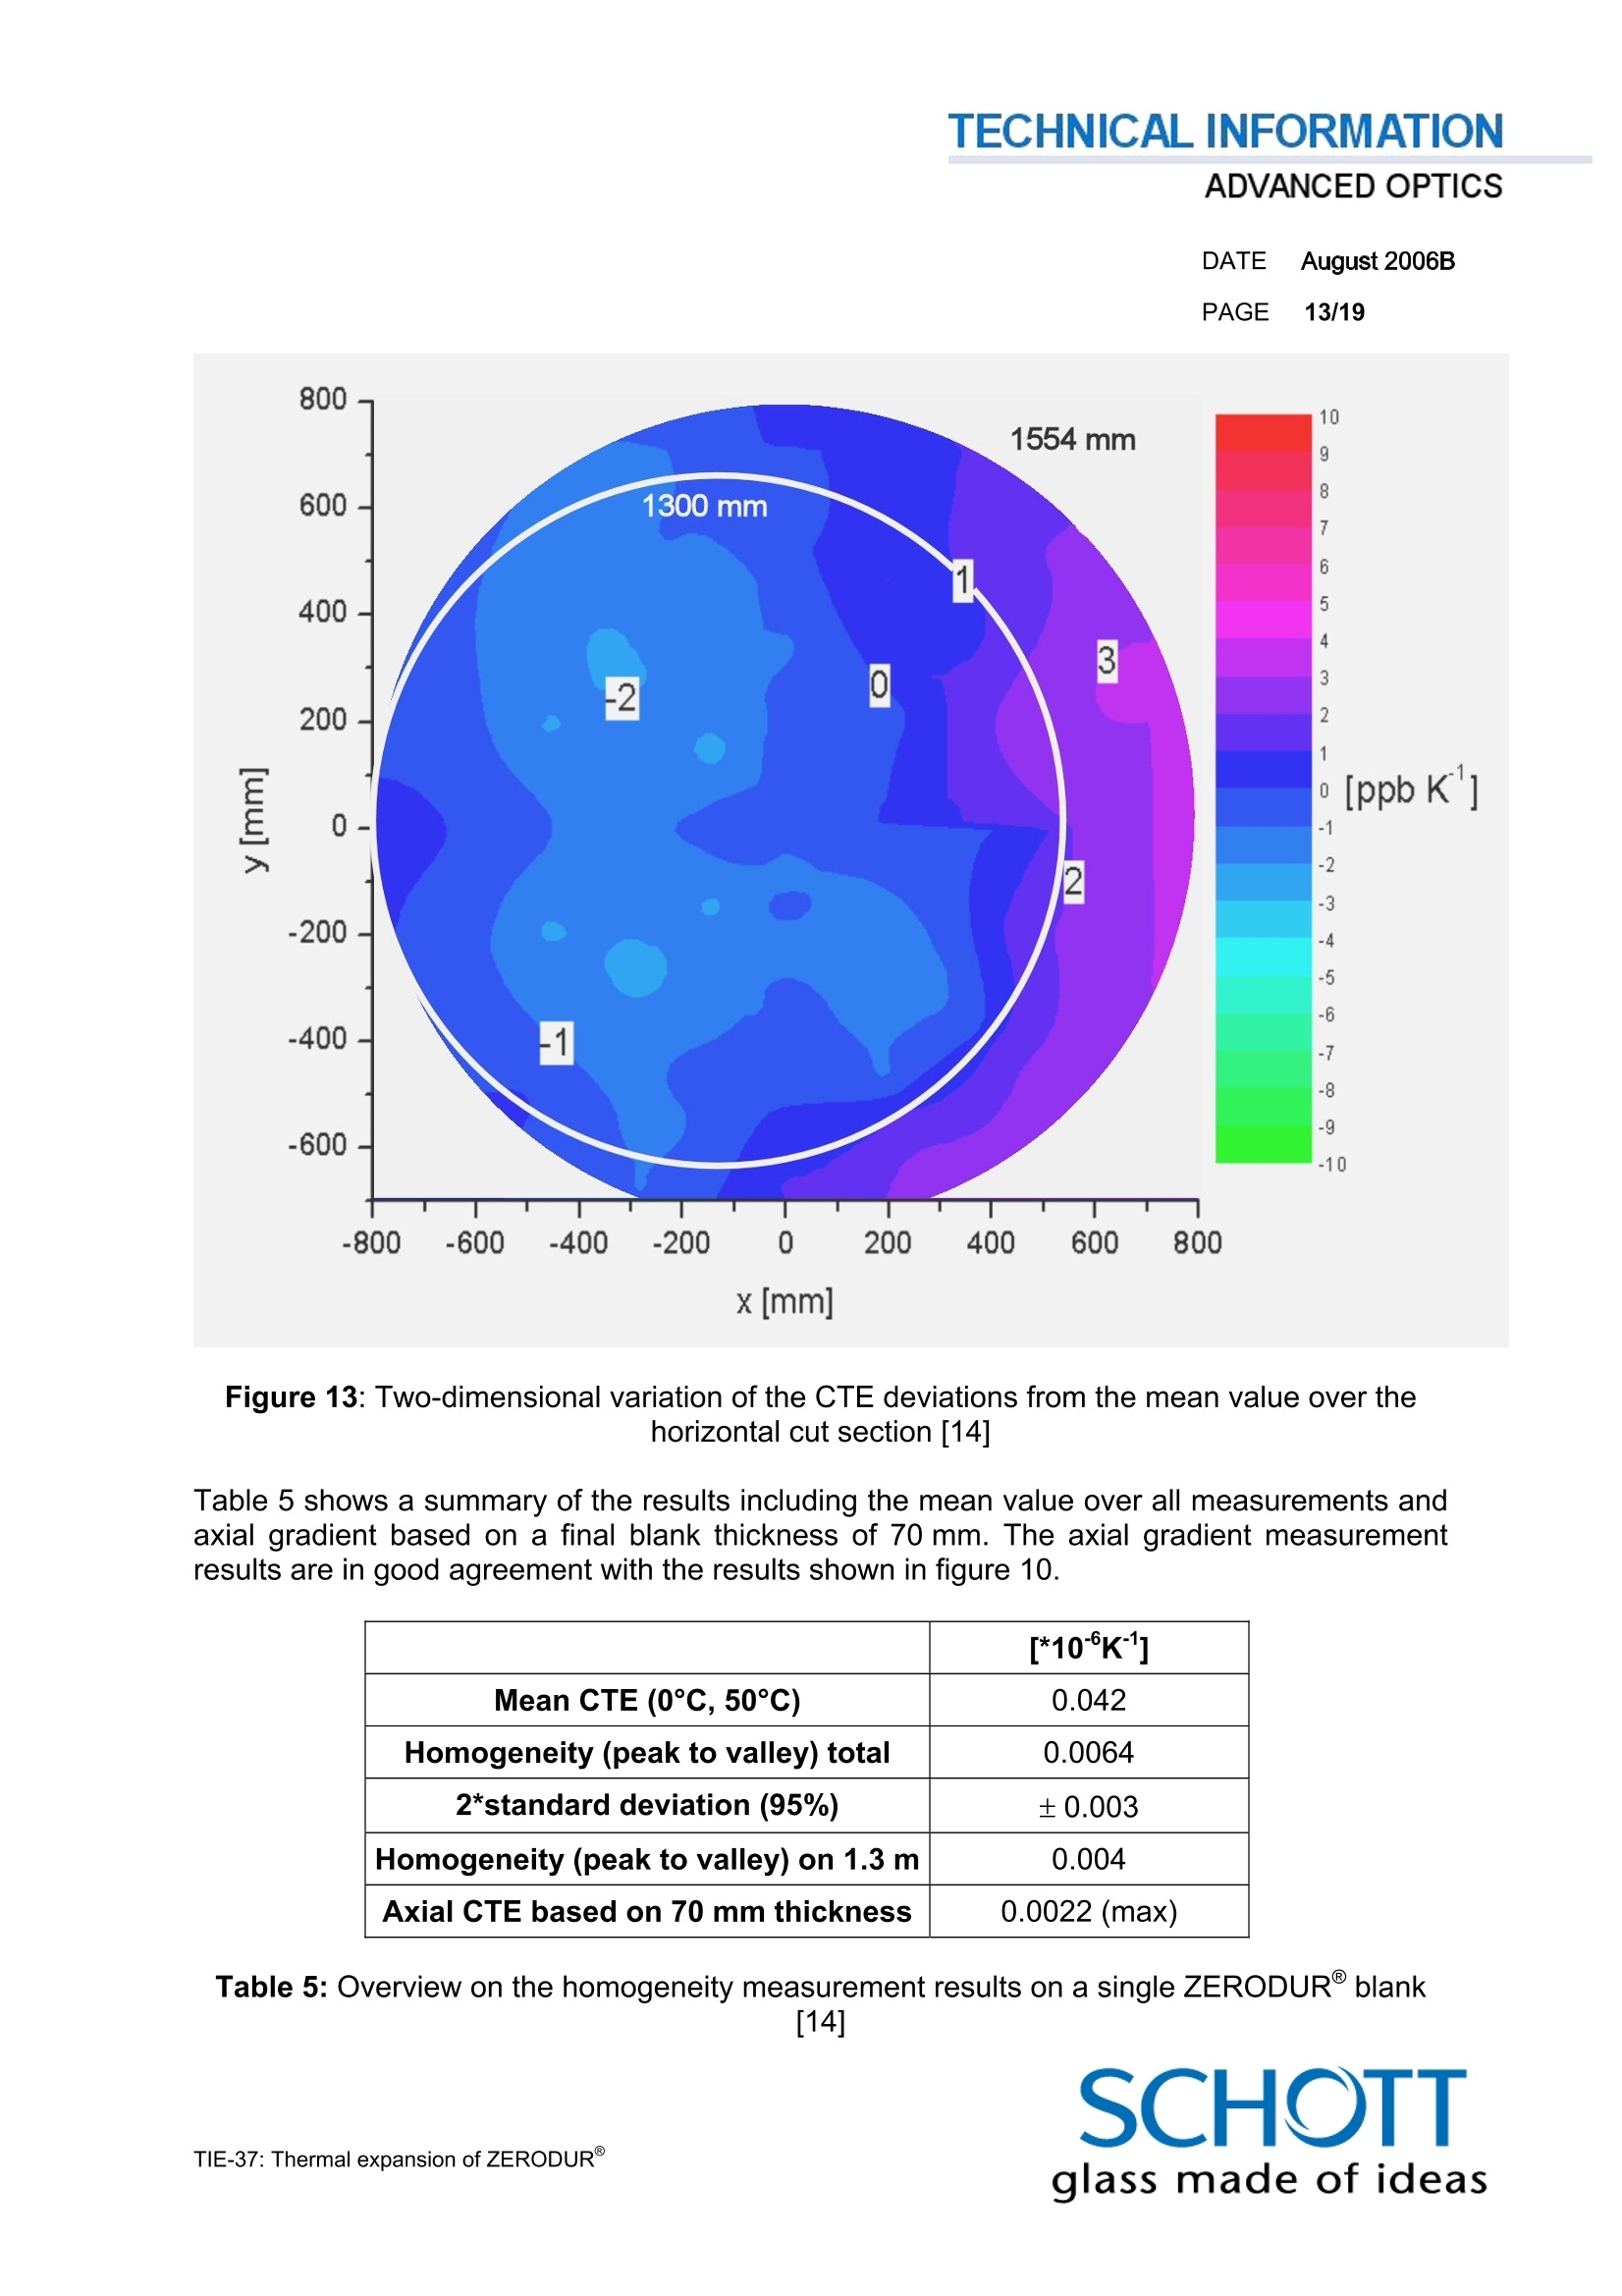
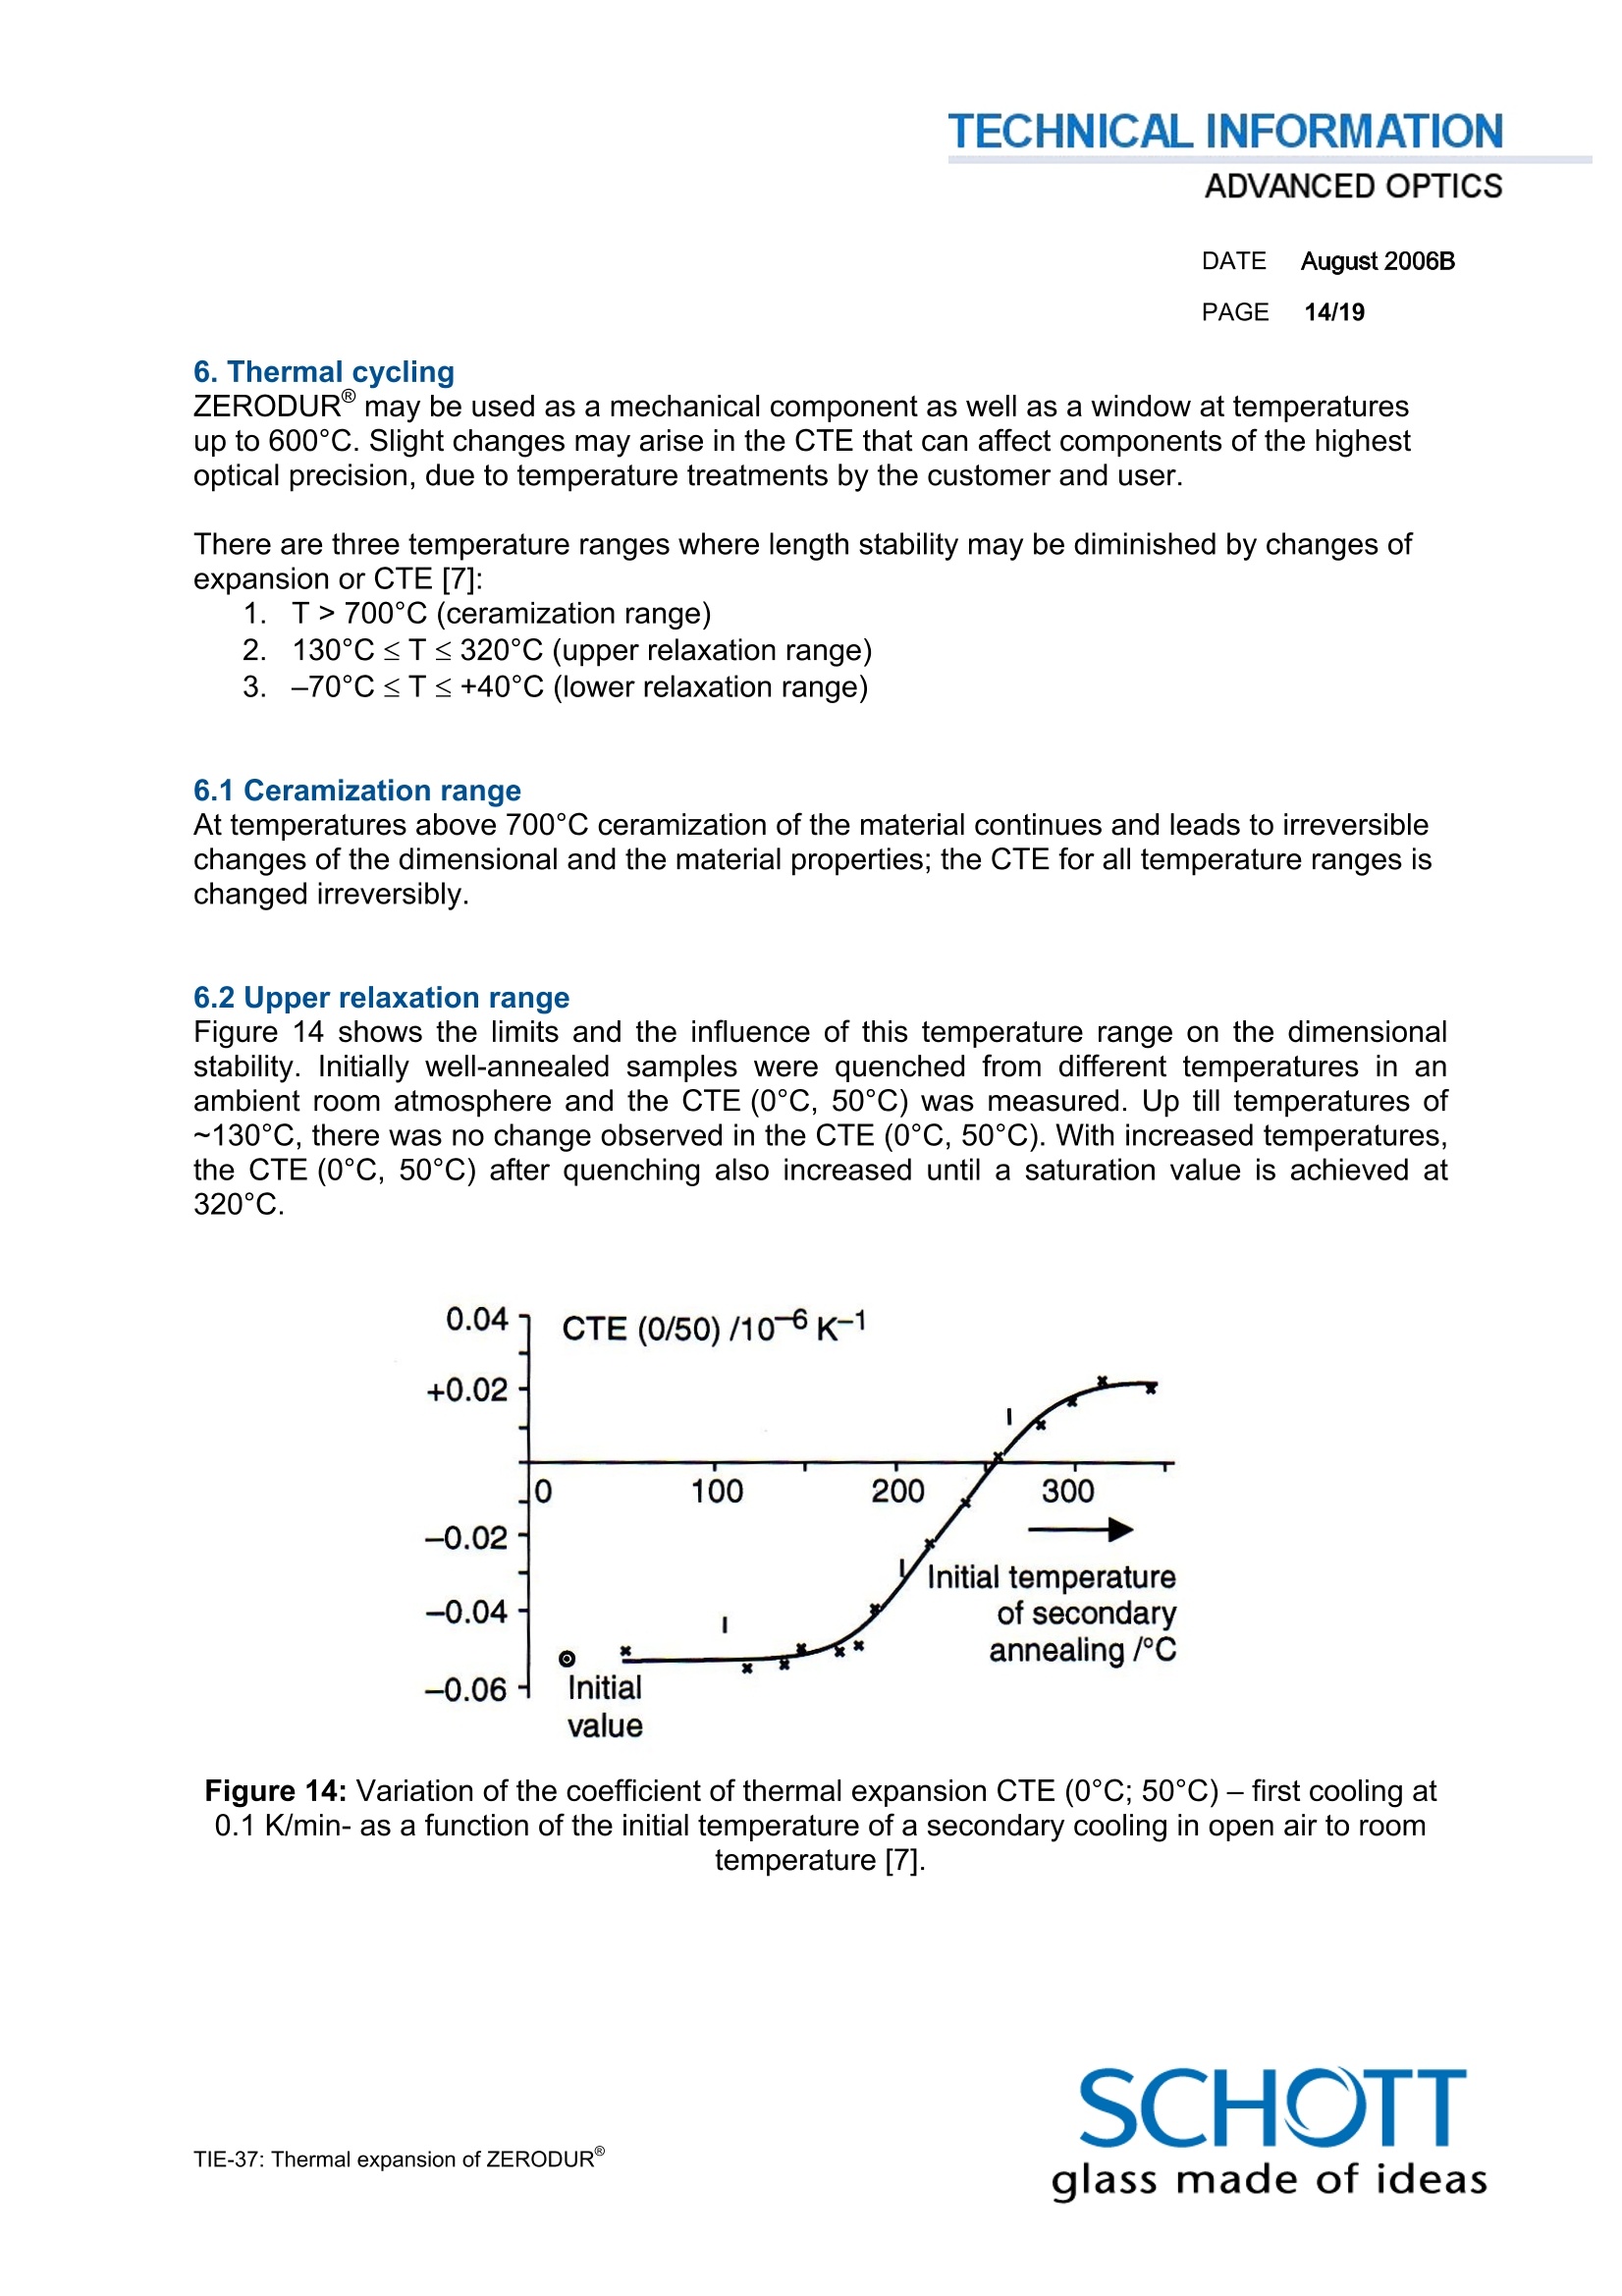
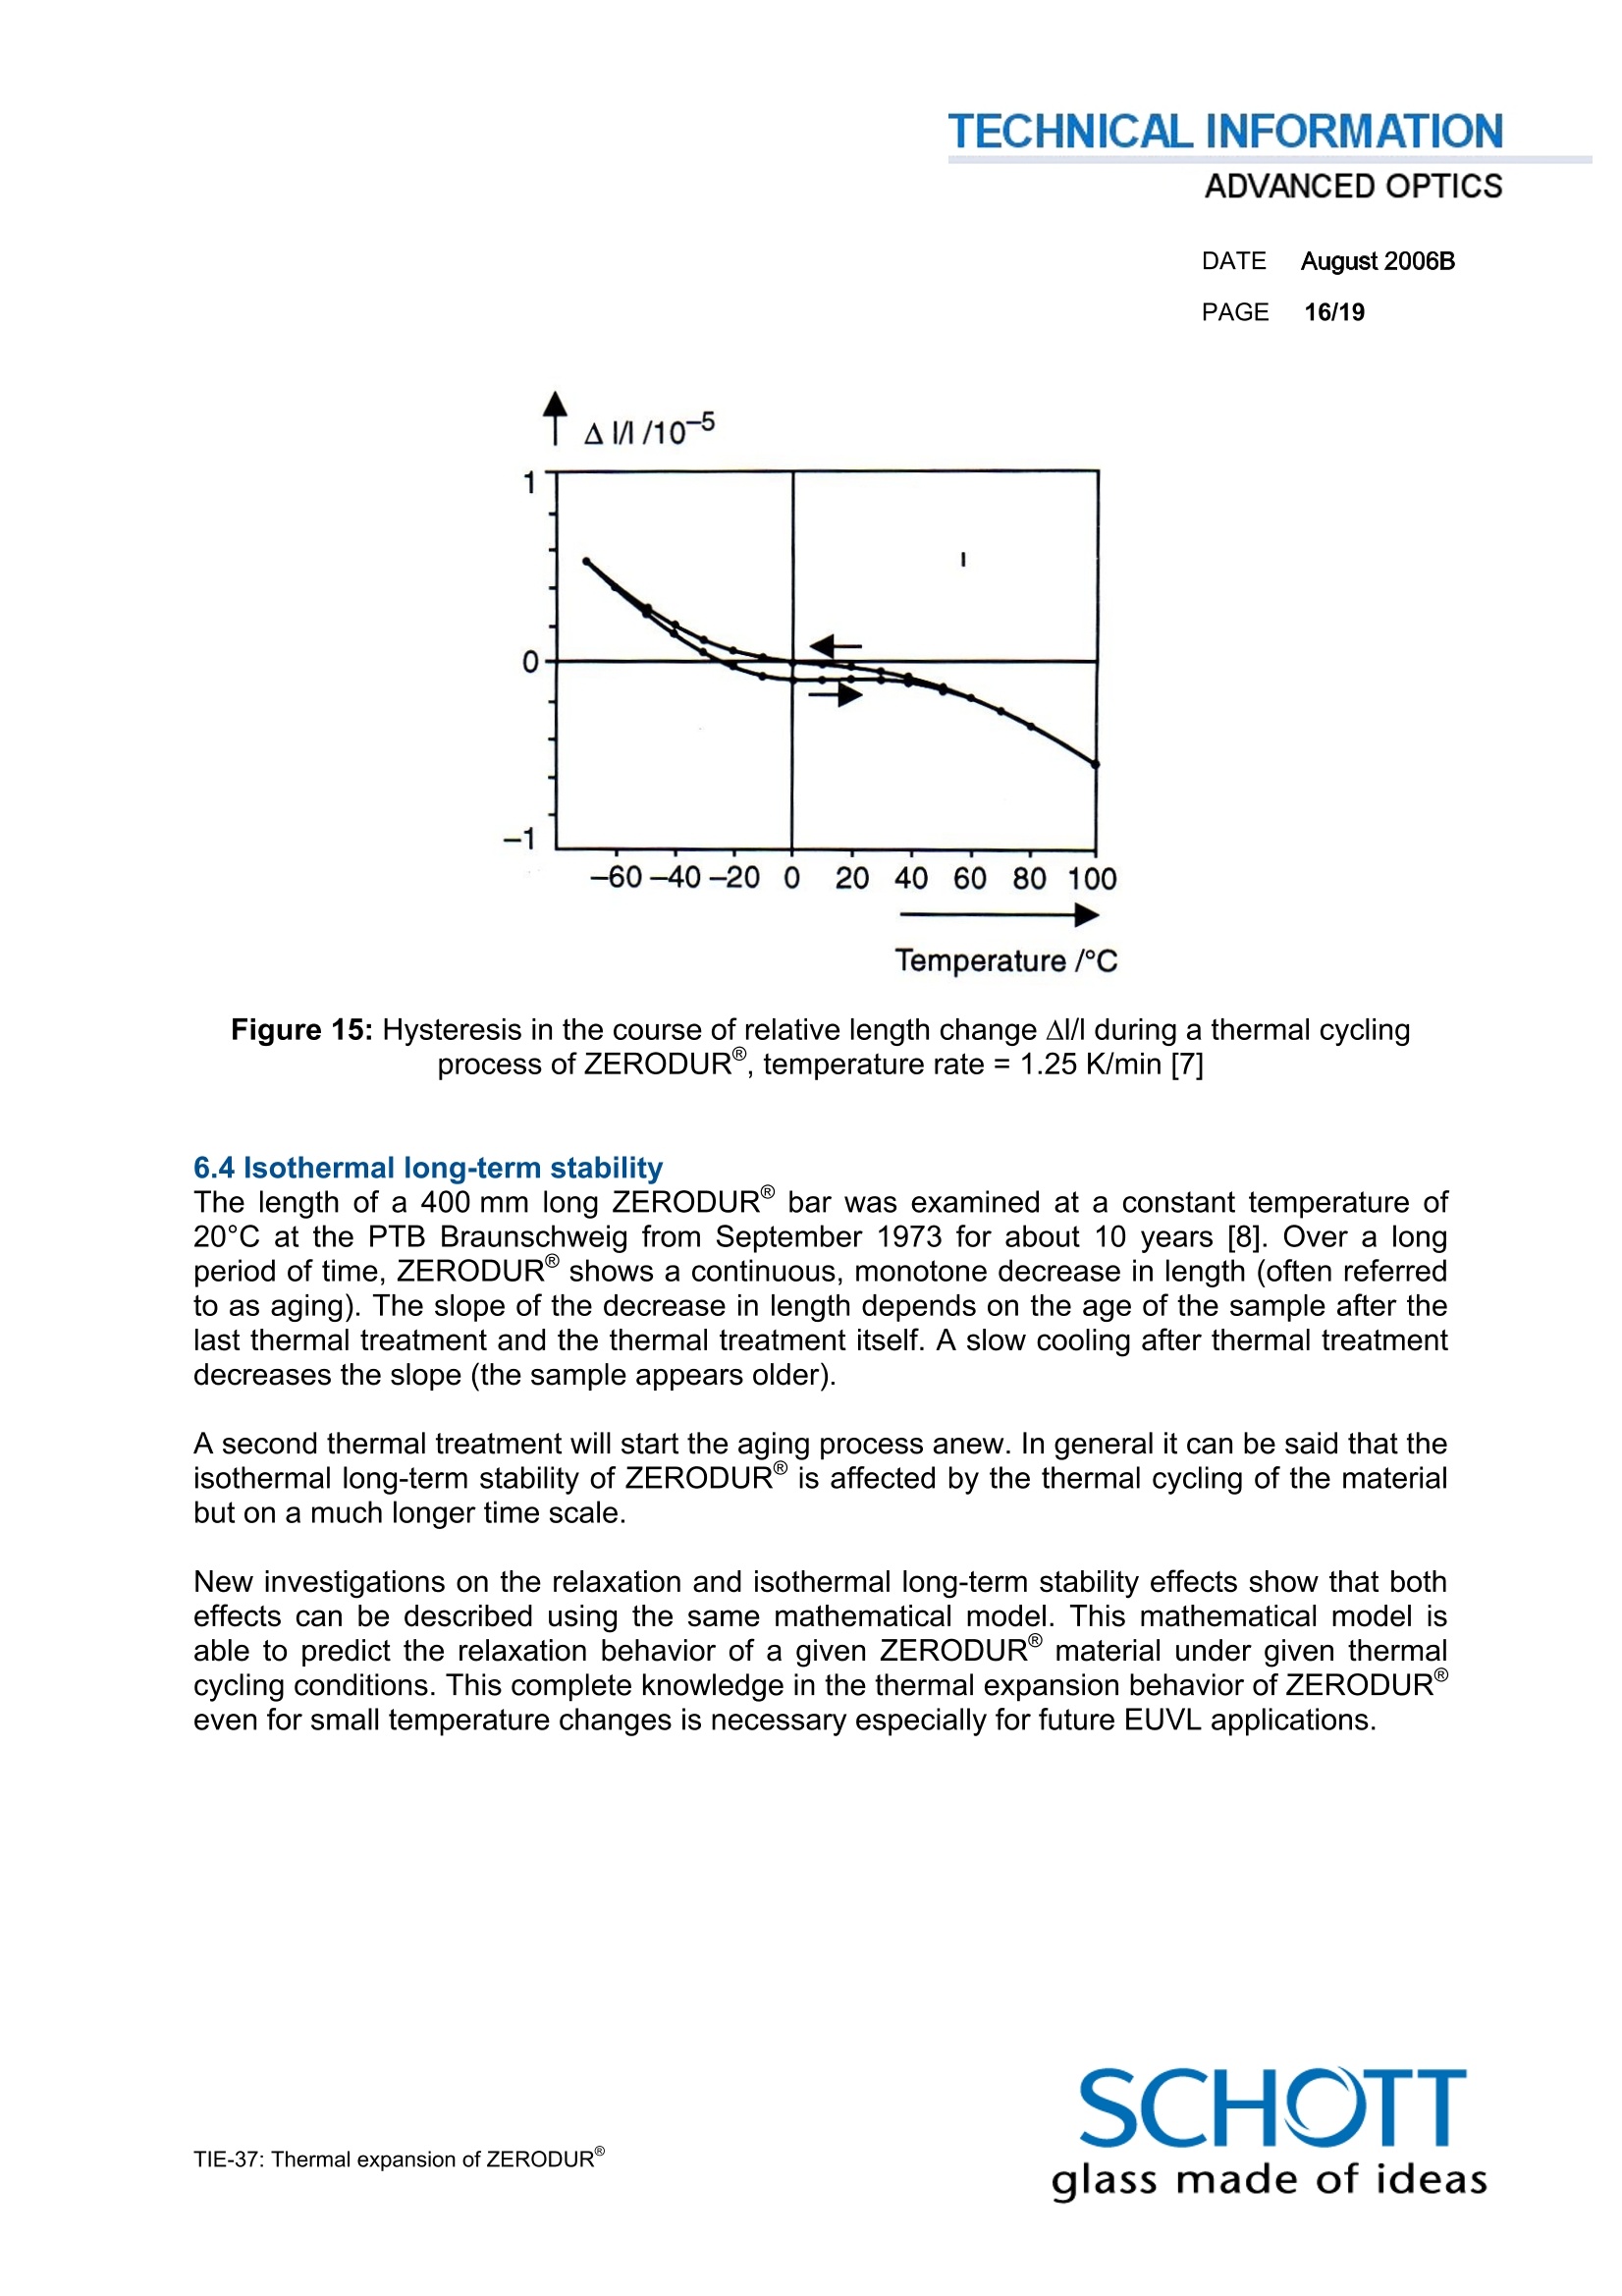
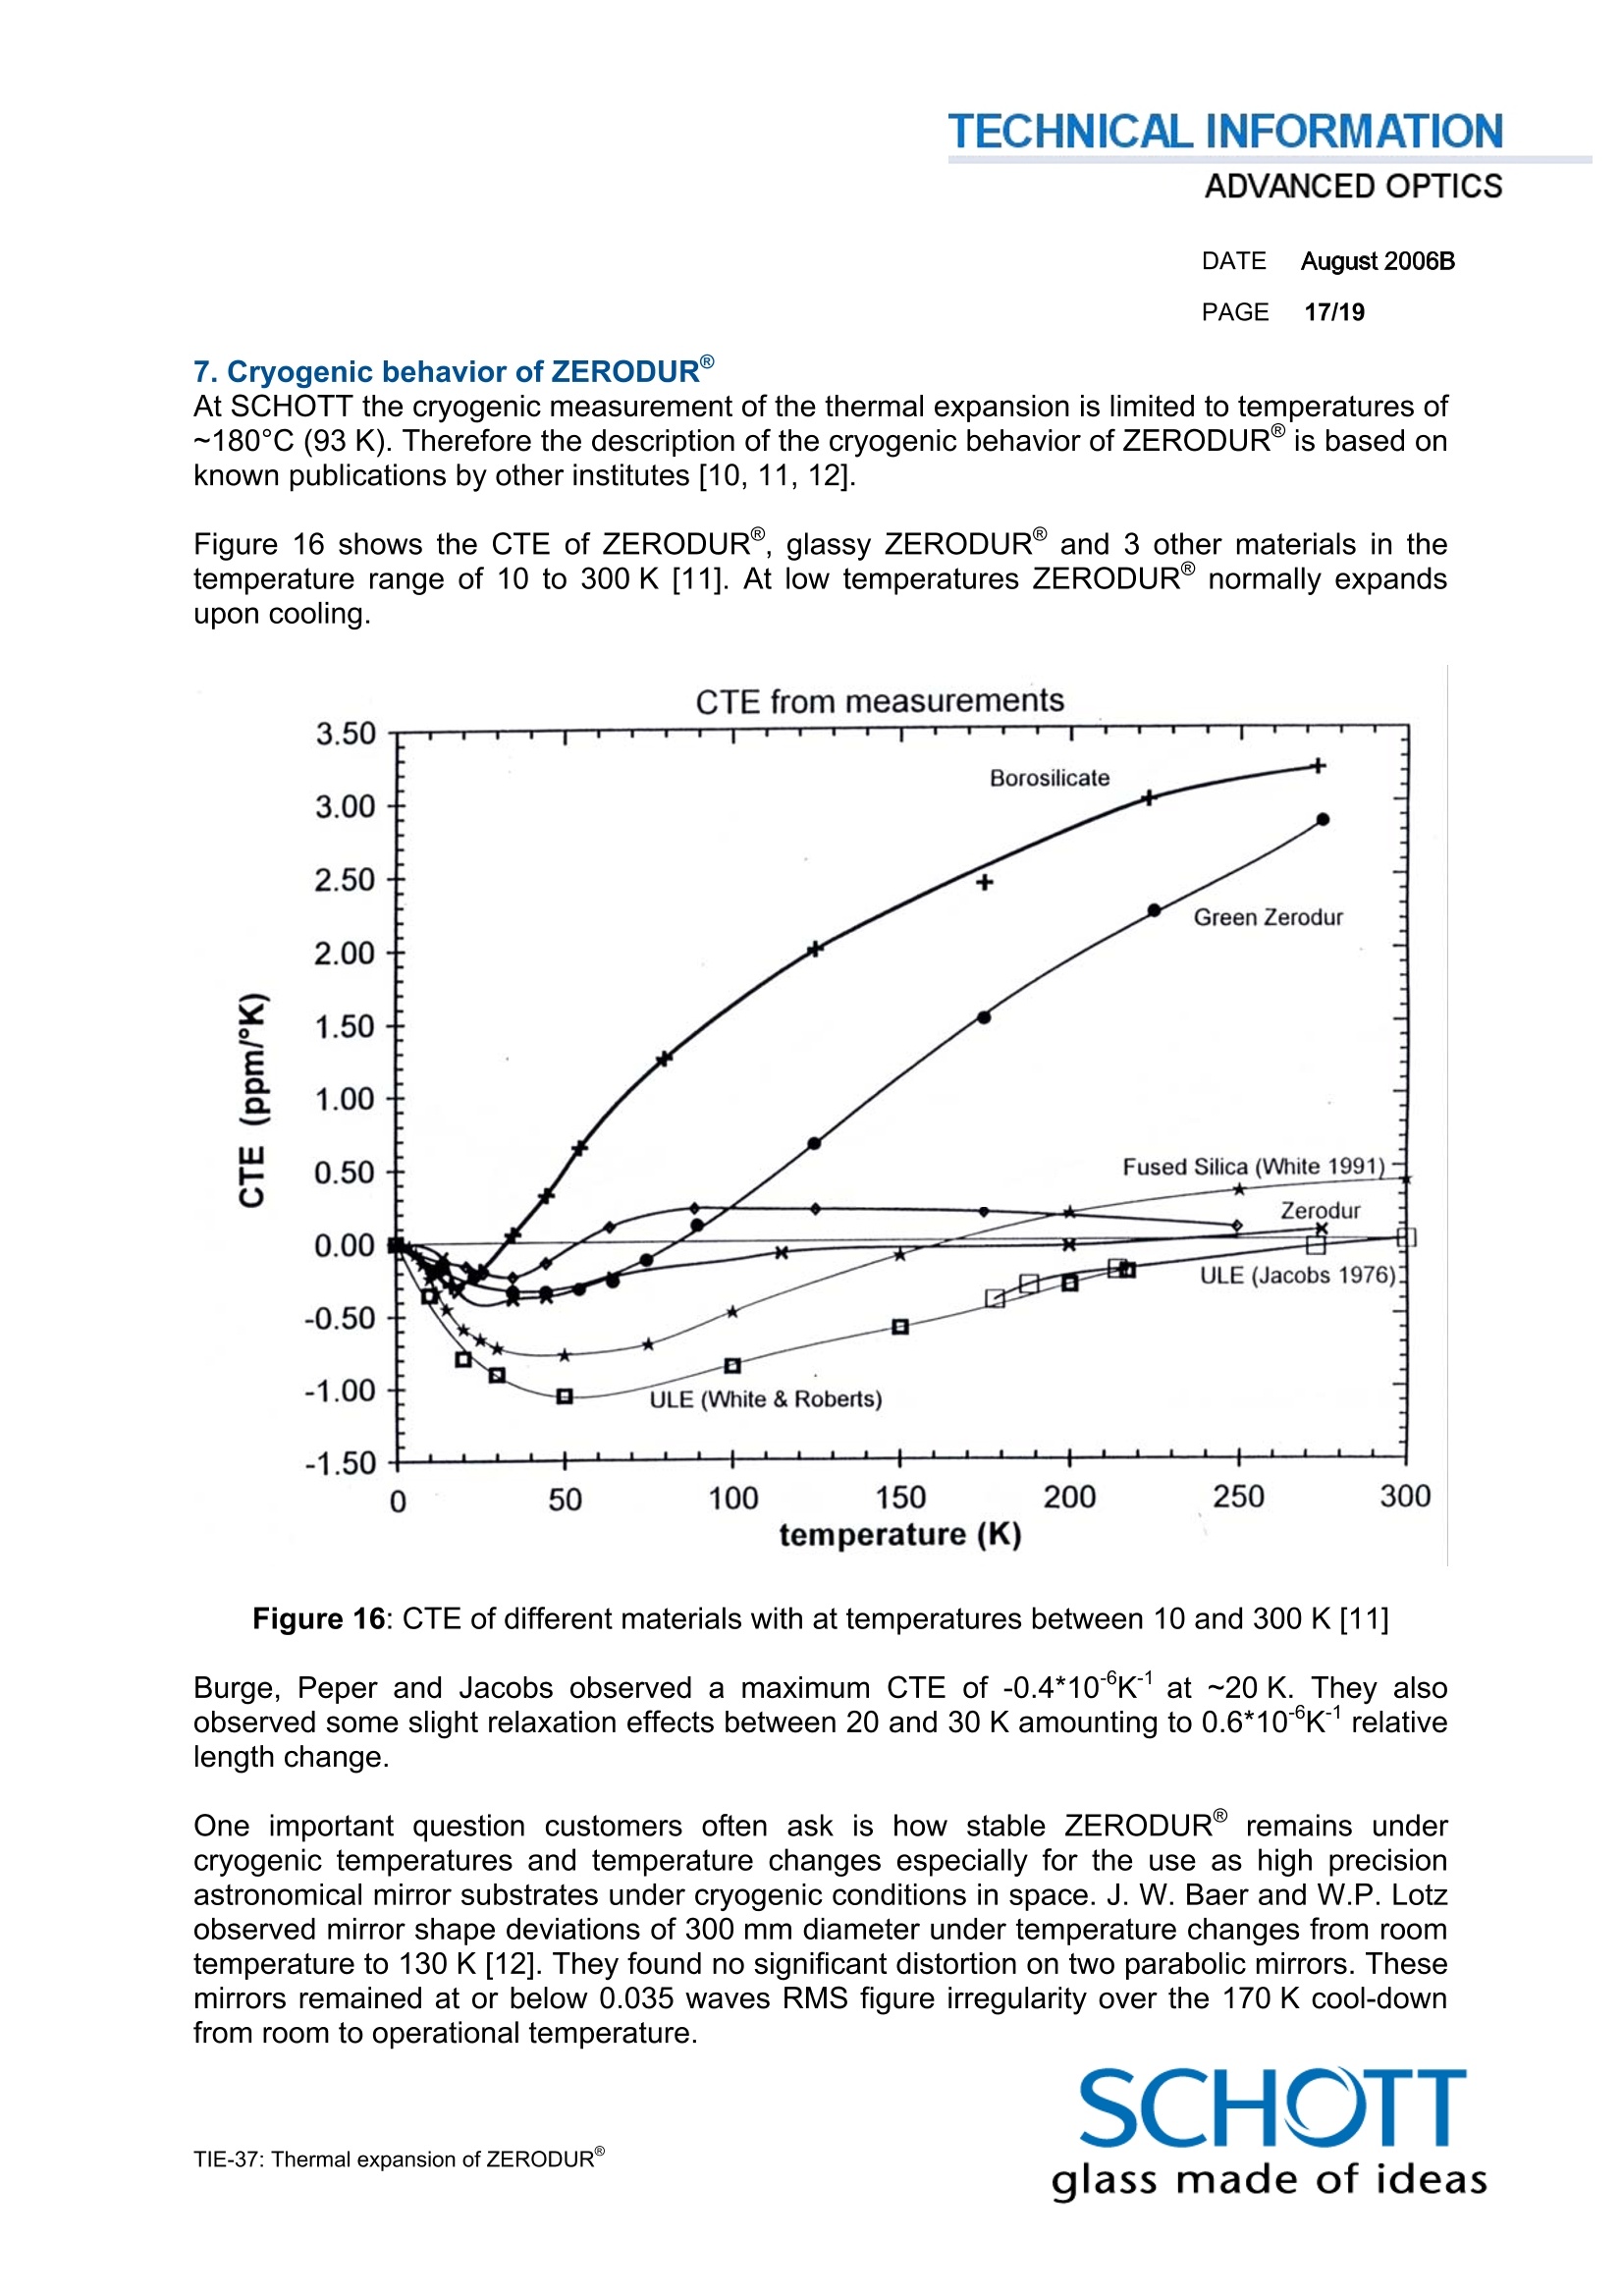
TECHNICAL INFORMATIONADVANCED OPTICS TIE-37: Thermal expansion of ZERODUR 0. Introduction This technical information gives an overview on the thermal expansion of ZERODUR. Thisarticle begins with a description of the dilatometric measurement of the coefficient of linearthermal expansion (denoted as CTE in the following text). Then the specifications of the meanCTE and the CTE homogeneity are explained and an evaluation of the results for about 200ZERODURmirror blanks is presented to give a statistical description of the achievablequality. At the end of this article is a short summary about the influence of thermal cycling andcryogenic temperatures on the CTE. 1. Production of ZERODUR ZERODUR is an inorganic, non-porous glass ceramic, characterized by a phase of evenlydistributed nano-crystals within a residual glass phase. ZERODUR contains about 70-78weight percent crystalline phase with a high quartz structure. This crystalline phase has anegative linear thermal expansion, while that of the glass phase is positive. The crystals havean average size of about 50 nm. Figure 1: ZERODURproduction process schematic The ZERODUR manufacturing sequence is based on established and proven methods usedin the production of high homogeneity optical glasses. The production starts with filling a largetank with raw material and heating it up to obtain a homogeneous melt (refer to figures 1-3). The ZERODUR melt is cast into molds and inserted into annealing ovens to cool the rawcasting down to room temperature in a controlled way for _sLeQv*eria0l-6 wK-e1e kPsr.e- rThe glassy rawcasting still has a coefficient of thermal expansion (CTE) of ~+3*10K1. Pre-crystallized outermaterial layers are removed in a subsequent processing step to prevent any uncontrolledceramization during the following ceramization process. DATE August 2006B PAGE 2/19 During the ceramization process the material is heated up again to achieve controllednucleation and growth of the crystal phase. The ceramization has a big influence on the finalCTE homogeneity of the blank and can last up to several months depending on the size of theZERODUR part [1]. After ceramization the material can be processed to its final shape.During this processing step CTE samples are taken directly from the final ZERODUR materialto estimate the final CTE value and homogeneity. Figure 2: ZERODUR annealing process schematic Figure 3: ZERODUR near net shape raw casting DATE August 2006B PAGE 3/19 2. CTE measurement ZERODUR@ is optimized for an application temperature range of 0℃ to 50℃. The CTE ismeasured using a modified dilatometer setup. SCHOTT offers standard and improvedmeasurement accuracy for the CTE (0℃, 50℃) measurement. The achievable accuracy issummarized in table 1: Accuracy [*10*K"] Repeatability(95%)[*10K] CTE (0°C, 50°℃) Standard dilatometer ±0.0100 ±0.0050 CTE (0°C, 50°C) Improved dilatometer ±0.0062 ±0.0012 Table 1: Comparison of the standard and improved dilatometer setup 2.1 Standard dilatometer setup for ZERODURCTE measurement The basic construction of the dilatometer used for the CTE measurement can be seen intigure 4. Ihis setup is similar to the instrument presented by Plummer and Hagy[2]. Thedifference lies in the material used in the sample holder and the push rod in our setup - theseare made of titanium silicate glass. The system is optimized for a sample length of 100 mmand 6 mm diameter. The temperature is measured with a platinum resistance thermometer(PT 100) mounted near the sample. The temperature of the dilatometer head is stabilized atbetter than 0.2K. The whole equipment is set up in a laboratory where the temperaturevariation is less than 1 K. Figure 4: Basic construction of the push rod dilatometer [3] DATE August 2006B PAGE 4/19 During measurement, the sample and the sample holder are immersed into a water bath. Athermostat is programmed to heat and cool the water bath according to a defined procedure.When changing the temperature, the sample changes its length and the rod moves the coil ofa Linear Variable Differential Transformer (LVDT). The signals of the LVDT and thetemperature of the water bath are recorded and used for calculating the CTE. This system isoptimized for the measurement of the CTE (0°℃; 50°℃) The CTE or a (To;T1) is calculated by where U(T;) is the voltage (mV) of the LVDT for the temperatures of To and Ti, lo is the samplelength, E is the sensitivity of the LVDT (mV/um) and 0syst(To;T1) is an expansion-correction ofthe system (sample holder). The system is regularly calibrated using a certified titanium silicate reference sample that wasmeasured attthe Physikalisch-Technische Bundesanstalt(PTB) withcahigh-precisioninterferometer system. The reference sample was measured to an absolute accuracy of +0.005*10K-. The overall accuracy of the dilatometer for the absolute CTE (0℃, 50℃)measurement is±0.010*10K and the reproducibility is ±0.005*10*K-1(95% confidencelevel). 2.2 Improved dilatometer setup for ZERODURCTE measurement The improved dilatometer setup is based on the standard setup described in chapter 2.1.Pushing the limits for accuracy of the CTE measurement forward, the standard electro-mechanicalLLVDTlWasreplaced by aninterferometric measurement system. Theinterferometer measurement head can measure relative length changes to a high precision atan increased resolution. The resolution is a factor of 50 better as compared to the standardLVDT setup. This improved system was developed to cope with the demands of high precisionCTE measurements of ZERODURused as mirror substrate in extreme UV microlithographyapplications [4]. The short term reproducibility of the new dilatometer setup is ±0.0012*10Kbased on a 95%confidence level. The overall accuracy of the improved dilatometer for the CTE (0°℃, 50°℃)measurement is ± 0.0062*10K-1. The repeatability has been improved by a factor of 4 ascompared to the standard setup [14]. 2.3 Measurement of the CTE (0°℃, 50℃) The temperature sequence for the measurement is as follows: First the system is heated upfrom room temperature to 50°C. The temperature is kept constant at 50℃ for 20 minutes.Then the system is cooled down to 0℃ at a rate of 0.6°C/min and kept constant for 20minutes. At the end of the 20 minutes holding time, the length of the sample is virtually set tozero. Then the sample is heated up again to 50°℃ and the relative length change of thesample is measured after a holding time of 20 minutes. The CTE (0°℃, 50℃) value can becalculated from the change of length afterwards. DATE August 2006B PAGE 5/19 2.4 Measurement of the total change of length curve (TCL) To determine the total change in length, the relative change of length Al/lo is generallymeasured within a temperature range between -50°C℃ and +100°C. The total change of lengthof ZERODUR is the maximum change of length within this temperature range. In contrast tothe static CTE (0℃, 50℃) measurement the TCL curve measurement iss a dynamicmeasurement, therefore the measurement setup and sequence is different. 40 Al, in 10 -6 Temp. im 一i- -40 -20 40 60 100 Figure 5: Two typical TCL curves of ZERODUR For measurements in the temperature range [-50°C, +100°C] the standard dilatometer isequipped with a gas cooling system instead of a water cooling system. The sample is cooleddown to -50℃ first. Then the sample is heated up with a constant annealing rate of 1.3 K/min.The change of length is recorded continuously, approximately every hour, during the heatingprocess. Two typical TCL curves with different CTE (0℃, 50℃) values are given in figure 5.The curves are typically slightly s-shaped and tilted around O-expansion for differentCTE (0℃, 50C) values. The TCL CvaLluYe for the first curve is ~13*10and the CTE (0℃,50℃)derived from the curve is -0.040*10K-1.The TCL value of the second curve is ~6*10 and theCTE (0℃, 50℃) value is 0.010*10K-1. It is important to note that the CTE depends on the temperature/time history and therefore alsoon the measurement sequence (the so-called CTE relaxation effect described in chapter 6).CTE (0°℃; 50°C) values derived from TCL-curves are therefore less accurate than thoseobtained with the 0℃-50°C method. Due to the different temperature versus time program,CTE values may differ slightly even for the same sample. The TCL curve of ZERODUR can be adjusted to shift the CTE value to exactly zero at agiven temperature under defined conditions [4]. Figure 6 shows an example of the two tailoredCTE curves with “zero crossings" at two different temperatures. Such tailored“zero-crossings”may be important for different applications of ZERODUR DATE August 2006B PAGE 6/19 Temperature [C] Figure 6: Two examples of tailored CTE“zero-crossings”of ZERODUR" 3. Sampling for CTE measurement of ZERODUR The following chapters present the results from CTE measurements of more than 200astronomical mirror blanks with diameters between 1-2 m produced at SCHOTT [5]. Table 2shows an overview of the mirror blank projects included in this presentation. A generaloverview on 100 mirror telescopes from SCHOTT can be found in [6]. Project/Site Dimensions ofPrimary MirrorBlank CTE [10*K]specification ACTE [10*K]specification samples perblank Completed Keckl/Hawaii 43 segments dia.1900 mm thickness 76,5 mm +/-0.10 ≤0.02 18 (9 from topand 9 frombottom, on twocircles) 1990 Keck lI/Hawaii 42 segments dia.1900 mm thickness 75,8 mm 1993 HET/Texas 96 hexagons, width 1019 mm. thickness 56 mm +/-0.15 ≤0.01 4 (2 from topand 2 frombottom per rawcasting) 1995 GTC/LaPalma 42 hexagons,width 1622 mm. thickness 83,5 mm +/-0.05 ≤0.02 12 (6 from top,6 from bottom) 2002 Table 2: Overview on the astronomical telescope mirror project results. In general if there are no special requirements on the homogeneity of ZERODUR, a singlesample will be taken from each casting to estimate the CTE value. This sample will either becut from the remaining material after ceramization or cut from the glassy ZERODURmaterialbefore ceramization and placed in the same ceramization furnace. DATE August 2006B PAGE 7/19 Mirror blanks with dimensions up to 2.4 m are fabricated out of thick cylindrical or near netshaped ZERODURcastings with a height sufficient to fabricate at least 3 or 4 mirror blanksegments from it (figure7). After ceramization the castings are cut into single blanks. Mirrorblanks often have specific requirements on the homogeneity of CTE, therefore severalsamples representative for the total blank volume are needed. The samples have to be takentrom the remaining material of the casting according to given sampling plans (tigure 7). Ingeneral samples are evenly spread around the circumferential area of the mirror blanks.f theiinneSamples between two blanks can be assigned either to the bottom of the upper blank or to thetop of the lower blank. Table 2 gives detailed information on the numbers of samples perblank. Figure 7: Sampling plans for the Keck, Grantecan and HET telescopes 4. Mean value of CTE Individual pieces of ZERODUR can be supplied with a mean CTE in the temperature range of0°to 50°℃ in three expansion classes [13]: Expansion class 0 0±0.02*10-6K-1 Expansion class 1 0±0.05*10-K1 Expansion class 2 0±0.10*10K1 Table 3:Expansion classes according ZERODURcatalog [13] lf not otherwise expressly specified, expansion class 2 material will be supplied. In the following CTE always denotes CTE (0℃; 50C) values. Figure 8 shows the frequencydistribution for the mean CTE values of the Keck, GTC and HET mirror blanks. The meanvalue data of all projects ranges from -0.109 up to 0.06*10K1. DATE August 2006B PAGE 8/19 The range of the mean value distributions reflects the CTE specification. If the CTEspecification is relaxed, the resulting mean values will have a boarder variation because nospecial material selection or other measures are necessary to fulfill the specification. In manycases the batches used may have different production histories. This means that part of themirror blanks may be from a new melt campaign while the other part of the mirror blanks areproduced from batches on stock with different mean value. By using defined casting formatsand special ceramization setups, the reproducibility of the ZERODUR@ manufacturing can befurther improved to keep a tighter mean CTE distribution on request. For example most of theGTC mirror blanks have been exclusively produced out of special hexagonal shaped molds ina continuous sequence of melting campaigns. Mean CTE values of single blanks in 10K1 Figure 8: Frequency distribution of the mean CTE values of single blanks Figure 8 shows that most mean CTE values are slightly negative. The reason is that anegative mean CTE permits a possible future adjustment of the mean CTE using an additionalannealing process, which in any case leads to more positive CTE values. With the additionalannealing process, the mean CTE can be increased to adjust the mean CTE and furtherminimize the distribution at the expense of an increase in production time. DATE August 2006BPAGE 9/19 5. Homogeneity of CTE The homogeneity of CTE, the total variation of CTE values inside a specific batch, can beguaranteed in the following weight classes for each part, provided the diameter of the part is atleast twice its thickness [13]. up to 18.0 tons ≤0.03*10K-1 up to 6.0 tons ≤0.02*10K-1 up to 0.3 tons ≤0.01*10K Table 4: Homogeneity of ZERODUR depending on the weight according catalog [13] The latest data evaluations and one of the most extensive homogeneity measurement evermade on a single ZERODURmirror blank with 1554 mm diameter clearly show the excellenthomogeneity of ZERODUR. The results fit the expectations that 95% of the standardZERODUR mirror blanks in the 1 to 2 m class exhibit a homogeneity even less then +0.010*10K1. At 1300 mm diameter, a homogeneity quality of less then 0.004*10*K-could beverified with the improved dilatometer measurement setup [14]. 5.1 Statistical Homogeneity Evaluation For future extremely large telescopes, with more than 3000 segmented mirror blanks, thereproducibility of the homogeneity from blank to blank is an important issue. Figures 9-11show homogeneity evaluations of all segmented ZERODUR mirror blank projects up to now(measured with the standard accuracy dilatometer). Figure 9 shows the frequency distribution of the total variation of CTE values for HET(~115 kg/blank), Keck and GTC mirror blanks (~550 kg/blank). The HET data has the smallesttotal variation. Even if the maximum CTE variation of the GTC blanks is nearly the same asthat for the Keck blanks, it seems that the GTC values are significantly better. In general the distribution of the GTC values shows that ~60% of all total variations are betterthan 0.01*10K’(valid also for about 85% of the HET values - which are much smaller)whereas this is only valid for 22% of the Keck mirrors. DATE August 2006BPAGE 10/19 Total variation of CTE (range) within single blanks in 10 K Figure 9: Frequency distribution of the total variation of CTE within single blanks Axial gradients of CTE within single blanks in 10K Figure 10: Frequency distribution of the axial gradients of CTE within single blanks DATE August 2006B PAGE 11/19 Figure 10 shows the axial gradient distribution of the mirror blanks. The maximum value for allmirror blanks is smaller than 0.01*10K1. Most values are even below the reproducibility ofthe standard dilatometer measurement (±0.005*10K). To get an overall impression of the general CTE homogeneity of ZERODUR it is helpful totake the single measurements and normalize them to the mean values. Therefore the meanvalue of each mirror blank has been subtracted from the single measurements of this blank.These values can be displayed together for all mirror blanks of all projects in a singlefrequency diagram (figure 11). After fitting a Gaussian distribution to the data set it is apparent that 95.5% (2*standarddeviation) of all measurements are within ± 0.007*10Kdeviation from the mean value. Inaddition, the repeatability of the measurement (95.5%) is displayed in the diagram. Therepeatability is only slightly lower than the double standard deviation. The complete curve is aconvolution of the repeatability distribution of the standard dilatometer and the real distributionreflecting the measurement homogeneity. As a first approximation the 2*standard deviation ofthe de-convoluted real distribution without reproducibility effects is ±0.005*10K. This shows that the homogeneity results so far are better than that reflected by themeasurement due to the influence of the measurement repeatability of the dilatometermeasurement system on the data. CTE deviation from mean value [10*K'] Figure 11: Homogeneity of the CTE: combined data from all mirror blanks of all projects. DATE August 2006B PAGE 12/19 5.2 Homogeneity of CTE in a single blank Extensive measurements of the homogeneity inside a single mirror blank of ZERODUR havebeen done for the four 8 m diameter VLT mirror blanks with the standard accuracy dilatometersetup. In total, 122 samples have been placed uniformly distributed on 5 circles of differentradii on top and below the single mirror blank. Figure 12 shows the sampling plan of the mirrorand a summary of the results for each of the 4 VLT mirror blank [6]. The single measurements are randomly distributed (no significant radial, angular or axialdependency observable) with a mean homogeneity in the range of ~0.02*10Kpeak tovalley. Detailed results can be found in [6]. CTE (0C,50°℃)10K11 meanvalue homogeneity(peak to valley) Specification 0+/-0.15 0.05 Mirror 1 -0.043 0.009 Mirror 2 -0.032 0.011 Mirror 3 -0.040 0.024 Mirror 4 -0.017 0.028 Figure 12: Sampling plan and results of the homogeneity for the 8 m VLT mirror blanks [6] The homogeneity measurement results in the past were mainly limited by the reproducibility ofthe dilatometer measurement as shown in chapter 5.1. To overcome this problem, adilatometer measurement setuppwith improved repeatability (chapter 2.2)has beenconstructed. This new setup has been applied to the CTE homogeneity measurement of 111samples taken from a randomly selected striae free standard circular ZERODUR@ blank withdiameter 1554 mm and 345 mm thickness [14]. Figure 13 shows a 2D color plot of the CTE deviations from the mean value of allmeasurements. The CTE values are displayed in ppb/K units (1 ppb/K= 0.001*10K-1).GTFPositive deviations in the diagram refer to larger CTE values as compared to the mean value.The total peak to valley homogeneity of the blank is ±0.0064*10K1 (The 2*standarddeviation is ±0.003*10K1). The results show that for 70% of the ZERODUR blanks, thepeak to valley variation is less than ±0.004*10Krepresenting a final mirror blank diameterof 1.3 m. DATE August 2006BPAGE 13/19 Figure 13: Two-dimensional variation of the CTE deviations from the mean value over thehorizontal cut section [14] Table 5 shows a summary of the results including the mean value over all measurements andaxial gradient based on a final blank thickness of 70 mm. The axial gradient measurementresults are in good agreement with the results shown in figure 10. *106K11 Mean CTE (0°C, 50°℃) 0.042 Homogeneity (peak to valley) total 0.0064 2*standard deviation (95%) ±0.003 Homogeneity (peak to valley) on 1.3 m 0.004 Axial CTE based on 70 mm thickness 0.0022 (max) Table 5: Overview on the homogeneity measurement results on a single ZERODUR blank [14] DATE August 2006B PAGE 14/19 6. Thermal cycling ZERODUR may be used as a mechanical component as well as a window at temperaturesup to 600℃. Slight changes may arise in the CTE that can affect components of the highestoptical precision, due to temperature treatments by the customer and user. There are three temperature ranges where length stability may be diminished by changes ofexpansion or CTE [7]: 1. T>700℃ (ceramization range)23 130°℃≤T≤320℃ (upper relaxation range) -70°℃≤T≤+40°℃ (lower relaxation range) 6.1 Ceramization range At temperatures above 700°℃ ceramization of the material continues and leads to irreversiblechanges of the dimensional and the material properties; the CTE for all temperature ranges ischanged irreversibly. 6.2 Upper relaxation range Figure 14 shows the limits and the influence of this temperature range on the dimensionalstability. Initially well-annealed samples were quenched from different temperatures in anambient room atmosphere and the CTE (0°℃, 50℃) was measured. Up till temperatures of~130℃, there was no change observed in the CTE (0℃, 50°C). With increased temperatures,the CTE (0°℃, 50°℃) after quenching also increased until a saturation value is achieved at320°C. Figure 14: Variation of the coefficient of thermal expansion CTE (0℃; 50°℃) - first cooling at0.1 K/min- as a function of the initial temperature of a secondary cooling in open air to roomtemperature [7]. DATE August 2006B PAGE 15/19 Different cooling rates influence the final value of CTE (0℃; 50℃) when cooling starts fromthe same temperature. If the final cooling rate Re differs from the initial cooling rate Re(ZERODUR@ is typically cooled during production at an initial cooling rate between 1 K/h and6 K/h), the change of the CTE (0℃; 50℃) starting from 320℃ can be estimated by using thefollowing equation: The CTE value changes with temperature cycles in the range between 130° and 320℃, sodoes the sample length at room temperature. Fast cooling in general leadsiven example 30 K/h fast cof 300 to a greater length.In the g°G tooling from a temperature of 300℃ to room temperatureleads to a relative elongation Al/l of 14*10 for a sample which has originally been annealedwith a rate of 1 K/h [7]. Thermal cycling in the upper relaxation range leads to permanent changes of CTE and relativelength at room temperature. These effects are reversible as soon as the sample is heated upto above 320°C and cooled down with the initial cooling rate of the ceramization process. For most mirror applications ZERODURis exposed to elevated temperatures during coating.These processes are short in time and only a layer with small thickness really sees these hightemperatures. Such processes have only negligible effect on the surface figures as experiencedemonstrates. 6.3 Lower relaxation range Thermal cycles in the lower relaxation range lead to hysteresis shapes of theAI/l(T) curve asshown in figure 15. The vertical opening of this hysteresis is of the order of Al/l= 10. Like theeffects of the upper relaxation range these effects are also strictly reversible. However,whereas the effects of the upper relaxation range are stable at room temperature, those in thelower range relax in a relatively short time even at rather low temperatures. Temperature/℃ Figure 15: Hysteresis in the course of relative length change Al/I during a thermal cyclingprocess of ZERODUR, temperature rate= 1.25 K/min [7] 6.4 Isothermal long-term stability The length of a 400 mm long ZERODUR bar was examined at a constant temperature of20°℃ at the PTB Braunschweig from September 1973 for about 10 years [8]. Over a longperiod of time, ZERODUR shows a continuous, monotone decrease in length (often referredto as aging). The slope of the decrease in length depends on the age of the sample after thelast thermal treatment and the thermal treatment itself. A slow cooling after thermal treatmentdecreases the slope (the sample appears older). A second thermal treatment will start the aging process anew. In general it can be said that theisothermal long-term stability of ZERODURis affected by the thermal cycling of the materialbut on a much longer time scale. New investigations on the relaxation and isothermal long-term stability effects show that botheffects can be described using the same mathematical model. This mathematical model isable to predict the relaxation behavior of a given ZERODUR material under given thermalcycling conditions. This complete knowledge in the thermal expansion behavior of ZERODUReven for small temperature changes is necessary especially for future EUVL applications. DATE August2006B PAGE 17/19 7. Cryogenic behavior of ZERODUR At SCHOTT the cryogenic measurement of the thermal expansion is limited to temperatures of~180℃ (93 K). Therefore the description of the cryogenic behavior of ZERODUR is based onknown publications by other institutes [10, 11, 12]. Figure 16 shows the CTE of ZERODUR, glassy ZERODUR and 3 other materials in thetemperature range of 10 to 300 K [11]. At low temperatures ZERODUR normally expandsupon cooling. Figure 16: CTE of different materials with at temperatures between 10 and 300 K [11] Burge, Peper and Jacobs observed a maximum CTE of -0.4*10K- at ~20 K. They alsoobserved some slight relaxation effects between 20 and 30 K amounting to 0.6*10Krelativelength change. One important question customers often ask is how stable ZERODUR remains undercryogenic temperatures and temperature changes especially for the use as high precisionastronomical mirror substrates under cryogenic conditions in space. J. W. Baer and W.P. Lotzobserved mirror shape deviations of 300 mm diameter under temperature changes from roomtemperature to 130 K [12]. They found no significant distortion on two parabolic mirrors. Thesemirrors remained at or below 0.035 waves RMS figure irregularity over the 170 K cool-downfrom room to operational temperature. DATE August 2006B PAGE 18/19 8. Literature [1] Hans Bach Ed.:,,Low Thermal Expansion Glass Ceramics", Springer-Verlag, 1995 [2] Plummer, W:A: and Hagy, H.E. “Precision Thermal Expansion measurements on LowExpansion Optical Materials”, Applied Optics, Vol. 7, No. 5, p.825-831, 1968 [3] R. Mueller, K. Erb, R. Haug, A. Klaas, O. Lindig, G. Wetzig:,,Ultraprecision DilatometerSystem for Thermal Expansion measurements on Low Expansion Glasses", 12" ThermalExpansion Symposium, Pittsburgh/PA, P.S. Gaal and D.E. Apostolescu eds., 1997 [4] Ina Mitra, Jochen Alkemper, Rolf Muller, Uwe Nolte, Axel Engel, Hrabanus Hack, HeikoKohlmann, Volker Wittmer, Wolfgang Pannhorst, Mark J. Davis, Lutz Aschke, Konrad Knapp:Optimized Glass-ceramic Substrate Materials for EUVL Applications; Proc. SPIE 5374,Emerging Lithographic Technologies VIII (2004) [5] Ralf Jedamzik, Thorsten Doehring, Rolf Mueller, Peter Hartmann:“Homogeneity of thecoefficient of linear thermal expansion of ZERODUR@n, Proc. SPIE Vol. 5868, p. 241-251,Optical Materials and Structures Technologies II (2005) [6] Peter Hartmann, Hans F. Morian, 100 Years of Mirror Blanks from, in Second Workshop onExtremely Large Telescopes, Proc. Backaskog workshop on ELT [7] Otto Lindig, Wolfgang Pannhorst:“Thermal expansion and length stability of ZERODUR independence on temperature and time", Applied Optics, Vol. 24, No. 20, p. 2330-3334, 1985 [8] F. Bayer-Helms, H. Darnedde, G. Exner:,,Langenstabilitat bei Raumtemperatur von Probender Glaskeramik ZERODUR@, Metrologia 21, p. 49-57, 1985 [9] R. Haug, A. Klaas, W. Pannhorst, E. Rodek: ,,Length variation in ZERODUR M in thetemperature range from -60℃ to +100℃", Applied Optics, Vol.28, No. 19, 1989 [10] R. B. Roberts, R. J. Tainish, G. K. White:“Thermal properties of ZERODURat lowtemperature”, Cryogenics 22, p. 566, November 1982 [11] J. H. Burge, T. Peper, S.F. Jacobs:“Thermal expansion of Borosilicate glass,ZERODUR, ZERODURM, and unceramized ZERODUR at low temperatures”, AppliedOptics, Vol.38, p. 7161, 1999 [12] J. W. Baer, W. P. Lotz: “Figure testing of 300 mm ZERODURmirrors at cryogenictemperatures”, Cryogenic Optical Systems and Instruments IX, Proc. of SPIE Vol. 4822, 2002 [13] SCHOTT ZERODUR glass ceramic catalogue 10162 e 09043.0 [14] Ralf Jedamzik, Rolf Muller, Peter Hartmann, Homogeneity of the linear thermal expansioncoefficient of ZERODURmeasured with improved accuracy, Proc. SPIE Vol. 6273, (2006) DATE August 2006BPAGE 19/19 For more information please contact: Advanced Optics SCHOTT AG GermanyPhone:+49 (0)6131/66-1812 Fax: +49 (0) 3641/2888-9047 E-mail:info.optics@schott.com www.schott.com/advanced_optics glass made of ideas SCHOTTglass made of ideasTIE- Thermal expansion of ZERODUR
确定

还剩17页未读,是否继续阅读?

产品配置单
上海依阳实业有限公司为您提供《肖特公司ZERODUR材料热膨胀系数》,该方案主要用于陶瓷中检测,参考标准--,《肖特公司ZERODUR材料热膨胀系数》用到的仪器有激光干涉法热膨胀测试系统
推荐专场

相关方案
更多
该厂商其他方案
更多