


方案详情
文
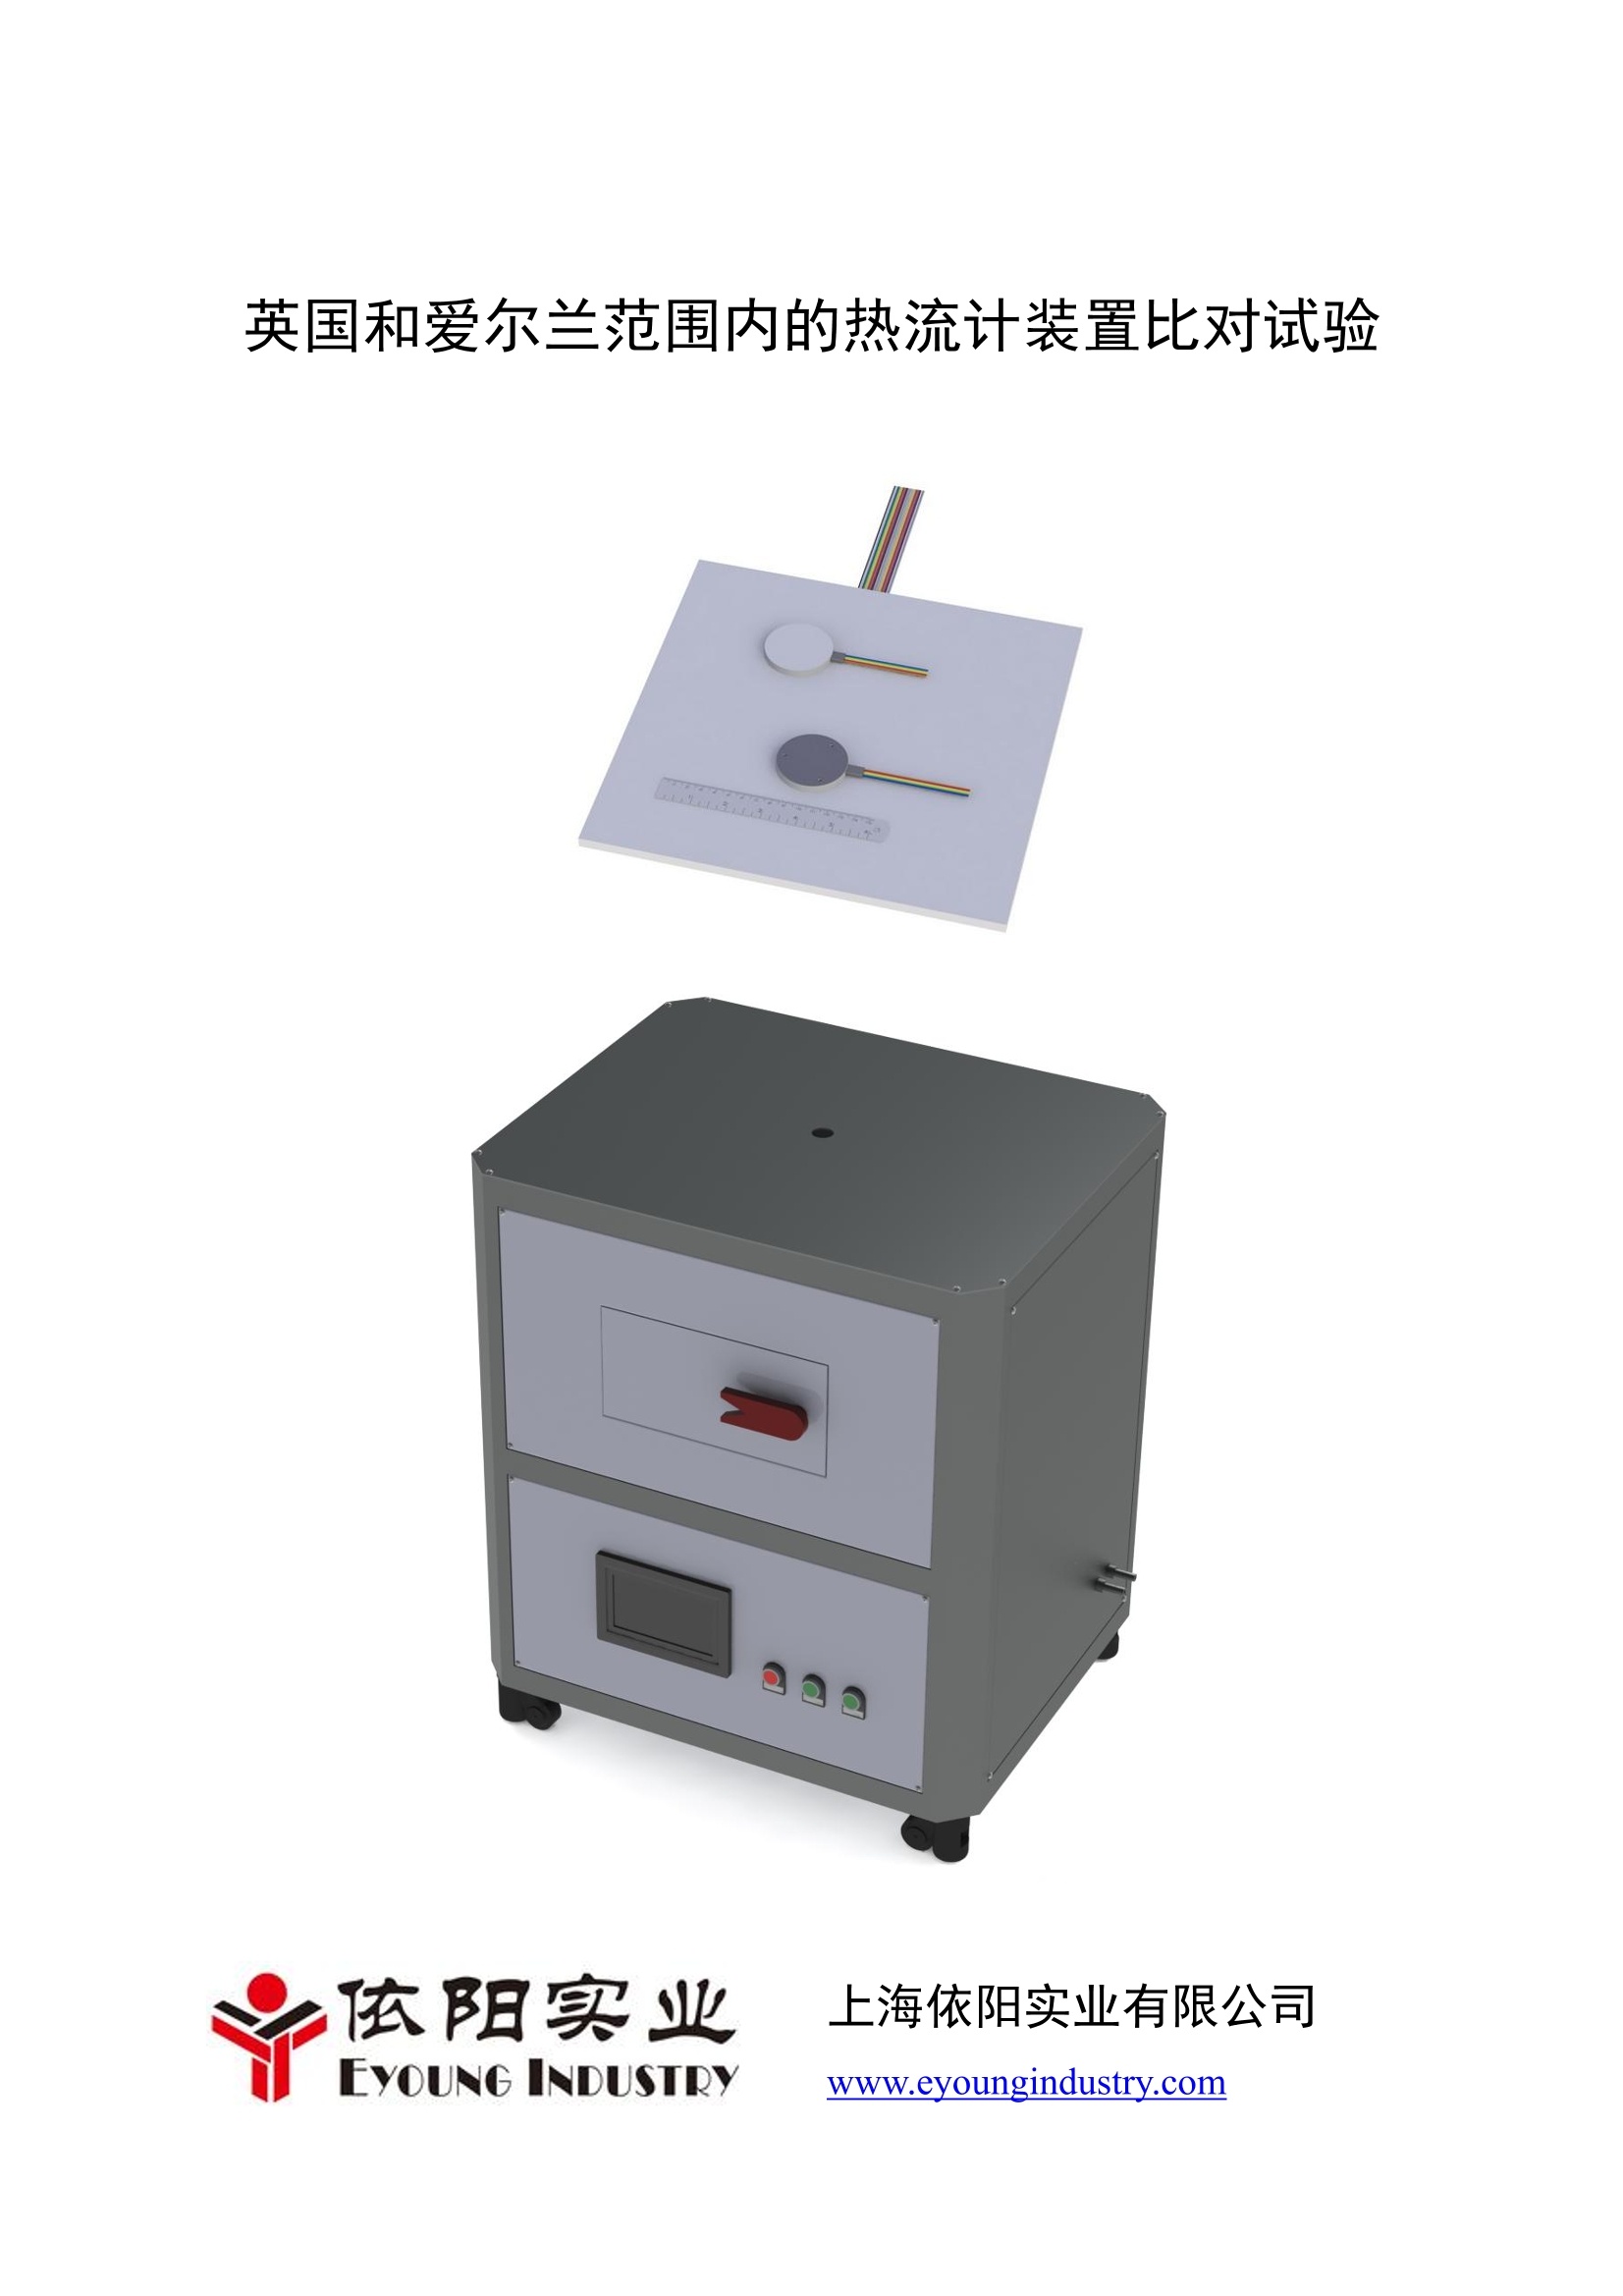
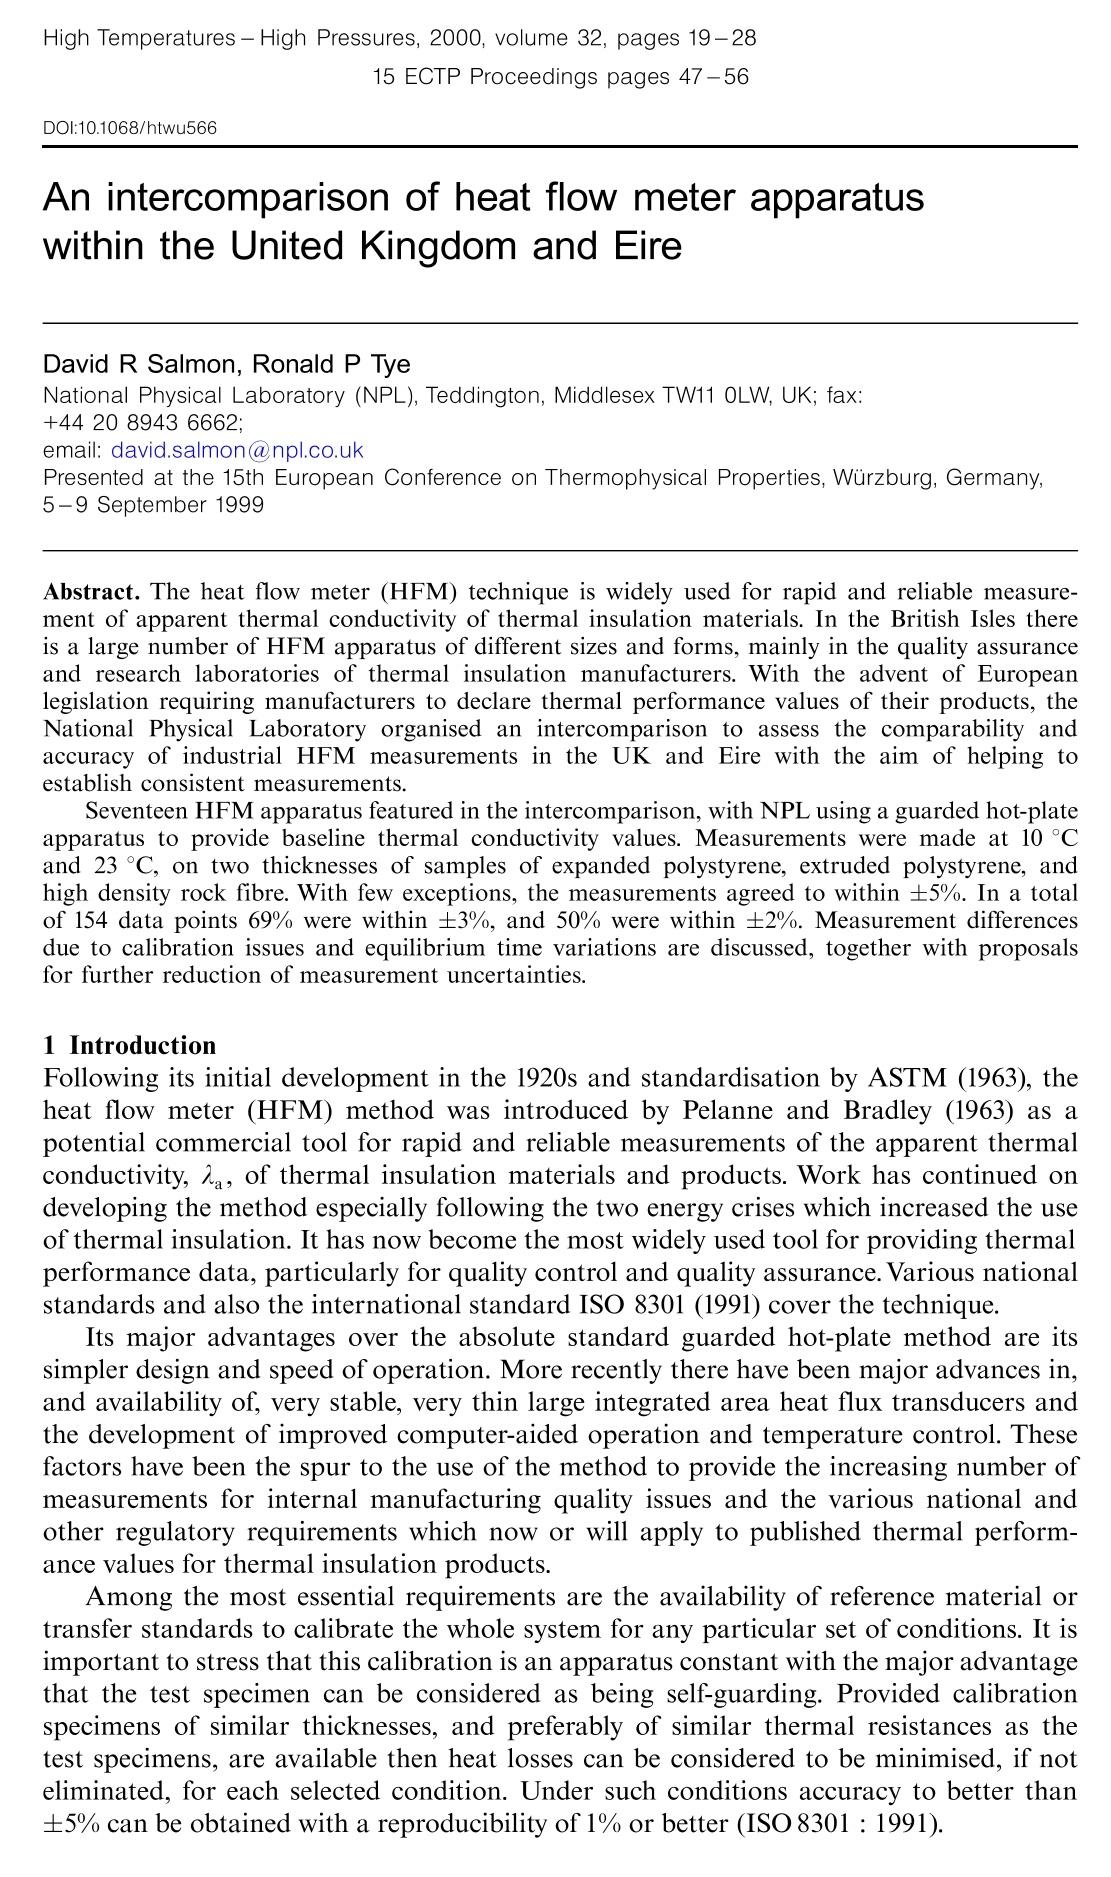
热流计(heat flow meter—HFM)技术在防隔热材料的表观导热系数快速和可靠测量中应用十分广泛,在英国和爱尔兰有着大量不同尺寸和形式的热流计,这些热流计多数归属于防隔热材料生产商的质量保证部门和研究实验室。随着欧洲法律要求生产厂商公布产品的热性能数值,英国国家物理实验室(NPL)为此在英国和爱尔兰范围内组织了一次比对试验以评估工业用热流计测量的可比性和准确性,目的是帮助建立测量的一致性。
在此次比对试验中,共评定了17个热流计装置,评定装置采用了保护热板法测量装置以提供导热系数数值基线。在10℃和23℃温度下,采用了发泡聚苯乙烯、挤塑聚苯乙烯和高密度岩石纤维板三种材料各两种厚度试样进行了评定测量。除了少数例外,大多数测量结果都在±5%偏差范围内。在总共154个数据点中,69%的数据点位于±3%偏差范围内,50%的数据点位于±2%偏差范围内。由于校准原因和平衡时间变化所带来的测量偏差本文进行了讨论,并对今后进一步降低测量不确定给出了建议。
方案详情

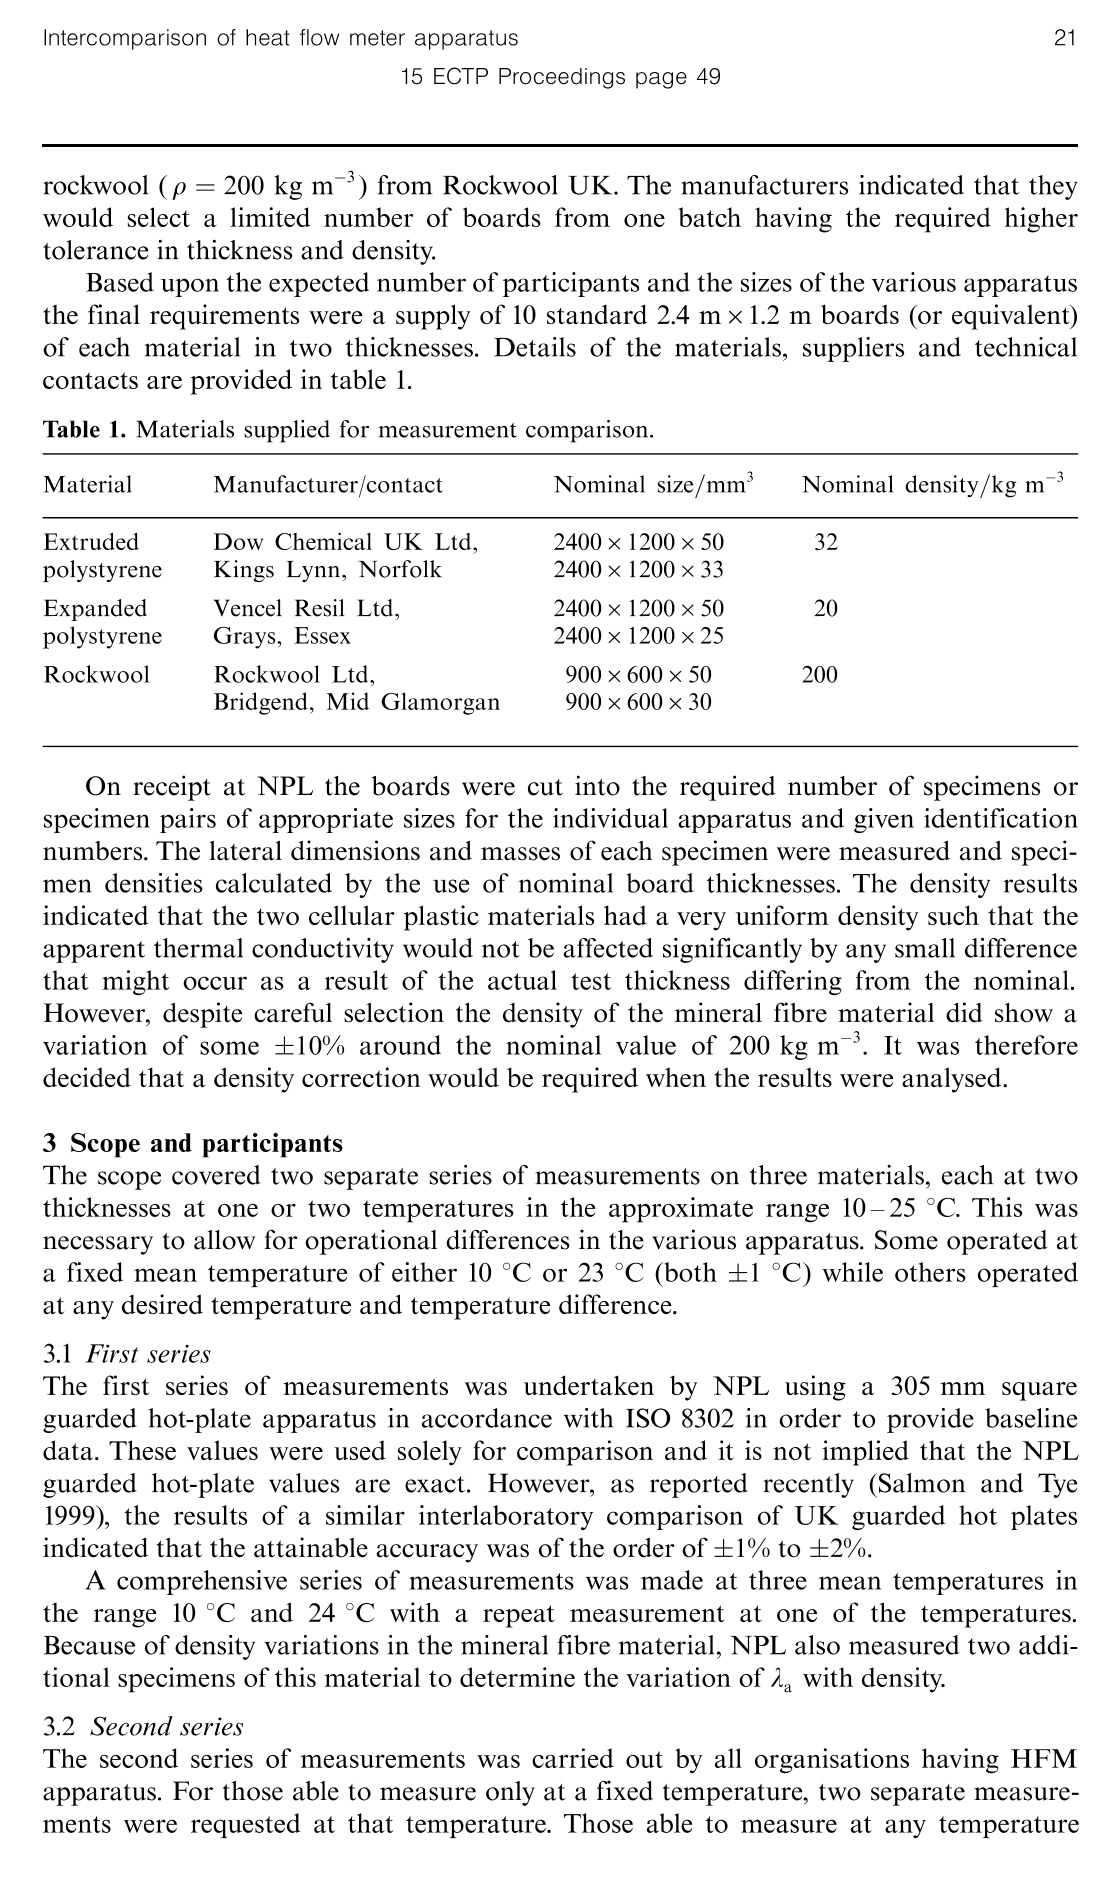
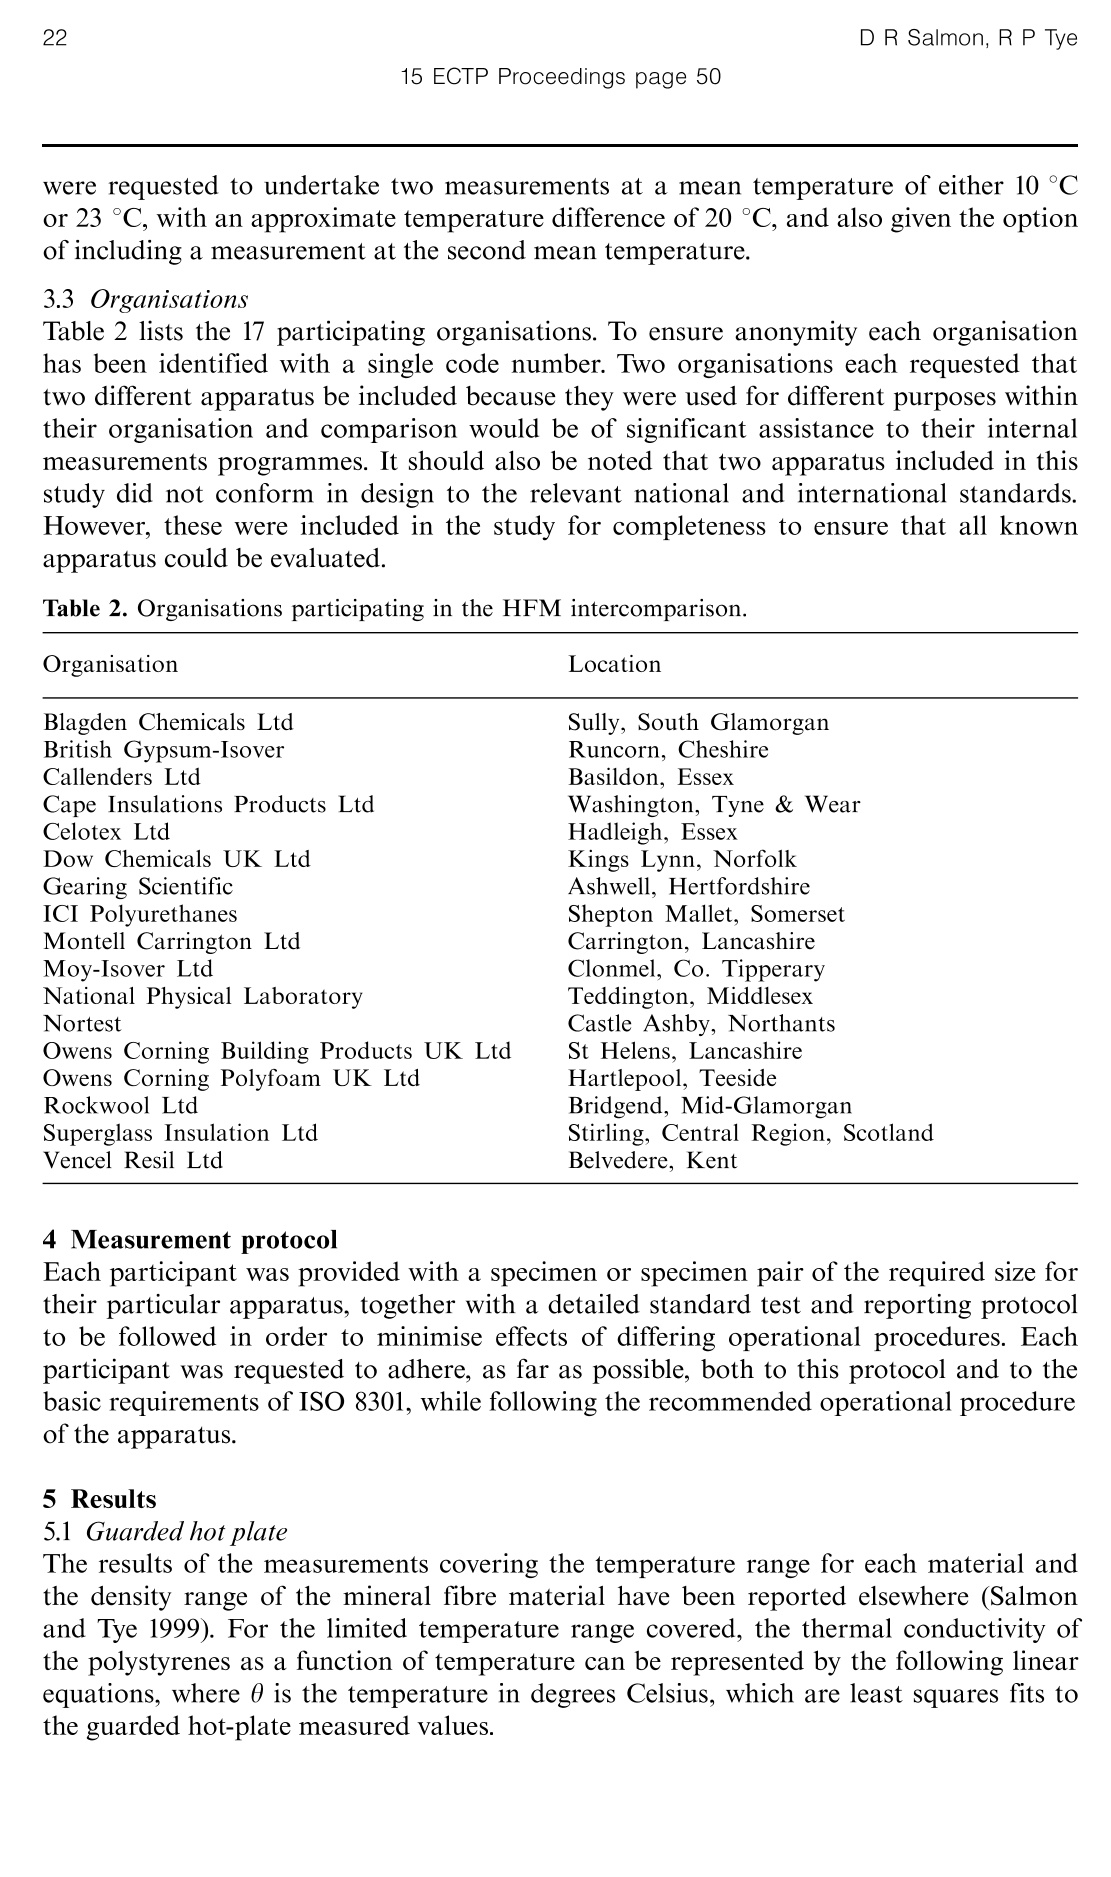
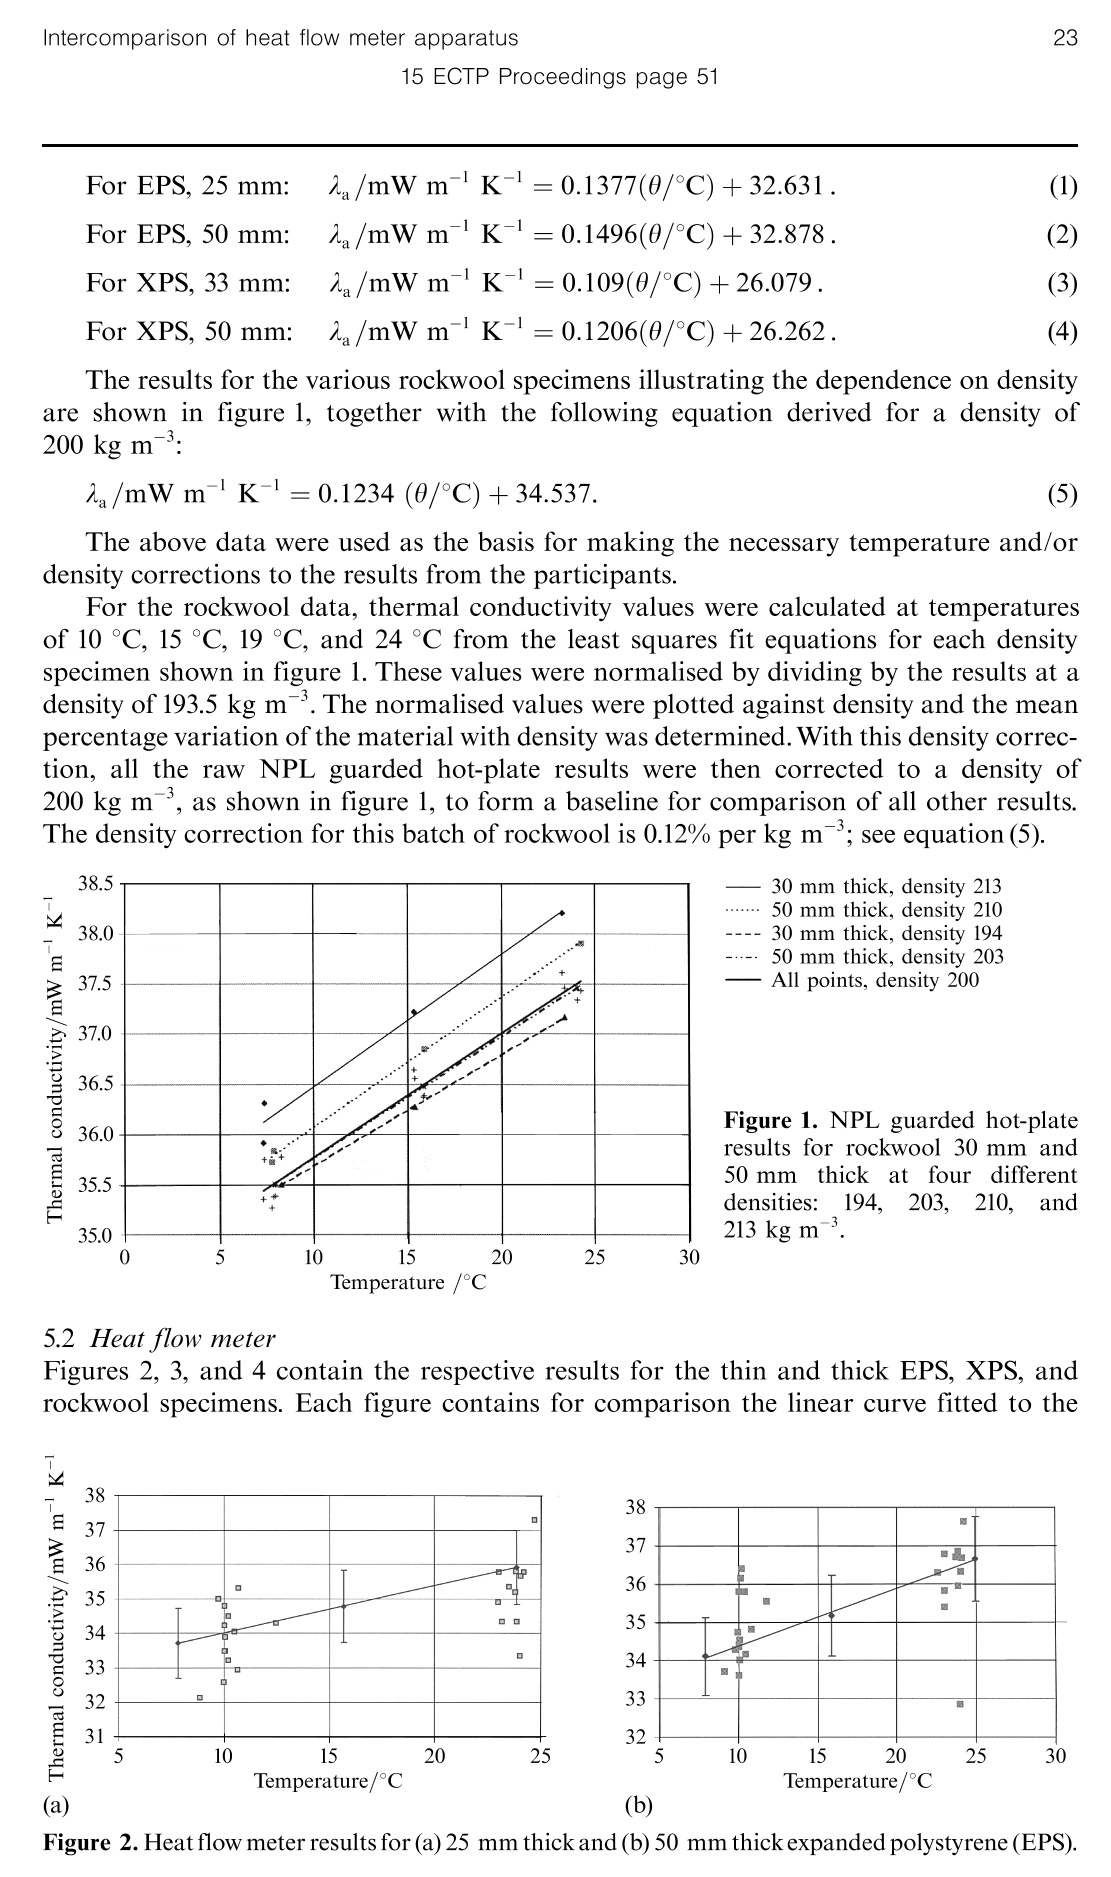
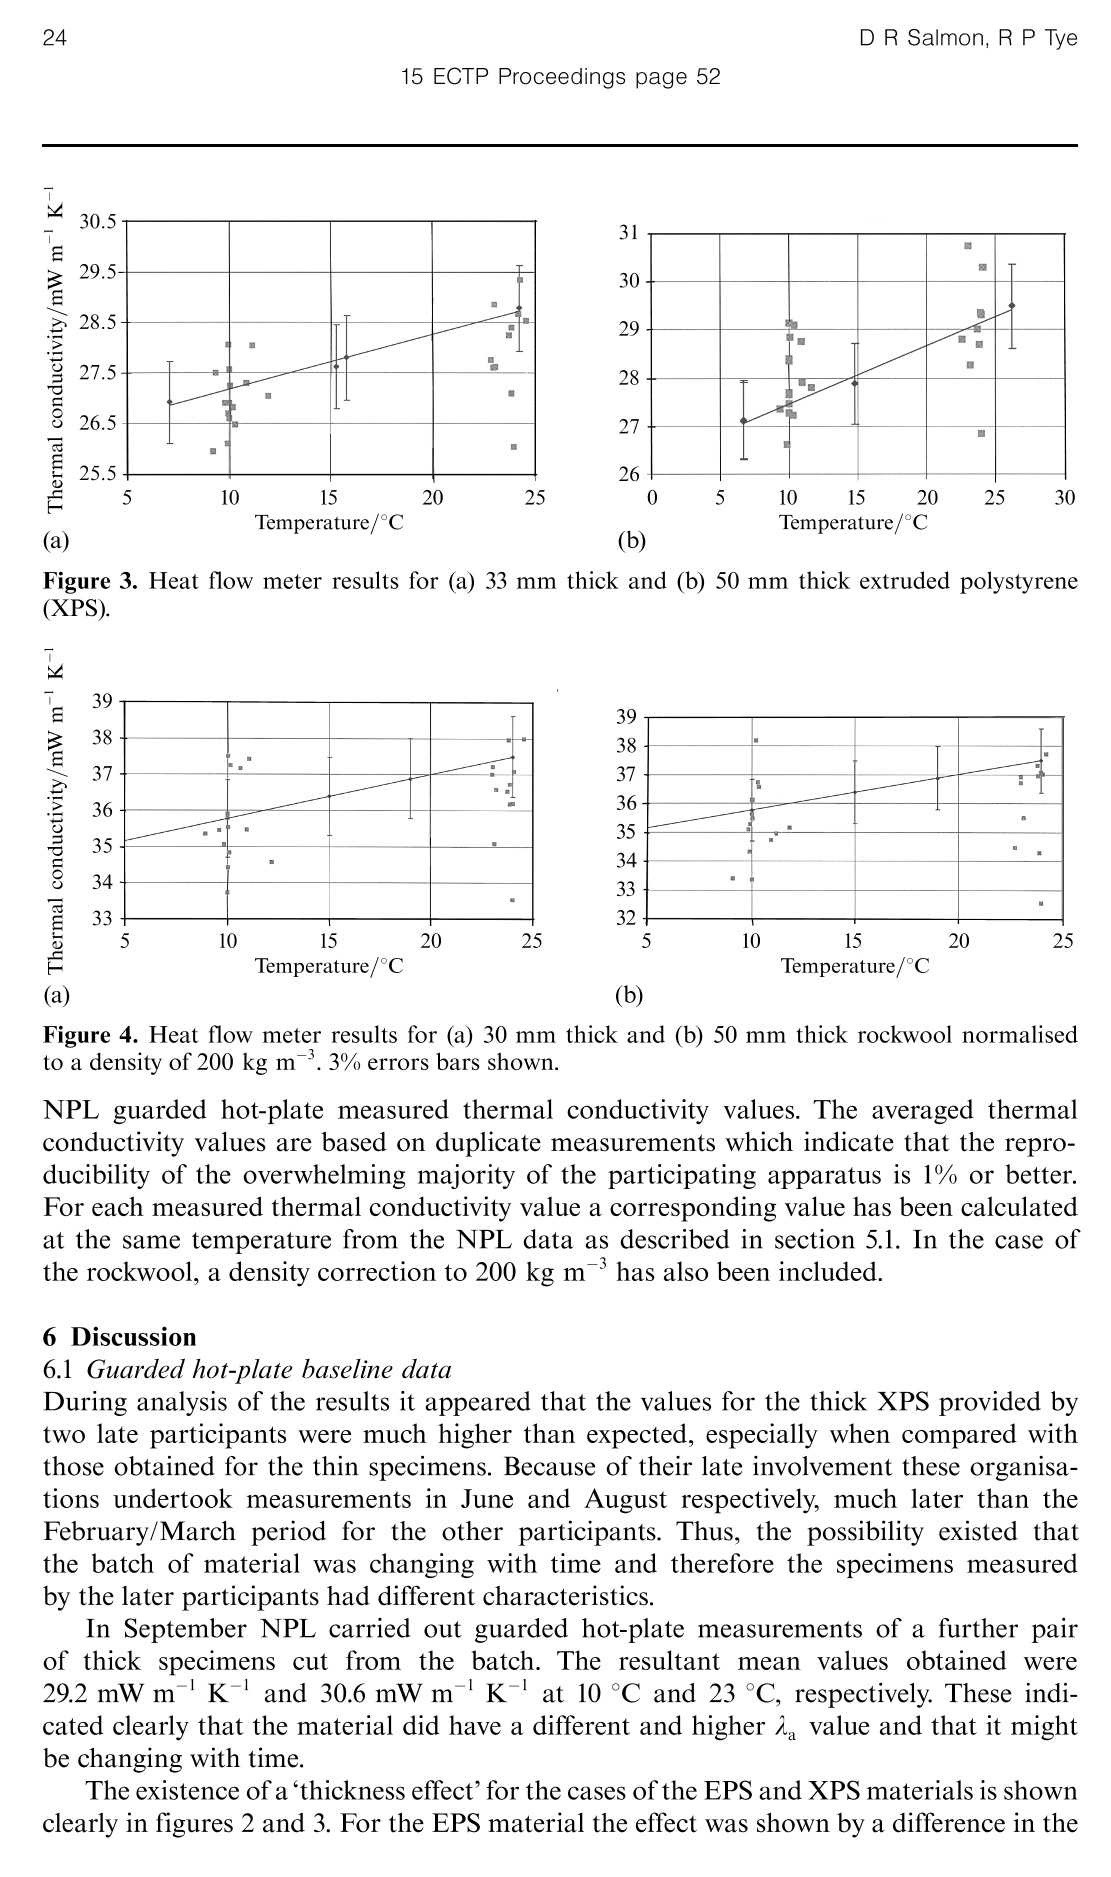
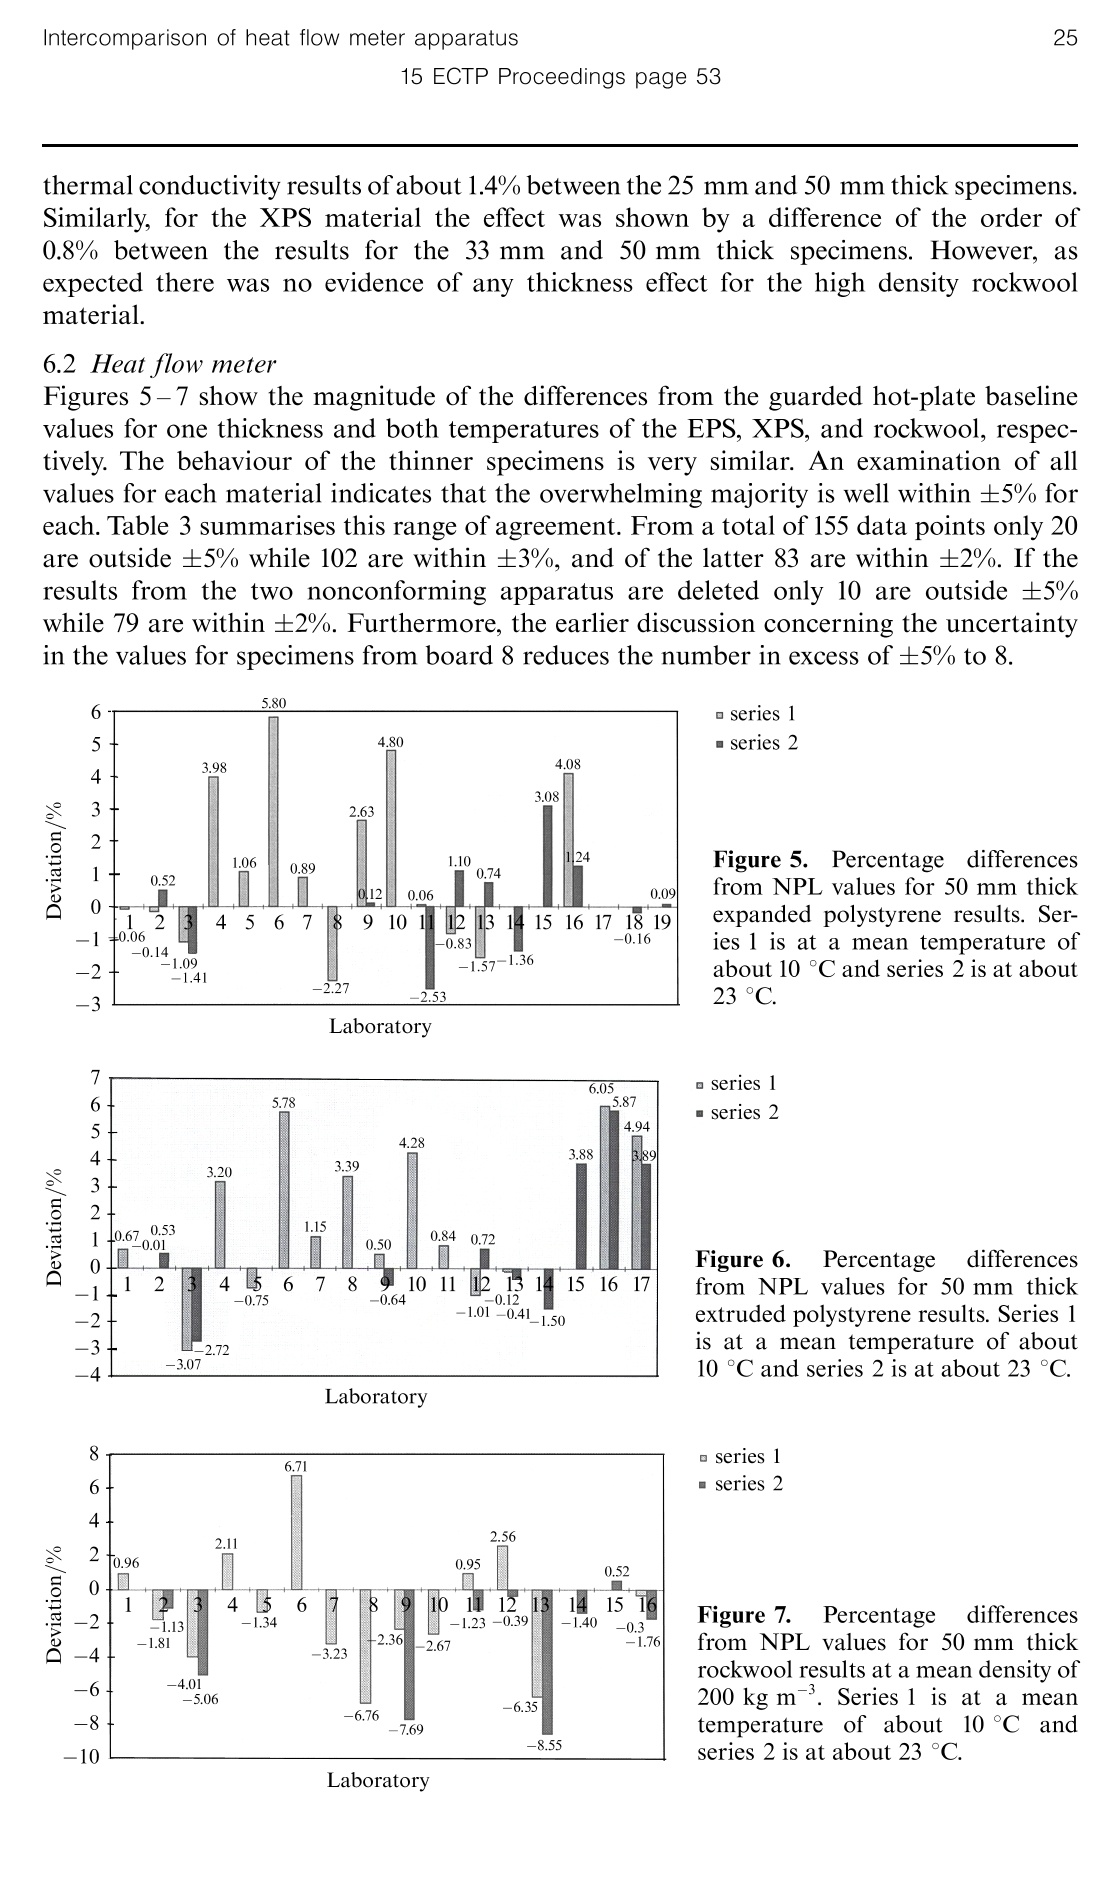
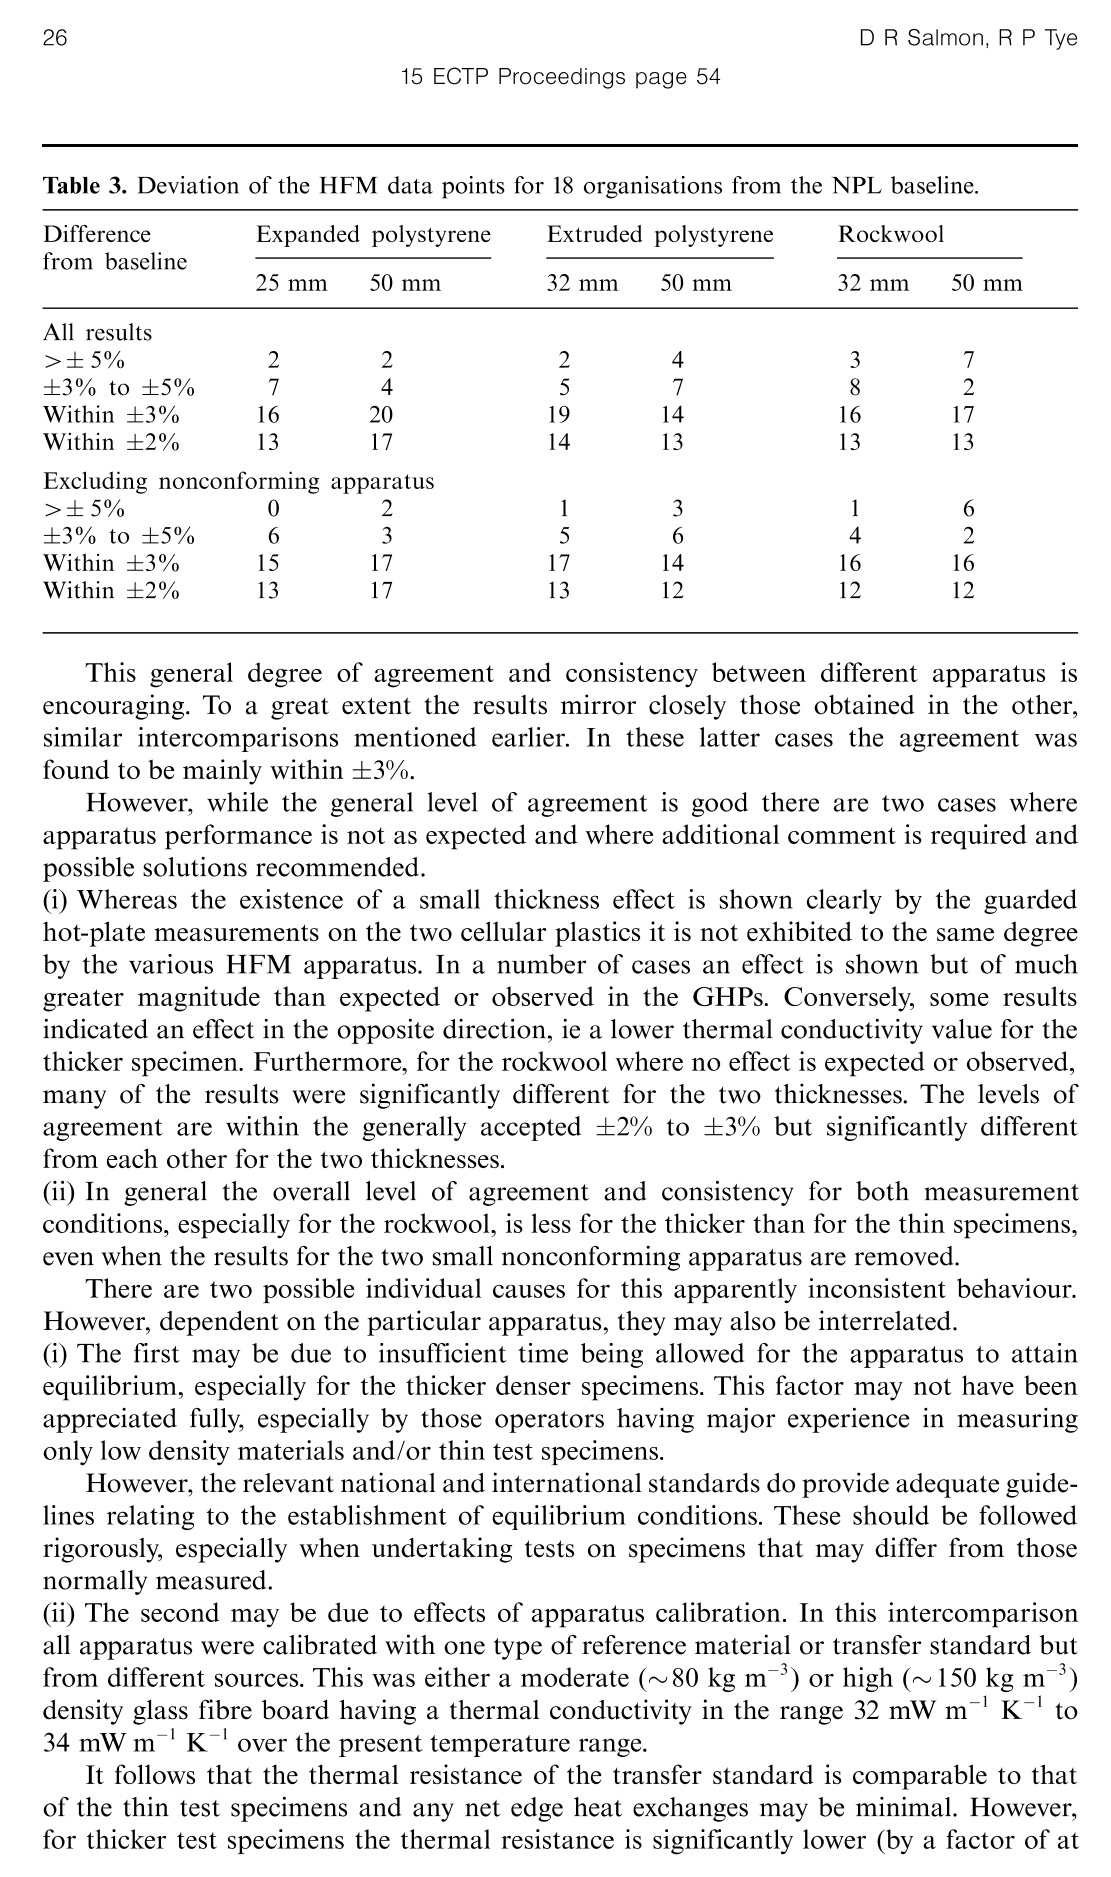
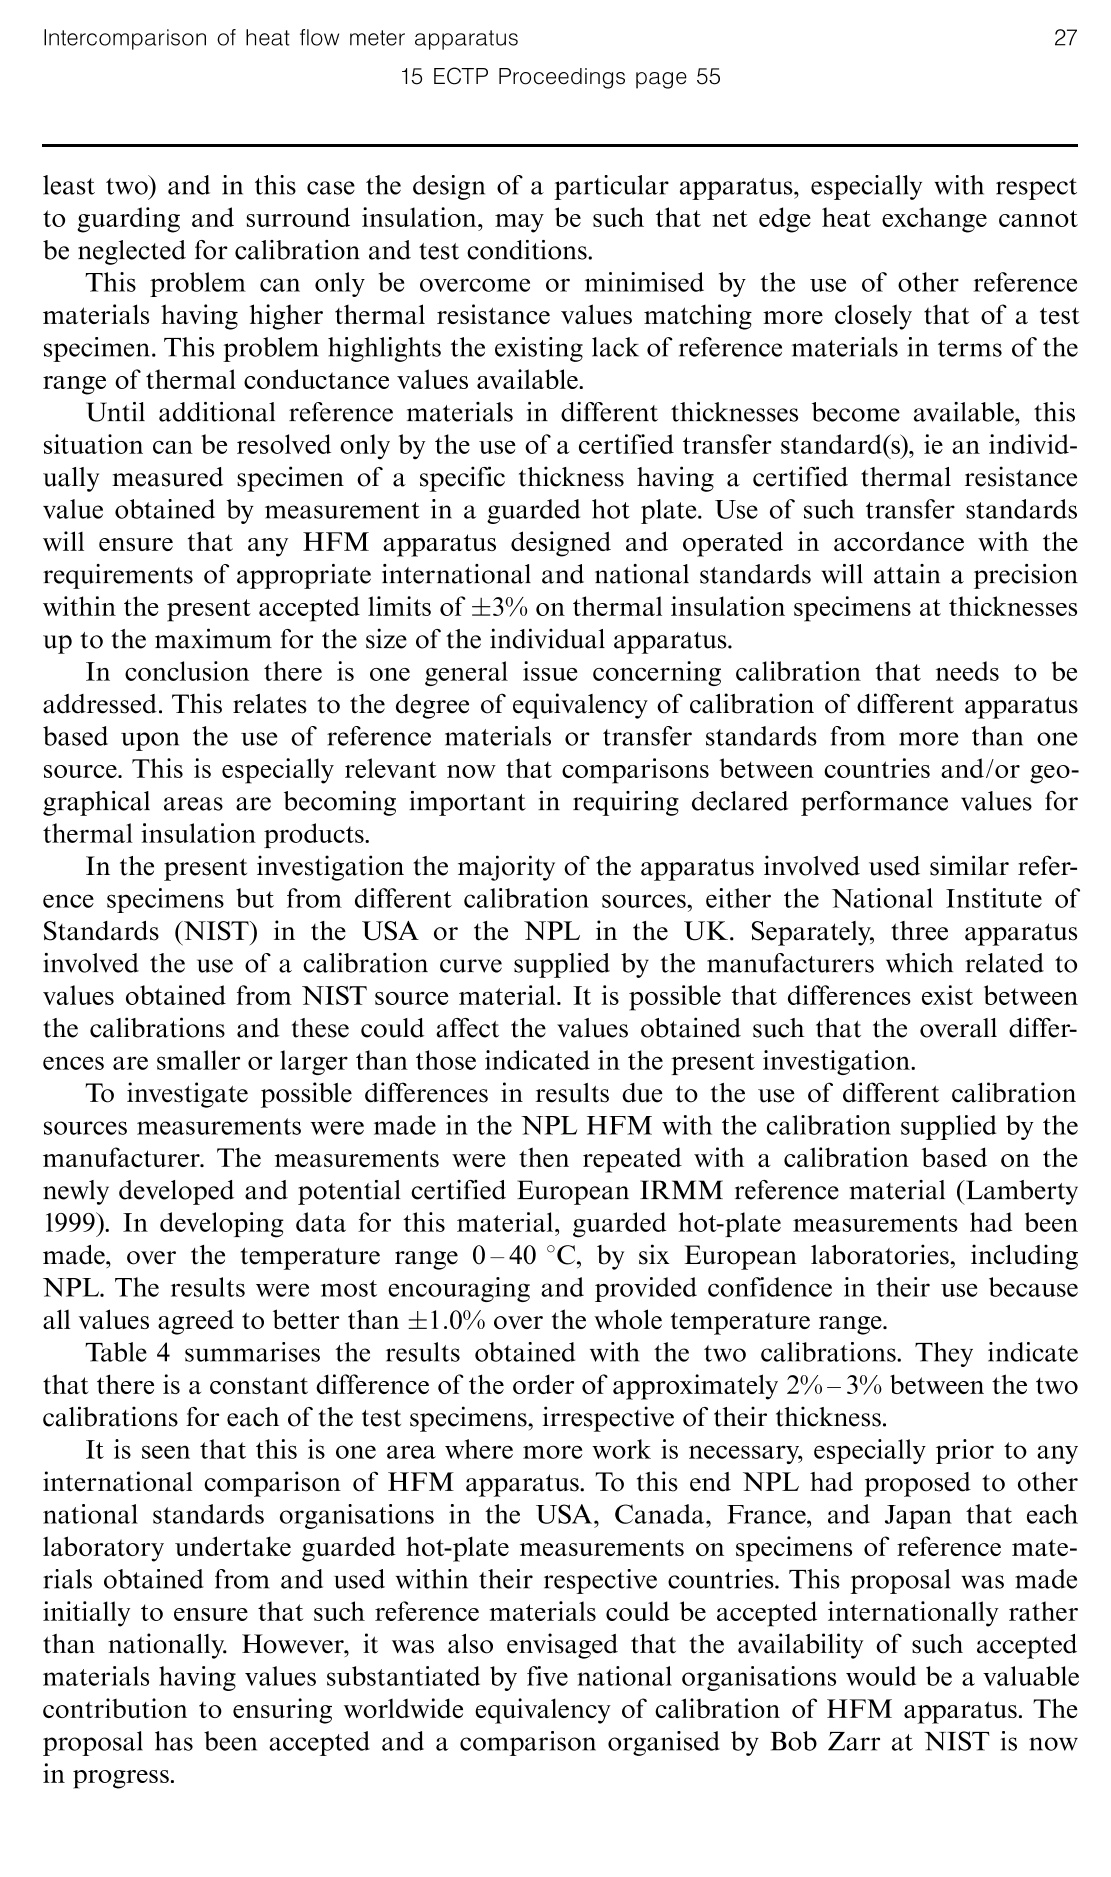
High Temperatures- High Pressures, 2000, volume 32, pages 19-2815 ECTP Proceedings pages 47-56DOI:10.1068/htwu566 20D R Salmon, R PTye15 ECTP Proceedings page 48 C 2000 a Pion publication printed in Great Britain 英国和爱尔兰范围内的热流计装置比对试验 上海依阳实业有限公司 www.eyoungindustry.com An intercomparison of heat flow meter apparatuswithin the United Kingdom and Eire David R Salmon, Ronald P Tye Presented at the 15th European Conference on Thermophysical Properties, Wurzburg, Germany,5-9 September 1999 Abstract. The heat flow meter (HFM) technique is widely used for rapid and reliable measure-ment of apparent thermal conductivity of thermal insulation materials. In the British Isles thereis a large number of HFM apparatus of different sizes and forms, mainly in the quality assuranceand research laboratories of thermal insulation manufacturers. With the advent of Europeanlegislation requiring manufacturers to declare thermal performance values of their products, theNational Physical Laboratory organised an intercomparison to assess the comparability andaccuracy of industrial HFM measurements in the UK and Eire with the aim of helping toestablish consistent measurements. Seventeen HFM apparatus featured in the intercomparison, with NPL using a guarded hot-plateapparatus to provide baseline thermal conductivity values. Measurements were made at 10 Cand 23°C, on two thicknesses of samples of expanded polystyrene, extruded polystyrene, andhigh density rock fibre. With few exceptions, the measurements agreed to within ±5%. In a totalof 154 data points 69% were within ±3%, and 50% were within ±2%. Measurement differencesdue to calibration issues and equilibrium time variations are discussed, together with proposalsfor further reduction of measurement uncertainties. 1 Introduction Following its initial development in the 1920s and standardisation by ASTM (1963), theheat flow meter (HFM) method was introduced by Pelanne and Bradley (1963) as apotential commercial tool for rapid and reliable measurements of the apparent thermalconductivity, Aa, of thermal insulation materials and products. Work has continued ondeveloping the method especially following the two energy crises which increased the useof thermal insulation. It has now become the most widely used tool for providing thermalperformance data, particularly for quality control and quality assurance. Various nationalstandards and also the international standard ISO 8301 (1991) cover the technique. Its major advantages over the absolute standard guarded hot-plate method are itssimpler design and speed of operation. More recently there have been major advances in,and availability of, very stable, very thin large integrated area heat flux transducers andthe development of improved computer-aided operation and temperature control. Thesefactors have been the spur to the use of the method to provide the increasing number ofmeasurements for internal manufacturing quality issues and the various national andother regulatory requirements which now or will apply to published thermal perform-ance values for thermal insulation products. Among the most essential requirements are the availability of reference material ortransfer standards to calibrate the whole system for any particular set of conditions. It isimportant to stress that this calibration is an apparatus constant with the major advantagethat the test specimen can be considered as being self-guarding. Provided calibrationspecimens of similar thicknesses, and preferably of similar thermal resistances as thetest specimens,are available then heat losses can be considered to be minimised, if noteliminated, for each selected condition. Under such conditions accuracy to better than±5% can be obtained with a reproducibility of 1% or better (ISO 8301: 1991). At present there are few internationally accepted reference materials available,mainly because of the cost of development and/or measurement. The current referencematerials are, mainly, medium to high density fibrous glass boards or blankets of limitedthicknesses. Most commercial apparatus are reliant on the use of any one of this type ofstandard, certified, or similar traceable reference material at one thickness, or one partic-ular transfer standard. Without extensive performance checks of the apparatus and/ordetailed calculations, there will be uncertainty in the assumption that the accuracy ofany one measurement system is the same for a wide range of materials having differentvalues of Aa and/or specimen thicknesses. There have been examples of interlaboratory comparisons of HFM apparatus carriedout in North America (Hust and Pelanne 1985), Scandinavia (Uvslokk 1995), and mostrecently, France (Quin and Hameury 1997). Overall, it appears that while the generalaccuracy level is within ±5% it is possible to attain ±3% or better, especially when usinglarge apparatus and individually measured thick transfer standards. Currently in the British Isles there are many HFM apparatus of different sizes andforms operating particularly in the quality assurance and research laboratories of thermalinsulation manufacturers. The majority are commercial instruments that operate insemi-automatic'mode with direct read-out of thermal property. They are produced byseveral manufacturers, mostly American, each claiming similar ranges of accuracy andreproducibility for measurements on different products. Because of the above potential differences, there is a need to investigate and assessthe issues of comparability and accuracy. Furthermore, there is forthcoming Europeanlegislation requiring manufacturers to provide declared thermal performance for theirproducts. Thus, there is the added need to establish consistent thermal performancemeasurements within the UK as a prelude to satisfying this legislation. As a result, the National Physical Laboratory (NPL) initiated an intercomparisonbetween organisations in the UK and Eire that use HFM apparatus. The aim was notonly to establish a consistent level of current measurement methodology but also toshow that the results could be of great value to all organisations that intended to improvetheir measurements capability. To this end NPL carried out guarded hot-plate measure-ments in accordance with ISO 8302 to provide baseline values for the exercise. 2 Materials A number of materials and measurement factors were considered prior to the finalchoice. It was decided that the materials should: (i) be different types, readily available, homogeneous, stable and reproducible in thick-ness and mass, and hence density, to acceptably small tolerances; (ii) be representative of those currently used, especially in building construction; (iii) have ranges of apparent thermal conductivity and thickness to cover a range ofthermal resistance: (iv) illustrate the existence of the ‘thickness effect’(or boundary effect) but only to a smallextent (Jones 1972). The density should be low enough in at least one case to ensure thatsmall differences in thermal conductivity with increase in thickness can be measuredand separated from those which are due to apparatus parameters. In addition at leastone material should have a high enough density not to exhibit the effect. As a result three candidate materials were considered as having the required attributesfor the study. These were expanded polystyrene (EPS), having a relatively high density,extruded polystyrene (XPS), and a high density mineral fibre. Discussions were held with established contacts at different manufacturers of theabove product types and three standard commercial products having a good batch repro-ducibility were chosen. These were expanded polystyrene from Vencel Resil (densityp=20 kg m), extruded polystyrene from Dow (p=32 kg m-), and a high density rockwool (p=200 kg m) from Rockwool UK. The manufacturers indicated that theywould select a limited number of boards from one batch having the required highertolerance in thickness and density. Based upon the expected number of participants and the sizes of the various apparatusthe final requirements were a supply of 10 standard 2.4 m×1.2 m boards (or equivalent)of each material in two thicknesses. Details of the materials, suppliers and technicalcontacts are provided in table 1. Table 1. Materials supplied for measurement comparison. Material Manufacturer/contact Nominal size/mm' Nominal density/kg m 、一3 Extruded Dow Chemical UK Ltd. 2400×1200×50 32 polystyrene Kings Lynn, Norfolk 2400×1200×33 Expanded Vencel Resil Ltd. 2400×1200×50 20 polystyrene Grays, Essex 2400×1200×25 Rockwool Rockwool Ltd. 900x600×50 200 Bridgend, Mid Glamorgan 900×600×30 On receipt at NPL the boards were cut into the required number of specimens orspecimen pairs of appropriate sizes for the individual apparatus and given identificationnumbers. The lateral dimensions and masses of each specimen were measured and speci-men densities calculated by the use of nominal board thicknesses. The density resultsindicated that the two cellular plastic materials had a very uniform density such that theapparent thermal conductivity would not be affected significantly by any small differencethat might occur as a result of the actual test thickness differing from the nominal.However, despite careful selection the density of the mineral fibre material did show avariation of some ±10% around the nominal value of 200 kg m-. It was thereforedecided that a density correction would be required when the results were analysed. 3 Scope and participants The scope covered two separate series of measurements on three materials, each at twothicknesses at one or two temperatures in the approximate range 10-25°C. This wasnecessary to allow for operational differences in the various apparatus. Some operated ata fixed mean temperature of either 10 °℃ or 23 °C (both ±1°C) while others operatedat any desired temperature and temperature difference. 3.1 First series The first series of measurements was undertaken by NPL using a 305 mm squareguarded hot-plate apparatus in accordance with ISO 8302 in order to provide baselinedata. These values were used solely for comparison and it is not implied that the NPLguarded hot-plate values are exact. However, as reported recently (Salmon and Tye1999), the results of a similar interlaboratory comparison of UK guarded hot platesindicated that the attainable accuracy was of the order of ±1% to ±2%. A comprehensive series of measurements was made at three mean temperatures inthe range 10℃ and 24°C with a repeat measurement at one of the temperatures.Because of density variations in the mineral fibre material, NPL also measured two addi-tional specimens of this material to determine the variation of aa with density. 3.2 Second series The second series of measurements was carried out by all organisations having HFMapparatus. For those able to measure only at a fixed temperature, two separate measure-ments were requested at that temperature. Those able to measure at any temperature Table 2 lists the 17 participating organisations. To ensure anonymity each organisationhas been identified with a single code number. Two organisations each requested thattwo different apparatus be included because they were used for different purposes withintheir organisation and comparison would be of significant assistance to their internalmeasurements programmes. It should also be noted that two apparatus included in thisstudy did not conform in design to the relevant national and international standards.However, these were included in the study for completeness to ensure that all knownapparatus could be evaluated. were requested to undertake two measurements at a mean temperature of either 10 °Cor 23°C, with an approximate temperature difference of 20 ℃, and also given the optionof including a measurement at the second mean temperature. 3.3 Organisations Table 2. Organisations participating in the HFM intercomparison. Organisation Location Blagden Chemicals Ltd Sully, South Glamorgan British Gypsum-Isover Runcorn, Cheshire Callenders Ltd Basildon. Essex Cape Insulations Products Ltd Washington, Tyne & Wear Celotex Ltd Hadleigh, Essex Dow Chemicals UK Ltd Kings Lynn, Norfolk Gearing Scientific Ashwell, Hertfordshire ICI Polyurethanes Shepton Mallet, Somerset Montell Carrington Ltd Carrington,Lancashire Moy-Isover Ltd Clonmel, Co. Tipperary National Physical Laboratory Teddington, Middlesex Nortest Castle Ashby, Northants Owens Corning Building Products UK Ltd St Helens, Lancashire Owens Corning Polyfoam UK Ltd Hartlepool, Teeside Rockwool Ltd Bridgend, Mid-Glamorgan Superglass Insulation Ltd Stirling, Central Region, Scotland Vencel Resil Ltd Belvedere, Kent 4 Measurement protocol Each participant was provided with a specimen or specimen pair of the required size fortheir particular apparatus, together with a detailed standard test and reporting protocolto be followed in order to minimise effects of differing operational procedures. Eachparticipant was requested to adhere, as far as possible, both to this protocol and to thebasic requirements of ISO 8301, while following the recommended operational procedureof the apparatus. 5 Results 5.1 Guarded hot plate The results of the measurements covering the temperature range for each material andthe density range of the mineral fibre material have been reported elsewhere (Salmonand Tye 1999). For the limited temperature range covered, the thermal conductivity ofthe polystyrenes as a function of temperature can be represented by the following linearequations, where 0 is the temperature in degrees Celsius, which are least squares fits tothe guarded hot-plate measured values. For EPS, 25 mm: Aa/mWm-K-'=0.1377(0/℃)+32.631. For EPS. 50 mm: aa/mW m-'K-=0.1496(0/℃)+32.878. For XPS, 33 mm: 2/mWm-K-=0.109(0/℃)+26.079. (3) The results for the various rockwool specimens illustrating the dependence on densityare shown in figure 1, together with the following equation derived for a density of200 kg m: The above data were used as the basis for making the necessary temperature and/ordensity corrections to the results from the participants. For the rockwool data, thermal conductivity values were calculated at temperaturesof 10 °C, 15°C, 19℃, and 24 °C from the least squares fit equations for each densityspecimen shown in figure 1. These values were normalised by dividing by the results at adensity of 193.5 kg m. The normalised values were plotted against density and the meanpercentage variation of the material with density was determined. With this density correc-tion, all the raw NPL guarded hot-plate results were then corrected to a density of200 kg m, as shown in figure 1, to form a baseline for comparison of all other results.The density correction for this batch of rockwool is 0.12% per kg m-; see equation (5). 30 mm thick, density 213 50 mm thick, density 210一- 30 mm thick, density 194 50 mm thick, density 203 All points, density 200 Figure 1. NPL guarded hot-plateresults for rockwool 30 mm and50 mm thick at four differentdensities: 194, 203, 210,,213 kgm . 5.2 Heat flow meter Figures 2, 3, and 4 contain the respective results for the thin and thick EPS, XPS, androckwool specimens. Each figure contains for comparison the linear curve fitted to the Figure 2. Heat flow meter results for (a) 25 mm thick and (b) 50 mm thick expanded polystyrene (EPS). Figure 3. Heat flow meter results for (a) 33 mm thick and (b) 50 mm thick extruded polystyrene(XPS). Figure 4. Heat flow meter results for (a) 30 mm thick and(b) 50 mm thick rockwool normalisedto a density of 200 kg m-. 3% errors bars shown. NPL guarded hot-plate measured thermal conductivity values. The averaged thermalconductivity values are based on duplicate measurements which indicate that the repro-ducibility of the overwhelming majority of the participating apparatus is 1% or better.For each measured thermal conductivity value a corresponding value has been calculatedat the same temperature from the NPL data as described in section 5.1. In the case ofthe rockwool, a density correction to 200 kg m-has also been included. 6 Discussion 6.1 Guarded hot-plate baseline data During analysis of the results it appeared that the values for the thick XPS provided bytwo late participants were much higher than expected, especially when compared withthose obtained for the thin specimens. Because of their late involvement these organisa-tions undertook measurements in June and August respectively, much later than theFebruary/March period for the other participants. Thus, the possibility existed thatthe batch of material was changing with time and therefore the specimens measuredby the later participants had different characteristics. In September NPL carried out guarded hot-plate measurements of a further pairof thick specimens cut from the batch. The resultant mean values obtained were29.2 mW m-K- and 30.6 mW m-K-at 10℃ and 23 C, respectively. These indi-cated clearly that the material did have a different and higher Aavalue and that it mightbe changing with time. The existence of a‘thickness effect’for the cases of the EPS and XPS materials is shownclearly in figures 2 and 3. For the EPS material the effect was shown by a difference in the thermal conductivity results of about 1.4% between the 25 mm and 50 mm thick specimens.Similarly, for the XPS material the effect was shown by a difference of the order of0.8% between the results for the 33 mm and 50 mm thick specimens. However, asexpected there was no evidence of any thickness effect for the high density rockwoolmaterial. 6.2 Heat flow meter Figures 5-7 show the magnitude of the differences from the guarded hot-plate baselinevalues for one thickness and both temperatures of the EPS,XPS, and rockwool,respec-tively. The behaviour of the thinner specimens is very similar. An examination of allvalues for each material indicates that the overwhelming majority is well within ±5% foreach. Table 3 summarises this range of agreement. From a total of 155 data points only 20are outside ±5% while 102 are within ±3%, and of the latter 83 are within ±2%. If theresults from the two nonconforming apparatus are deleted only 10 are outside ±5%while 79 are within ±2%. Furthermore, the earlier discussion concerning the uncertaintyin the values for specimens from board 8 reduces the number in excess of ±5% to 8. o series 1 m series 2 Figure 5.i. Percentageedifferencesfrom NPL values for 50 mm thickexpanded polystyrene results. Ser-ies 1 is at a mean temperature ofabout 10°C and series 2 is at about23°C. o series l m series 2 Figure 6. Percentage differencesfrom NPL values for 50 mm thickextruded polystyrene results. Series 1is at a mean temperature of about10 °C and series 2 is at about 23°C. o series lm series 2 Figure 7. Percentage differencesfrom NPL values for 50 mm thickrockwool results at a mean density of200 kg m-. Series 1 is at a meantemperature of aboutt10 °C andseries 2 is at about 23°C. Laboratory Table 3. Deviation of the HFM data points for 18 organisations from the NPL baseline. Difference Expanded polystyrene Extruded polystyrene Rockwool from baseline 25 mm 50 mm 32 mm 50 mm 32 mm 50mm All results >±5% ±3% to ±5% Within ±3% Within ±2% Excluding nonconforming apparatus >±5% 0 ±3% to ±5% 6 Within ±3% Within±2% This general degree of agreement and consistency between different apparatus isencouraging. To a great extent the results mirror closely those obtained in the other,similar intercomparisons mentioned earlier. In these latter cases the agreement wasfound to be mainly within ±3%. However, while the general level of agreement is good there are two cases whereapparatus performance is not as expected and where additional comment is required andpossible solutions recommended. (i) Whereas the existence of a small thickness effect is shown clearly by the guardedhot-plate measurements on the two cellular plastics it is not exhibited to the same degreeby the various HFM apparatus. In a number of cases an effect is shown but of muchgreater magnitude than expected or observed in the GHPs. Conversely, some resultsindicated an effect in the opposite direction, ie a lower thermal conductivity value for thethicker specimen. Furthermore, for the rockwool where no effect is expected or observed,many of the results were significantly different for the two thicknesses. The levels ofagreement are within the generally accepted ±2% to ±3% but significantly differentfrom each other for the two thicknesses. (ii) In general the overall level of agreement and consistency for both measurementconditions, especially for the rockwool, is less for the thicker than for the thin specimens,even when the results for the two small nonconforming apparatus are removed. There are two possible individual causes for this apparently inconsistent behaviour.However, dependent on the particular apparatus, they may also be interrelated. (i) The first may be due to insufficient time being allowed for the apparatus to attainequilibrium, especially for the thicker denser specimens. This factor may not have beenappreciated fully, especially by those operators having major experience in measuringonly low density materials and/or thin test specimens. However, the relevant national and international standards do provide adequate guide-lines relating to the establishment of equilibrium conditions. These should be followedrigorously, especially when undertaking tests on specimens that may differ from thosenormally measured. (ii) The second may be due to effects of apparatus calibration. In this intercomparisonall apparatus were calibrated with one type of reference material or transfer standard butfrom different sources. This was either a moderate (~80 kg m-) or high (~150 kg m-)density glass fibre board having a thermal conductivity in the range 32 mW m-K-to34 mWm-K-over the present temperature range. It follows that the thermal resistance of the transfer standard is comparable to thatof the thin test specimens and any net edge heat exchanges may be minimal. However,for thicker test specimens the thermal resistance is significantly lower (by a factor of at least two) and in this case the design of a particular apparatus, especially with respectto guarding and surround insulation, may be such that net edge heat exchange cannotbe neglected for calibration and test conditions. This problem can only be overcome or minimised by the use of other referencematerials having higher thermal resistance values matching more closely that of a testspecimen. This problem highlights the existing lack of reference materials in terms of therange of thermal conductance values available. Until additional reference materials in different thicknesses become available, thissituation can be resolved only by the use of a certified transfer standard(s), ie an individ-ually measured specimen of a specific thickness having a certified thermal resistancevalue obtained by measurement in a guarded hot plate. Use of such transfer standardswill ensure that any HFM apparatus designed and operated in accordance with therequirements of appropriate international and national standards will attain a precisionwithin the present accepted limits of±3% on thermal insulation specimens at thicknessesup to the maximum for the size of the individual apparatus. In conclusion there is one general issue concerning calibration that needs to beaddressed. This relates to the degree of equivalency of calibration of different apparatusbased upon the use of reference materials or transfer standards from more than onesource. This is especially relevant now that comparisons between countries and/or geo-graphical areas are becoming important in requiring declared performance values forthermal insulation products. In the present investigation the majority of the apparatus involved used similar refer-ence specimens but from different calibration sources, either the National Institute ofStandards (NIST) in the USA or the NPL in the UK. Separately, three apparatusinvolved the use of a calibration curve supplied by the manufacturers which related tovalues obtained from NIST source material. It is possible that differences exist betweenthe calibrations and these could affect the values obtained such that the overall differ-ences are smaller or larger than those indicated in the present investigation. To investigate possible differences in results due to the use of different calibrationsources measurements were made in the NPL HFM with the calibration supplied by themanufacturer. The measurements were then repeated with a calibration based on thenewly developed and potential certified European IRMM reference material (Lamberty1999). In developing data for this material, guarded hot-plate measurements had beenmade, over the temperature range 0-40 ℃, by six European laboratories, includingNPL. The results were most encouraging and provided confidence in their use becauseall values agreed to better than ±1.0% over the whole temperature range. Table 4 summarises the results obtained with the two calibrations. They indicatethat there is a constant difference of the order of approximately 2%-3% between the twocalibrations for each of the test specimens, irrespective of their thickness. It is seen that this is one area where more work is necessary, especially prior to anyinternational comparison of HFM apparatus. To this end NPL had proposedto othernational standards organisations in the USA, Canada, France, and Japan that eachlaboratory undertake guarded hot-plate measurements on specimens of reference mate-rials obtained from and used within their respective countries. This proposal was madeinitially to ensure that such reference materials could be accepted internationally ratherthan nationally. However, it was also envisaged that the availability of such acceptedmaterials having values substantiated by five national organisations would be a valuablecontribution to ensuring worldwide equivalency of calibration of HFM apparatus. Theproposal has been accepted and a comparison organised by Bob Zarr at NIST is nowin progress. Table 4. HFM values based on two different calibration specimens. Manufacturer's NPL calibration calibration (NIST) (IRMM) 10°C 24°C 10°C 24°C 10°C 24°C EPS 24.1 48.88 35.8 37.4 34.5 36.3 2.9 3.0 EPS 16.1 24.56 35.0 36.5 33.9 35.7 3.2 2.2 XPS 8.1 50.38 29.7 31.2 28.8 30.3 3.1 3.0 XPS 3.2 32.54 28.0 29.2 27.2 28.5 2.9 2.5 Rockwool 35.1 51.02 36.6 38.1 35.6 37.1 2.8 2.7 Rockwool 31.1 32.10 36.4 37.9 35.3 36.8 3.1 3.0 7 Conclusions An intercomparison of 17 HFM apparatus currently operating in the United Kingdomand Eire has been carried out. The investigation included measurements made with theNPL guarded hot-plate apparatus to substantiate material homogeneity and providebaseline data for comparison. Measurements were made at approximately 10 °C and23C on two thicknesses of samples of expanded polystyrene, extruded polystyrene, andhigh density rock fibre. The results indicated that, with few exceptions, the overall agreement was within±5% and that for the majority of HFM apparatus it was ±2% to ±3%. Reasons fordifferences due to calibration issues and equilibrium time variations have been discussed,together with proposed solutions to reduce uncertainties in future test and quality controlmeasurements. Acknowledgements. In all cases the manufacturers donated the materials for the study and under-took the preliminary selection of the boards from which the various test specimens were prepared.This contribution by the manufacturers and the cooperation of their technical representatives,Mr J Bowdidge of Rockwool, Mr S Davis of Dow Chemical, and Mr D Thomsett of Vencel Resil,respectively, is recognised and greatly appreciated by all involved in the study. The authors wouldalso like to express their appreciation to all the participants for their ready cooperation. References ASTM C518-63, 1963, ASTM, 1916 Race Street, Philadelphia, PA 19103-1187, USA (and subsequentrevisions) Hust J G, Pelanne C M, 1985,“Round robin on the apparent thermal conductivity of low densityglass fibre insulation using guarded hot plate and heat flow meter apparatus”, NBSIR 85-3026,NIST, Boulder, CO, USA ISO 8301, 1991,“ISO 8301:1991(E): Thermal insulation-determination of steady state thermalresistance and related properties-heat flow meter apparatus”(Geneva: International StandardsOrganisation) Jones T T, 1972 Plast. Polym. 40 33-39 ( Lamberty A, 1 999, “ Re-certificatio n of BCR CRM 064” IRMM Gee l , Belgium ) Pelanne C M, Bradley C B, 1963 Mater. Res. Stand. 1-2 549-560 Quin S, Hameury J, 1997 High Temp. -High Press. 29 649-652 Salmon D R, Tye R P, 1999, paper presented at the International Thermal Conductivity Conference,Ann Arbor, MI, USA, June 1999 Uvslokk S, 1995,“Equipment for measuring thermal transmissivity and thermal resistance-Inter-calibration”, Nordtest Technical Report 249, NBRI, Forskningsveien 3B, PO Box 123 Blindern,N-0314 Oslo, Norway
确定

还剩9页未读,是否继续阅读?

产品配置单
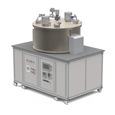
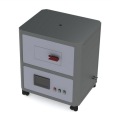
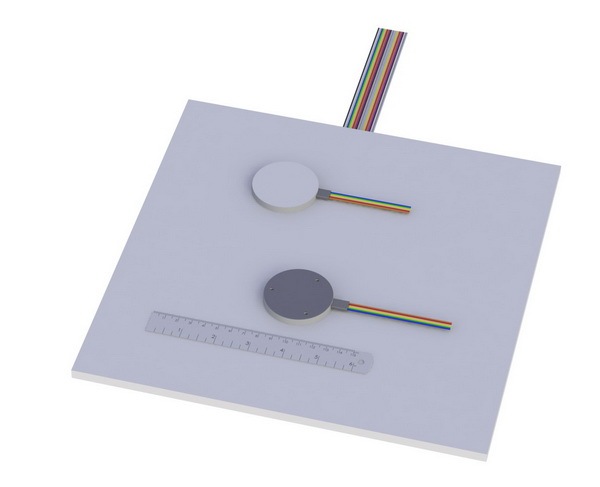
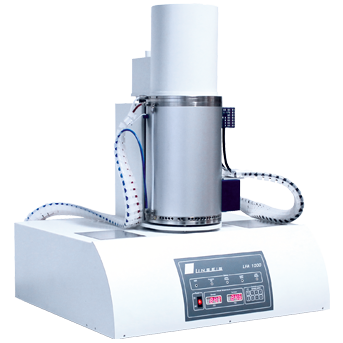
上海依阳实业有限公司为您提供《英国和爱尔兰范围内的热流计装置比对试验》,该方案主要用于其他中检测,参考标准--,《英国和爱尔兰范围内的热流计装置比对试验》用到的仪器有高灵敏度热阻式热流计、高温热流计法导热系数测试系统、稳态护热板法导热系数测定仪
推荐专场

相关方案
更多
该厂商其他方案
更多