


方案详情
文
肿瘤干细胞分选后进行新抗癌药物的研究是当今研究最前沿的领域。筛选获得的肿瘤干细胞数量极其少,对其进行信号通路蛋白翻译后修饰分析是全球该领域内的难点。本篇Nature protocol提供了肿瘤干细胞信号通路蛋白翻译后修饰完整解决方案。
方案详情

PROTOCOL Antibody-based detection of protein phosphorylationstatus to track the efficacy of novel therapies usingnanogram protein quantities from stem cells andcell lines Mark Aspinall-ODeal, Andrew Piercel, Francesca Pellicano2,Andrew J Williamsonl, Mary T Scott2,Michael J Walkerl, Tessa L Holyoake? & Anthony D Whetton lStem Cell and Leukaemia Proteomics Laboratory, Manchester Academic Health Science Centre, The University of Manchester, Manchester, UK.2Paul O’Gorman LeukaemiaResearch Centre, Institute of Cancer Sciences, University of Glasgow, Glasgow, UK. Correspondence should be addressed to A.D.W. (tony.whetton@manchester.ac.uk). Published online 18 December 2014; doi:10.1038/nprot.2015.007 This protocol describes a highly reproducible antibody-based method that provides protein level and phosphorylation statusinformation from nanogram quantities of protein cell lysate. Nanocapillary isoelectric focusing (cIEF) combines with UV-activatedlinking chemistry to detect changes in phosphorylation status. As an example application, we describe how to detect changesin response to tyrosine kinase inhibitors (TKIs) in the phosphorylation status of the adaptor protein CrkL, a major substof the oncogenic tyrosine kinase BCR-ABL in chronic myeloid leukemia (CML), using highly enriched CML stem cells and maturecell populations in vitro. This protocol provides a 2.5 pg/nl limit of protein detection (<0.2% of a stem cell sample containing<104 cells). Additional assays are described for phosphorylated tyrosine 207 (pTyr207)-CrkL and the protein tyrosine phosphatasePTPRC/CD45; these assays were developed using this protocol and applied to CML patient samples. This method is of highthroughput, and it can act as a screen for in vitro cancer stem cell response to drugs and novel agents. Mapping cancer cell signaling pathways using finite clinicalmaterial can support new treatment development and furtherour understanding of cancer biology. The assessment of signal-ing cascades using conventional proteomic technologies oftennecessitates protein quantities in excess of that which is available,especially when considering human biopsy material or primitivestem cells derived from human or mouse sources. The development of protein cIEF coupled to antibody-baseddetection has proven to be both extremely sensitive and frugal interms of demands on finite samples. The original work by O'Neillet al.l used a prototype cIEF system to demonstrate sensitivitydown to 25 cells (human prostate cancer cell line LNCaP) for thedetection of extracellular signal-related kinases 1 and 2 (ERK1and ERK2) and their associated phosphorylated states. Differentiterations of the technology have subsequently been used in arange of studies, starting with the Firefly instrument (ProteinSimple, formerly Cell Biosciences) in which imatinib-inducedchanges in ERK1 and ERK2 activation status were assessed inhuman CML cells isolated from total blood, whereas a rangeof phosphorylation changes in proteins including STAT3 andSTAT5 were defined for the K562 CML cell line2. Next-generationsystems (NanoPro 1000, formerly CB1000) have been used tostudy proteins including AKT, 4EBP1, MET, PTPRC/CD45 andCrkL in a number of leukemias, using different primary cell typesincluding mouse CD138+ cells isolated from bone marrow, humanCD34-selected acute myeloid leukemia (AML) cells,CML-derivedCD34+ cells and dendritic cells (DCs)3-6. Many malignant diseases are understood to have an under-lying stem cell population7-9, which this technology is capableof probing. For myeloproliferative neoplasms and leukemias,this stem cell population has been associated with deregu-lated protein tyrosine kinase (PTK) activity (for a review, see Mitelman et al.10), including FMS-like tyrosine kinase 3(FLT3) in AML11, Janus kinase 2 (JAK2) in erythroid neoplasial2and BCR-ABL in CML 13,14, TKI therapy using imatinib mesylate(IM) has been shown to inhibit PTK activity in CML15-18. Theuse of TKIs has improved clinical outcomes markedly for themajority of patients with chronic-phase CML who achieve sus-tained cytogenetic and molecular responsel9,20. Nevertheless,second- and third-generation TKIs have been developed inresponse to BCR-ABL mutations inferring resistance to treatment(for a review, see O'Hare et al.21). Despite continued TKI therapyin CML patients, the minimal effect of TKIs on primitive CMLhemopoietic cells results in the persistence of minimal residualdisease, which causes disease relapse upon drug withdrawal22-27.Given that CML is a stem cell-driven disease, any new potentiallycurative therapies must be tested on primary stem cells, whichare only available in finite quantities. Thus, methods to screendrug action on suitably limited stem cell populations are of greatinterest to the scientific community. Comparison with other methods Early comparisons of the effect of novel compounds or drugson very limited numbers of patient stem cells would be of greatvalue to clinicians, both for stratifying treatment response andfor devising new therapeutic or curative strategies. Definingthese effects in terms of cellular signaling requires the identi-fication of proteins and their state of activation in response topost-translational modifications (PTMs) such as phosphoryla-tion. Numerous approaches can be taken to characterize the pro-tein state in biological samples,which either use targeted massspectrometry (MS) or indirect analysis using antibody-basedtechniques. MS methods such as selected reaction monitoring(SRM)28, also known as multiple reaction monitoring (MRM), are highly sensitive and capable of quantitatively detecting atto-molar concentrations of protein in complex biological samples(for a review, see Hjelle et al.29). Antibody-based techniques,which can detect down to femtomolar protein concentrations,include western blotting,ELISA,reverse-phase protein arrays andflow cytometry, as well as the cIEF assay described here. In CML peripheral blood cells, CrkL, a protein phosphorylatedon tyrosine 207 via BCR-ABL action30, is an essential adaptorprotein for p210BCR-ABL-induced leukemogenic transforma-tion31, and it has been used as a marker for BCR-ABL status andTKI activity32,33. Direct assay of primitive cells in the CML cloneis technically challenging, thus limiting our understanding ofthe leukemic stem cell response to targeted therapies. The SRMapproach can be applied to the measurement of PTM, althoughthis can be very challenging depending on the site of the modi-fication and the concentration of the modified isoform of theprotein. SRM has been used to monitor the phosphorylation ofERK1 from mouse vascular smooth muscle tissue; however, tomeasure the PTMs, the starting amount of material was 400 ugand immunoprecipitation was required to enrich the proteinbefore analysis34. This requirement would reduce the utility ofan SRM assay for high-throughput analysis, whereas the requiredstarting material could be challenging when dealing with scarceprimitive stem cells. Western blot studies have previously been used to detect BCR-ABL expression status; however, the instability of the oncogenictyrosine kinase upon cellular lysis leads to inaccuracies whenestimating oncogenic activity35,36. In contrast, detection of acti-vated CrkL by western blotting provides an indirect method ofdetermining BCR-ABL inhibition in response to TKI treatment32.However, this approach is of low throughput, with limited scopefor multiplexed sample analysis, and, owing to the requirementfor bulk CD34+ cells, it is of little use for the analysis of moreprimitive cells, specifically CD34+ cell subsets in this study. Flow cytometry can detect activated CrkL in CML CD34+cells17, with single-cell profiling used to explore signaling net-works in a number of leukemic cell backgrounds (for a review, seeBendall and Nolan37). Multiplex signaling data can be acquiredfrom as few as 1 × 10⁴ cells, meaning that multiple subsets ofcells can be identified within a heterogeneous population38. Upto 15 distinct signaling events can be assayed simultaneously inlive cells. Interference between fluorescent probes is an inherentissue with flow cytometry, which becomes more acute with anincreasing number of assayed parameters in any one experiment(for a review, see Bendall et al.39). Nonspecific antibody interac-tions within the cell can also be problematic. ELISA represents analternative to these approaches, and it has been used in previousstudies to determine BCR-ABL activity in Philadelphia-positivecells40. ELISA is of high throughput and is capable of processinglarge sample numbers while using less material than a westernblot assay, yet it uses considerably more than flow cytometry. To enhance the limit of detection (LOD) for markers in stemcells, we used technology that combines cIEF with immunoassayon a new platform (NanoPro 1000; Protein Simple)1. This systemhas been developed on the basis of earlier work, which showed thepotential for capillary isoelectric focusing to resolve proteins withhigh sensitivity while proving to be compatible with immuno-assay and chemiluminescence detection (CID; for an overview, seeO'Neill et al.1). Therefore, it is theoretically possible for the user to undertake such studies without the NanoPro 1000;however, wehave not undertaken an assessment of this option. Key advantagesinclude the ability to handle nanoliter sample volumes with repro-ducible, high-resolution detection of protein phosphorylationprofiles simultaneously for multiple protein targets on extremelysmall quantities of human tissue. Multiplexed assay times areshort, and they allow up to 96 assays to be processed in <18 h.Specifically, we have been able to demonstrate changes in CrkLphosphorylation status using 0.1% of available patient material(<104 cells per individual). From this sample, it would be possibleto probe for up to 64 different protein targets simultaneously. Thisapproach is not without limitations; novel protein targets wouldrequire assay development, which can be time-consuming, andall potential assays are dependent upon antibody availability. Inaddition, cIEF immunoassay must be combined with alternativetechniques such as flow-based cell sorting to probe different celllineages (as described in this protocol). Nevertheless, the systemis compatible with a wide range of tissue types, including plasmaor serum, resected lung tissue,lung and endometrial biopsy mate-rial, sputum and cellular organelles. The ability of this platform tohandle such a variety of biological samples enables it to be embed-ded into laboratory workflows that focus on biomarker validationin blood or biopsy samples, targeted protein PTM assessment inconjunction with MS approaches and signaling cascade mappingin defined primary cell populations. Experimental design This protocol defines how cIEF immunoassay can be applied tomaterial from cell lines and the clinic. Specifically, the chronicmyelogenous and acute promyelocytic leukemic cell lines K562and HL60 have been used in Step 1A to develop an assay for theprotein CrkL, which is sensitive enough to be applied to clinicalmaterial containing ≤5,000 cells (Step1B). Although this cell lineprotocol has principally been used for the development of a stemcell-compatible assay here, the method described has been appliedto a range of cell lines (i.e., mouse Ba/F3 cells, embryonic stemcells, A549 and HEK 293 human cell lines) and protein targets (foran up-to-date list of developed assays, please refer to http://www.scalpl.org/) in our hands. This method is fully transferable, andit can be used to develop assays for any protein using mouse andhuman cell line material (other cell line sources will probably alsobe compatible; however, we cannot verify this). Assay development involves a number of steps, each definingan important aspect of the final protocol for a given protein. It isimportant to note that the majority of these development stepsare determined by the protein of interest; specifically, these relateto a protein’s basal isoelectric point (pI), associated isoelectricrange (with increasing phosphorylation) and capillary immo-bilization chemistry. Acquisition of suitable antibodies for totaland phosphorylated entities is essential. Those antibodies thathave been shown to work with other immunoassays (i.e., westernblot and immunohistochemistry) do not necessarily functionwell in the cIEF environment; however, we have had consider-able success with antibodies developed as part of the HumanProtein Atlas (http://www.proteinatlas.org/) program. Assaydevelopment should incorporate suitable controls including testfor secondary antibody cross-reaction with sample minus pri-mary antibody (also test for streptavidin-horseradish peroxidase(HRP) cross-reaction ifusing the three-step approach; see Step2) together with phosphatase-treated samples (Steps 19-23) toconfirm that protein observations are a result of phosphoryla-tion as opposed to other PTMs. It is worth observing that thisprotocol is nondenaturing, with secondary and tertiary proteinstructure preserved after isoelectric focusing and immobilization.Consequently, knowledge of a protein’s folding structure can beuseful when selecting antibodies for assay development, and afocus on antibodies raised to hydrophilic regions is advisable. It is essential that the LOD for an assay be defined, specificallyfor those assays designed to probe finite numbers of stem cells.As a guide, a detection limit of ≥20 pg/nl total protein would notbe suitable; typically, 2-8 pg/nl total protein is required to probestem cells, especially when dealing with low-copy-number pro-teins and proteins that undergo transient PTMs. Once developed,if an assay is compatible with low-cell-number clinical samples,then it is possible to assess the signaling behavior of a given pro-tein in human and mouse cells purified using flow-based sort-ing (Step 1B(i)). Issues surrounding high salt content of sampleand cell loss during preparation are addressed in this protocol,allowing for the assessment of specific cell linage populations,pertinent in this case for CML therapy but equally applicable toother disease areas. In the majority of cases, the protein concen-tration of samples derived from clinical samples (i.e., resectedlung tissue) is greatly in excess of the protein requirements forthis platform, and the simple protocol used with cell lines can beapplied (Step 1A). For samples with protein concentrations of<0.1 mg/ml, the dilution step can be omitted and the approachto sample preparation taken here for stem cells should be used(Step 5). When processing a large number of clinical samples, anumber of controls should be applied, including triplicate sam-ple loading, positive control (i.e., cell line; n =1) and a clinicalsample pool for intercycle and interexperiment referencing. Inaddition, during assay development, controls that assess second-ary antibody and streptavidin-HRP cross-reaction with sampleand primary antibodies must be used. The cIEF immunoassay platform uses UV-activated linkingchemistry (for details of chemistry used, see O’Neill et al.1), whichimmobilizes isoelectrically separated proteins to the capillarywall, allowing downstream immunoassay without the need forprotein blocking steps. Previous work has shown that the pI of aprotein shifts to more alkali values with the inhibition of phos-phorylation1,41. Compass software (Protein Simple) is used forevery aspect of an assay via three perspectives: Assay,Run’andAnalysis. The assay perspective allows the user to design the assayplate and program the NanoPro 1000 system to process samplesin a specific order using defined settings (e.g.,antibody incu-bation or UV exposure), thus allowing flexibility when design-ing complex experiments. Once an assay has been started, the‘Run'perspective gives a real-time display of sample separationon capillary and provides the user with information relating toeach stage of the experiment (e.g., sample loading, incubationtimes and estimated assay completion time). With data acquisi-tion complete, the Analysis'perspective provides a range of toolsto enable the user to analyze results from capillaries. Given thenature of this system, alternative software is not required, withthe exception of total area under the curve (AUC) calculations,which require third-party software; specifically, we use MedCalc(MedCalc Software). This technology offers a more sensitive method for assess-ing protein phosphorylation status when our workflow is used(Fig.1). Specifically, when compared with the prototype systemsused in earlier studies1,2 (Firefly, Protein Simple; formerly CellBiosciences), the NanoPro 1000 has a number of mechanicalenhancements including improved robotic z-scheme mappingand liquid handling, a smaller form factor with improved cameraand UV attributes. In addition, numerous iterative improvementshave been made to consumables chemistry, such as the three-stepsecondary-biotin to streptavidin-HRP detection kit, which canbe used in place of conventional secondary-HRP antibody; XDRperoxide for improved chemiluminescence detection with low-copy-number proteins; second-generation ampholyte premixes,including acidic pH nesting to prevent sample run-off duringisoelectric separation; and a host of subtle changes to other con-sumable solutions. Here we use a cIEF immunoassay to study the phosphorylationstatus of the CrkL adaptor protein in CD34+CD38+ and primitiveCD34+CD38-CML cells. The primary tissue is isolated by flowcytometry using leukapheresis samples, followedby culture in growthfactors and TKIs, as previously described42.Alow-ionic-strengthbuffer wash (20 mM bicine and 250 mM sucrose,pH7.5) is usedbefore lysis with zwitterionic detergent (20 mM bicine, pH 7.6,and 0.6%(wt/vol) CHAPS). Lysates are combined with cIEF rea-gents (see Steps 2-18) and loaded onto a multiwell plate.Theseparation gradients have been optimized for the CrkL assay,taking into account the small number of primary cells used instem cell studies. After isoelectric separation, proteins are immo-bilized using a UV-sensitive technique that links the proteins tothe capillary wall at their native pI. The CrkL assay was devel-oped using control cell lines to determine suitability for clinicalsample analysis. This protocol has been successfully used in two recently pub-lished studies involving finite quantities of CML patient mate-rial5,6. In one of these studies, Brown et al.6 focused on thedefective function of BCR-ABL-expressing mature DCs derivedfrom CML patient monocytes and found that dysregulation ofABL1 protein distribution in CML-DCs resulted in changes toCrkL (a substrate protein of ABL1), thereby altering the forma-tion of complexes involved in the control of F-actin responses.Specifically, CrkL displayed elevated levels of phosphorylation inCML-DCs when compared with normal DCs6. Here, we defineand compare the proportional degree of phosphorylation forthese two cell types, with particular emphasis on the ABL1-targetresidue Tyr207 of CrkL, using both anti-CrkL and anti-pTyr207-CrkL antibodies. Analysis with antibodies that detect total proteinproduces a profile encompassing PTMs and isoform expression,which can induce changes in the pI of a protein. Antibodies thatcan detect specific events, such as phosphorylation, are requiredto further define a protein profile. In the other study, proteomic analysis of signaling mediatedby the chemokine CXCL12 in hematopoietic progenitor cellsidentified a novel phosphorylation site on the protein tyrosinephosphatase PTPRC/CD45 at residue Ser962. Phosphorylationat this site was shown to be upregulated in the presence of BCR-ABL in CD34+ cells derived from patients with CML when com-pared with control samples (from patients without CML), usingcIEF with both commercially available and in-house antibodies, Figure 1|Workflow from patient sample collection to data analysis. Algorithm for the process of sample acquisition, TKI treatment, sorting and lysis (bluesection) before application to the cIEF platform (orange section), which is split into sections detailing experimental design, separation, capillary registrationand analysis. System experimental design, using the NanaPro 1000, sample, primary antibody, secondary biotin antibody, tertiary streptavidin-HRP antibodyand chemiluminescence should be loaded into wells A, B, C, D and J, respectively. Up to eight rows of sample can be loaded (A-H), followed by antibodies andchemiluminescence, by making use of the 384-well plate format. Separation, immobilization and exposure; after the system starts the NanoPro 1000,automatically load the capillaries with sample and initiate isoelectric protein separation over 40 min. At this point, proteins are fixed to the capillarywall during brief UV exposure before washing, antibody probing and chemiluminescence detection. For data analysis, chemiluminescence and fluorescencesignatures detected using a CCD camera are converted into electropherogram form. respectively5. By using the fully optimized PTPRC/CD45 assaydeveloped in our laboratory (for assay development data, seeSupplementary Fig. 1), we validated the approach using clini-cal samples, specifically looking at novel signaling differencesbetween more primitive CD34+CD38-CML cells that coenrichwith stem cells and more mature CML CD34+CD38+ progenitor MATERIALS REAGENTS · Cell lines of interest. We used K562 and HL60 (kindly provided by T. Holyoake, University of Glasgow). We tested the cell lines using aUniversity of Manchester authentication service using a Promega Powerplex21 system (Promega, cat. no. DC8902), which examined 21 loci across thegenome and compared results with a local database of American TypeCulture Collection (ATCC) references. This can be applied to any ATCC-registered cell line · Cells derived from clinical samples of interest. We used human CD34+-enriched cells from fresh leukapheresis samples obtained with writtenconsent from patients with newly diagnosed chronic-phase CML. NormalCD34+ cells were extracted from autologous donors with non-stem-cell populations, both in TKI-treated samples and in untreated con-trols. The quantity of clinical starting material needed for thisapproach is substantially smaller than that required in previousstudies using a cIEF platform1,2, and this technique also enablesa more detailed analysis of protein phosphorylation than waspossible with earlier technologies. disorders! CAUTION All experiments using human clinical material must conform to appropriate institutional and governmental regulations(see West of Scotland Research Ethics Committee 4 reference 10/S0704/2);informed consent should be obtained where applicable. · RPMI medium 1640 (1x,Gibco by Life Technologies, cat. no. 31870-025) ( ·Dulbecco’s PBS (DPBS), sterile-filtered (Sigma-Aldrich, cat. no. D 8537) ) ▲ CRITICAL For use with cultured cell lines. ·FBS, sterile-filtered (Sigma-Aldrich,cat. no.F7524) ( ·L- G lutamine, 2 00 m M (Sigma-Aldrich, cat. n o. G7513) ) ( · Penicillin-streptomycin (pen-strep), 1 0 ,000 U/ml (Gibco by Life Technologies,cat. no.15140-122) ) ( ·Bicine,≥99% ti t ration ( S igma-Aldrich, cat. no. B3876) ) ( ·CHAPS (Sigma Lif e Science, cat. no. C9426) ) ( ·Protease inhibitor cocktail (Sigma-Aldrich, cat. no.P8340) ) ( ·Phosphatase inhibitor cocktail 2 (Sigma-Aldrich, cat. no.P5726) ) ( ·Phosphatase i n hibitor cocktail 3 (Sigma- A ldrich,cat. no. P0044) ) ( ·Benzonase nuclease HC , 99% purity (Merck-Millipore, cat. no. 71206) ) ·Sodium orthovanadate, 100 mM (Sigma-Aldrich, cat. no.S6508) ( ! C A UT IO N S o l utio n prepar a tion involves boili n g this r e agent in th e microwave, which carries a risk of burning. ) ( ·Sodium fluoride, 500 mM (Sigma-Aldrich,cat. no.S7920) ) ( · P remix G2, 3-10 separation gradient (Protein Simple, cat. no. 040-968) ) ▲ CRITICAL Owing to the high viscosity of the premix solutions, it isessential that the user employ a reverse pipetting technique to accuratelymeasure the required volume. Failure to do so can lead to inaccuracies insample preparation and an inadequate amount of premix in the samplesunder analysis. ·Premix G2,5-8 (nested) separation gradient (Protein Simple, cat. no. 040-972) ▲ CRITICAL Owing to the high viscosity of the premixsolutions, it is essential that the user employ a reverse pipetting technique toaccurately measure the required volume. Failure to do so can lead toinaccuracies in sample preparation and an inadequate amount of premix inthe samples under analysis. ( ·DMSO inhibitor mix (Protein Simple,cat. no.040-510) ) ( · Antibody diluent ( P rotein Simple, cat. no. 040-309) ) ( · pI standard l adder 3 (Protein Simple, cat. no. 0 40-646) ) ( ·Wash concentrate (P r otein Simple, cat. no. 041-108) ) ( ·Peroxide X D R (Protein Simple, cat. no. 041-084) ) ( ·Luminol (Protein Simple, cat. no. 040-652) ) ( · Anolyte solution, 0 . 1 M phosphoric acid (H,PO;Sigma-Aldrich,cat. no. 438081) ) ( · Catholyte solutio n , 0 . 1 M sodium hydroxide (NaOH; BDH, cat. no . 102524X) ) ( ·Type I ultrapure laboratory water, 18.2 MQ cm (Elga Process Water) ) ( ▲ C RITICAL Hi gh-purity water is essential for interassay consistency. ) ( · Amplified rabbit secondary antibody detection kit (Protein Simple, cat. no. 041-126) ) ( · Anti-CrkL (C-20) antibody (Santa Cruz, cat. n o . sc-319) ) ·Anti-phospho CrkL (Tyr 207) antibody (Cell Signaling, cat. no.3181S) ( ·Anti-PTP R C/CD45 antibody (BD Transduction Laboratories, c a t. no.610266) ) ( · A nti-pS962 PTPRC/CD4 5 antibody (Eurogentec, custom a n tibody) ) ( · Anti-AKT (1+2+3)antibody (Cel l Signaling Technology, cat. no. 9272) ) ·Imatinib mesylate (IM), STI571 (Selleckchem, cat. no. S1026) ·Dasatinib, monohydrate (DAS; Santa Cruz, cat. no.sc-21808) ( ·Ap r otein phosphatase,20,000 U (Merck Mi l lipore, cat.no. 1 4 -405) ) ( · Trypan blue solution, 0.4%(wt/vol; Sigma-Aldrich, cat. no. T8154) ) ( ·Bio-Rad p r otein assay dye reagent concentrate (Bio-Rad, cat. no. 500-0006) ) ( · Albumin from bovine serum (Sigma-Aldrich, cat. no. A3059-100G) ) ( · ProtoF l owGel, 30%(w t /vol) acrylamide: 0.8%(wt/vol) Bis-acrylamide (Flowgen Bioscience,cat. no. H16996) ) ( ·Trizma base (Sigma- A ldrich, cat. no . T1503) ) ( ·Glycine (Sigma-Aldrich, cat. no. G8898) ) ( ·Hydrochloric acid (HCl), 30% (vol/vol; BDH, cat. no.262743N) ) ·SDS (BDH, cat. no.442444H) ( ·Ammonium pers u lfate (Si g ma-Aldrich, cat. no. A3678) ) ( ·N,N,N’,N'-Tetramethylethylenediamine bioreagent (Sigma-Aldrich, cat.no.T7024) ) ( · B romophenol blue sodium sa l t (Sigma-Aldrich, cat. no. B7021) ) ( ·Glycerol (Fisher Scientific, cat. no.BP229) ) ( · 2 -Mercaptoethanol (Sigma-Aldrich, cat. no.M7154) ▲ CRITICAL Wh en used with Laemmli buffer, store the aliquots at - 8 0°C to a void oxi d ization.Do not freeze-thaw. ) ( · 2-Mercaptoethanol, 50 mM(Gibco by Life Technologies, ) ( cat. no.31350-101) ▲ CR I TICAL For use with primary cells. ) ( · AnalR NORMAPUR methanol (VWR, cat. no . 20847.307) ) ( ·Ponceau S solution (Sigma-Aldrich, cat. no. P7170) ) ( · Tween-20 (Sigma-Aldrich, cat. no.P1379) ) ( ·Nonfat dried milk powder (Sigma-Aldrich,cat. no . M7409) ) ( ·SuperSignal West P ico chemiluminescent substrate (Thermo Scientific cat. no.34078) ) ( · Acetic acid,≥99.0% purity (Sigma-Aldrich, cat. no.45740) ) ( · I nterleukin 6 (IL-6), recombinant human ( L ife Technologies, cat. no.PHC0066) ) ( · Granulocyte c olony-stimulating factor (G-CSF), recombinant human ( Life Technologies, cat. no.PHC2035) ) ( ·Granulocyte-macrophage colony-stimulating factor (GM-CSF),recombinant human (Life Technologies, cat . no.PHC2015) ) ( ·Stem cell factor (SCF) C-Kit ligand, human recombinant (Li f e Technologies, cat.no. PHC2116) ) ( ·Leukemia inhibitory factor (LIF), recombinant human, 10 ug/ml ( Merck Millipore, cat.no . LIF1010) ) ( · Macrophage inflammatory protein-1o (MIP-1o), recombinant human ( Life Technologies,cat. no. PHC11 0 4) ) ( · BIT (BSA/insulin/transferrin; Stem Cell Technologies, cat. no.09500) ) ( ·Low-density lipoprotein, 1 0 mg/ml (Sigma-Aldrich, cat. no. L4646) ) ( ·Iscove's-modified Dulbecco's medium ( S igma-Aldrich,ca t . n o . I3390) ) ( · D Nase I, ~2,500 U/vial (Stem Cell Technologies, cat. no. 07900) ) ( · Magnesium chloride (MgCl; 1 M ; Sigma-Aldrich, c a t. no.M8266) ) ( ·Trisodium citrate ( Sigma-Aldrich, cat. no. S1804) ) ( ·Albunorm,20%, 200 g/l (Octapharma) ▲ C RITICAL Stor e it at room t emperature (RT;21 C) before u s e. ) ( · Dulbecco's PBS,Mg2+/Cat free (Gibco by Life Technologies. ) ( c at. no. 14190-169)▲ CRITICAL For use wi t h pr i mary cells. ) ( · Anti - human CD34-APC (Becton Dickinson, cat. n o .555824; ref.42) ) ( · Anti-human CD38-FITC (Becton Dickinson, cat. no. 555821;r e f.42) ) ( ·DMSO, ACS spectrophotometric grade,≥99.9% (Sigma-Aldrich, c at. no. 154938) ) ( · Rely+On Virkon powder ( DuPont) ) ( EQUIPMENT ) ( ·FACSAria cell sorting system (Becton D ickinson) ) ( · Capillaries-charge separation for Peggy/NanoPro 1000 (Protein Si m ple,cat. no.CBS700)▲ C RITICAL Capi l laries are light- and moisture-sensitive; t hey should be stored in a d ark dry place a t RT. ) ( · Sponge p ack for P eggy/NanoPro 1000 (Pr o tein Simple, cat. no.041-528) ) ( ·NanoPro 10 0 0 simple we s tern ch a rge-based assay system (P r otein Simple) ·Compass software, version 1. 8 .2 (Protein Simple). This software is used to s et up, run and a nalyze data generated using the Peggy system ) ( ·MedCalc, version 13.3.3 (MedCalc Software). This software is used to c alculate total AUC values for data generated by Compass · Purelab Ultra laboratory water purification system ( Elga P rocess Water)· Eppendorf Safe-Lock tubes, 0.5 ml (Eppendorf, cat. no. 0030121023) ·Eppendorf Safe-Lock tubes, 1.5 ml (E p pendorf, cat. no. 0030120086)·Plastic tips for P10, P200 and P1000 pipettes ) · Terumo 60 cc Luer-lock tip syringe without needle, graduation 1 cc, 60cc total (Terumo Medical Products,cat. no. SS-60L) ·Millex syringe filter unit, sterile, 25-mm diameter, 0.2-um pore size (Merck Millipore, cat. no.SLFG025LS) ·Microcentrifuge, 5415D (Eppendorf) ·Centrifuge, SL16R (Thermo Scientific) ·Vortex PV-1 (Grant-Bio) ·Microscope,DMIL (Leica) ·Water bath (Grant Instruments) · Corning flask, 25-cm² cell culture flask, angled neck, 0.2-um vented car (Corning,cat. no. 3056) · Corning flask, 75-cm2 cell culture flask, canted neck, 0.2-um vented cap (Corning, cat. no. 430641) ·Adam automatic cell counter (NanoEnTek, cat. no.ADAM-MC) · Adam AccuChip4x kit (NanoEnTek, cat. no. AD4K-200) ·Double Cell Neubauer hemocytometer counting chamber,0.1 mm, 1/400 mm² (Hawksley, cat. no.AC2000) ·Hemocytometer cover glass, 20 mm×26 mm (Fisher Scientific, cat. no. 12352168) · Finnpipette Novus 10-100 ul single-channel electronic pipette (Thermo Scientific,cat. no.4620040) · Pipette controller (Starlab, cat. no.E4866-0021) ·Costar 5-ml Stripette (Corning, cat. no.4487) ·Costar 10-ml Stripette (Corning, cat. no. 4488) ·Costar 25-ml Stripette (Corning,cat. no. 4489) ·SafeFlow 1.2 microbiological safety cabinet, class II-B3 (BioAir Instruments,IT) ·Heracell 240i CO, incubator (Thermo Scientific, cat. no. 51026331) ·Corning CentriStar 15-ml centrifuge tube (Corning, cat. no. 430791) ·Corning CentriStar 50-ml centrifuge tube (Corning, cat. no. 430829) ·Microtiter plate, 96-well/flat bottom, nonsterile (Sterilin, cat. no.611F96) ·Multiskan Ascent plate reader (Lab Systems) ·Amersham Hybond enhanced chemiluminescence (ECL) nitrocelluloseblotting membrane (GE Healthcare Life Sciences, cat. no.RPD203D) ·Hoefer power pack (EPS2A/200) ·Stuart magnetic stirrer (UC151) ·Spinbar magnetic stirring fleas (Sigma-Aldrich) · Sterile Duran laboratory bottles 100-,500-and 1,000-ml sizes · pH meter (MP220) with an Inlab Expert Pro pH probe (Metter Toledo)· Stuart roller mixer (SRT2) ·Mini-PROTEAN Tetra Cell (Bio-Rad,cat. no. 165-8001) ·Chemidoc XRS system (Bio-Rad) · Quantity One 1D analysis software, version 4.6.0 (Bio-Rad) REAGENT SETUP Bicine/CHAPS buffer and sample diluent (20 mM bicine and 0.6% (wt/vol)CHAPS; pH 7.6) Prepare a solution containing 326 mg of bicine and600 ul of CHAPS, and adjust the final volume to 100 ml with Purelabultrapure water. Adjust the pH to 7.6 using a magnetic stirrer and a pH meter.Store the buffer at 4℃ for up to 2 months. Bicine/CHAPS lysis buffer For 1 ml of buffer, combine 957 pl of bicine/CHAPS buffer, 3 ul of benzonase nuclease, 10 ul of protease ( i nhibitor cocktail, 10 ul of phosphatase i n hibitor cocktail 2, 10 ul o fphosphatase inhibitor cocktail 3, 10 ul of 100 mM sodium orthovanadate ) and 1 ul of 500 mM sodium fluoride. When lysing cell lines, 50 ul of buffer isrequired for every 1 ×10⁶ cells. Primary cells will require <10 ul for every 1×10⁶ cells,and the user should be cautious not to overdilute the lysate by usingtoo large a volume of lysis buffer. Add the 10 ul of lysis buffer 2 pl at a timeuntil the primary cell pellet begins to dissolve. Make lysis buffer just beforeuse, and keep it on ice for a maximum of 2 h. Sample diluent/DMSO inhibitor mix solution (SSD) Mix 10 pl of DMSOinhibitor mix with 490 ul of sample diluent. Vortex the solution and store itat 4 °C for up to 6 months. Anolyte solution (0.1 MH,PO4) Take 6.9 ml of H,PO4and bring thefinal volume to 1 liter with Purelab ultrapure water. Check the pH withpHydrion insta-check paper. Store the solution at 4℃ for up to 6 months.! CAUTION Take care when decanting H,PO4, as it is very corrosive.Ensure that correct personal protective equipment is used, and decant using a pipette controller. Catholyte solution (0.1 MNaOH) Dissolve 4 gof NaOH pellets and bringthe final volume to 1 liter with Purelab ultrapure water. Check the pH withpHydrion insta-check paper. Store the solution at 4℃ for up to 6 months.Tris-HCl resolving solution (1.5 M,pH 8.8) Dissolve 18.2 g of Trizma basein 30 ml of Purelab ultrapure water, and set the pH with HCl using a pHmeter and a magnetic stirrer. Adjust the final volume to 100 ml and store it atRT for up to 6 months. Tris-HCl stacking solution (0.5 M,pH 6.8) Dissolve 6.1 g of Trizma in 30 mlof Purelab ultrapure water, and set the pH with HCl using a pH meter and amagnetic stirrer. Adjust the volume to 100 ml and store it at RT for up to6 months. SDS stock solution Dissolve 10 g of SDS in 50 ml of Purelab ultrapure waterusing a magnetic stirrer. Bring the volume to 100 ml and store it at RT forup to 2 months.! CAUTION This solution is toxic if inhaled; dispense thedetergent in a fume hood. Ammonium persulfate solution Mix 500 mg of ammonium sulfate in4.5 ml of Purelab ultrapure water and vortex the mixture to dissolve thecontents. Freshly prepare the solution before use. Bromophenol blue stock solution (1%, wt/vol) Dissolve 100 mg ofbromophenol blue sodium salt into 2 ml of Purelab ultrapure water andvortex to mix. Adjust the final volume to 10 ml and store it at RT for up to6 months. Reservoir buffer stock solution (25 mM Tris and 142 mM glycine) Make10x stock solution by adding 30.33 g of Trizma to 144 g of glycine, and bringthe volume up to 500 ml with Purelab ultrapure water until it is dissolved.Adjust the final volume to 1,000 ml. Store the solution at RT for up to6 months. Reservoir buffer/SDS (wt/vol) 0.05% solution Take 100 ml of reservoirbuffer stock solution, add 1 ml of SDS stock solution and bring the volume to1,000 ml with Purelab ultrapure water. Freshly prepare the buffer before use.Western transfer buffer Dilute 90 ml of reservoir buffer stock solution at a1:10 ratio with Purelab ultrapure water (add 100 ml of methanol for use withproteins of <40 kDa). Freshly prepare the buffer before use. ( Laemmli stock sample buffer 5x (60mM Tris-HCl, pH 6.8;2% (wt/vol)SDS; 10%(vol/vol) glycerol; 5% (vol/vol) 2-mercaptoethanol; and0.01% (wt/vol) bromophenol blue) Mi x 4 ml of 1 .5 M Tris-HCl stackingsolution, 10 ml of glycerol, 5 ml of 2-mercaptoethanol and 1 ml ofbromophenol blue stock so l ution. Vortex until fully mixed, and t h en dividethe solution i nto aliquots of suitable volumes. Store the aliquots at - 20 ℃ for up to l year. ) ( PBS-Tween solution A d d 2.5 ml of Tween-20 to 500 m l of DPBS solution and mix it using a magnetic sti r rer. Store the solution at RT for up to 3 months. ) Nonfat dried milk (NFDM) solution,5%(wt/vol) This solution is used formembrane blocking and secondary antibody incubation. Mix 2.5 g of NFDMin 25 ml of PBS-Tween solution using a magnetic stirrer. Adjust the finalvolume to 50 ml. Store the solution at 4°℃ for up to 3 d. NFDM solution, 1% (wt/vol) This solution is used for primary antibodyincubation. Mix 0.5 g of NFDM in 25 ml of PBS-Tween solution using amagnetic stirrer. Adjust the final volume to 50 ml. Store the solution at 4℃for up to 3 d. ECL solution Combine SuperSignal West Pico chemiluminescent substratesA and B in a 1:1 volume to make a final volume of 2 ml. Use the solutionimmediately. ( Acetic acid (100 mM) solution D i lute 5.75 u l of a cetic acid (>99.0%) t o 1 ml with Purelab ultrapure water and store it at RT for up to 6 months. F ilter-sterilize the solution using a 0.2-um sterile f i lter before use. ) ( PBS/Tween (0.02%,vol/vol) solution Di l ute 200 ul of Tween-20 in 99.8 mlofD P BS. Filt e r-sterilize the solution using a 0.2-um sterile filter before use. Store the solution a t RT for up to 5 d. ) MgCl,(1M) stock Dissolve 952.1 mg of MgCl, in 5 ml of Purelab ultrapurewater using a magnetic stirrer. Adjust the final volume to 10 ml. Filter-sterilize the solution using a 0.2-um sterile filter before use. Store it at 4°Cfor up to 6 months. Trisodium citrate, 0.155 M Dissolve 45.59 g in 500 ml of Purelab ultrapurewater using a magnetic stirrer. Adjust the final volume to 1,000 ml. Filter-sterilize the solution using a 0.2-um sterile filter before use. Store the solutionat 4°C for up to 6 months. Base serum-free medium (SFM) Make the medium in a sterile Duran bottlein a Class II hood. For a 125-ml stock, combine 97.25 ml of Iscove's-modifiedDulbecco's medium, 25 ml of BIT, 1.25 ml of 200 mM L-glutamine, 1.25 mlof 10,000U/ml pen-strep, 250 ul of 50 mM 2-mercaptoethanol and 500 ul of10 mg/ml low-density lipoprotein while mixing the solution with a magneticstirrer. Filter-sterilize the solution using a 0.2-um sterile filter before storageat 4℃ for up to 1 week. SFM plus growth factors The growth factors are prepared at the followingconcentrations: SCF, 0.2 ng/ml; G-CSF, 1 ng/ml; GM-CSF, 0.2 ng/ml; IL-6,1 ng/ml; LIF, 0.05 ng/ml; and MIP-1o, 0.2 ng/ml.Once the growth factors areprepared, store them at 4℃ and use them within 2 weeks. IL-6 stock IL-6 is supplied as a 25-ug lyophilized, carrier-free powder.To regain full activity, IL-6 requires reconstitution in 250 ul of 100 mMacetic acid to a concentration of 0.1 mg/ml. Make 20-ul aliquots and storethem at -20℃ until needed. For a working concentration, freshly preparethe stock. Dilute the stock at a 1:20 ratio with DPBS to a concentration of0.005 mg/ml. Use 2 ul/10 ml of SFM to give a final concentration of 1 ng/ml.▲ CRITICAL Prepare the reagent under sterile conditions using a Class II microbiological safety cabinet. Do not store it in a frost-free freezer. G-CSF stock G-CSF is supplied as a 25-ug lyophilized, carrier-free powder.To regain full activity, G-CSF requires reconstitution in 250 ul of Purelabultrapure water to a concentration of 0.1 mg/ml. Make 20-ul aliquots andstore them at -20°℃ until needed. For a working concentration, freshlyprepare the stock. Dilute the stock at a 1:50 ratio with DPBS to a concentrationof 0.002 mg/ml. Use 5 ul/10 ml of SFM to give a final concentration of1 ng/ml. ▲ CRITICAL Prepare the reagent under sterile conditions using aClass II microbiological safety cabinet. Do not store it in a frost-free freezer.GM-CSF stock GM-CSF is supplied as a 10-ug lyophilized, carrier-freepowder. To regain full activity, GM-CSF requires reconstitution in 100 ul ofPurelab ultrapure water to a concentration of 0.1 mg/ml. Make 10-ulaliquots and store them at-20C until needed. For a working concentra-tion, freshly prepare the stock. Dilute the stock at a 1:1,000 ratio with DPBS to a concentration of 0.0001 mg/ml. Use 20 ul/10 ml of SFM to give a final concentration of 0.2 ng/ml. ▲ CRITICAL Prepare the reagent under sterileconditions using a Class II microbiological safety cabinet. Do not store it in afrost-free freezer. SCF stock SCF is supplied as a 25-ug lyophilized, carrier-free powder. Toregain full activity, SCF requires reconstitution in 250 ul of Purelab ultrapurewater to a concentration of 0.1 mg/ml. Make 20-ul aliquots and store them at-20 ℃ until needed. For a working concentration, freshly prepare the stock.Dilute the stock at a 1:200 ratio with DPBS to a concentration of 0.0005 mg/ml. Use 4ul/10 ml of SFM to give a final concentration of 0.2 ng/ml.▲ CRITICAL Prepare the reagent under sterile conditions using a Class IImicrobiological safety cabinet. Do not store it in a frost-free freezer.MIP-1o stock MIP-1o is supplied as a 10-ug lyophilized, carrier-freepowder. To regain full activity, MIP-1o requires reconstitution in 100 ul ofPurelab ultrapure water to a concentration of 0.1 mg/ml. Make 10-ul aliquotsand store them at -20°C until needed. Prepare the stock under sterileconditions using a Class II microbiological safety cabinet. For a workingconcentration, freshly prepare the stock. Dilute the stock at a 1:1,000 ratiowith DPBS to a concentration of 0.0001 mg/ml. Use 20 ul/10 ml of SFMto give a final concentration of 0.2 ng/ml. ▲CRITICAL Prepare the reagentunder sterile conditions using a Class II microbiological safety cabinet. Do not store it in a frost-free freezer. LIF stock LIF is supplied as a 10 ug/ml solution. Dilute the stock at a 1:100ratio in DPBS/Tween solution to a final concentration of 0.1 ug/ml. Preparethe stock under sterile conditions using a Class II microbiological safetycabinet. Store the stock at 4℃ for up to 1 month. Physiological low-growth factor cocktail (PGF) To 10 ml of SFM medium,add working concentrations of growth factors SCF, G-CSF, GM-CSF, IL-6, LIF and MIP-1o (as detailed in the associated text for each stock solution).Prepare the cocktail under sterile conditions using a Class II microbiologicalsafety cabinet. Once the reagent is prepared, store it at 4℃ and use it within2 weeks. DAMP solution From stock solutions, combine 2 ml of DNase I,1.25 mlof MgCl,53 ml of trisodium citrate and 25 ml of Albunorm (20%), and adjust the volume to 500 ml with DPBS. Prepare the solution under sterileconditions using a Class II microbiological safety cabinet. Store the solutionin 50-ml aliquots at 4℃ for up to 6 months. Warm the solution to 37.5℃before use. IM stock solution, 10 mM Imatinib is supplied as a 100-mg lyophilized powder. Prepare the solution under sterile conditions using a Class IImicrobiological safety cabinet. Dissolve the solution in 900 ul of DMSO byvortexing, giving a bulk stock concentration of 169.58 mM, which should bestored at-20℃ until needed. Take 58.97 pl of this solution and dilute it to1 ml with DPBS (giving 10 mM stock). Divide the solution into aliquots andstore them at -20℃. For a final concentration of 5 uM, use 5 ul of 10 mMstock for every 10 ml of cultured cells (2×10⁵ cells per milliliter). Dasatinib (DAS) stock solution (150 uM) Dasatinib is supplied as a10-mg lyophilized powder. Prepare the solution under sterile conditionsusing a Class II microbiological safety cabinet. Dissolve the solution innx5 ml of DMSO by vortexing, adjust the final bulk stock volume to 10 ml(1.976 mM) and store it at -20 ℃ until needed. Take 75.9 ul of solutionand dilute it to 1 ml with DPBS (giving 150 uM stock). Divide the solutioninto aliquots and store them at -20 °C. For a final concentration of 150 nM,use 10 ul of 150 uM stock for every 10 ml of cultured cells (2×10⁵ cellsper milliliter). RPMI base medium (10% (vol/vol) FBS; 20 mM i-glutamine and 36 U/mlpen-strep) To 500 ml of RPMI 1640 medium, add 50 ml of FBS, 2 ml ofpen-strep (10,000 U/ml) and 5 ml of 200 mM L-glutamine. Prepare themedium under sterile conditions using a Class II microbiological safetycabinet. Store the medium at 4℃ for up to 2 weeks. Warm the medium to37.5C before use. K562 and HL60 cells Store K562 and HL60 cells in liquid nitrogen in 1 ml of90% (vol/vol) FBS and 10% (vol/vol) DMSO at densities of 3×10⁶ and 5×10⁶ per ampule, respectively. Rely+On Virkon solution (1%,wt/vol) With 10 g of Virkon powder,adjust the volume to 1 liter using lukewarm water in a fume hood.Store the solution at RT for up to 6 months. PROCEDURE Sample preparation 1| There are two options for preparing samples: the first option (option A) focuses specifically on approaches to preparingcell line material for analysis, and it can be used independently of the second option (option B), which defines a methodthat is specific for primary stem cell material. (A) Cell lines ) TIMING 1-2 weeks (Step 1A(i-xii)), depending on cell recovery time, plus 8 h (Step 1A(xiii-xix))(i) Sample preparation of controls (K562 and HL60 cell lines): thawing and passaging. Before thawing the cells, preparethe base medium by adding 50 ml of FBS, 5 ml of 200 mM L-glutamine and 2 ml of en-strep to 500 ml of RPMI medium(total volume of 557 ml). Mix by shaking, and place the medium in a water bath that has been prewarmed to 37.5 °Cfor 30 min. (ii) Dispense 8 ml of RPMI base medium in a 15-ml centrifuge tube using a pipette controller and a 10-ml Stripette. (iii) Thaw the cell ampules in a water bath at 37.5 C. Transfer the ampules to RPMI base medium prepared in Step 1A(i). ▲ACcRITICAL STEP The cell stock should be partly frozen at this point. As soon as the frozen material is dislodged bymelted buffer, transfer the contents to the prewarmed medium. (iv) Wash the ampule by adding 1 ml of RPMI base medium into a tube, quickly pipetting three times (5 s each) andensuring that the tube walls are fully washed. Remove the medium and add it to the centrifuge tube. This allowsfor a 1:10 dilution of the frozen cell medium to displace the DMSO. (v) Replace the screw cap and invert the mixture. Centrifuge the mixture at 450g at RT for 3 min to pellet. (vi) Discard the supernatant in liquid Virkon (1%, wt/vol), and resuspend the pellet in 10 ml of RPMI base medium.Place the mixture in a 25-cm2 cell culture flask, and incubate it overnight using standard conditions of 37 °C, 5% COand a humidified atmosphere. PROTOCOL (ix) Pellet the sample by centrifugation at 450g for 3 min at room temperature to remove dead cells and debris. Discardthe supernatant in liquid Virkon (1%, wt/vol). Resuspend the cell pellet in 10 ml of prewarmed RPMI base medium andtransfer it to a fresh 25-cm2 cell culture flask. Incubate the suspension overnight under standard conditions. (x) Count the cells. We use an Adam automatic cell counter for large experiments requiring fast cell counting; however, trypan blue exclusion is perfectly adequate. To count using an Adam automatic cell counter, add 50 u of solution Tand 50 ul of solution N (solutions are part of the AccuChip kit) into two separate 0.5-ml Eppendorf tubes.Next, displace the cells that have adhered to the cell culture flask as in Step 1A(viii); take two 50-ul aliquots of cellculture, and add one to each of the Eppendorf tubes containing Adam solutions. Mix gently by pipetting, and place20 ul from each aliquot into either channel T or channel N (depending on which solution is used) of an AdamAccuChip. Place the chip in the cell counter and start the count. The value given will determine the percentage ofthe cells that recover during the 24 h after thawing (typically>50%).CRITICAL STEP Check the cell viability and number weekly using trypan blue to ensure the accuracy of the Adam automatic cell counter. (xi) Continue to culture the cells for a further 24 h, and then repeat Step 1A(viii,ix).Determine the cell number permilliliter as in Step 1A(x), and calculate the volume of cultured cells required for passaging. Cells should be seededat a concentration of 1×10⁵ cells per milliliter. For example, 1.67 ml of culture at a concentration of 6 × 10⁵ cellsper milliliter should be added to 8.33 ml of fresh prewarmed RPMI base medium to obtain a final volume of 10 ml,as follows: volume of culture required=(1×10⁵ cells per milliliter /6×105 cells per milliliter) ×10 ml=1.67 ml.The amount of fresh prewarmed RPMI base medium required is 10 ml (total final volume)- 1.67 ml of culture, whichequals 8.33 ml. (xii) Place the passaged culture in an incubator for 48 h. CRITICAL STEP Experiments should be undertaken using cells between passages 5 and 40. Cells collected for storageshould be split <20 times. (xiii) Sample preparation of controls (K562 and HL60 cell lines): TKI treatment, collection and lysis. Repeat Step 1A(xvii-x)and then seed the cells at a density of 2×10⁵ cells per milliliter (2×10⁶ total cell number in 10 ml of prewarmedRPMI base medium, cultured in a 25-cm2 cell culture flask). Incubate the cells for 1 h using standard conditions(37°C, 5% C02, 95% relative humidity) before proceeding to treatment (next step). (xiv) Incubate the cells using standard conditions (Step 1A(xiii)), with treatment of interest, for an appropriate timeperiod. We treat with TKIs at the following drug titrations for 5 h using standard conditions (Step 1A(xiii)): No-drug control (NDC) 二 IM, 1.0 uM 1.0 ul of 10 mM stock solution IM, 2.5 uM 2.5 ul of 10 mM stock solution IM, 5.0 uM 5.0 pl of 10 mM stock solution DAS, 10 nM 0.67 ul of 150 uM stock solution DAS, 150 nM 10.0 ul of 150 uM stock solution ▲CRITICAL STEP Proceed to the next step 4 h into the treatment. (xv) After 4 h of treatment, prepare bicine/CHAPS lysis buffer (50 ul lysis buffer for every 1×10⁶ cells) and store it on iceuntil required (up to a maximum of 4 h). (xvi) After the 5-h total drug treatment, repeat Step 1A(viii-x). Resuspend the pellet in 10 ml of DPBS to wash off excessmedium. Pellet again and resuspend in 1 ml of DPBS; transfer the mixture to a 1.5-ml microcentrifuge tube andre-pellet using a benchtop microcentrifuge at 1,500g for 3 min at room temperature. Discard the supernatant inliquid Virkon (1%, wt/vol) under a fume hood, and invert the tubes on tissue paper to dry for 20 s. (xvii) Add the required volume of lysis buffer to each cell pellet(50 ul of Lysis buffer to every 1 x10⁶ cells). Vortex untilthe pellet is suspended. Incubate on ice for 15 min. Sonicate the resuspended cells for 10 s, vortex them for 10 s andreturn them to ice for 15 min. Precool the benchtop microcentrifuge to 4 °C. Repeat the vortex and incubation twomore times. ▲(CRITICAL STEP Visually inspect the sample; the buffer should appear cloudy owing to CHAPS dissolution on ice,whereas the solution should appear clear. ? TROUBLESHOOTING (xviii) Centrifuge the sample in the prechilled benchtop microcentrifuge for 15 min at 4 °C and 18,188g. The pellet shouldbe very small and compact. If the pellet is similar in size to the original cell pellet, lysis is incomplete. The pelletshould be resuspended, and the volume of the lysis buffer should increase by 50 ul. Repeat until the pellet hasdiminished. Remove the supernatant and place it in a fresh 0.5-ml microtube. Discard the pellet. (xix) Determine the protein concentration of the supernatant using a suitable assay (i.e., Bradford assay). Divide thesamples into aliquots at a protein concentration of 2 mg/ml and store them at -80 °C until required. PAUSE POINT Aliquots can be stored for several years at this temperature if unthawed. Thawed samples should beused and discarded. (B) Sample preparation of primary material (clinical cells) . TIMING 8 h (i) To isolate the CD34+CD38- population, thaw the cells in DAMP solution and stain them simultaneously withanti-human CD34-APC and anti-human CD38-FITC antibodies. Sort the cells into CD34+CD38- and CD34+CD38+ subpopulations using a BD FACSAria cell-sorting system42. (ii) Culture the sorted cells overnight in SFM plus growth factors. (iii) Treat the cells for 24 h with a TKI32, as previously described in Step 1A(xiv) using final concentrations of 150 nM DASand 5 uM IM. (iv) After 23 h, prepare 1 ml of bicine/CHAPS lysis buffer and store it on ice until required or for a maximum of 3 h.(v) Prechill the benchtop microcentrifuge to 4 °C. ▲CRITICAL STEP To minimize changes in protein phosphorylation status, ensure that the samples are kept at 4°C upuntil the point of lysis. (vi) Stain the cells in a 1:1 mixture of trypan blue solution and cultured cells (100 ul total volume). Briefly vortexand take 10 ul of stained cells to count using a double-cell Neubauer hemocytometer counting chamber (0.1 mm;1/400 mmn2e)). (vii) Use cell counts to calculate the volume of solution containing 10,000 cells, and divide them into aliquots in 1.5-mlEppendorf tubes. (viii) Centrifuge the cells at 200g for 10 min in a prechilled microcentrifuge (4°C), and discard the supernatant in liquidVirkon (1%, wt/vol). ▲0CRITICAL STEP Be careful not to disturb the cell pellet. If it is difficult to see, make a note of the Eppendorf tubeorientation while it is in the centrifuge, and ensure that the supernatant is carefully removed from the opposite sideof the tube to the direction of the centrifugal force. (ix) Resuspend and wash the cells in 1 ml of low-ionic buffer (i.e., sucrose/bicine) to remove excess salt. ▲(CRITICAL STEP Buffer salt concentrations used with SFM plus physiological low-growth-factor cocktail exceedthe maximum salt tolerance of the cIEF platform (150 mM), which results in poor protein separation in the capillary(Supplementary Video 1). ?TROUBLESHOOTING (x) Centrifuge the washed cells at 200g for 10 min at room temperature and discard the supernatant in liquidVirkon (1%, wt/vol). Invert the tubes on tissue paper to remove excess liquid, and dry them for 20 s.▲CRITICAL STEP It is essential that liquid carryover be avoided at this point, as excess wash buffer will reduce lysisefficiency and dilute the final sample concentration. ?TROUBLESHOOTING (xi) Immediately add 5 ul of Lysis buffer, gently vortex the mixture for 10 s and incubate it on ice for 15 min. Sonicate thecells for 10 s, gently vortex them for 10 s and return them to ice for a further 15 min. Repeat gentle vortexing andincubation two more times. (xii) Centrifuge the cells in a prechilled benchtop microcentrifuge for 15 min at 4 °C and 10,000g. Remove the supernatantand place it in a fresh 0.5-ml microtube. Discard the pellet. PAUSE POINT Samples can be snap-frozen and stored at -80 °C until required (>1 year). PROTOCOL Figure 2|Assay plate design. The differentaspects of assay plate design. (a) 384-well platelayout defines the locations for sample, antibodyand chemiluminescence reagent with color-codedrows. The rows can be positioned anywhere onthe plate, although row blocks (12 wells) mustbe placed between columns 1 and 12 or 13 and24, not centrally (i.e., 6-18). Chemiluminescencereagent must be located two rows from the HRP-conjugated antibody. (b) Compass automaticallycreates a template corresponding to the layout,which allows the user to populate individual wellsor whole rows with relevant sample, antibody orreagent information. This is used later for assayanalysis. (c) Anticipated results for high and lowphosphorylation status (specifically n5-8/L3)for CrkL using K562 and HL60 cell line models,respectively. cIEF (general procedure)● TIMING 3 h, with subsequent overnight assay 2| Design a suitable assay template. We use the Assay Perspective’in Compass (Fig. 2), which allows for selection of sample number and well locations together with primary and secondary antibodies (two-step experiment), or we use primary, secondary andtertiary antibodies (a three-step experiment using biotin-conjugated secondary antibody coupled to streptavidin-conjugatedHRP for increased sensitivity). In both two- and three-step experiments, the chemiluminescent reagent location and wellnumber are also defined at this stage. Once an assay plate has been designed, the system must be programmed to allow theautomated robotics to collect the samples, antibodies and chemiluminescent reagent in the correct order. 3|Make up SSD inhibitor mix solution stock as required. Keep it on ice when in use. 4 Make up G2 premix/ladder stock (PLS; see tables below for volumes defined for up to four cycles). When preparing thestock, always round up to the nearest whole-number volume of the ladder to be used. Make up a minimum volume of50 ml of PLS stock, as accurate pipetting of <1-ul ladder is difficult to achieve. For samples undergoing >4 cycles, double thevolumes involved. ▲ CRITICAL STEP A reverse pipetting technique is essential at this point. The premix solution is extremely viscous anddifficult to pipette; to ensure that the correct volume is used, displace the solution three times from the tip before reversepipetting. ▲ CRITICAL STEP 卜Keep the solution at RT to minimize viscosity. Stock Ampholyte range (pH) Standard ladder Broad-standard 3-10 Standard ladder 1 (pI4, 4.9, 6.0, 6.4 and 7.3) Narrow-low 4-7 Standard ladder 2 (pI 4.2, 4.9, 6.0, 6.4 and 7.0) Narrow-mid 5-8 Standard ladder 3 (pI 4.9, 6.0, 6.4, 7.0 and 7.3) Narrow-nested 5-8 (2-4 plug, nested) Standard ladder 3 (pI 4.9, 6.0, 6.4, 7.0 and 7.3) Narrow-focused 5-6 Standard ladder 4 (pI 4.9, 5.5 and 6.0) Broad-modified High pI protein; 3-10 (broad) Extended (custom) ladder (L1 + pI 8.4 and 9.7) Focused high pH High pI protein; 5-8(80%)/3-10 (20%) Extended (custom) ladder (L1 + pI 8.4 and 9.7) Total volume PLS (30% excess required) Wells (sample, SDD and PLS) Sample and SDD PLS Premix (ul) Ladder (ul) Total (pl) 10 2.5 7.5 49.0 1.0 50.0 2 20 5.0 15.0 3 30 7.5 22.5 4 40 10.0 30.0 5 50 12.5 37.5 6 60 15.0 45.0 57.5 1.0 58.5 7 70 17.5 52.5 66.3 2.0 68.3 8 80 20.0 60.0 76.0 2.0 78.0 9 90 22.5 67.5 86.8 2.0 87.8 10 100 25.0 75.0 95.5 2.0 97.5 11 110 27.5 82.5 105.3 2.0 107.3 12 120 30.0 90.0 116.0 2.0 117.0 5Dilute a 2 ug/ul sample stock at a 1:5 ratio with SSD, using volumes defined in the table in Step 4. Vortex the stocksolution briefly to mix, and keep it on ice. CRITICAL STEP For finite cell numbers (<5,000 cells), mix the lysate at a 1:1 ratio with SSD to avoid overdilution. 6i(Combine the sample from Step 5 with the appropriate PLS volume and vortex to mix. CRITICAL STEP Vortex the sample for a minimum of 20 s, ensuring that a vortex forms in the sample solution. A faint pinkcolorshould be observed after this. 7[Load 8 ul per well immediately and keep the plate on ice. ? TROUBLESHOOTING 8| Dilute the primary antibodies using antibody diluent. Vortex briefly and Load 8 ul of antibody per well for samplesundergoing <4 cycles (double load volume for samples undergoing >4 cycles). ? TROUBLESHOOTING 9[Dilute secondary biotin antibodies and tertiary streptavidin-conjugated HRP antibodies at a 1:100 ratio withantibody diluent. Vortex briefly and load 8 ul of antibody per well for samples undergoing ≤4 cycles (double Load volumefor >4 cycles). CRITICAL STEP The biotin-streptavidin system must be used in conjunction with a three-step assay (see Step 2). ? TROUBLESHOOTING 10| Prepare 150 ul of peroxide XDR and Luminol in a 1:1 ratio, and load 8 ul per well for samples undergoing 4 cycles(double the load volume for >4 cycles). CRITICAL STEP Keep the chemiluminescent reagent at least two rows away from streptavidin-conjugated HRP(normal position is row J; Fig.2). 11| Once the samples and reagents are loaded onto the plate, replace the lid and centrifuge at 1,000g for 10 min.CCRITICAL STEP After plate centrifugation, visually inspect the wells to ensure that no bubbles are present in the samplewells. Use a spare capillary to rupture them if any bubbles exist. Air bubbles trapped inside a capillary will prevent sampleseparation (breaks electrical current). ? TROUBLESHOOTING PROTOCOL 12| Replace ultrapure water reservoir and empty waste reservoir (decontaminate as required). 0pen the Compass and run acleanup cycle (Instrument → Cleanup→0K). Cleanup takes ~10 min to complete. l CRITICAL STEP Ensure that all capillaries have been removed from the reagents tray before running the cleanup, as thesystem will move any unused capillaries to waste, which is unnecessary (opened, unused capillaries can be placed in dark,moisture-free storage for later use). 13| Once the cleanup cycle has been completed, select Assay Perspective’ in Compass and open the assay file. Check thateach cycle is picking up the correct sample and antibody combinations before clicking START. After pressing START, Compasswill prompt you to save settings if any unsaved changes have been made to the assay file. It will not be possible to proceedwithout saving. 14| Follow onscreen instructions, which should prompt you to replace water and empty waste, and to replace the sponge. ? TROUBLESHOOTING 15| Replace or top up the wash concentrate, anolyte and catholyte buffers in the reagents tray. Load the capillaries. CRITICAL STEP Reagent buffers can be topped up over a 48-h period; however, they should be regularly replaced and thecontainers should be washed in ultrapure water. ? TROUBLESHOOTING 16| Place the plate onto a cooled sample tray. CRITICAL STEP Ensure that the lid is on, as the system will not run without a plate lid. 17 Select the suitable location to save the data after the run has been completed, and click START. The Compass willautomatically switch to Run Perspective’ and provide an estimated time of completion, together with a pictorial breakdownof each cycle and a live camera feed of the separation, including the fluorescence ladder. 18| Upon completion, Compass will create a data file containing the original assay file, run summary information and video,together with the results data. Compass will automatically switch to Analysis Perspective’at this point in preparation fordata analysis. l PAUSE POINT Results can be analyzed at a time point of your choice. Assay controls—sample phosphatase treatment plus secondary antibody and streptavidin cross-reaction TIMING3plus overnight assay ▲ CRITICAL The following section describes methods for assay controls to confirm phosphorylate peaks using A phosphatasetogether with cross-reaction controls for secondary antibodies and/or tertiary streptavidin-HRP depending upon whichapproach is taken (two- or three-step approach; Step 2). 19| Thaw the phosphatase kit on ice. 20| In a fresh 0.5-ml microtube, dilute 1.25 ul of 1 M DTT with 25 pl of 10x reaction buffer. 21| Transfer 8 ul of lysate (2 mg/ml) into a fresh 0.5-ml microtube and add 1 ul of 入 phosphatase together with 1 ul ofdiluted DTT made in Step 32. Vortex briefly to mix, and pulse-centrifuge the mixture (10 s at 16,100g). Assessing both K562and HL60 samples treated with TKI provides a detailed analysis of the phosphorylation profile for CrkL, both in the presenceand absence of oncogenic tyrosine kinase activity. 22|Incubate the samples at 37 °C in a water bath for 60 min. 23 Remove the samples and place them on ice. 24| Process the samples as described in Steps 2-18 using the assay plate design shown in Supplementary Figure 1. Dephosphorylation and antibody controls should be applied as follows: Sample Primary antibody Secondary-biotin Streptavidin-HRP Bicine/CHAPS+ PLS X X X X X X Sample + PLS X X X X X X A sample+ PLS X X X X X X A only + PLS X X X X X X cIEF (assay development) TIMING variable (expect 1-8 weeks) ▲CRITICAL Development of a fully optimized protocol for a new assay is essential to ensure reproducible peak detectionwith a linear range of protein and antibody concentration. To facilitate this, UV-binding efficiency must be determined alongwith suitable pI and CID ranges. 25| Select a cell line known to undergo TKI-mediated phosphorylation (positive control) and another cell line known todefinitely not undergo TKI-mediated phosphorylation (negative control). Cell pellets should be acquired and lysates shouldbe prepared as in Step 1A(viii-x and xvi-xix). For CrkL, we use lysates from K562 and HL60 cell lines as positive andnegative controls, respectively. ? TROUBLESHOOTING 26| Determine the predicted pI for the target protein using a suitable proteomics database. For CrkL, the basal pI is 6.26,although high phosphorylation shift to pI 3.57 is possible (http://www.phosphosite.org/; ref. 43). 27| Use default assay settings with a simple assay plate design (Fig.2) together with a broad PLS (Table 1) to ensuredetection of protein peaks that might occur outside of the predicted pI range. ?TROUBLESHOOTING 28| Use the Compass software to determine the extreme pIs for phosphorylated and nonphosphorylated protein peaks.CCRITICAL STEP With this information, a suitable ampholyte range can be determined, together with a correspondingstandards ladder (Step 4). For CrkL, use a nested pI 5-8 premix coupled with ladder 3. 29 As the immobilization period can vary between proteins and must be titrated to maximize signal intensity, performa UV titration assay between 80 and 110 s with measurements taken at 10-s intervals, keeping all other parametersas default. PROTOCOL TABLE 1| Default assay settings. Figure 3| Assay development process forCrkL antibody. The assay development processconsiders factors such as UV immobilization,antibody sensitivity, dynamic range and limitof detection. (a) UV titration profiles for CrkLisoforms using K562 lysate (0.1 ug/ml) probedwith CrkL antibody (1:50 dilution; 480 minincubation; 240 s chemiluminescence exposure(CIE)) after 80 s (red), 90 s (blue),100 s (green)and 110 s (orange) UV exposure. Inset bar chartshows the mean AUC (n=3), with standard errorfor UV-exposure time points. (b) CrkL antibodysensitivity titration against K562 cells (0.1 ug/ml; b 960 s 720 s 1:25 110 JM 480 s 1:50 AM AA240 s pl 120s 1:1000寸5coc 240 s CIE) with the spectrum represented atop the capillary image for each dilution factor.(c) Dynamic range shows CIE overexposure effects probing K562 lysate (0.4 ug/ml) with CrkLantibody (1:100), represented as spectra and capillary CCD images at given time points (s).(d) LOD for CrkL assay probed using optimized conditions (100 s UVB; 240 min incubation;1:100 antibody dilution) against K562 cell lysates with a protein titration of 80, 40, 20, 12, 4,1 and 0.5 pg/nl total lysate shown. RU, relative units. 60 s 1:200 AM 30s xcw1:40010 s 人 分 pl pl d250 31| By using the pI range and immobilization period determined in Step 28, performprimary antibody titration against the default protein concentration (0.1 mg/ml), andprobe for 240 min at the following antibody dilutions: 1:10, 1:25,1:50,1:100, 1:200and 1:400 using antibody diluent solution (Fig.3b). A nonspecific peak can bedetected at pI 6.8 with antibody dilutions <1:50. Optimal peak profile detection 200 150 R2=0.9896 0 0 20 40 60 80 Protein (pg/nl) (pI 4.5-7) is usually achieved with the 1:100 primary antibody dilution at 240 min, which is a sufficient incubation periodfor Low-signal material. ? TROUBLESHOOTING 32| Detect chemiluminescence over exposure limits using a 0.4 mg/ml protein concentration (optimized pI,immobilization and antibody settings applied). This concentration of protein will be sufficient to cause overexposurein the majority of cases, and it should not be protein dependent. Quantifiable signal is detectable within 10-240 sof CID within a range of pI 4.5-6.0 for CrkL (this range will be protein dependent), meaning that CID duration canbe increased for clinical samples with weaker observed signals. Overexposure can be seen within the rangeof pI 4.5-5.5 after 240 s of CID (Fig. 3c). 33 Under optimized conditions, determine the protein LOD with an on-capillary protein concentration ranging from 16 to0.0156 ug. ▲_ CRITICAL STEP Different CID periods can be used to either minimize signal burnout or to maximize protein detection. 34| Calculate the AUC, as in Step 26. For a serial dilution of K562 lysates, as little as 1.6 ng of total protein on capillary canbe used to reliably detect CrkL (Fig. 3d). This value is equivalent to 0.005% of the starting material (1x10⁶ K562 cells) percapillary (R2=0.9896), with a linear range of detection up to 32 ng of total protein. Intercycle and intracycle reprYPYoducibilityis high, with a coefficient of variation (CV) of 2.59 and 6.07, respectively. ▲CCRITICAL STEP LOD is assay-specific, and it is dependent on the function of the protein target together with the antibodyused. For example, total-AKT has an LOD of 10 ng of total protein, which is insufficient for the analysis of patient samplescontaining <104 cells. A minimum 4.8-ng LOD is required for analysis of these sample types. ? TROUBLESHOOTING Troubleshooting advice can be found in Table 2. TABLE 2| Troubleshooting table. Step Problem Possible reason Solution TIMING Step 1A(i-xii), thawing and passaging of K562 and HL60 cell lines: 1-2 weeks, depending upon the cell recovery timeStep 1A(xiii-xix), TKI treatment, collection and Lysis of K562 and HL60 cells: 8 h Step 1B(i-xii), sample preparation of primary material: 8 h Steps 2-18, cIEF (general procedure): 3 h, with subsequent overnight assay on NanoPro 1000 (~4-15 h) Step 19-24, sample phosphatase treatment plus secondary antibody and streptavidin cross-reaction: 3 h, plus overnightassay using NanoPro 1000 (~4-15 h) Step 25-34, cIEF (assay development): 1-8 weeks, depending on the target protein Note that overnight assay using the NanoPro 1000 will take 4-15 h. The precise duration will mainly depend on the numberof samples processed and the setting used for antibody incubation, although other settings such as UV exposure will havea small effect on duration. For example, an assay processing four samples in triplicate (12 sample wells in total; assumethat the samples reflect necessary controls) probed with primary antibody for 120 min and subsequently processed using athree-step assay (Step 2) and 10 CID exposures would take ~4 h to complete, after the plate has been set up by the user.Increasing the number of samples and/or the antibody incubation period will increase the time taken for an assay. However,it is worth noting that the NanoPro 1000 runs samples in sets of 12, known as one cycle. The system is capable of runningcycles simultaneously, so running 24 samples takes ~5 h rather than 8 h. ANTICIPATED RESULTS Therapeutic use of TKIs has been effective for patients with several leukemias44-48. To determine the effect of PTK inhibitionon CrkL phosphorylation and to demonstrate the TKI inhibitor assessment potential of the approach, leukemogenicPTK-expressing cell lines were treated with IM and DAS (5 and 0.15 uM, respectively) for 5 h. Treatment with either IM orDAS caused a substantial increase in peaks above pI 5.9, which is characteristic of the HL60 control (Fig. 4a). Even with a well-characterized assay such as this, problems can present themselves that cause data analysis difficulties.Examples can include spectra mismatching caused by poor ladder detection by COMPASS (Supplementary Fig. 3a), resultingin spectra that are biologically comparable (as in the case of Fig. 4a) or identical technical replicates not aligning as theyshould. This can be easily remedied by manually assigning the ladder values for the mismatched capillaries, instead of relyingon Compass-automated detection (Supplementary Fig. 3b). The user can save considerable time and effort by manuallychecking that automated ladder associations are correct before undertaking detailed analysis of spectral data. Weak, noisy ordistorted spectra generated from carefully prepared cell line material can occur in older samples that have undergone freeze-thaw cycles. cIEF is particularly sensitive to protein instability, especially as phosphorylation events can be unstable duringfre ig and thawing (M.A.-O., A.P. and A.D.W., unpublished observations). Good laboratory practice can minimize these events,ensuring that multiple aliquots of each new sample are prepared in suitable volumes and stored at -80 °C until required.入 phosphatase treatment of K562 and HL60 samples ±TKI indicated that peaks detected below pI 5.9 were phosphorylated forms of CrkL (Supplementary Fig. 2). The CrkL protein has been observed with a total of 28 PTMs identified in MS experiments (http://www.phosphosite.org/); however, only pTyr207 has been validated (using a range of methods including western blotting, site-directed mutagenesis and flow cytometry30,49-54). Tyr207 phosphorylation has been shown to be the principle phosphorylation event related to BCR-ABL activity30. To assess the contribution of pTyr207 in the profile observed for Protein (pg/nl) total-CrkL, we probed untreated K562 samples with both anti-CrkL and anti-pTyr207 CrkL antibodies (Fig. 4b). The resultingprofiles overlay perfectly, suggesting that the highly acidicpeaks observed in the total-CrkL profile are indeed a resultof Tyr207 phosphorylation, in keeping with the use of CrkLprotein phosphorylation status as a surrogate marker for Figure 4| Assay development process for pTyr207-CrkL antibody. Theassay development process considers the antibody limit of detection,sensitivity to TKI and A phosphatase together with comparison withtotal-CrkL antibody. (a) Comparison of total-CrkL (blue) and pTyr207-CrkL(red) antibody profiles using untreated K562 lysate (0.1 ug/ml) probedwith suitable antibody (1:50 dilution; 480 min incubation; 240 s CIE).(b) pTyr207-CrkL antibody sensitivity to TKI changes in K562 cells(0.1 ug/ml; 240 s CIE), untreated control (black), 150 nM DAS (red) and5 uM IM (blue). (c) A phosphatase effect on untreated K562 cells probedwith total-CrkL (black) and pTyr207-CrkL (red) antibodies. (d) LOD forpTyr207-CrkL assay probed using optimized conditions (100 s UVB;240 min incubation; 1:100 antibody dilution) against K562 cell lysateswith a protein titration of 80, 40, 20, 12, 4, 1 and 0.5 pg/nl total lysateshown. All assays used 1:50 antibody dilution, 480 min primary incubation,240 s CIE and 0.1 ug/ml total protein, unless otherwise stated. Figure 5|Chemiluminescence data for DAS and IM drug treatmentsdisplaying phosphorylation profile shifts from control. (a) CrkL spectrafrom the human CML blast crisis K562 cell line (treated for 5 h with drug);blue circle and line denote DAS-mediated effect. (b) Spectra from patient-derived CML CD34+CD38+ committed progenitor cells (treated for 24 hwith drug). Black triangle and dashed line denote DAS-mediated effect.(c-f) Spectra from clinical CML CD34+CD38- primitive progenitor cells(treated for 24 h with drug). Black triangle and dashed line denoteDAS-mediated effect. Histograms representing percentage peak contributionanalysis for CrkL protein profiles from cell lines K562 (d; treated for 5 h,s.e.m., n =3 biological repeats), clinical CD34+CD38+ (e; treated for 24 h,s.e.m., n=3 patient samples) and clinical CD34+CD38- cells (f; treated for24 h, s.e.m., n=3 patient samples). DAS-mediated effect on K562 cells(blue circle) was pl 5.45. DAS-mediated peak changes (blue bar) were pl5.34-4.99. DAS-mediated effects on clinical samples (black triangle/dottedline) were pl 5.58-5.45. NDC, no-drug control. BCR-ABL kinase activity30,55,56. The effect of TKI on thepTyr207 profile demonstrates the superior capacity for DASto inhibit BCR-ABL and, by direct association, CrkLphosphorylation (Fig. 4b).A phosphatase treatment ofsamples used in Figure 4c shows a marked reduction inacidic peaks, with the anti-Tyr207 antibody failing to detectpeaks above pI 6, which are attributed to unphosphorylatedCrkL species (Fig.4c). The assay development for pCrkLTyr207, using the protocol defined here, demonstrated LOD Peak pl of 0.2 ng of total protein (R2= 0.9966) with a linear range of detection up to 32 ng of total protein (Fig. 4d). Reproducibility for the assay is excellent, with intercycle CV= 9.027 and intracycle CV = 9.27. It is worth noting that phospho-specificantibodies can generate spectra with 5-10-fold less intensity than the equivalent total protein, although this is not alwaysthe case. Direct comparison of spectra can be difficult when this occurs; however, modification of CID will aid in normaliza-tion of spectral intensities. The user must provide an adequate range of camera exposures during assay design to accommo-date for these antibody effects. Differences in spectra intensity do not affect percentage peak contribution analysis; how-ever, total AUC will be affected. Treatment with IM or DAS reduced the population of p-CrkL peaks between pI 4.5 and 5.8,with a corresponding increase in peaks above pI 5.9 (Fig. 5a), when probed with total-CrkL antibody. Potent DAS-mediatedchanges in the region of pI 5.5 could be seen when compared with IM (Fig.5a). These differential DAS-mediated changeswere also observed in the limited quantities of clinical CML CD34+CD38+ committed progenitor cells available for analysis(Fig. 5b), and again in primitive CML CD34+CD38- cells (Fig. 5c). Given the nature of these samples, the cIEF system ispushed to its operational limits in detecting changes in small numbers of stem cells. Poorly defined, noisy spectra can occurin clinical samples, whereas salt contamination seriously affects protein separation (compare Supplementary Videos 1 and 2).The protocol outlined here is designed to minimize the frequency of these events; however,on occasion, clinical samplescan be of poor quality, and they can yield little usable data despite the best efforts of those undertaking the research.To determine the value of the approach in quantification of differential drug effects, AUCs for individual peaks were plotted.Analysis of mapped peaks for K562 cells showed a stark contrast between treated and untreated samples (Fig. 5d). Both TKIsinduced marked decreases in pI distribution indicative of phosphorylation changes compared with control; however, DAS hadan effect at pI 5.45 (Fig. 5d, blue circle) that can be clearly seen. Furthermore, this DAS-specific effect extends to peaksdetected between pI 4.8 and 5.4 (Fig. 5d, blue line). In primary cells, peak contribution analysis displayed a similardifferential effect in both CD34+CD38+ and CD34+CD38- cells treated with IM and DAS (Fig. 5e,f, black triangle, dash).Thus, drug effect kinetics and dose response on limited cell populations can be achieved with this protocol in mouse and human cell lines and primary human stem cells. The ability of cIEF immunoassay technology to provide highly resolved,reproducible data on protein phosphorylation events at the nanogram level has previously been demonstrated1,2. Here wedescribe how to use the next-generation cIEF immunoassay platform, which has multichannel capacity, to probe pI proteinprofiles related to protein phosphorylation. This can be used to investigate LOD from a complex biological sample as a func-tion of observed AUC-type measurements. This provides relative quantification of observed AUC as a function of total protein,which cannot be determined using a statistical definition of LOD based on recombinant protein detection2. In the exampleapplication we present here, profiles of a key marker for oncogenic PTK activity in response to TKI treatment in CML cellsper capillary were achieved, allowing 0.1% of sample containing <10,000 cells to be processed per assay, building on earlierwork involving the protein tyrosine phosphatase PTPRC/CD45, in which we used this protocol to assay the levels of pS962 PTPRC/CD45 in CML and normal CD34* patient samples. Assay development for PTPRC/CD45 was again developed inaccordance with our protocol (Supplementary Fig.1), displaying an LOD down to 1.6 ng of total protein with interassay andintra-assay CV of 7.82 and 4.41, respectively. Our work has enabled differential effects of inhibitors on CrkL to be recorded in a format that lends itself to high-throughput use on extremely low-availability cell populations from clinical trials or patients at presentation (for drugscreening before decisions on appropriate therapy). We have demonstrated the system's ability to directly target proteins ofinterest in very small samples (<104 cells), without the need for larger quantities of starting material, recombinant proteinexpression (to define LOD) or validation in cell lines, and the inference for further use is clear. The procedure we have usedin relation to primary patient material is well documented for the study of TKI effects, and as such it applies to a wideraudience, given the likelihood of access to biobanked primary cell material. This builds on earlier published work usingCML patient material5,6, and makes a case for focusing this technology toward personalized medicine, for use in assessingpatient stratification (in selecting suitable TKI treatment) or in potentially monitoring the development of drug resistance inpatients undergoing chemotherapy for CML. Nevertheless, users need to be aware of the limitations of the technology.The presence of reproducibly detectable changes in protein profiles can support patient stratification (perhaps in terms oftreatment); however, such complex spectra, while being very informative, also pose complex biochemical questions relatingto the origin of observed peaks. Note:Any Supplementary Information and Source Data files are available in theonline version ofthe paper. ACKNOWLEDGMENTS This work was supported by Leukaemia and LymphomaResearch UK (08004 to F.P., M.T.S. and T.L.H.), Cancer Research UK(C11074/A11008 to F.P., M.T.S. and T.L.H.) and the Chief Scientist Office(CZB/4/690 to F.P., M.T.S. and T.L.H.), and also by the Glasgow and ManchesterExperimental Cancer Medicine Centres, which are funded by Cancer Research UKand the Chief Scientist Office in Scotland. AUTHOR CONTRIBUTIONS A.D.W. and T.L.H. devised the study; M.A.-0.performed the experimental and study design and wrote the manuscriptwith A.D.W.; A.P. contributed to study design and instrument setup; F.P. andM.T.S. prepared clinical material; A.J.W. provided the Src inhibitor; and allauthors contributed experimental methods and reviewed the manuscript. COMPETING FINANCIAL INTERESTS The authors declare no competing financialinterests. Reprints and permissions information is available online at http://www.nature.com/reprints/index.html. 1. O'Neill, R.A. et al. Isoelectric focusing technology quantifies proteinsignaling in 25 cells. Proc. Natl. Acad. Sci. USA 103, 16153-16158(2006). 2. Fan, A.C. et al. Nanofluidic proteomic assay for serial analysis ofoncoprotein activation in clinical specimens. Nat. Med. 15, 566-571(2009). ( 3. M aiso, P. e t al. Defining the r ole of TORC1/2 in multiple m y eloma. Blood 118, 6860-6870 ( 2011). ) ( 4. Kentsis, A. e t a l. Autocrine activation o f t h e MET receptor tyr o sine kin a sein a cute m yeloid l eukemia. Nat. M ed. 1 8 , 1 1 18-1122 (2012). ) ( 5. Williamson, A.J.K. et al . A specifi c PTPRC/CD45 phosphorylation eventgoverned by stem c e ll chemokine CXCL12 re g ulates pr i mitivehematopoietic cell motility. Mol . Cel l . Proteom . 12 , 3319-3329 (2013). ) ( 6. B rown, S. et al. M onocyte-derived dendritic cells f r om c h ronic myeloidleukaemia have abnormal maturation and cy t oskeletal function that is associated w ith d efective l ocalisation and signalling by normal ABL1 p rotein. Eur. J. Haematol. 93, 96-102 ( 2 014). ) ( 7. Al-Hajj, M., Wicha, M .S., B enito-Hernandez, A. , Morrison, S.J. & Clarke, M.F. Prospective i dentification of t umorigenic breast c a ncer c e lls. Proc. Natl. Acad. Sci. USA 100, 3983-3988 (2003). ) 8. Li, C. et al. Identification of pancreatic cancer stem cells. Cancer Res. 67,1030-1037(2007). 9. Prince, M. et al. Identification of a subpopulation of cells with cancerstem cell properties in head and neck squamous cell carcinoma.Proc. Natl. Acad. Sci. USA 104, 973-981(2007). 10. Mitelman, F., Johansson, B. & Mertens, F. The impact of translocationsand gene fusions on cancer causation. Nat. Rev. Cancer 7, 233-245(2007). 11. Sanz, M., Burnett, A., Lo-Coco, F. & Lowenberg, B. FLT3 inhibition as atargeted therapy for acute myeloid leukemia. Curr. Opin. Oncol. 21,594-600 (2009). 12. Verstovsek, S. Therapeutic potential of JAK2 inhibitors. Hematol. Am. Soc.Hematol. Educ. Prog. 2009, 636-642 (2009). 13. Rowley, J.D. Letter: a new consistent chromosomal abnormality in chronicmyelogenous leukaemia identified by quinacrine fluorescence and Giemsastaining. Nature 243, 290-293 (1973). 14. Groffen, J. et al. Philadelphia chromosomal breakpoints are clusteredwithin a limited region, bcr, on chromosome 22. Cell 36, 93-99 (1984). 15. Druker, B.J. et al. Effects of a selective inhibitor of the Abl tyrosine kinaseon the growth of Bcr-Abl-positive cells. Nat. Med. 2, 561-566 (1996). 16.G(ambacorti-Passerini, C. et al. Inhibition of the ABL kinase activityblocks the proliferation of BCR/ABL+ leukemic cells and induces apoptosis.Blood Cells Mol. Dis. 23, 380-394 (1997). 17. Hamilton, A. et al. BCR-ABL activity and its response to drugs can bedetermined in CD34+ CML stem cells by CrkL phosphorylation status usingflow cytometry. Leukemia 20, 1035-1039 (2006). 18. Copland, M. et al. Dasatinib (BMS-354825) targets an earlier progenitorpopulation than imatinib in primary CML but does not eliminate thequiescent fraction. Blood 107, 4532-4539 (2006). 19. Hochhaus, A. et al. Six-year follow-up of patients receiving imatinibfor the first-line treatment of chronic myeloid leukemia. Leukemia 23,1054-1061(2009). 20. Hochhaus, A. et al. Favorable long-term follow-up results over 6 years forresponse, survival, and safety with imatinib mesylate therapy in chronic-phase chronic myeloid leukemia after failure of interferon-o treatment.Blood 111, 1039-1043(2008). 21. 0'Hare, T., Zabriskie, M.S., Eiring, A.M. & Deininger, M.W. Pushing thelimits of targeted therapy in chronic myeloid leukaemia. Nat. Rev. Cancer12, 513-526 (2012). 22. Graham, S.M. et al. Primitive, quiescent, Philadelphia-positive stem cellsfrom patients with chronic myeloid leukemia are insensitive to STI571.Blood 99, 319-325 (2002). 23. Holtz, M.S. Imatinib mesylate (STI571) inhibits growth of primitivemalignant progenitors in chronic myelogenous leukemia through reversalof abnormally increased proliferation. Blood 99, 3792-3800 (2002). 24. Mahon, F.X. et al. Discontinuation of imatinib in patients with chronicmyeloid leukaemia who have maintained complete molecular remission forat least 2 years: the prospective, multicentre Stop Imatinib (STIM) trial.Lancet Oncol. 11, 1029-1035(2010). 25. Chu, S. et al. Persistence of leukemia stem cells in chronic myelogenousleukemia patients in prolonged remission with imatinib treatment. Blood118, 5565-5572 (2011). 26. Rousselot, P. et al. Imatinib mesylate discontinuation in patients withchronic myelogenous leukemia in complete molecular remission for morethan 2 years. Blood109, 58-60 (2007). 27. Druker, B.J. et al. Five-year follow-up of patients receiving imatinib forchronic myeloid leukemia. N. Engl. J. Med. 355, 2408-2417 (2006). 28. Addona, T.A. et al. Multi-site assessment of the precision and reproducibility of multiple reaction monitoring-based measurements ofproteins in plasma. Nat. Biotechnol. 27, 633-641 (2009). 29. Hjelle, S.M. et al. Clinical proteomics of myeloid leukemia. Genome Med.2,41(2010). 30. de Jong, R., ten Hoeve,J., Heisterkamp, N. & Groffen, J. Tyrosine 207 inCRKL is the BCR/ABL phosphorylation site. Oncogene 14, 507-513 (1997). 31. Seo, J.H. et al. A specific need for CRKL in p210BCR-ABL-inducedtransformation of mouse hematopoietic progenitors. Cancer Res. 70,7325-7335 (2010). 32. Konig, H. et al. Effects of dasatinib on SRC kinase activity anddownstream intracellular signaling in primitive chronic myelogenousleukemia hematopoietic cells. Cancer Res. 68, 9624-9633 (2008). 33. Oda, T. et al. Crkl is the major tyrosine-phosphorylated protein inneutrophils from patients with chronic myelogenous leukemia. J. Biol.Chem.269, 22925-22928 (1994). 34. Liu, X. et al. Constrained selected reaction monitoring: quantification ofselected post-translational modifications and protein isoforms. Methods61,304-312(2013). 35. Maxwell, S.A. et al. Analysis of p210bcr-abl tyrosine protein kinase activityin various subtypes of Philadelphia chromosome-positive cells from chronicmyelogenous leukemia patients. Cancer Res. 47, 1731-1739 (1987). 36. Copland, M., Hamilton, A. & Holyoake, T.L. Response: conventionalwestern blotting techniques will not reliably quantify p210 BCR-ABL.Blood 109, 1336 (2007). 37. Bendall, S.C. & Nolan, G.P. From single cells to deep phenotypes incancer. Nat. Biotechnol. 30, 639-647 (2012). 38. Irish, J.M. et al. Single-cell profiling of potentiated phospho-proteinnetworks in cancer cells. Cell 118, 217-228(2004). 39. Bendall, S.C., Nolan, G.P., Roederer, M. & Chattopadhyay, P.K. A deepprofiler’s guide to cytometry. Trends Immunol. 33, 323-332 (2012). 40.Hamilton, A., Alhashimi, F., Myssina, S., Jorgensen, H.G. & Holyoake, T.L.Optimization of methods for the detection of BCR-ABL activity inPhiladelphia-positive cells. Exp. Hematol. 37, 395-401 (2009). 41. Protein Simple, Inc. Application Brief, Vol.1023 http://www.proteinsimple.com/technical_library.html?product=simplewestern&def_list=list (ProteinSimple, 2010). 42. Hamilton, A. et al. Chronic myeloid leukemia stem cells are notdependent on Bcr-Abl kinase activity for their survival. Blood 119,1501-1511(2012). 43. Hornbeck, P.V. et al. PhosphoSitePlus: a comprehensive resource forinvestigating the structure and function of experimentally determinedpost-translational modifications in man and mouse. Nucleic Acids Res. 40,D261-D270 (2012). 44. Konopka, J.B., Watanabe, S.M. & Witte, O.N. An alteration of the humanc-abl protein in K562 leukemia cells unmasks associated tyrosine kinaseactivity. Cell 37, 1035-1042 (1984). 45. Golub, T.R., Barker, G.F., Lovett, M. & Gilliland, D.G. Fusion of PDGFreceptor B to a novel ets-like gene, tel, in chronic myelomonocyticleukemia with t(5;12) chromosomal translocation. Cell 77, 307-316 (1994). 46. Cools, J. et al. A tyrosine kinase created by fusion of the PDGFRAand FIP1L1 genes as a therapeutic target of imatinib in idiopathichypereosinophilic syndrome. N. Engl. J. Med. 348, 1201-1214 (2003). 47. Morris, S.W. et al. Fusion of a kinase gene, ALK, to a nucleolar proteingene, NPM, in non-Hodgkin’s lymphoma. Science 263, 1281-1284 (1994). 48. Nagata, H. et al. Identification of a point mutation in the catalyticdomain of the proto-oncogene c-kit in peripheral blood mononuclear cellsof patients who have mastocytosis with an associated hematologicdisorder. Proc. Natl. Acad. Sci. USA 92, 10560-10564 (1995). 49. Ziegler, S. et al. A novel protein kinase D phosphorylation site in thetumor suppressor Rab interactor 1 is critical for coordination of cellmigration. Mol. Biol. Cell 22, 570-580 (2011). 50. Shah, N.P. et al. Transient potent BCR-ABL inhibition is sufficient tocommit chronic myeloid leukemia cells irreversibly to apoptosis.Cancer Cell 14, 485-493 (2008). 51. Young, M.A. et al. Structure of the kinase domain of an imatinib-resistantAbl mutant in complex with the Aurora kinase inhibitor VX-680.Cancer Res. 66,1007-1014(2006). 52. Zipfel, P.A., Zhang, W., Quiroz, M. & Pendergast, A.M. Requirement for Ablkinases in T cell receptor signaling. Curr. Biol. 14, 1222-1231 (2004). 53. Uemura, N. & Griffin, J.D. The adapter protein Crkl links Cbl to C3G afterintegrin ligation and enhances cell migration. J. Biol. Chem. 274,37525-37532(1999). 54. Senechal, K., Heaney, C., Druker, B. & Sawyers, C.L. Structuralrequirements for function of the Crkl adapter protein in fibroblasts andhematopoietic cells. Mol. Cell Biol. 18, 5082-5090 (1998). 55. Nichols, G.L. et al. Identification of CRKL as the constitutivelyphosphorylated 39-kDa tyrosine phosphoprotein in chronic myelogenousleukemia cells. Blood 84, 2912-2918 (1994). 56. ten Hoeve, J., Arlinghaus, R.B., Guo, J.Q., Heisterkamp, N. & Groffen, J.Tyrosine phosphorylation of CRKL in Philadelphia+ leukemia. Blood 84,1731-1736 (1994). NATURE PROTOCOLS| VOL.N.| VOL.NO.| NATURE PROTOCOLS
确定
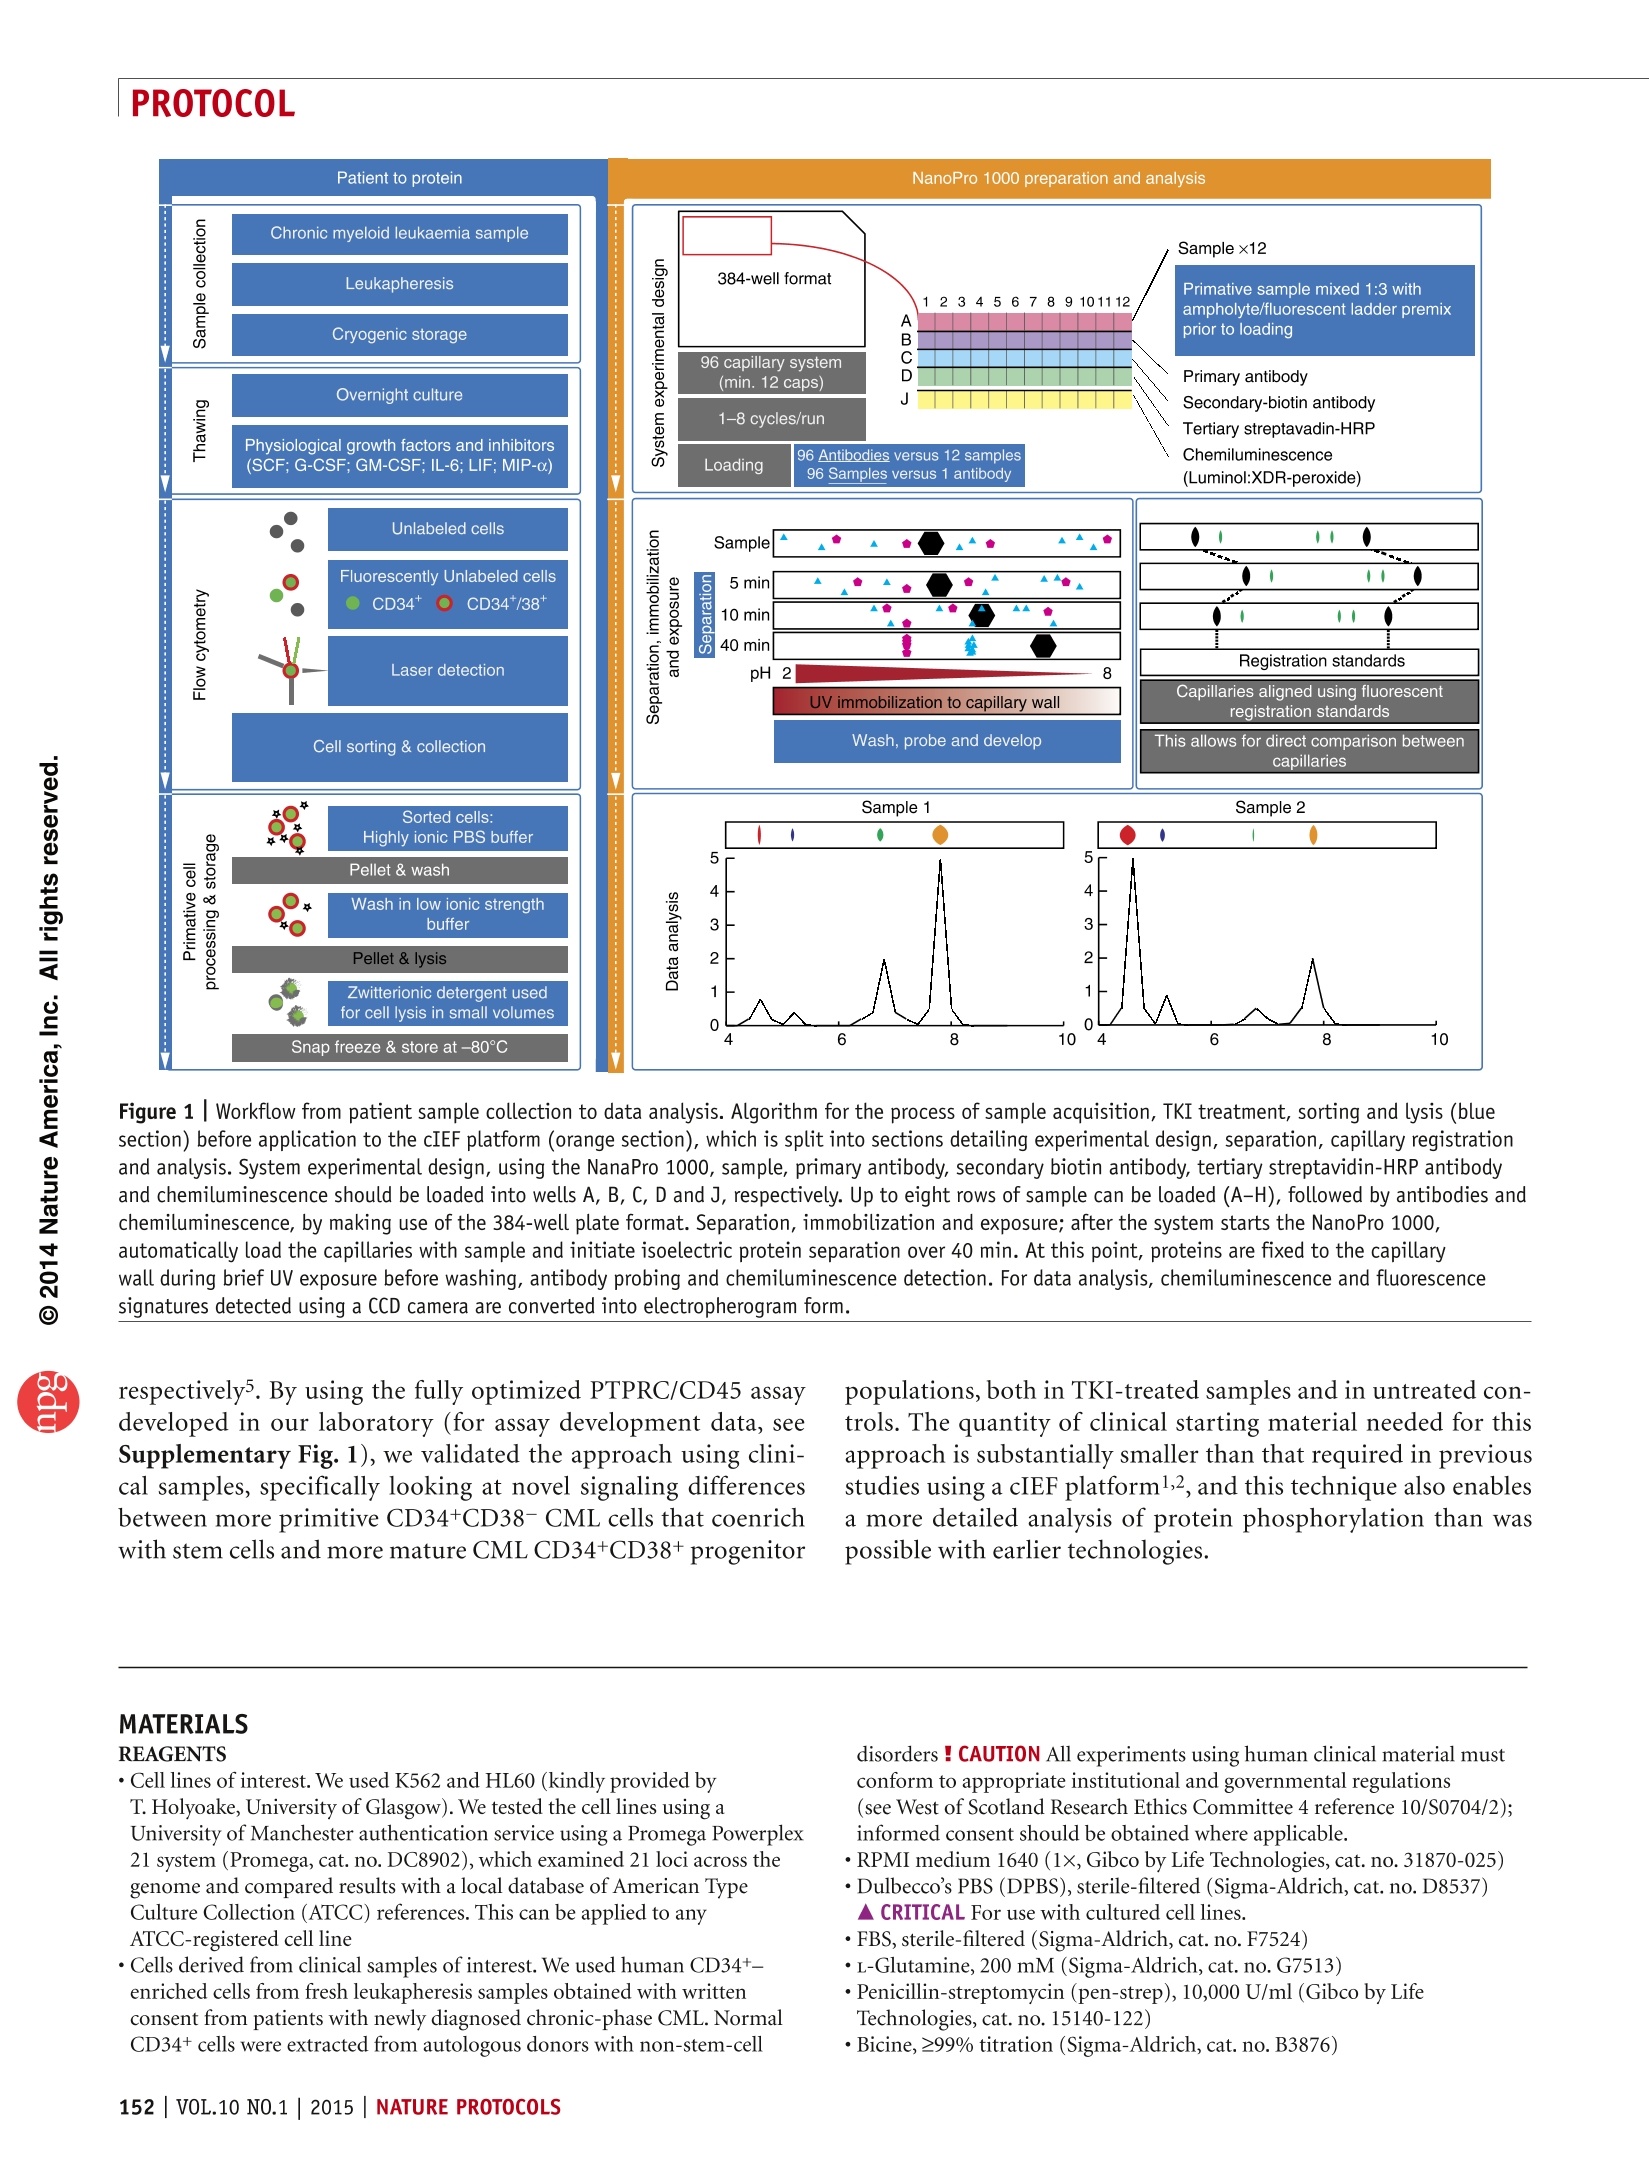
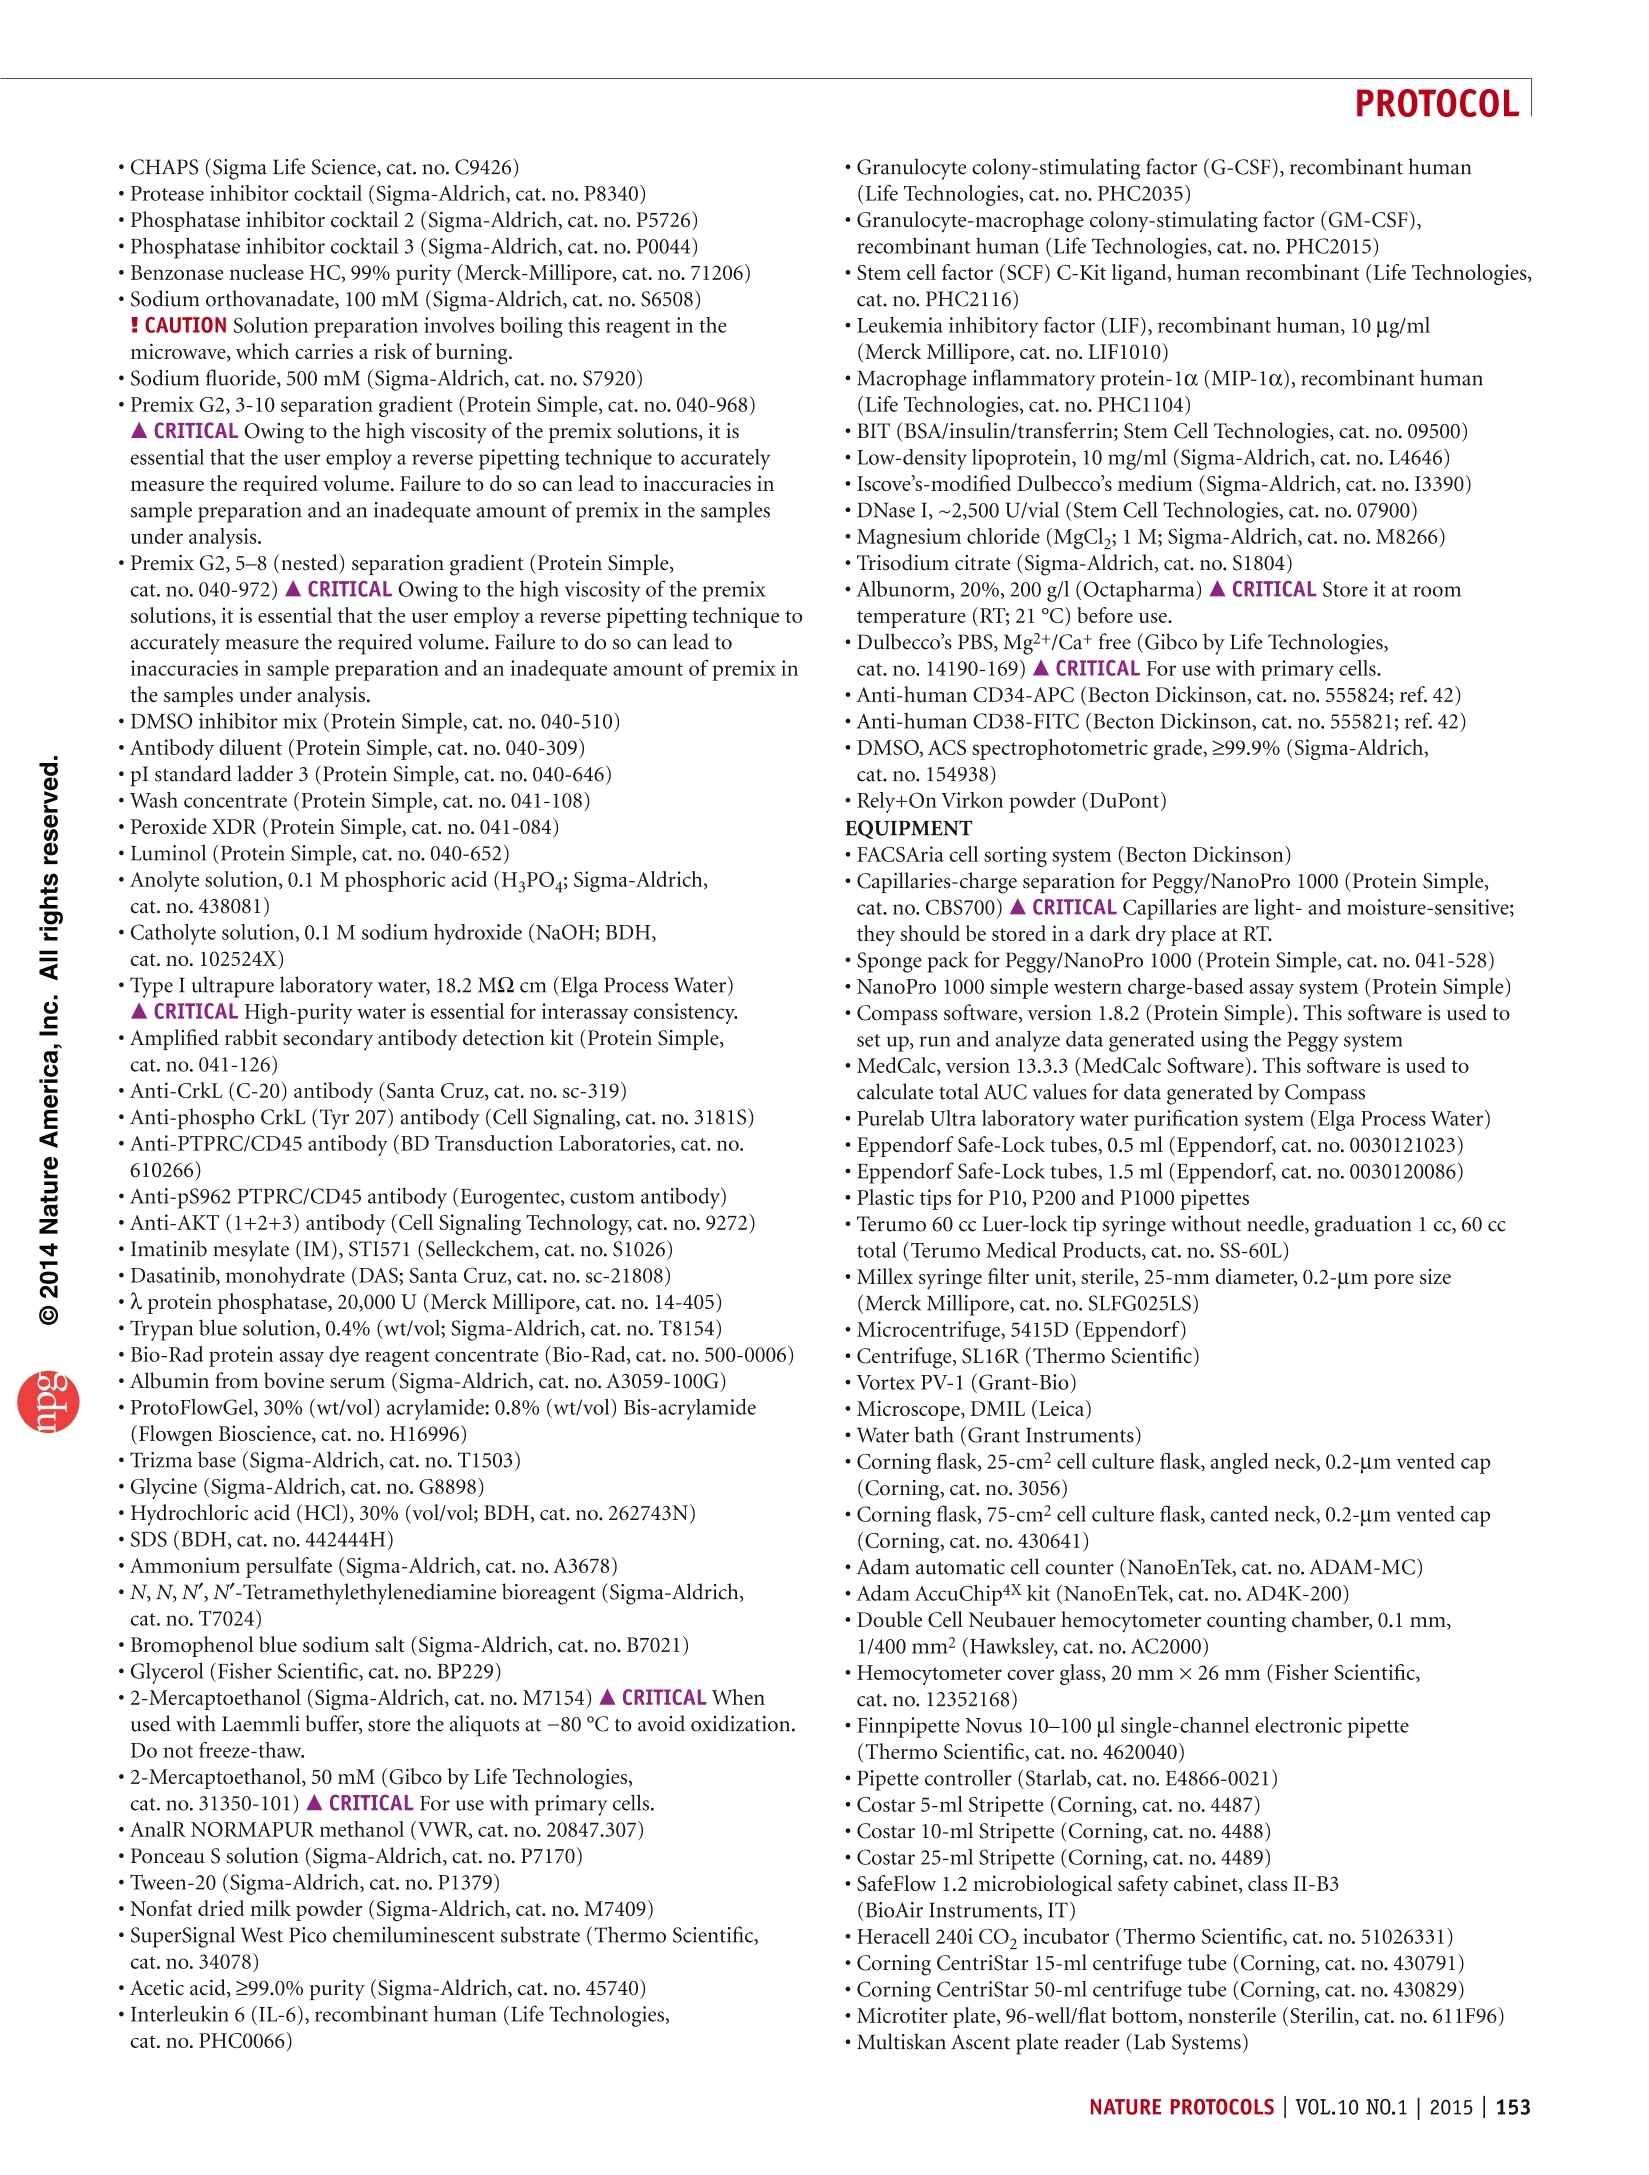
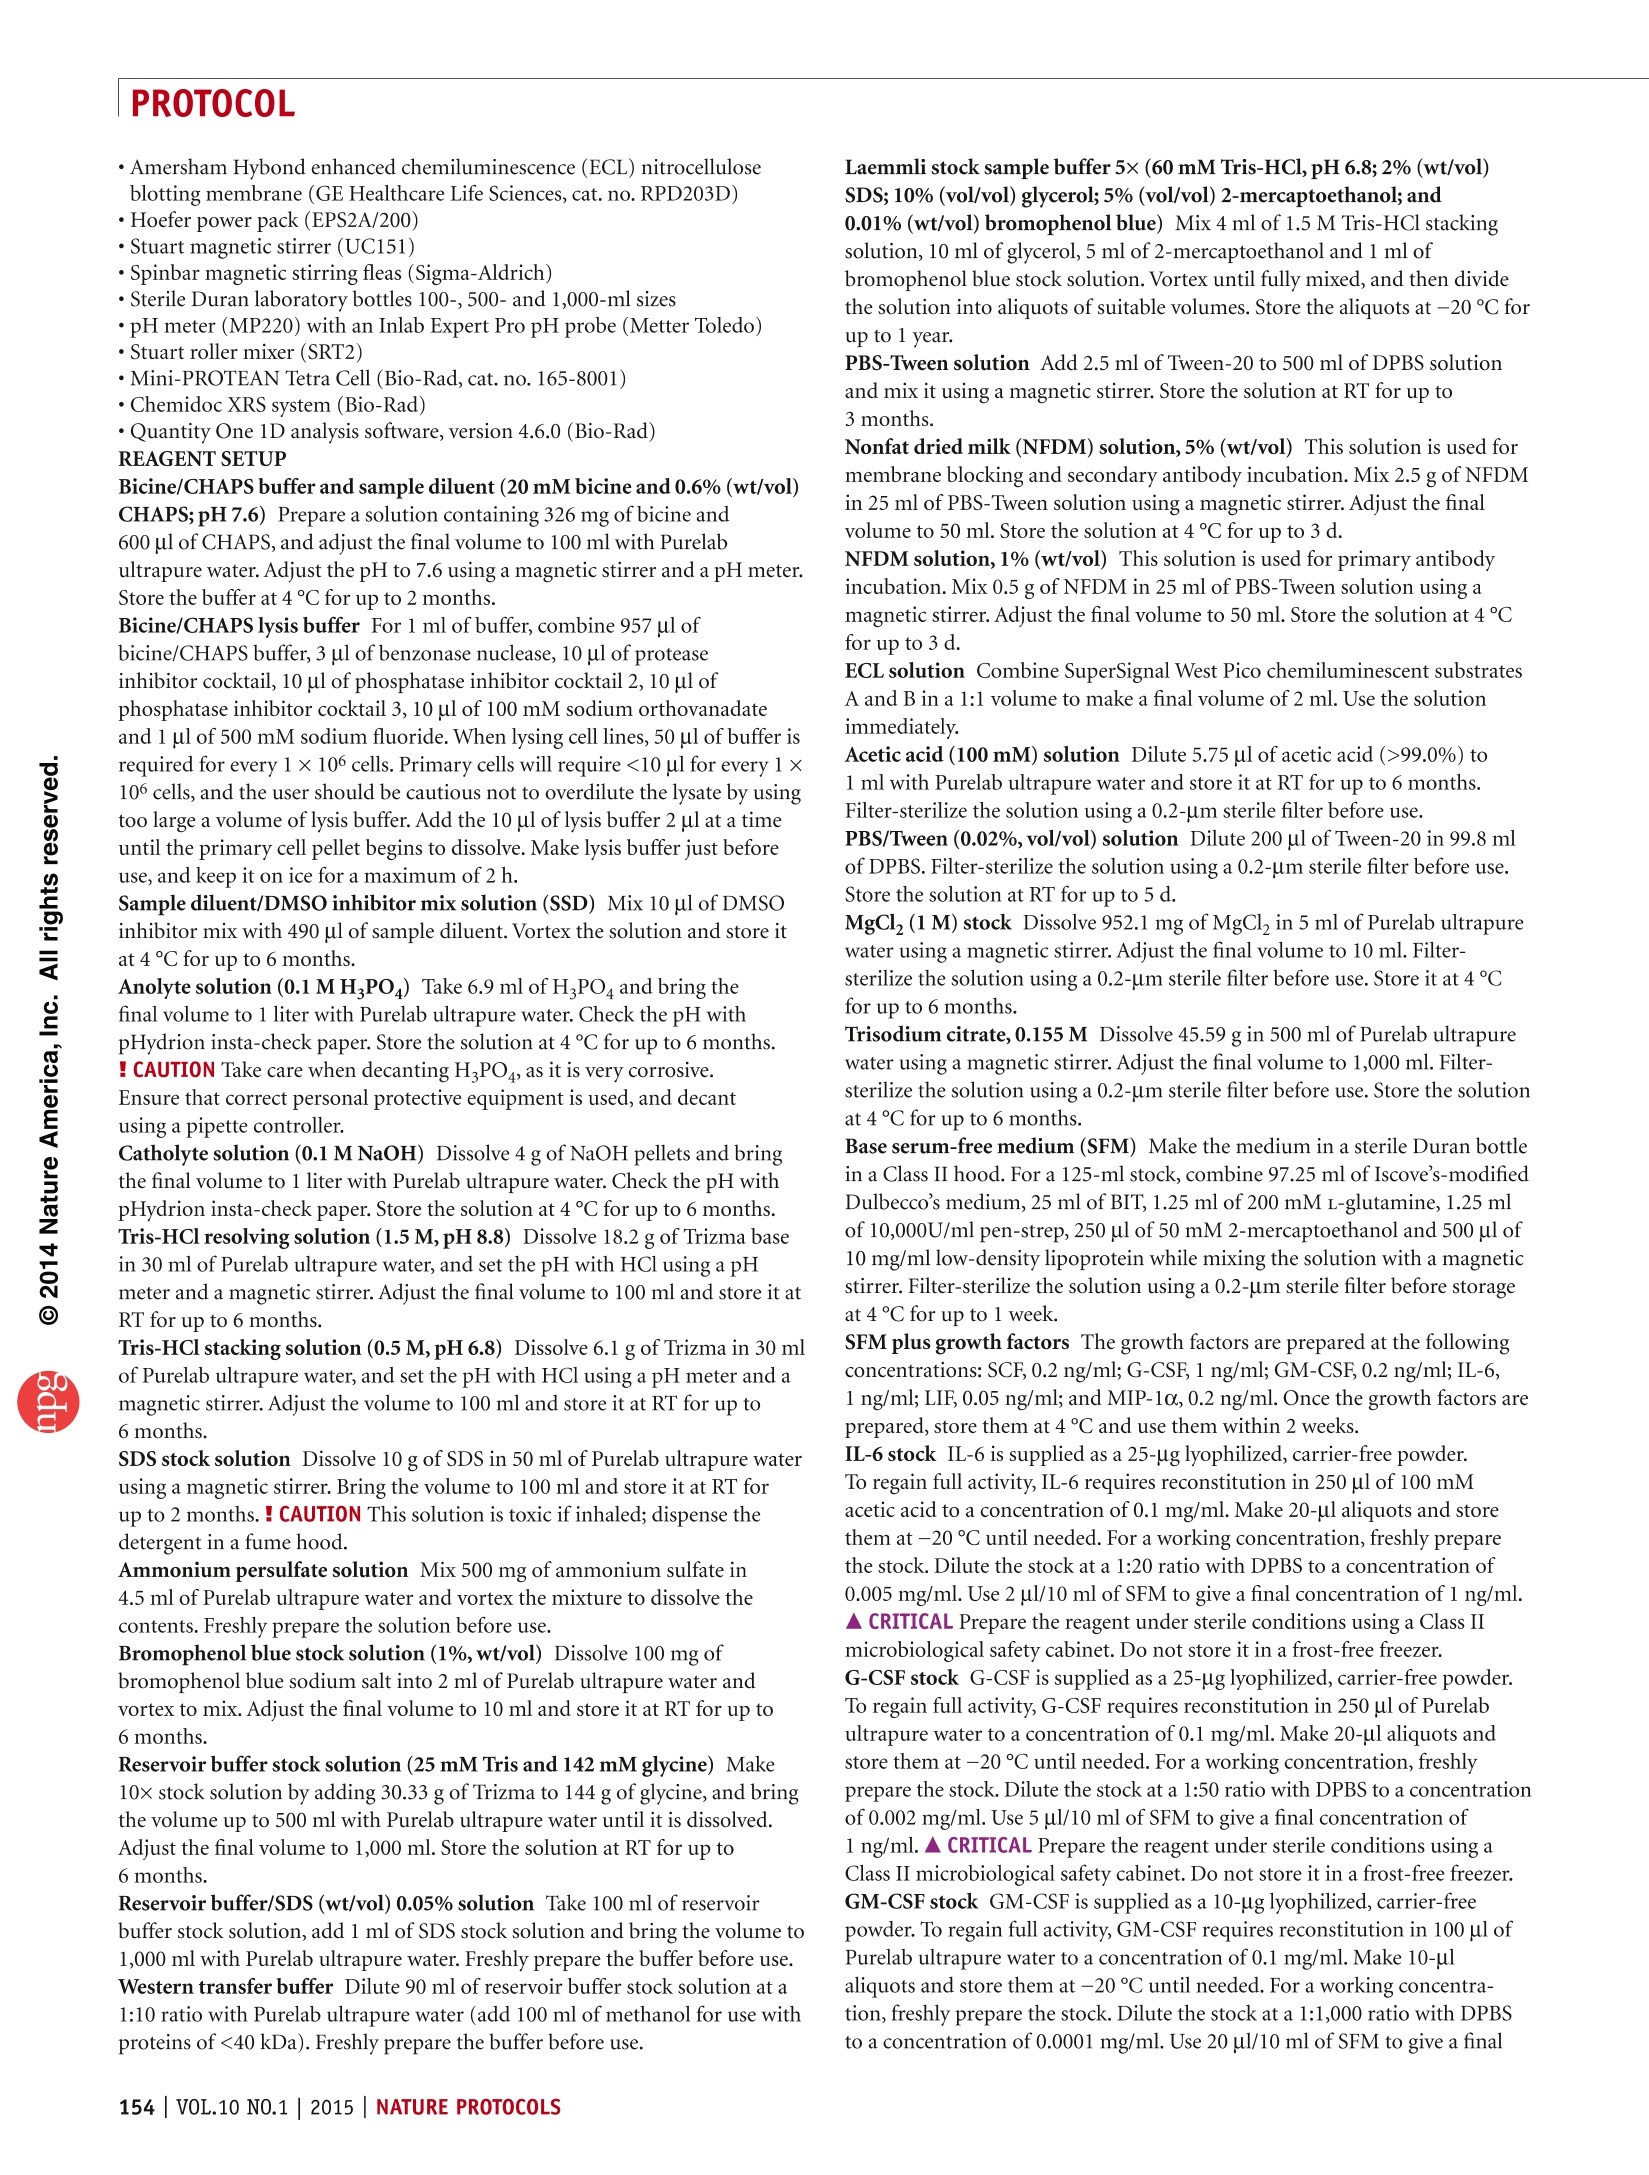
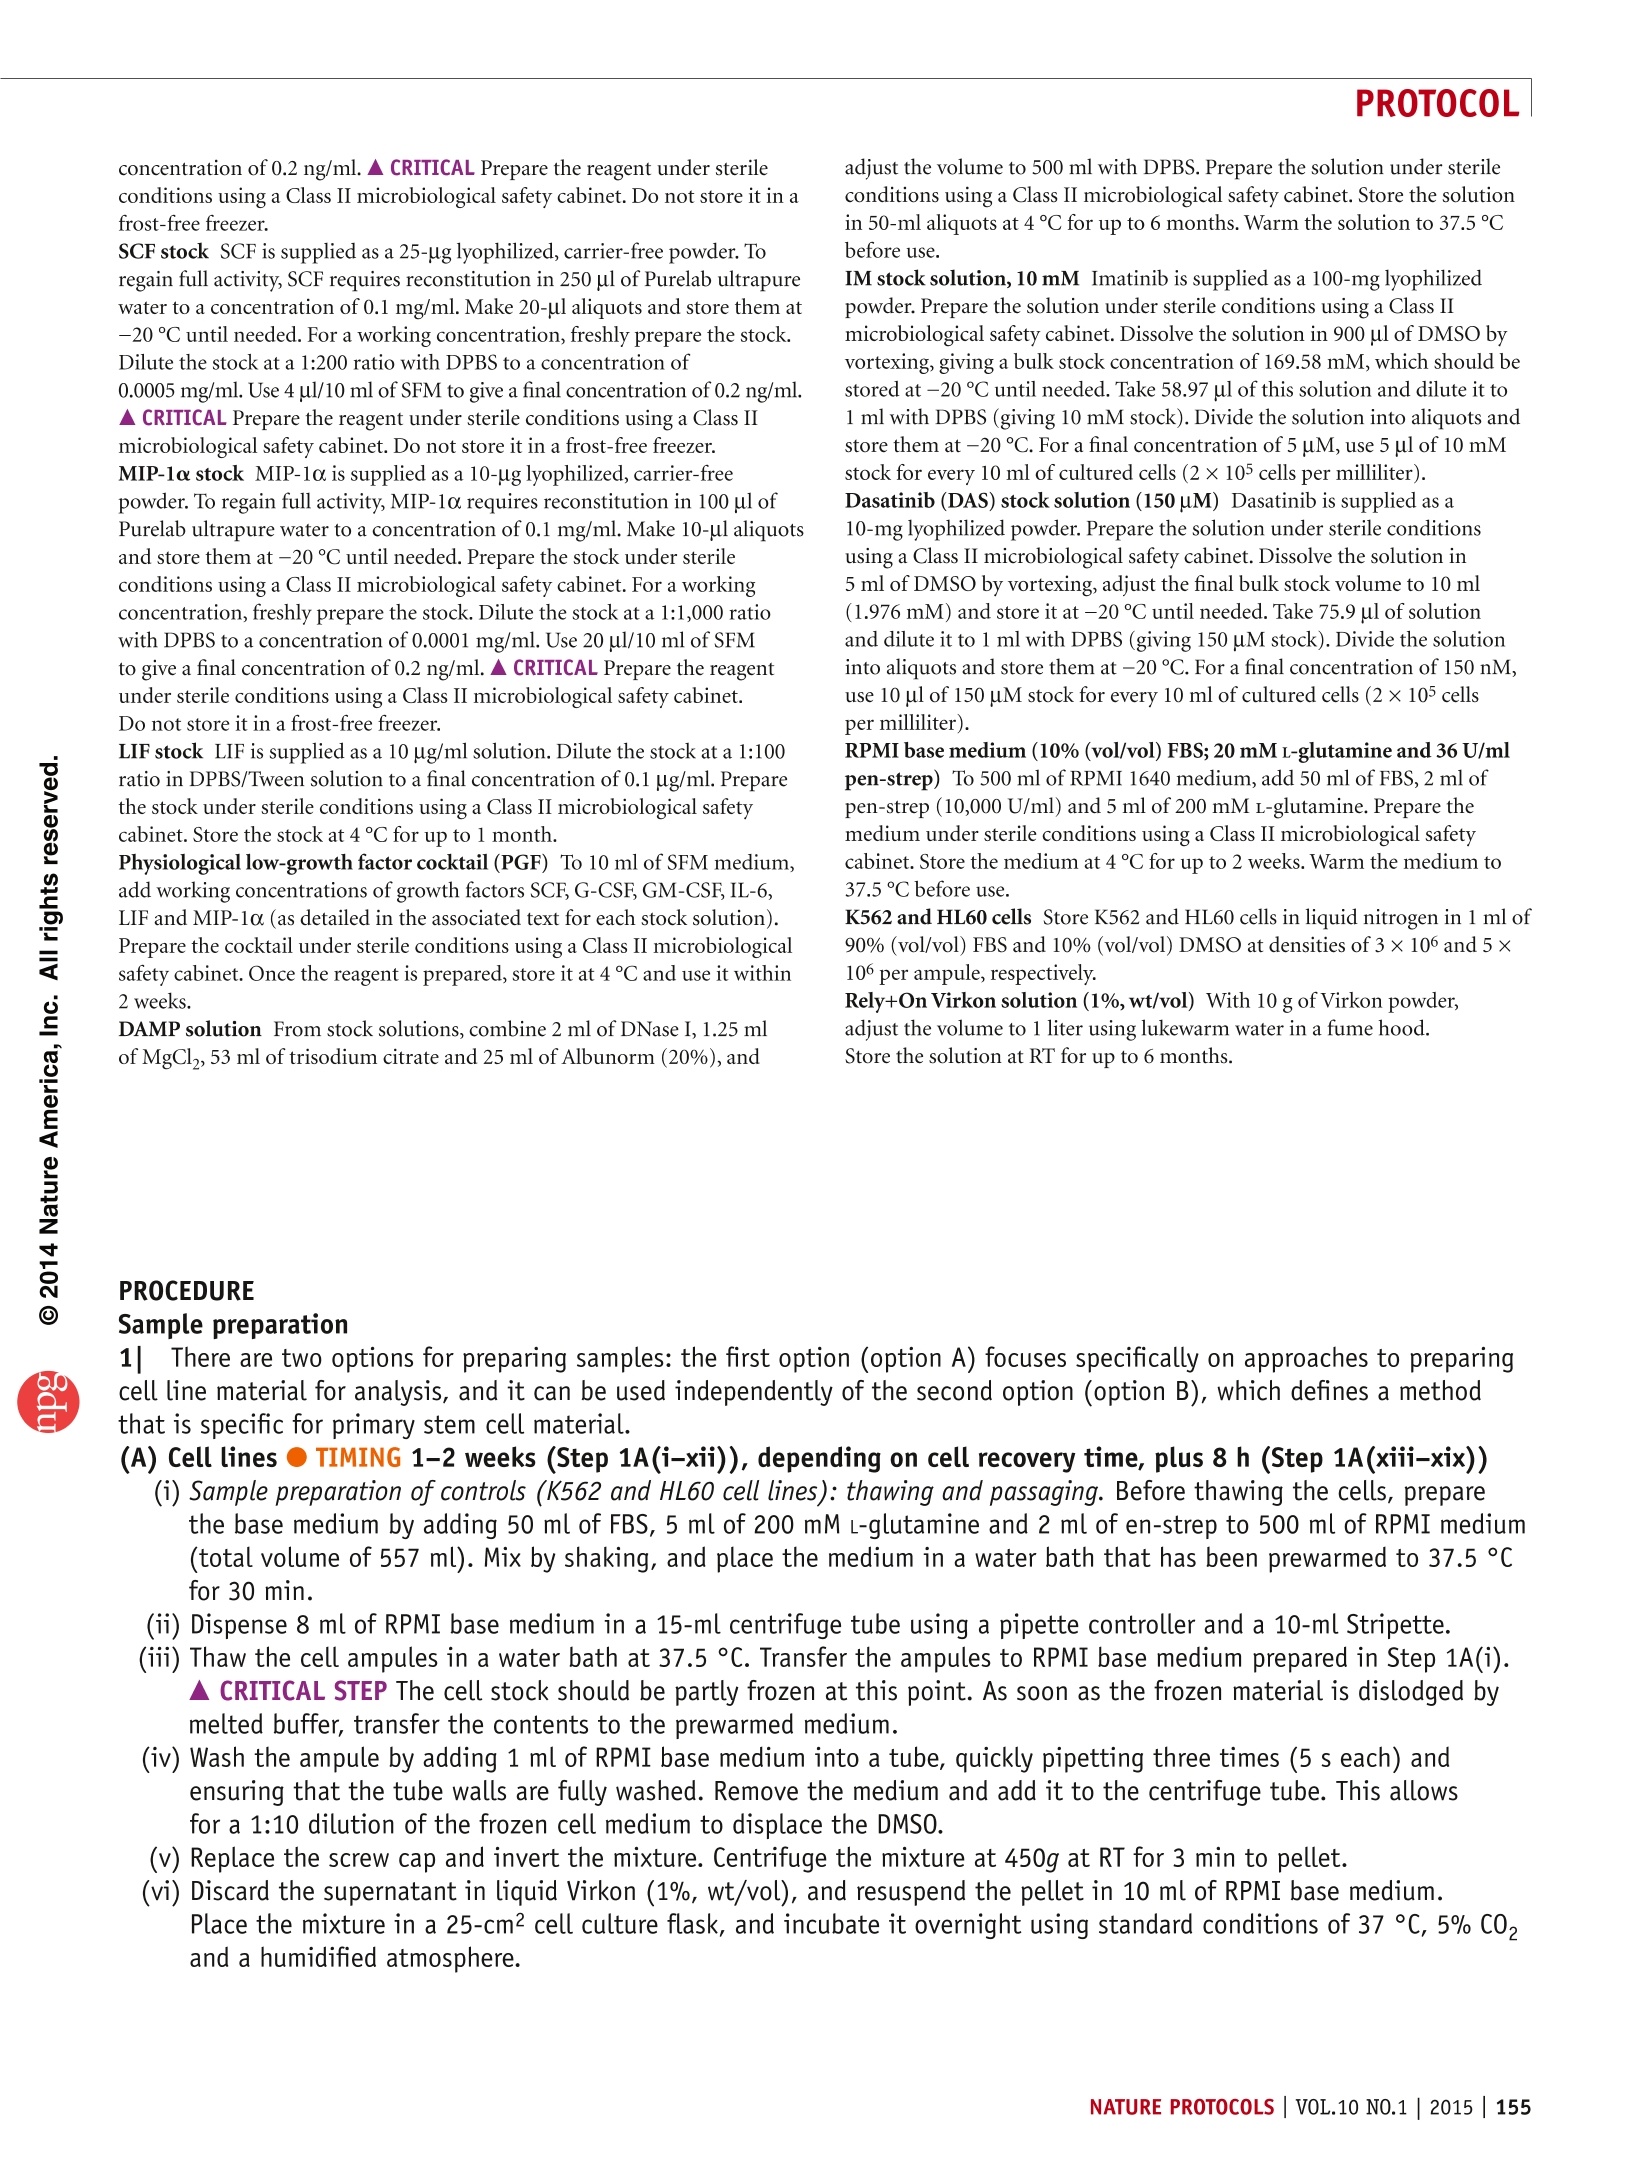
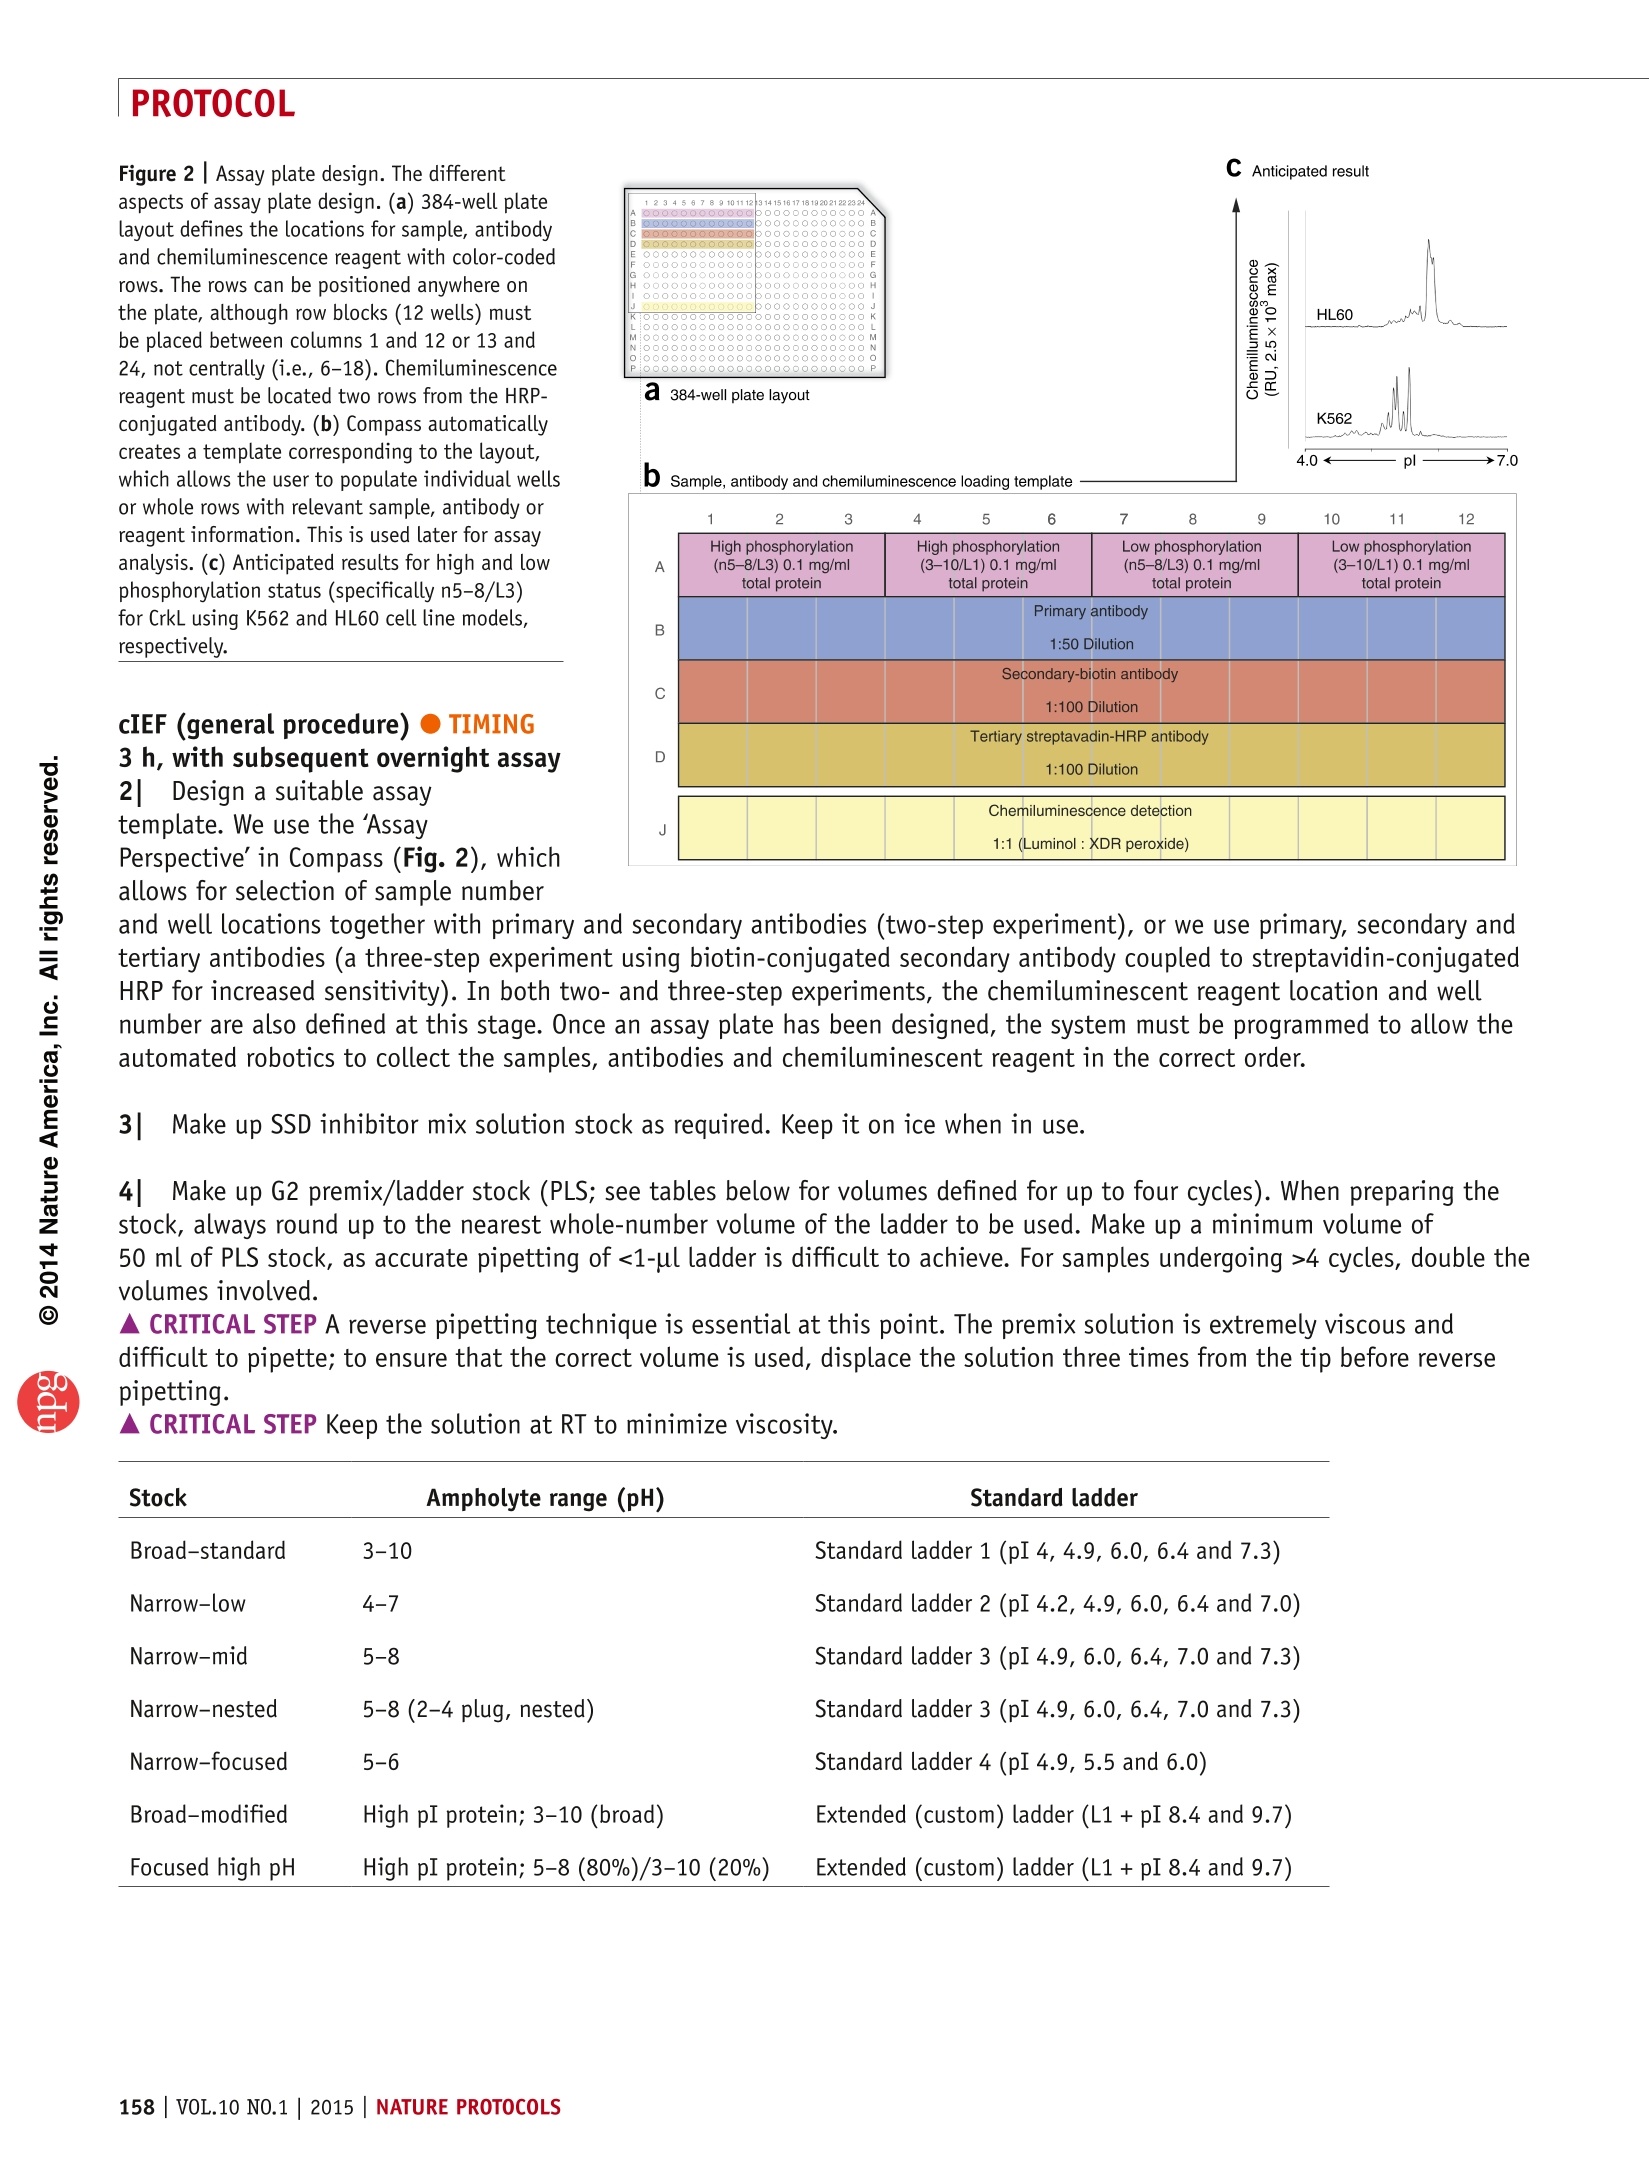
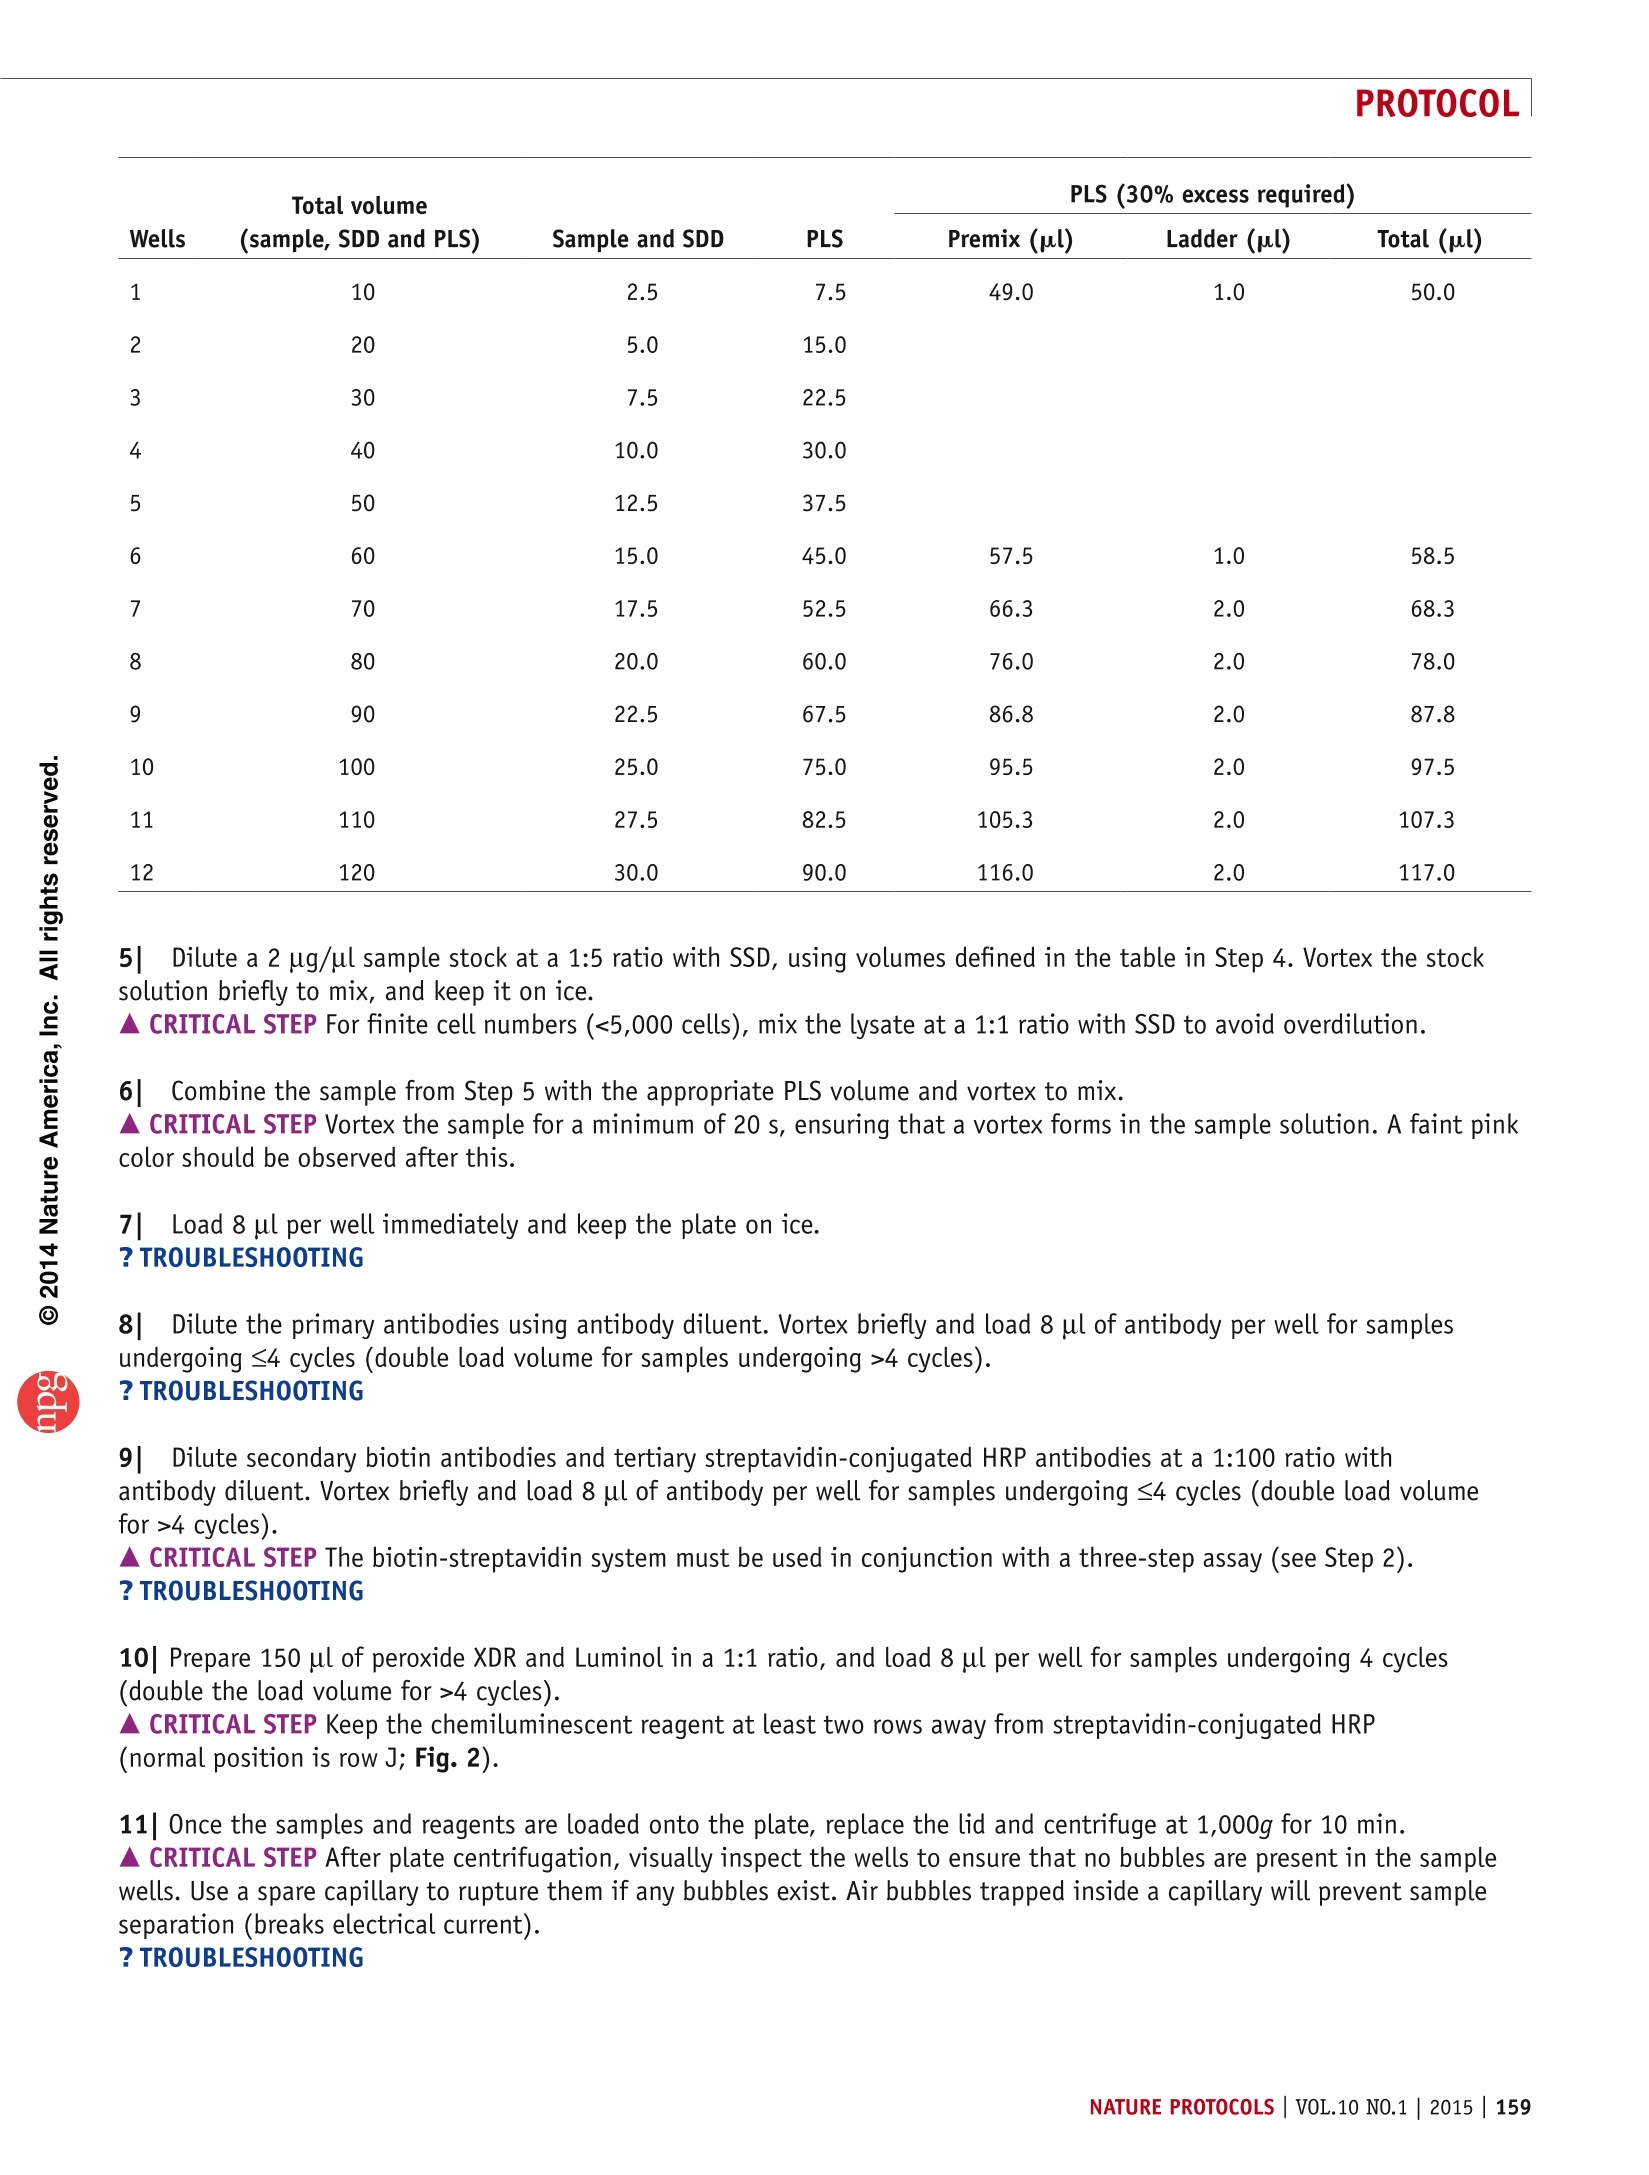
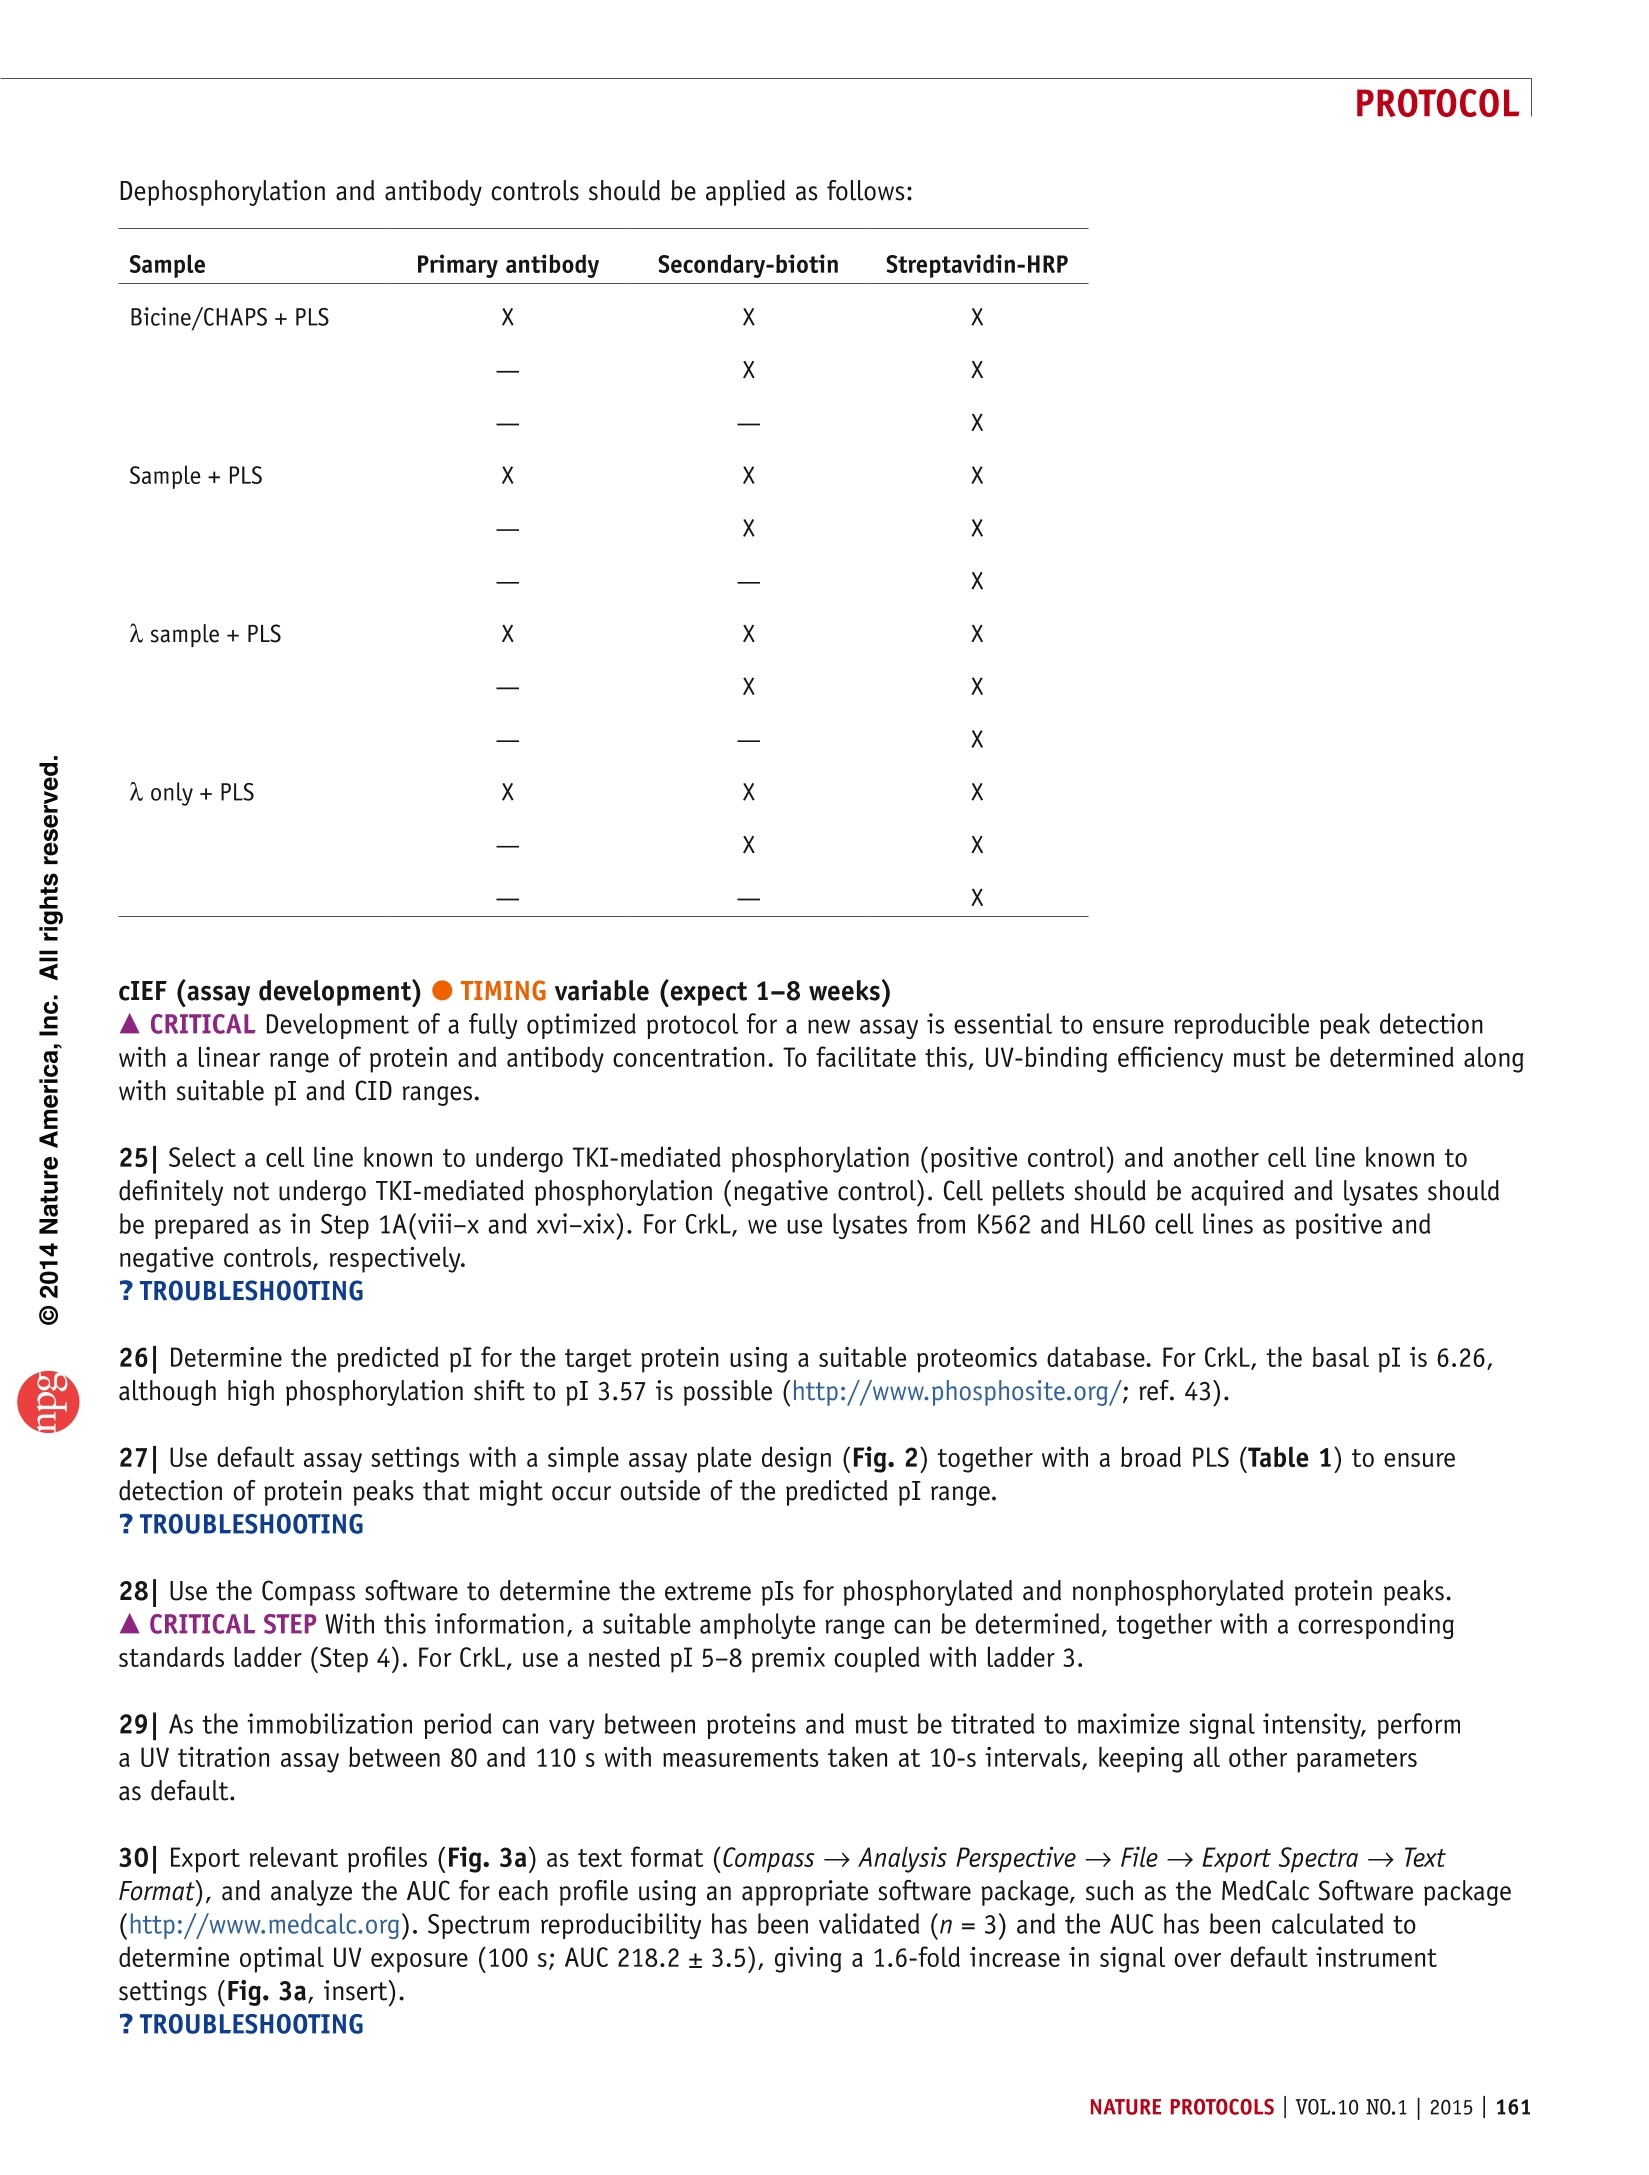
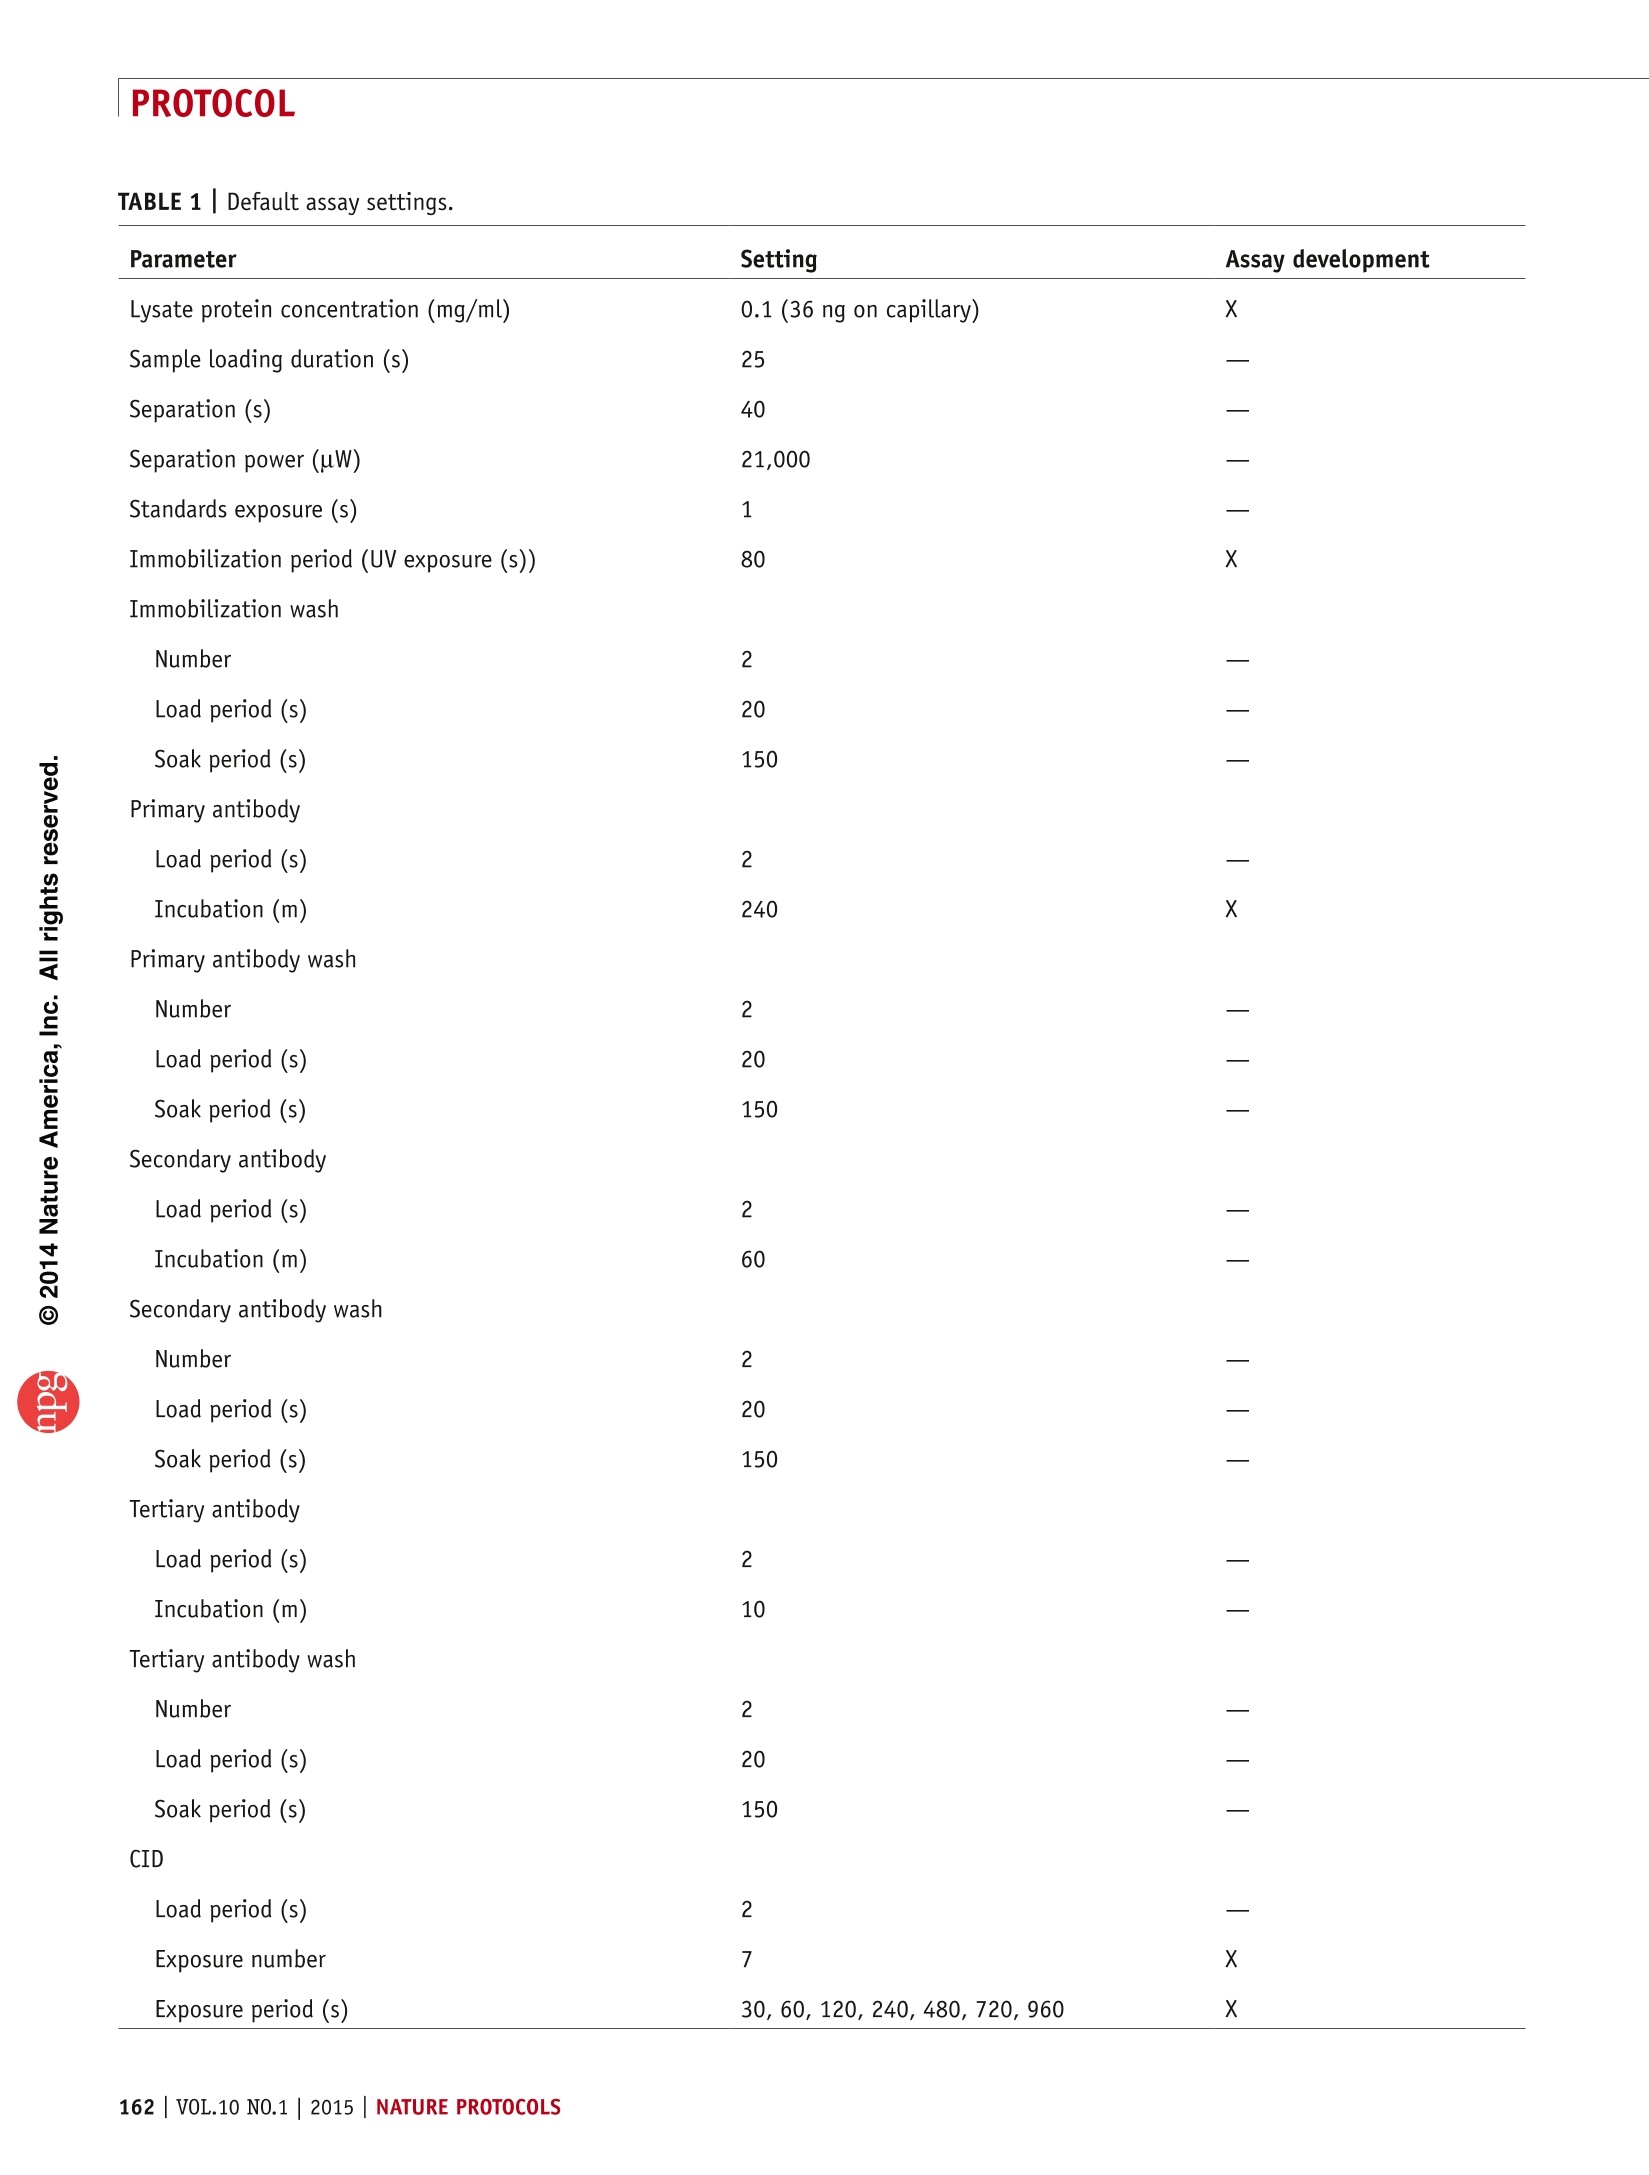
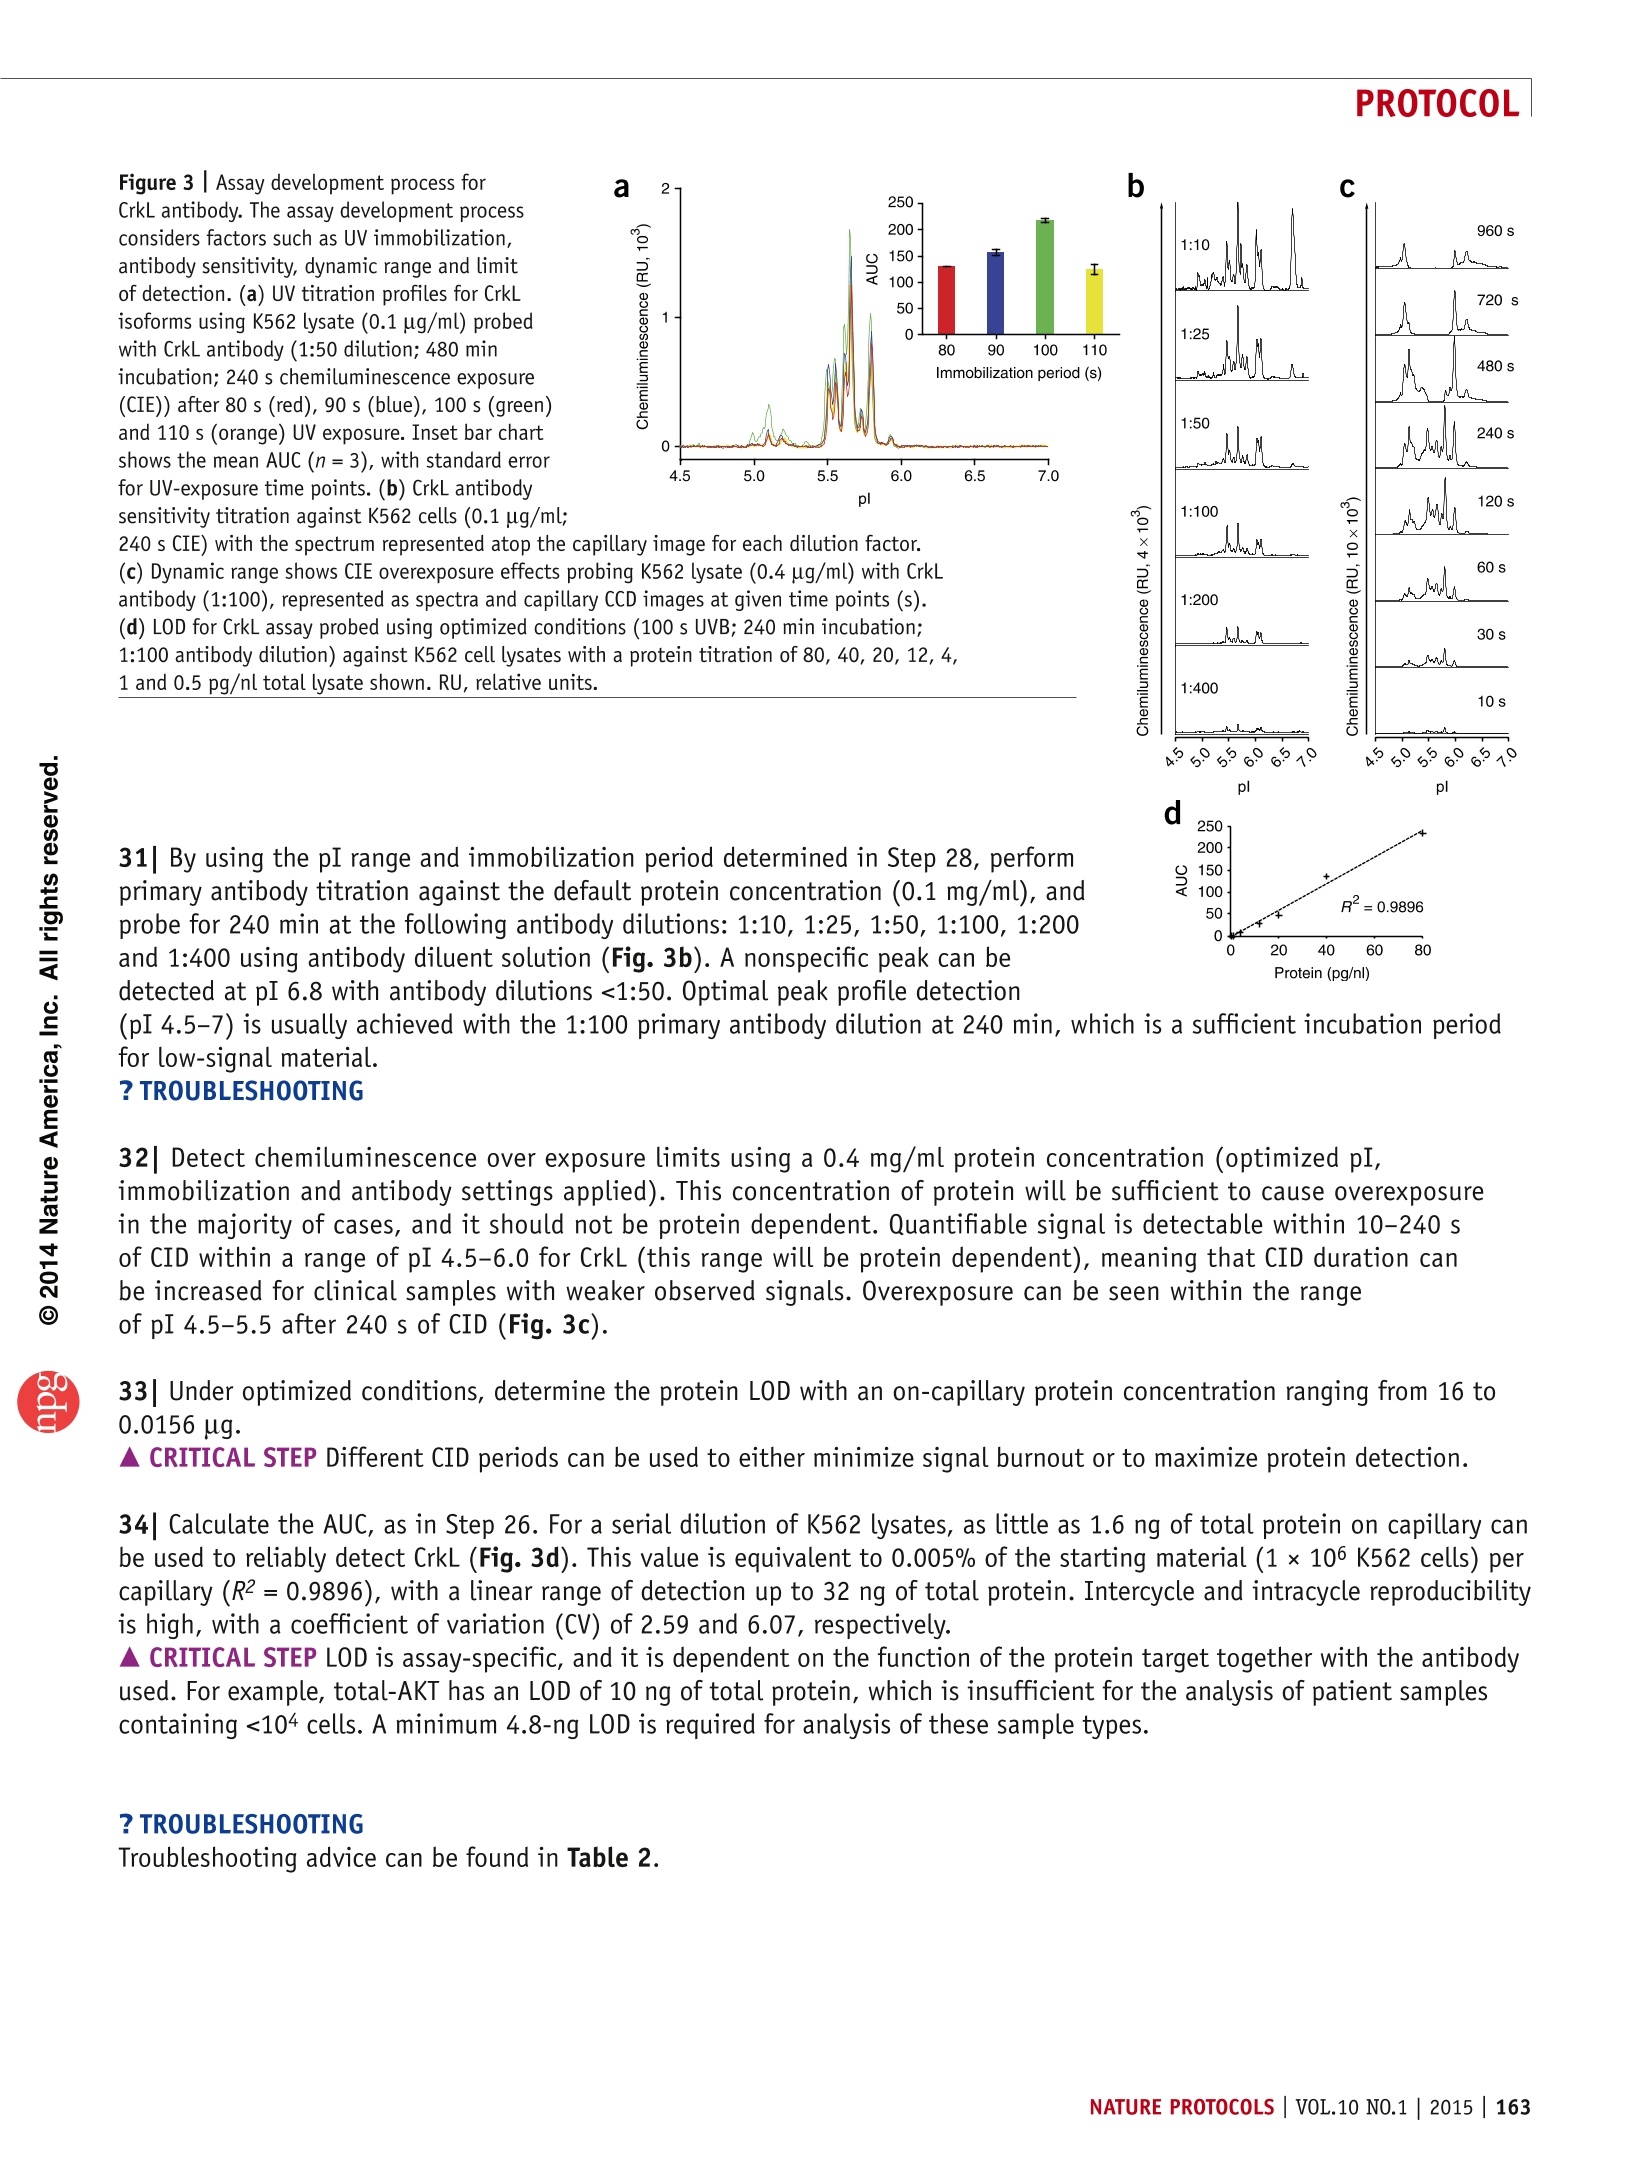
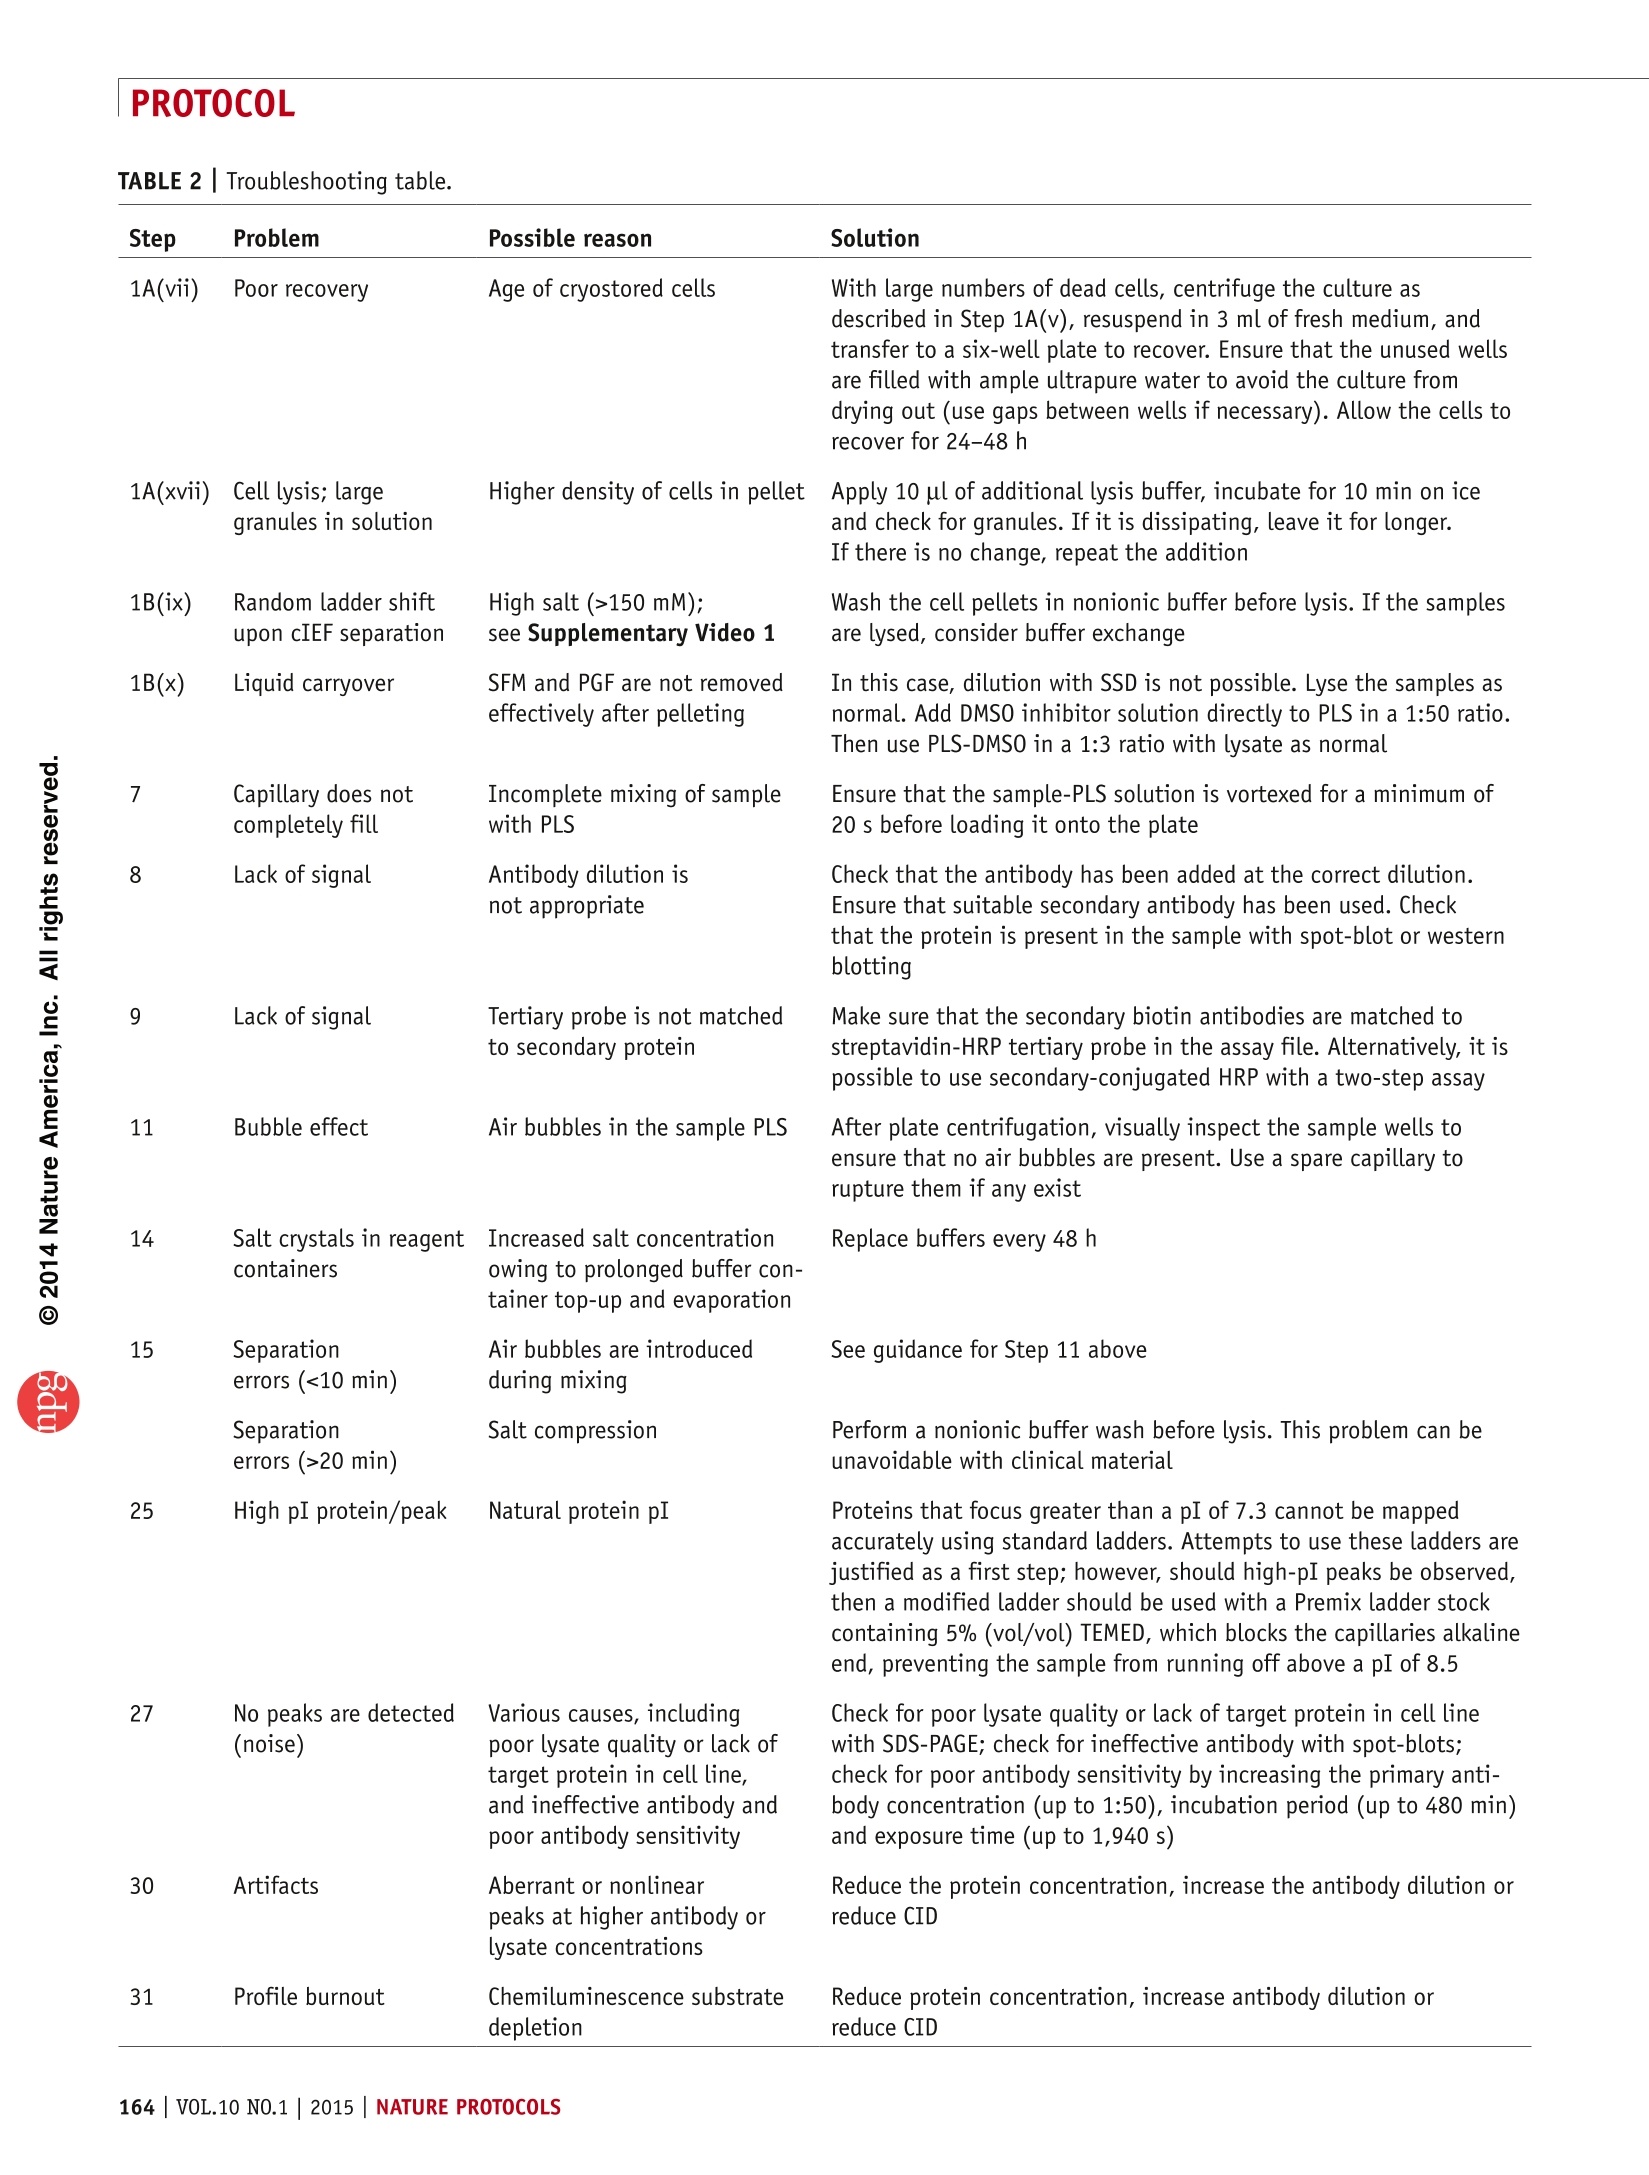
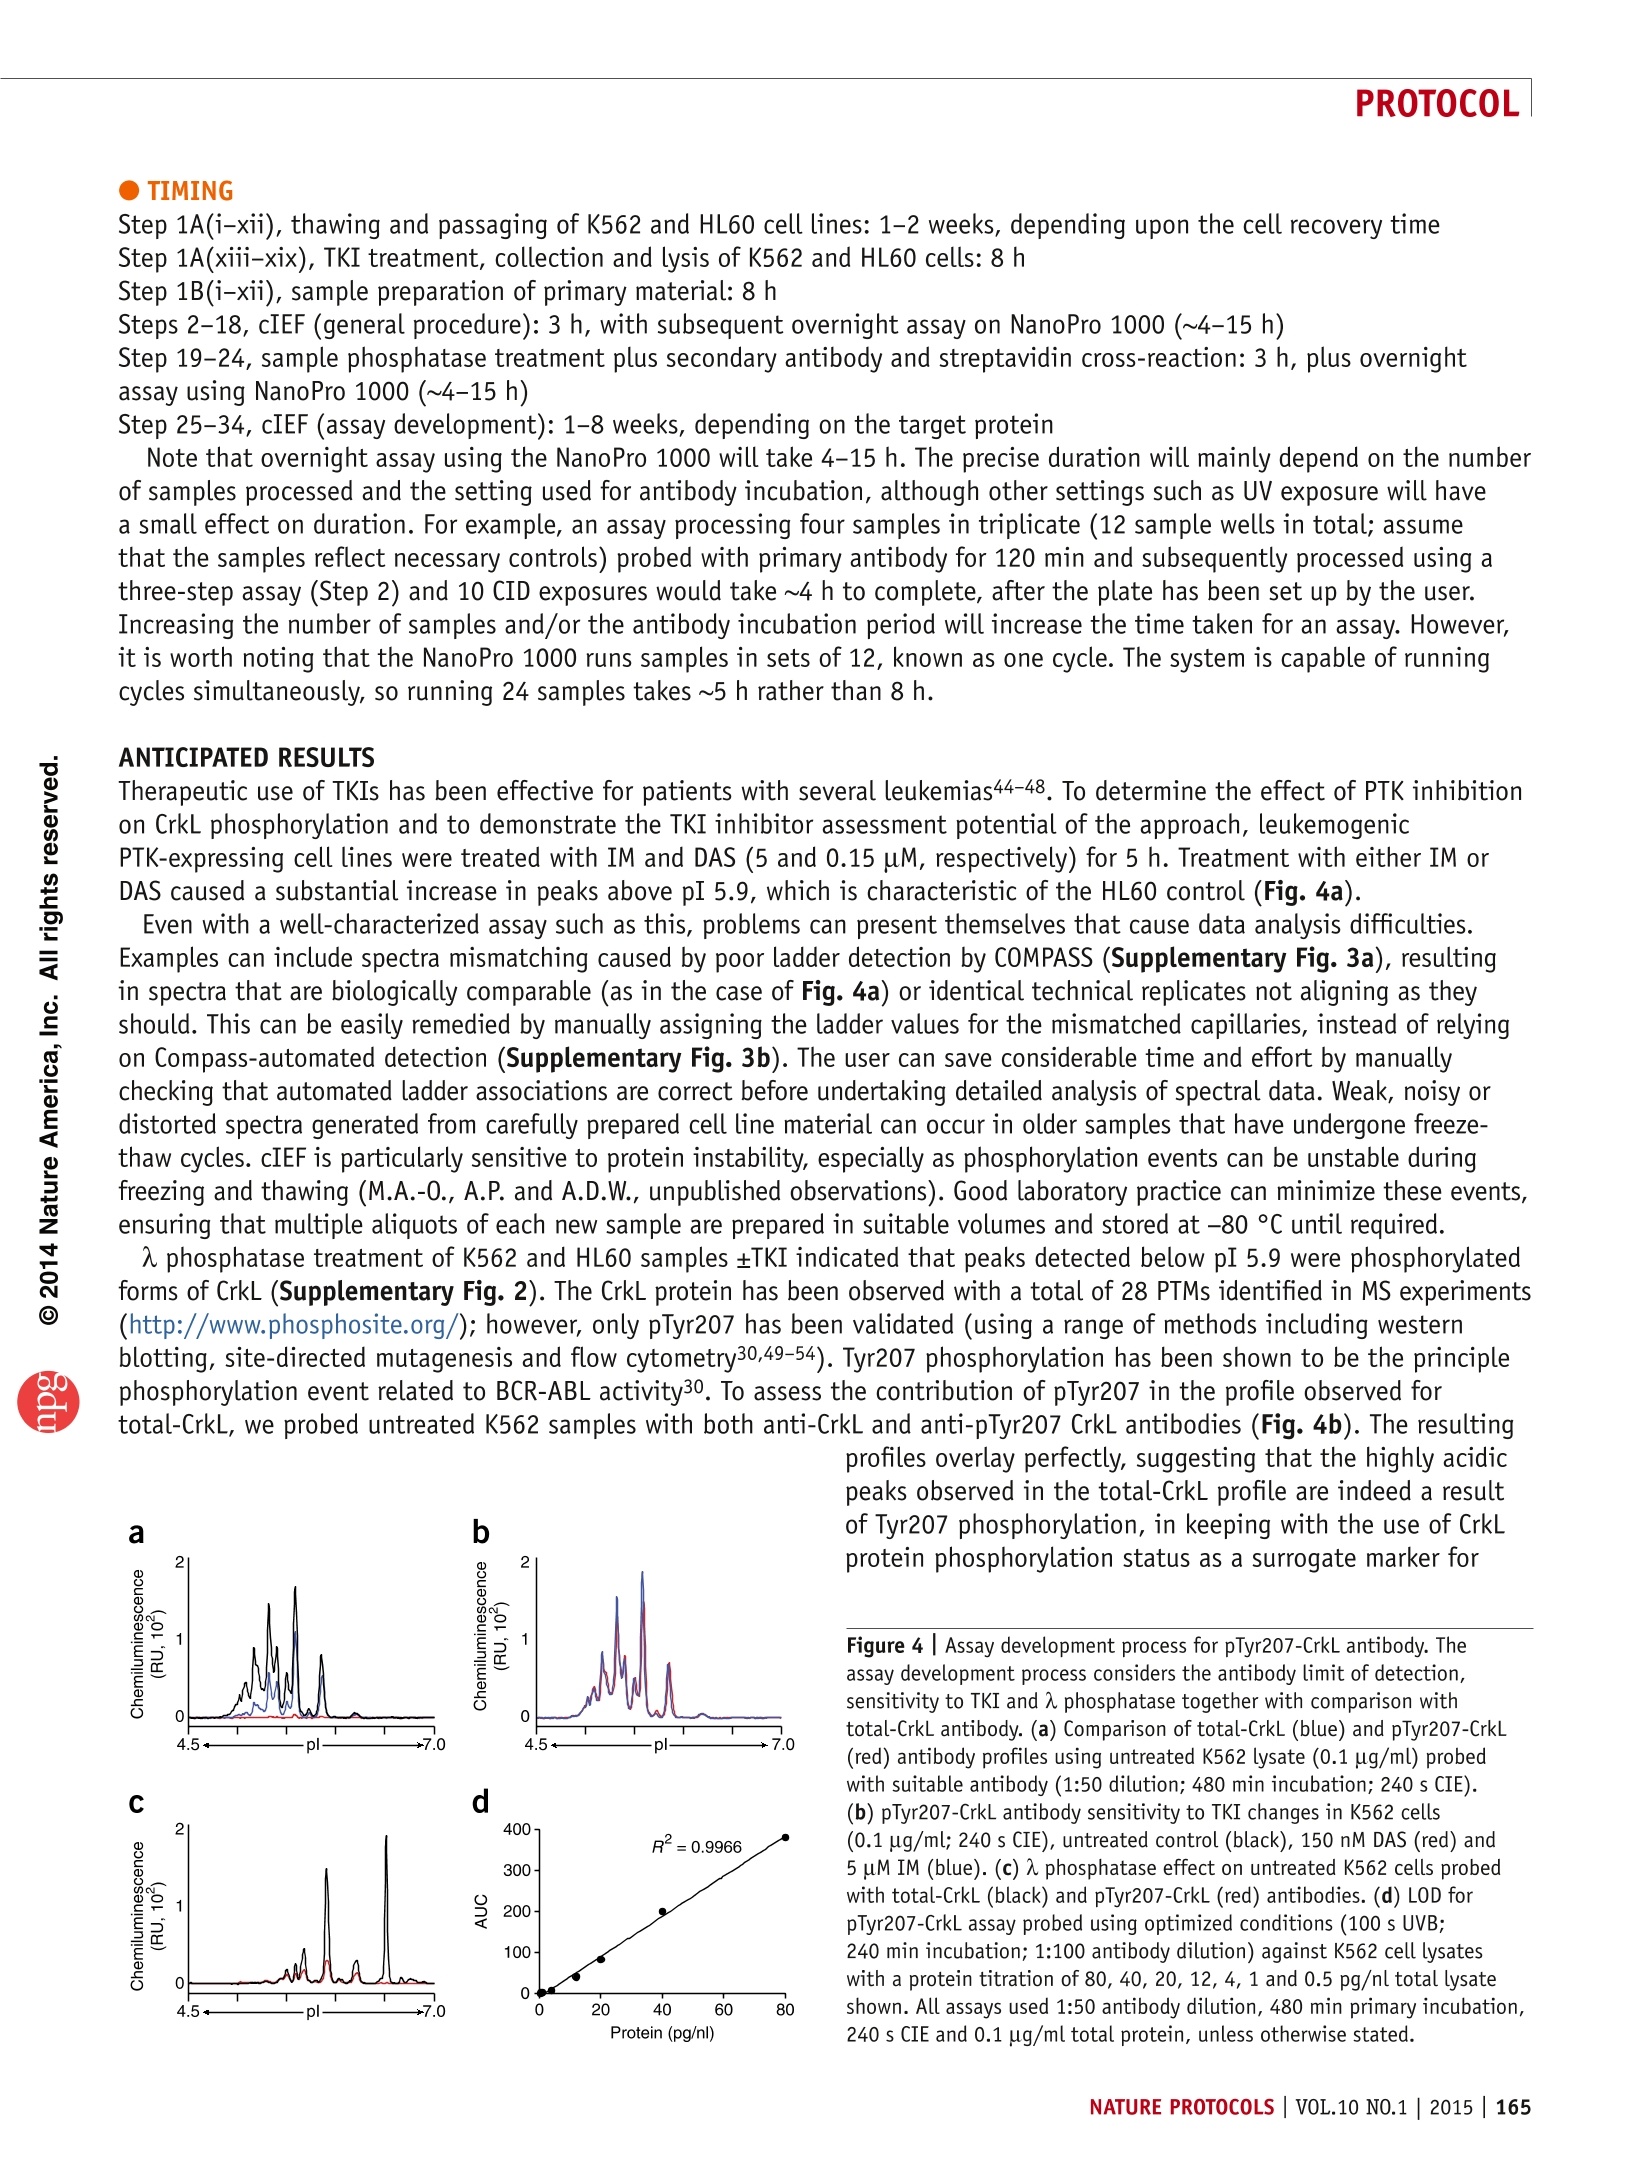
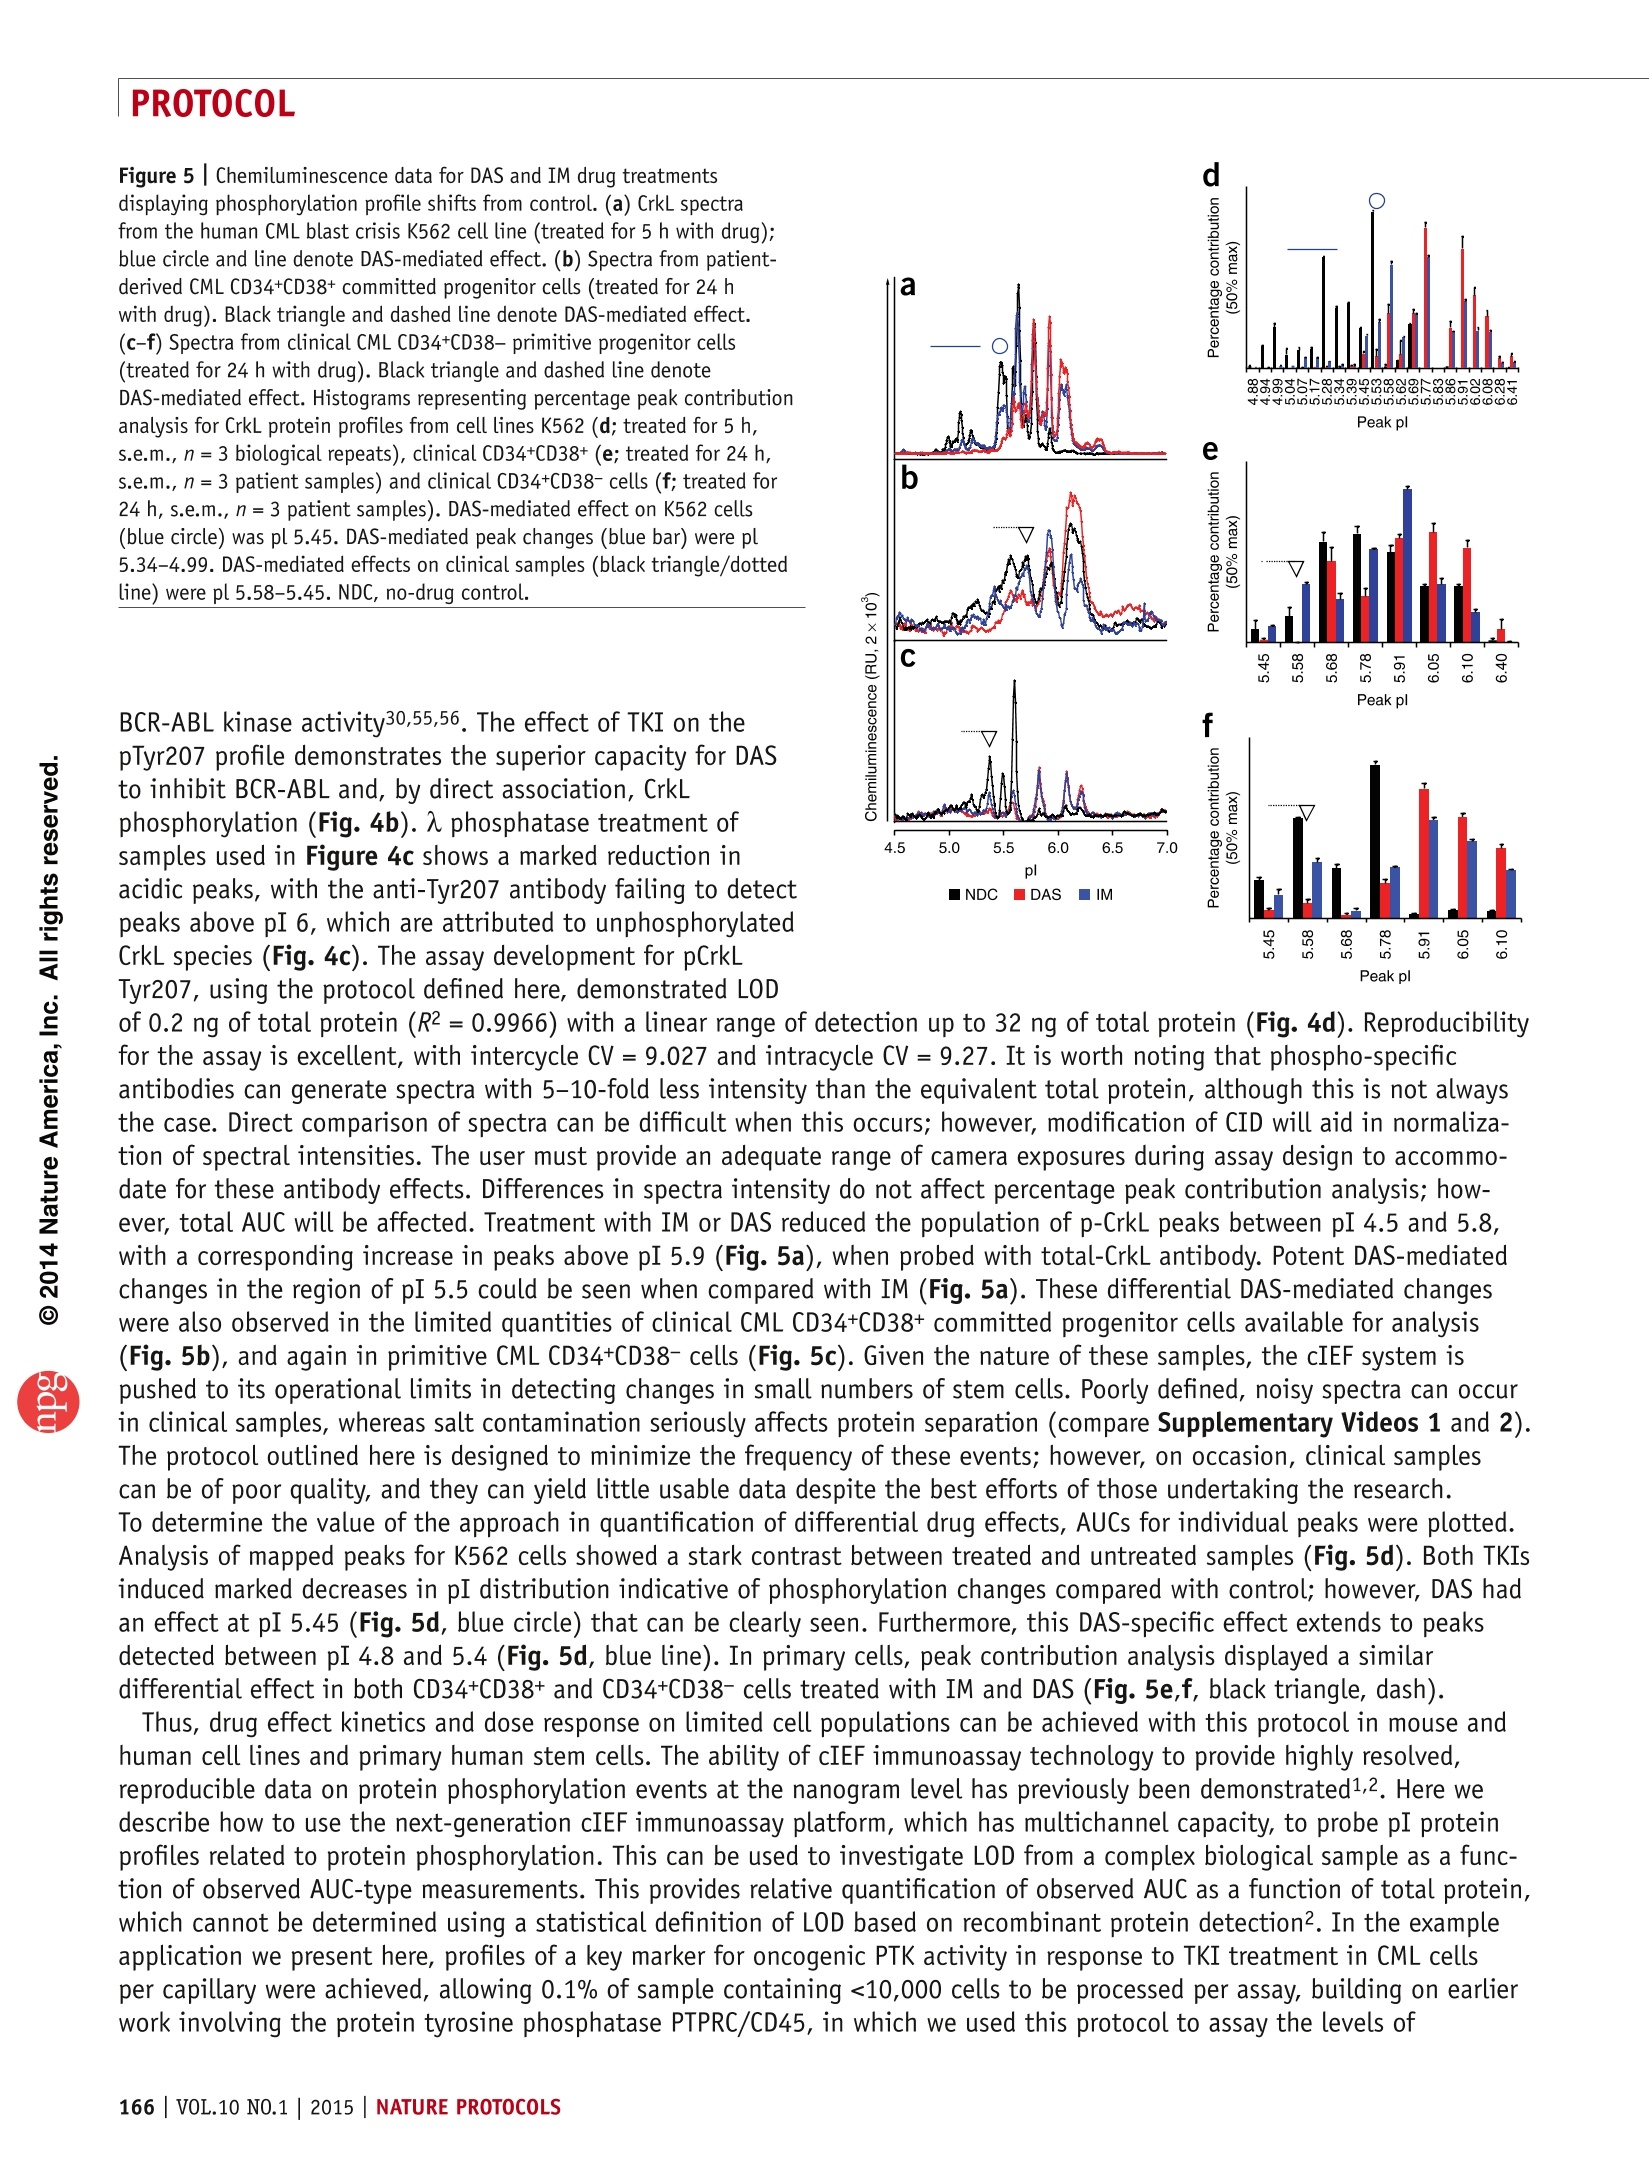
还剩18页未读,是否继续阅读?

产品配置单
ProteinSimple为您提供《基于肿瘤干细胞药物开发及信号通路蛋白分析》,该方案主要用于其他中检测,参考标准--,《基于肿瘤干细胞药物开发及信号通路蛋白分析》用到的仪器有NanoPro 1000信号转导蛋白磷酸化分析系统
相关方案
更多
该厂商其他方案
更多