


方案详情
文
纳米粒子尺寸一般在1到100纳米,被广泛的应用于诸如催化剂,吸附剂,光电子材料,过滤材料,药物载体等。具有特异性功能的纳米材料逐渐被研发,而它对人体健康的潜在危害也是我们研究的对象。 QCM-D 提供了一种独到的,在气相和液相中研究纳米粒子的方法。工程化纳米粒子比如金属,陶瓷,高分子纳米粒子等,这些材料不论从物理性质还是化学性质都会和宏观尺度的材料有区别。
方案详情

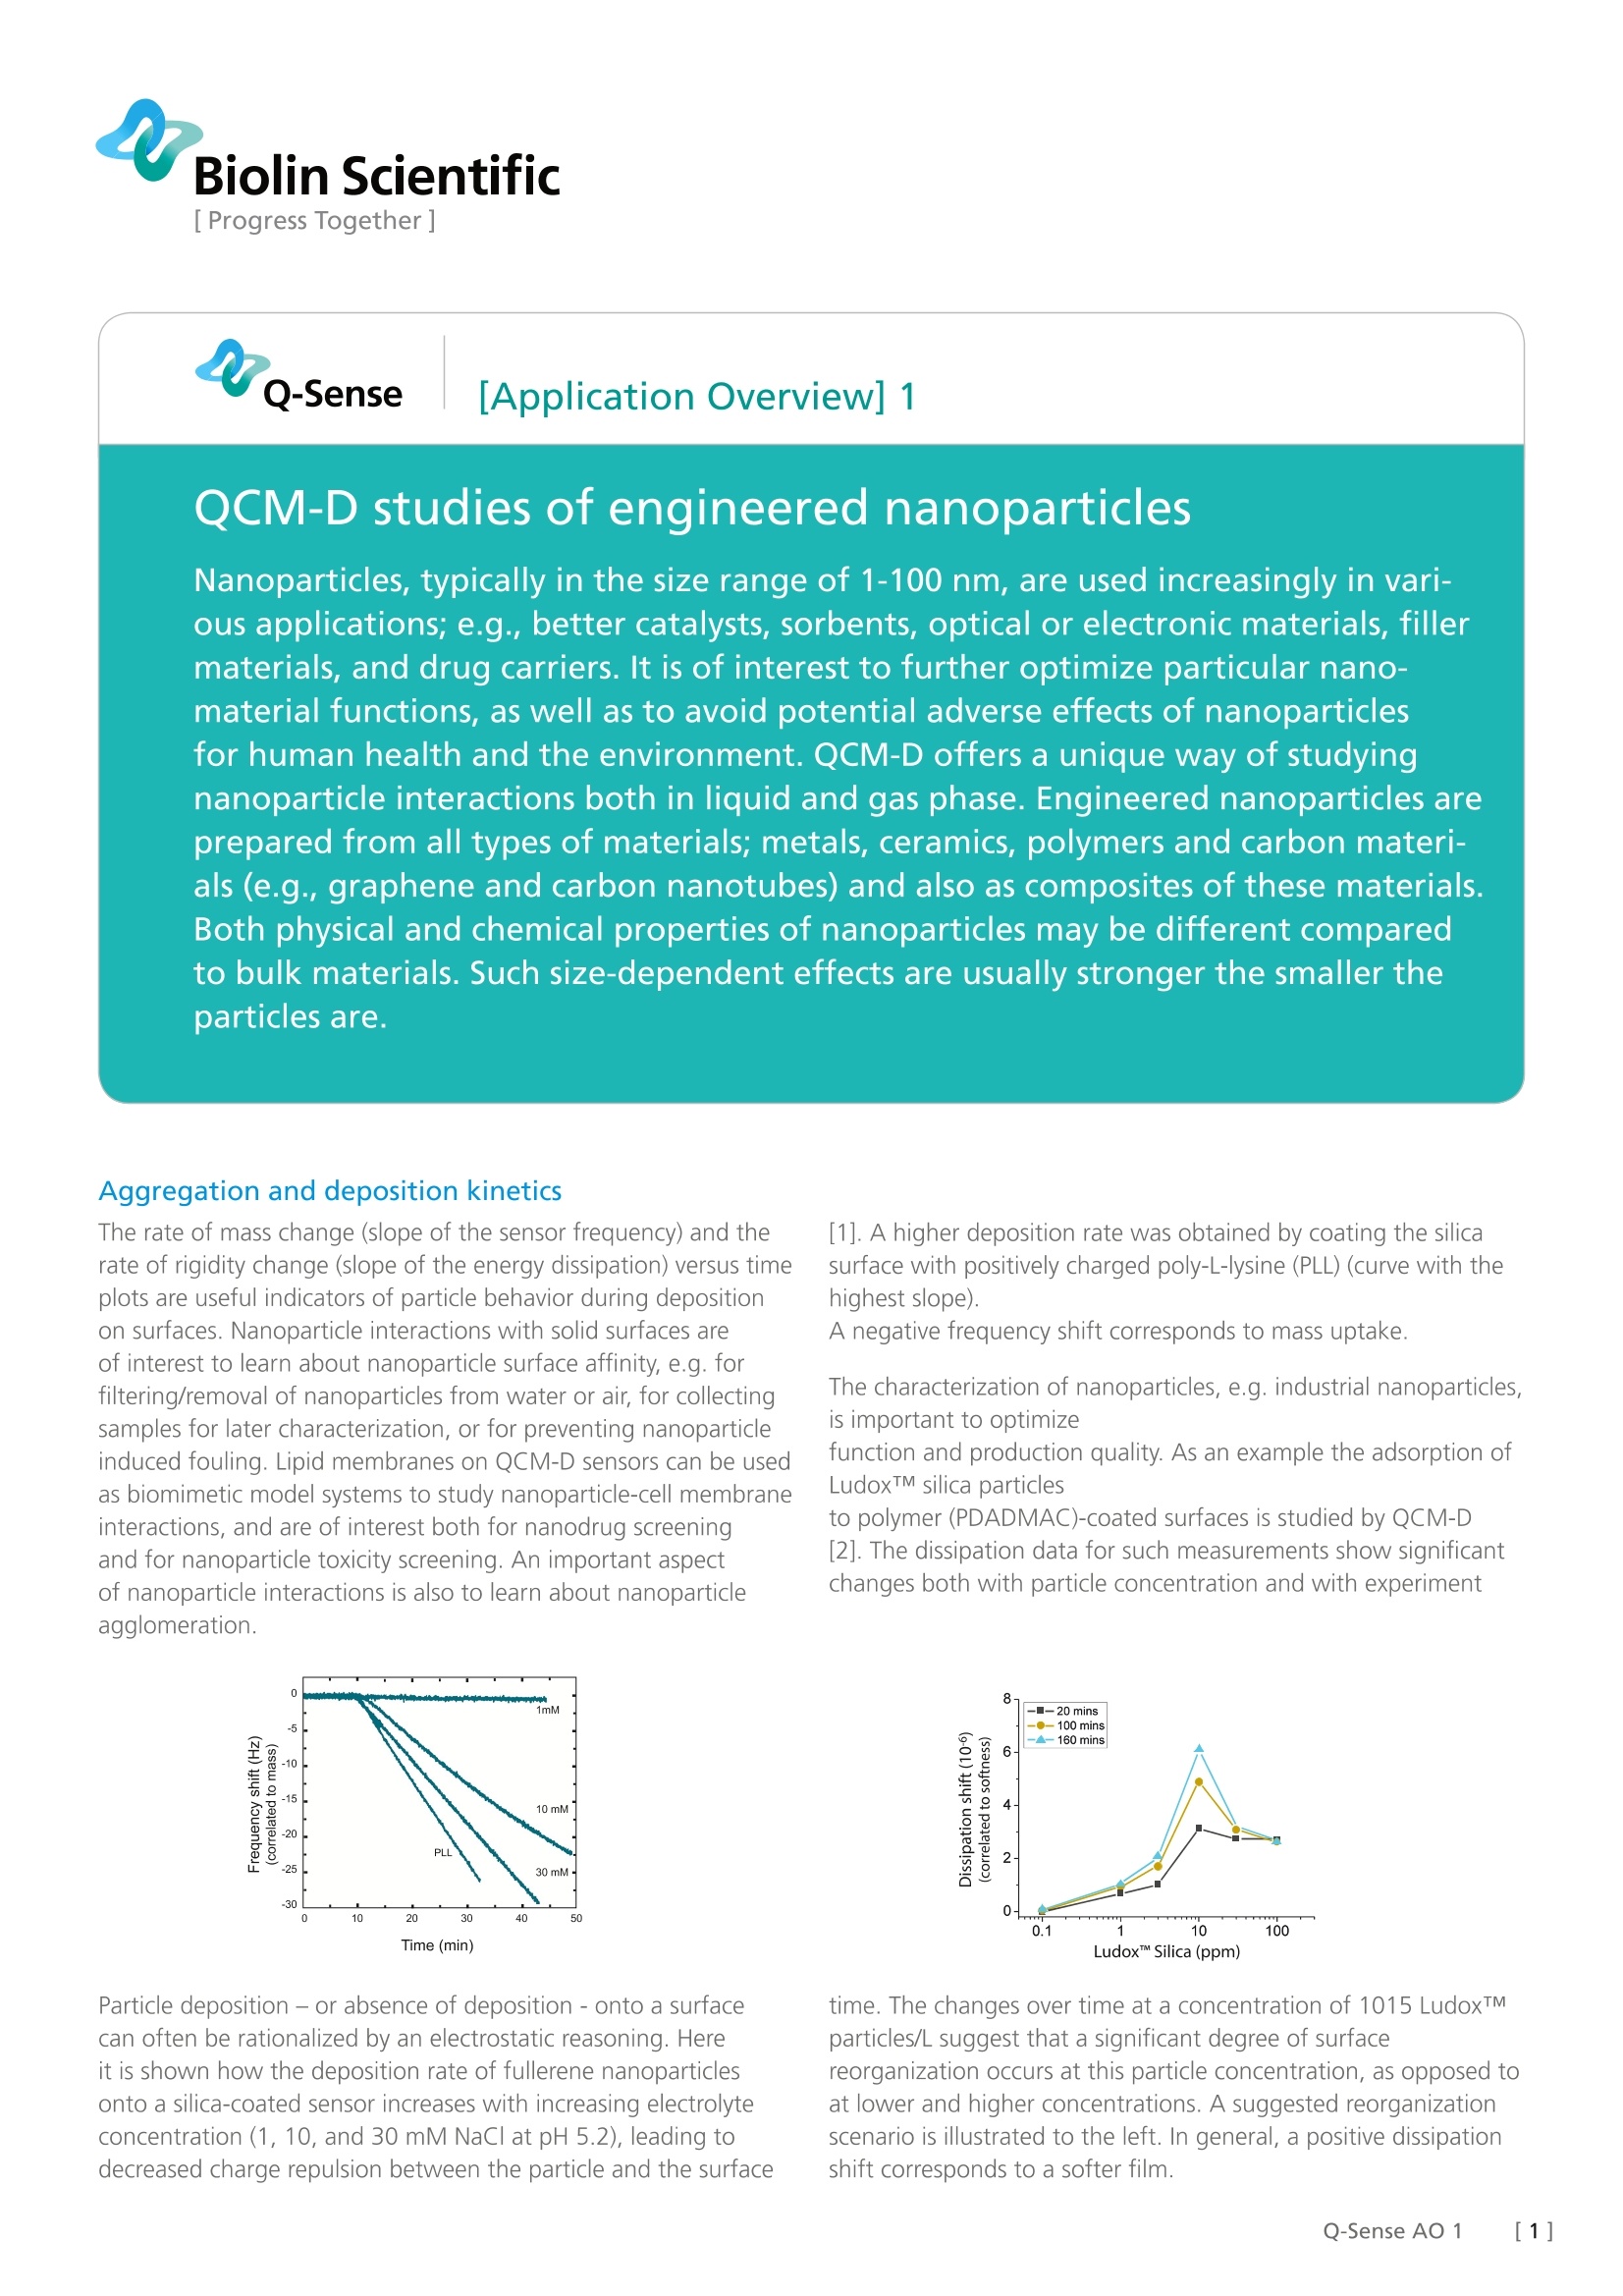
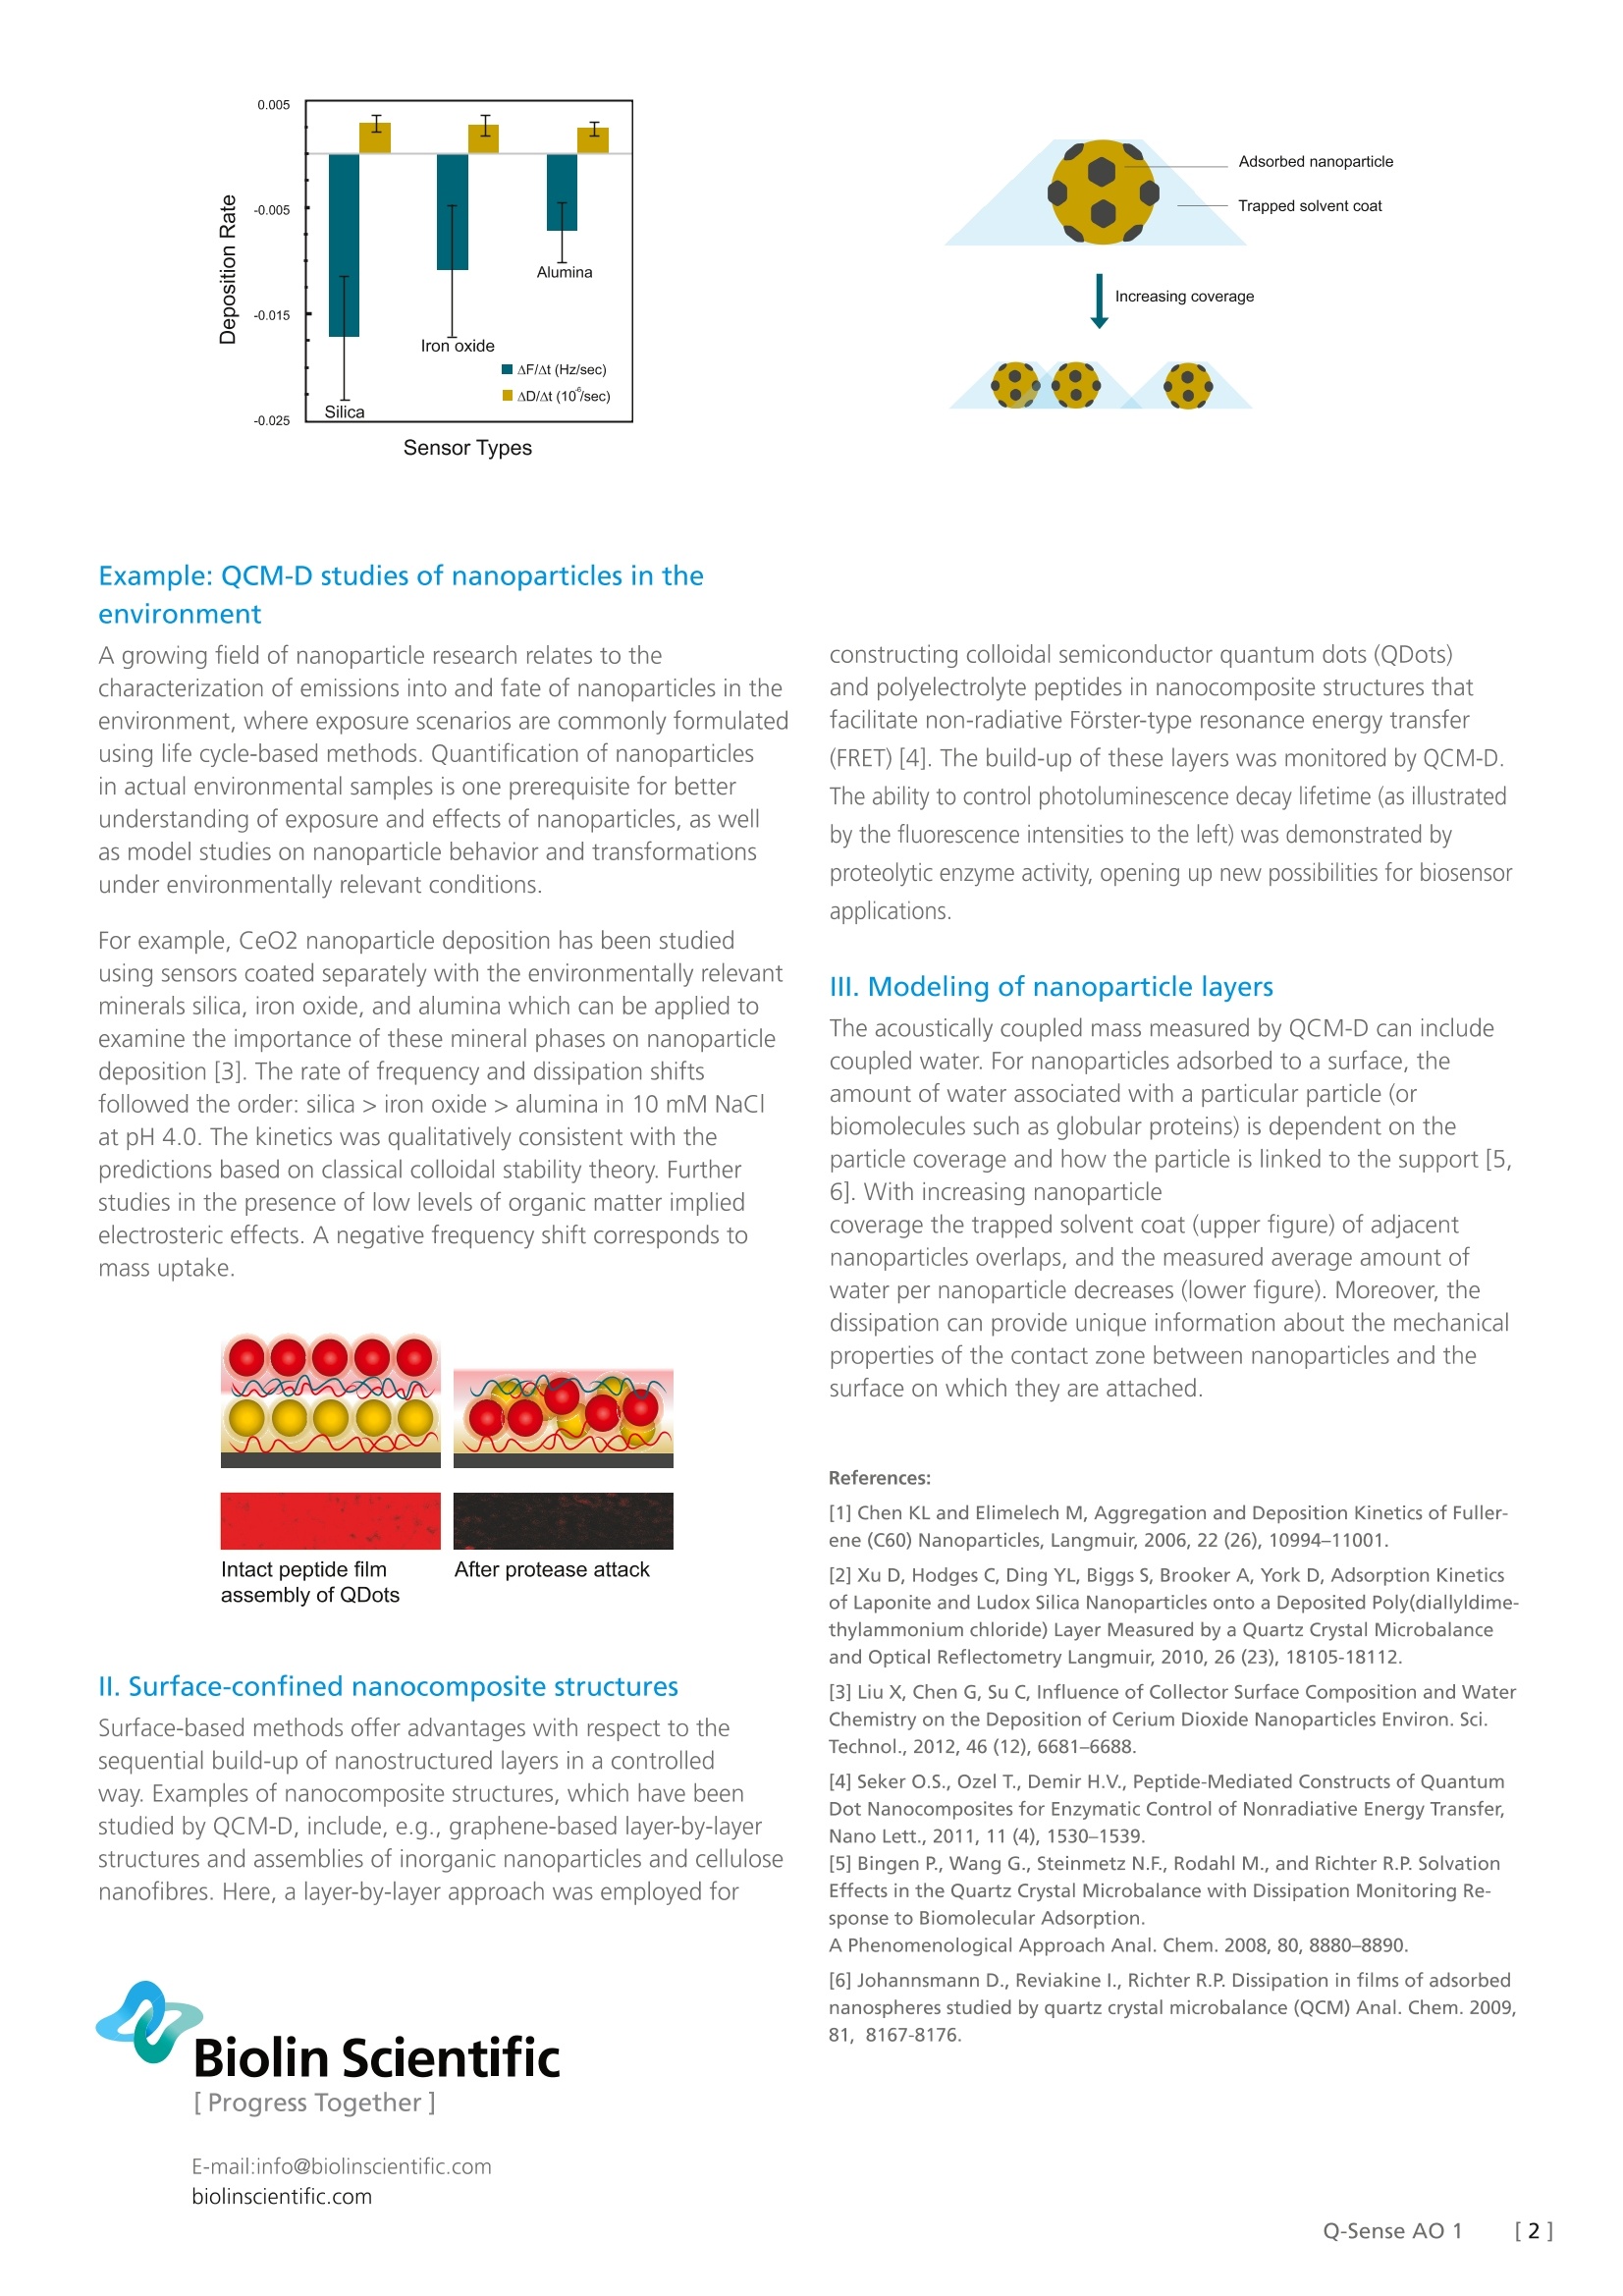
Biolin Scientific[ Progress Together] [Application Overview] 1 QCM-D studies of engineered nanoparticlesNanoparticles, typically in the size range of 1-100 nm, are used increasingly in vari-ous applications; e.g., better catalysts, sorbents, optical or electronic materials, fillermaterials, and drug carriers. lt is of interest to further optimize particular nano-material functions, as well as to avoid potential adverse effects of nanoparticlesfor human health and the environment. QCM-D offers a unique way of studyingnanoparticle interactions both in liquid and gas phase. Engineered nanoparticles areprepared from all types of materials; metals, ceramics, polymers and carbon materi-als (e.g., graphene and carbon nanotubes) and also as composites of these materials.Both physical and chemical properties of nanoparticles may be different comparedto bulk materials. Such size-dependent effects are usually stronger the smaller theparticles are. Aggregation and deposition kinetics The rate of mass change (slope of the sensor frequency) and therate of rigidity change (slope of the energy dissipation) versus timeplots are useful indicators of particle behavior during depositionon surfaces. Nanoparticle interactions with solid surfaces areof interest to learn about nanoparticle surface affinity, e.g. forfiltering/removal of nanoparticles from water or air, for collectingsamples for later characterization, or for preventing nanoparticleinduced fouling. Lipid membranes on QCM-D sensors can be usedas biomimetic model systems to study nanoparticle-cell membraneinteractions, and are of interest both for nanodrug screeningand for nanoparticle toxicity screening. An important aspectof nanoparticle interactions is also to learn about nanoparticleagglomeration. Time (min) Particle deposition - or absence of deposition- onto a surfacecan often be rationalized by an electrostatic reasoning. Hereit is shown how the deposition rate of fullerene nanoparticlesonto a silica-coated sensor increases with increasing electrolyteconcentration (1, 10, and 30 mM NaCl at pH 5.2), leading todecreased charge repulsion between the particle and the surface [1]. A higher deposition rate was obtained by coating the silicasurface with positively charged poly-L-lysine (PLL) (curve with thehighest slope). A negative frequency shift corresponds to mass uptake. The characterization of nanoparticles, e.g. industrial nanoparticles,is important to optimize function and production quality. As an example the adsorption ofLudoxTM silica particles to polymer (PDADMAC)-coated surfaces is studied by QCM-D [2]. The dissipation data for such measurements show significantchanges both with particle concentration and with experiment time. The changes over time at a concentration of 1015 LudoxTM particles/L suggest that a significant degree of surface reorganization occurs at this particle concentration, as opposed toat lower and higher concentrations. A suggested reorganizationscenario is illustrated to the left. In general, a positive dissipationshift corresponds to a softer film. Sensor Types Example: QCM-D studies of nanoparticles in theenvironment A growing field of nanoparticle research relates to thecharacterization of emissions into and fate of nanoparticles in theenvironment, where exposure scenarios are commonly formulatedusing life cycle-based methods. Quantification of nanoparticlesin actual environmental samples is one prerequisite for betterunderstanding of exposure and effects of nanoparticles, as wellas model studies on nanoparticle behavior and transformationsunder environmentally relevant conditions. For example, CeO2 nanoparticle deposition has been studiedusing sensors coated separately with the environmentally relevantminerals silica, iron oxide, and alumina which can be applied toexamine the importance of these mineral phases on nanoparticledeposition [3]. The rate of frequency and dissipation shiftsfollowed the order: silica > iron oxide > alumina in 10 mM NaC|at pH 4.0. The kinetics was qualitatively consistent with thepredictions based on classical colloidal stability theory. Furtherstudies in the presence of low levels of organic matter impliedelectrosteric effects. A negative frequency shift corresponds tomass uptake. Il. Surface-confined nanocomposite structures Surface-based methods offer advantages with respect to thesequential build-up of nanostructured layers in a controlledway. Examples of nanocomposite structures, which have beenstudied by QCM-D, include, e.g., graphene-based layer-by-layerstructures and assemblies of inorganic nanoparticles and cellulosenanofibres. Here, a layer-by-layer approach was employed for Biolin Scientific constructing colloidal semiconductor quantum dots (QDots)and polyelectrolyte peptides in nanocomposite structures thatfacilitate non-radiative Forster-type resonance energy transfer(FRET)[4]. The build-up of these layers was monitored by QCM-D.The ability to control photoluminescence decay lifetime (as illustratedby the fluorescence intensities to the left) was demonstrated byproteolytic enzyme activity, opening up new possibilities for biosensorapplications. Ⅲ. Modeling of nanoparticle layers The acoustically coupled mass measured by QCM-D can includecoupled water. For nanoparticles adsorbed to a surface, theamount of water associated with a particular particle (orbiomolecules such as globular proteins) is dependent on theparticle coverage and how the particle is linked to the support [5,6]. With increasing nanoparticlecoverage the trapped solvent coat (upper figure) of adjacentnanoparticles overlaps, and the measured average amount ofwater per nanoparticle decreases (lower figure). Moreover, thedissipation can provide unique information about the mechanicalproperties of the contact zone between nanoparticles and the surface on which they are attached. ( References: ) ( [1] Chen K L and E l imelech M , Aggregation and Dep os ition Kine t ics of Fuller-ene (C60) Nanoparticles, Langmuir, 2006, 22(26),10994-11001. ) ( [ 2] Xu D , H odg es C, D i ng Y L, Bigg s S, B r ooker A, York D, Ad s orptio n Kinetics of L aponite and Ludox Silica N a noparticles onto a Dep o sited Poly(diallyldime- thylammonium chloride) Layer Measured by a Q uartz Crystal Microbalance and O ptical R eflectometry L a ngmuir, 2010, 26 (23),18105-18112. ) ( [3] Liu X, Chen G, Su C, Influence o f Collector Surface Comp o sition and Water Chemistry on the Deposition of Cerium D i oxide Nanoparticles Environ. Sci. T echnol., 201 2 , 46 (12), 6681-6688. ) ( [ 4] Seker O.S . , Ozel T. , Demir H .V. , Pep t ide-Mediated C onstructs of Quantum D ot Nanocomp o sites for Enzymatic Control of Nonradiative En e rgy Tra n sfer, N ano Lett. , 2011, 11(4) , 1530-1539. ) ( [5] Bingen P., Wang G., S t einmetz N.F., Rodahl M., and Ric h ter R.P. Solvation Effects in the Quartz Crystal Microbalance with Diss i pation Monitori n g R e- sponse to Biomolecular Adsorption. ) ( A P h enomenological Ap pr oach Anal. Chem. 2008, 80, 8880-8890. ) [6] Johannsmann D., Reviakine l., Richter R.P. Dissipation in films of adsorbednanospheres studied by quartz crystal microbalance (QCM) Anal. Chem. 2009,81, 8167-8176. []Q-Sense AO
确定
还剩1页未读,是否继续阅读?

产品配置单


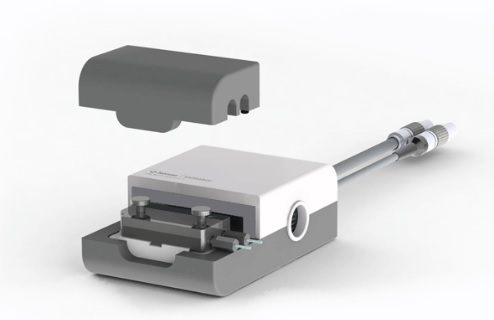
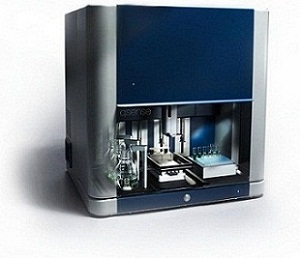
瑞典百欧林科技有限公司为您提供《QCM-D对纳米粒子的研究》,该方案主要用于纳米材料中--检测,参考标准--,《QCM-D对纳米粒子的研究》用到的仪器有QSense卓越版四通道石英晶体微天平、QSense Explorer扩展版石英晶体微天平、QSense全自动八通道石英晶体微天平
推荐专场


相关方案
更多