


方案详情
文
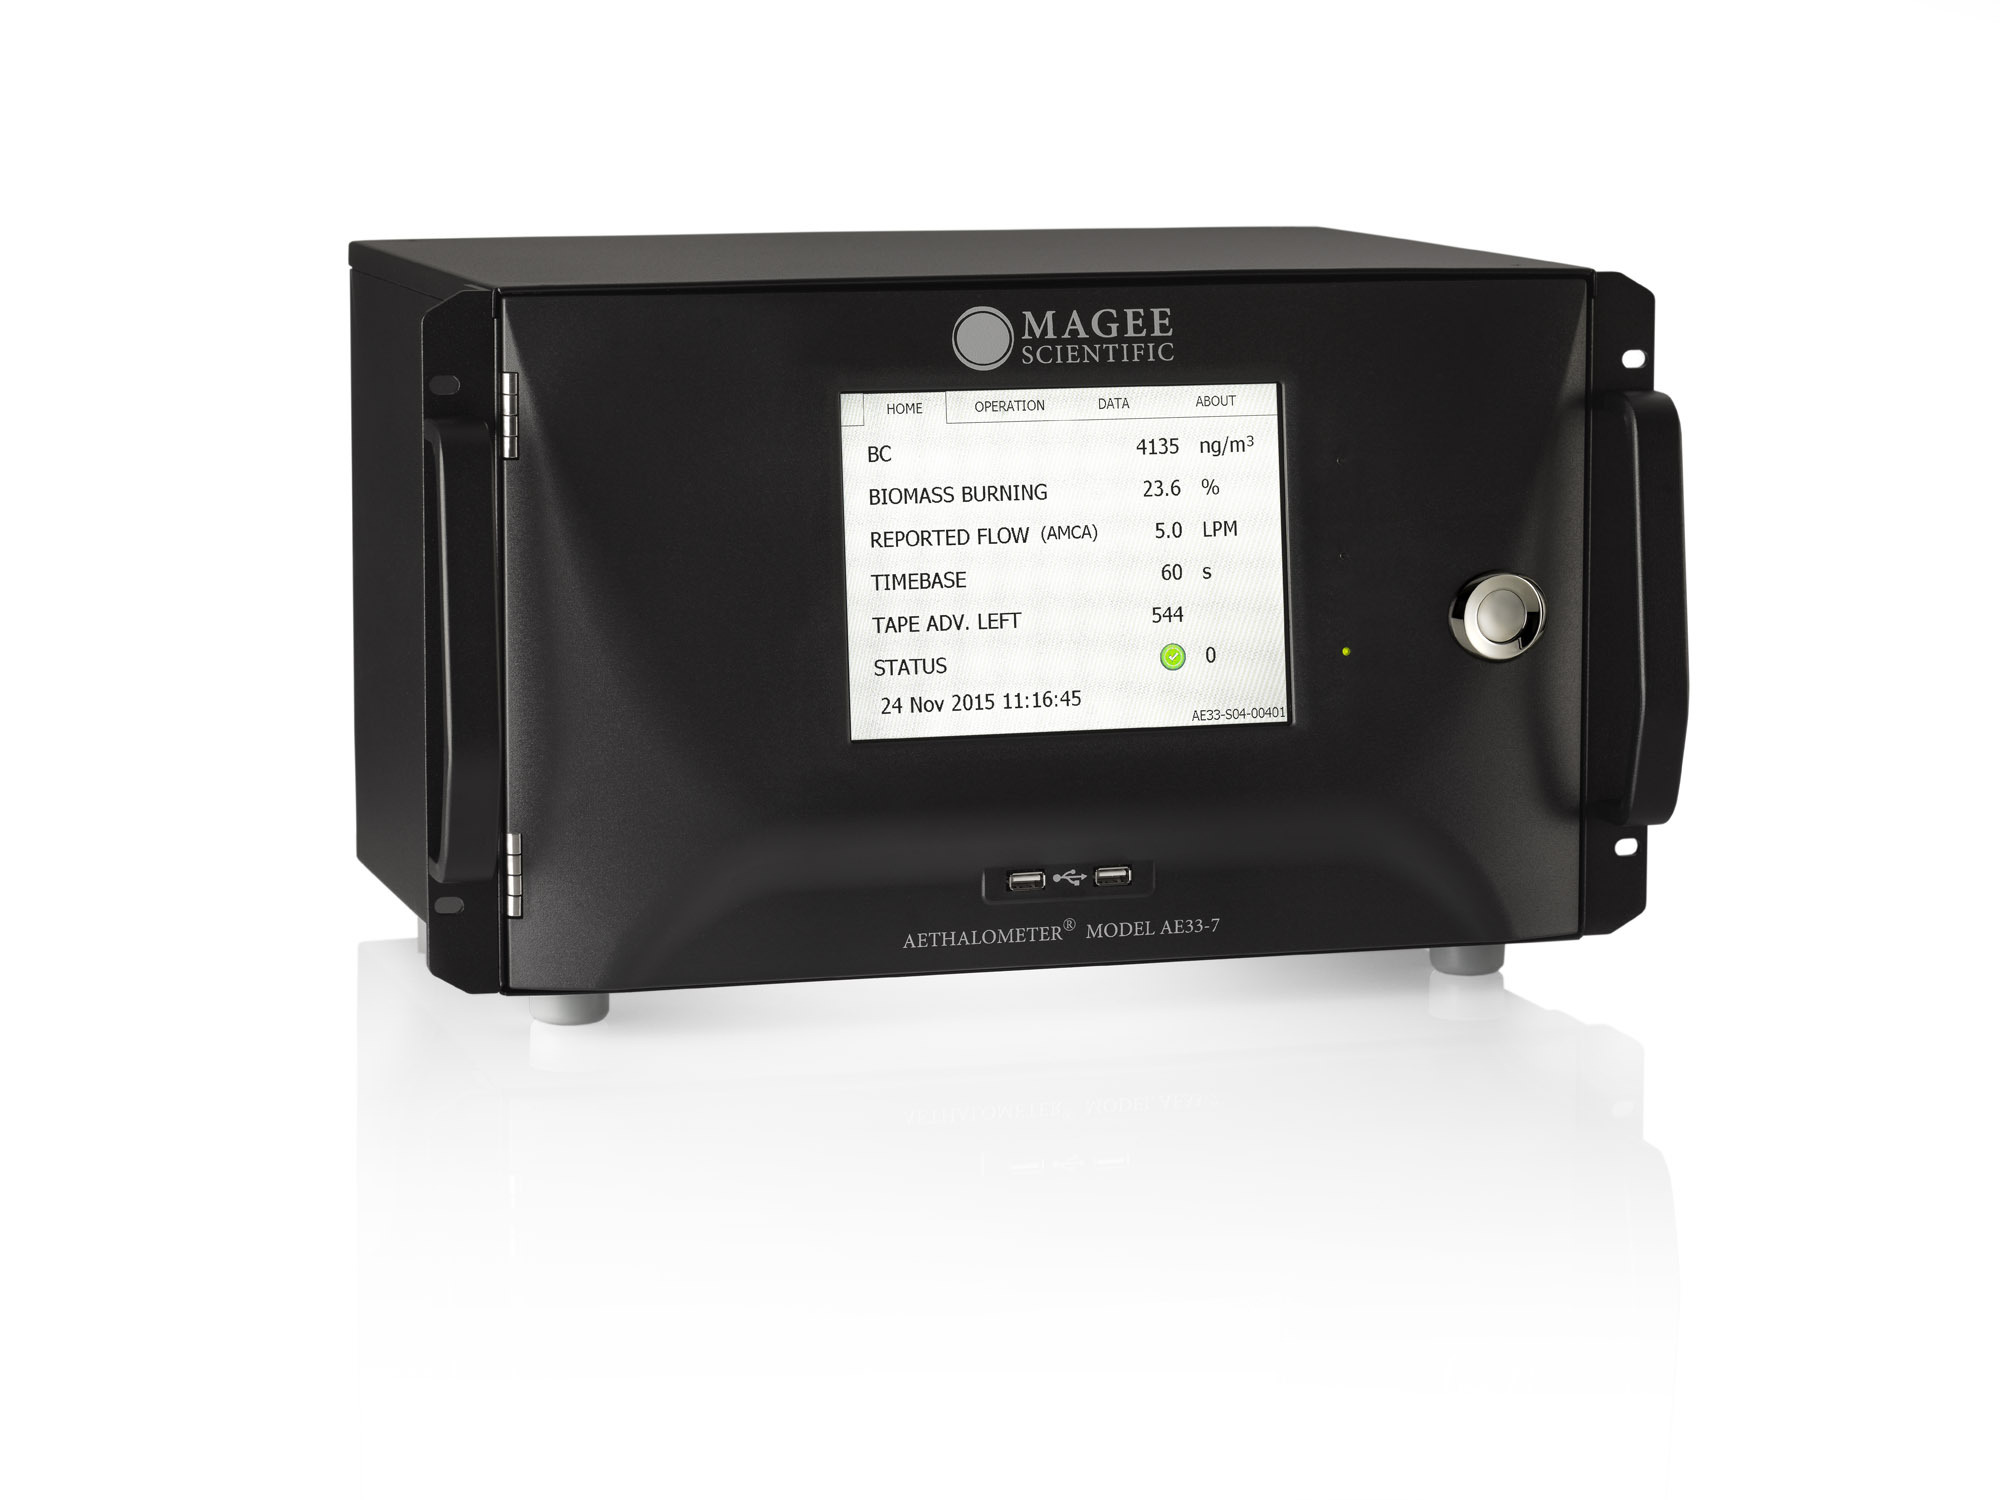
我国2013年1月发生的大规模、长时间大气雾霾天气中,二次有机气溶胶对PM2.5和有机气溶胶的贡献分别为30%~77%和40%~71%(以北京、西安、上海、广州等四地计算平均值)。而在二次有机气溶胶中,生物质燃烧贡献比例显著。我公司的新一代黑碳仪AE-33在源解析中,可直接监测出生物质的比例,另外,太阳光度计可获得AOD参数信息。
方案详情

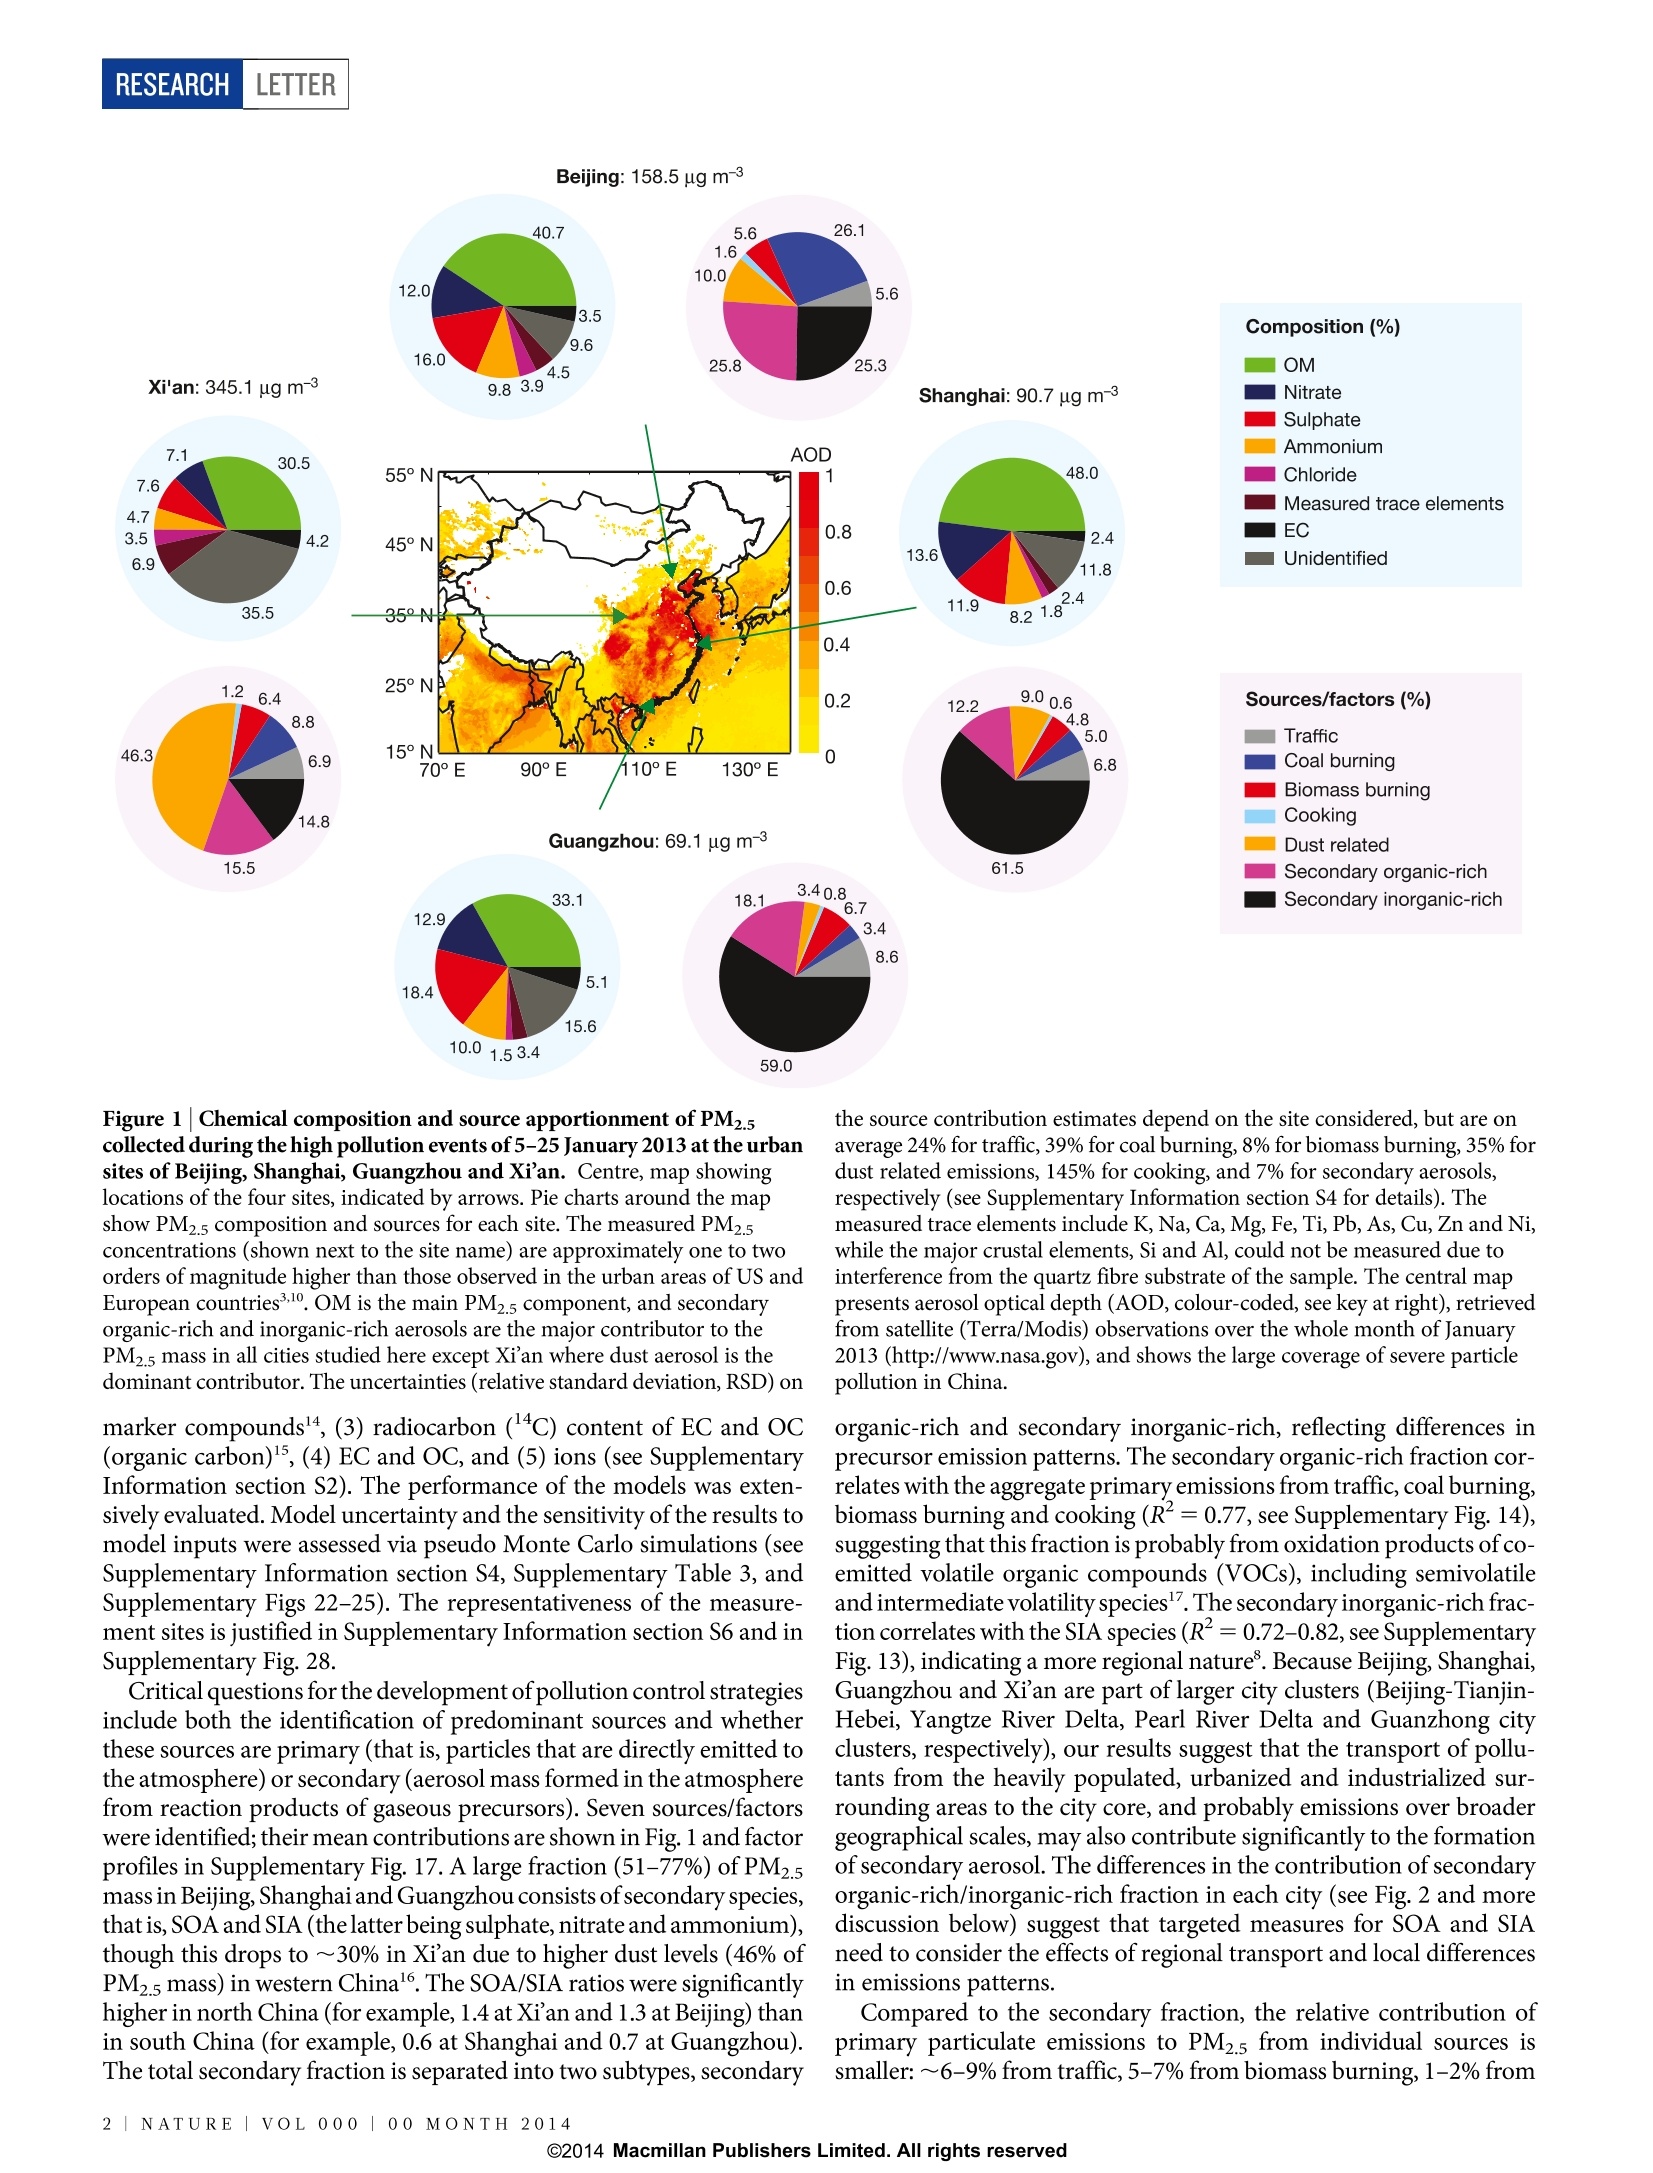
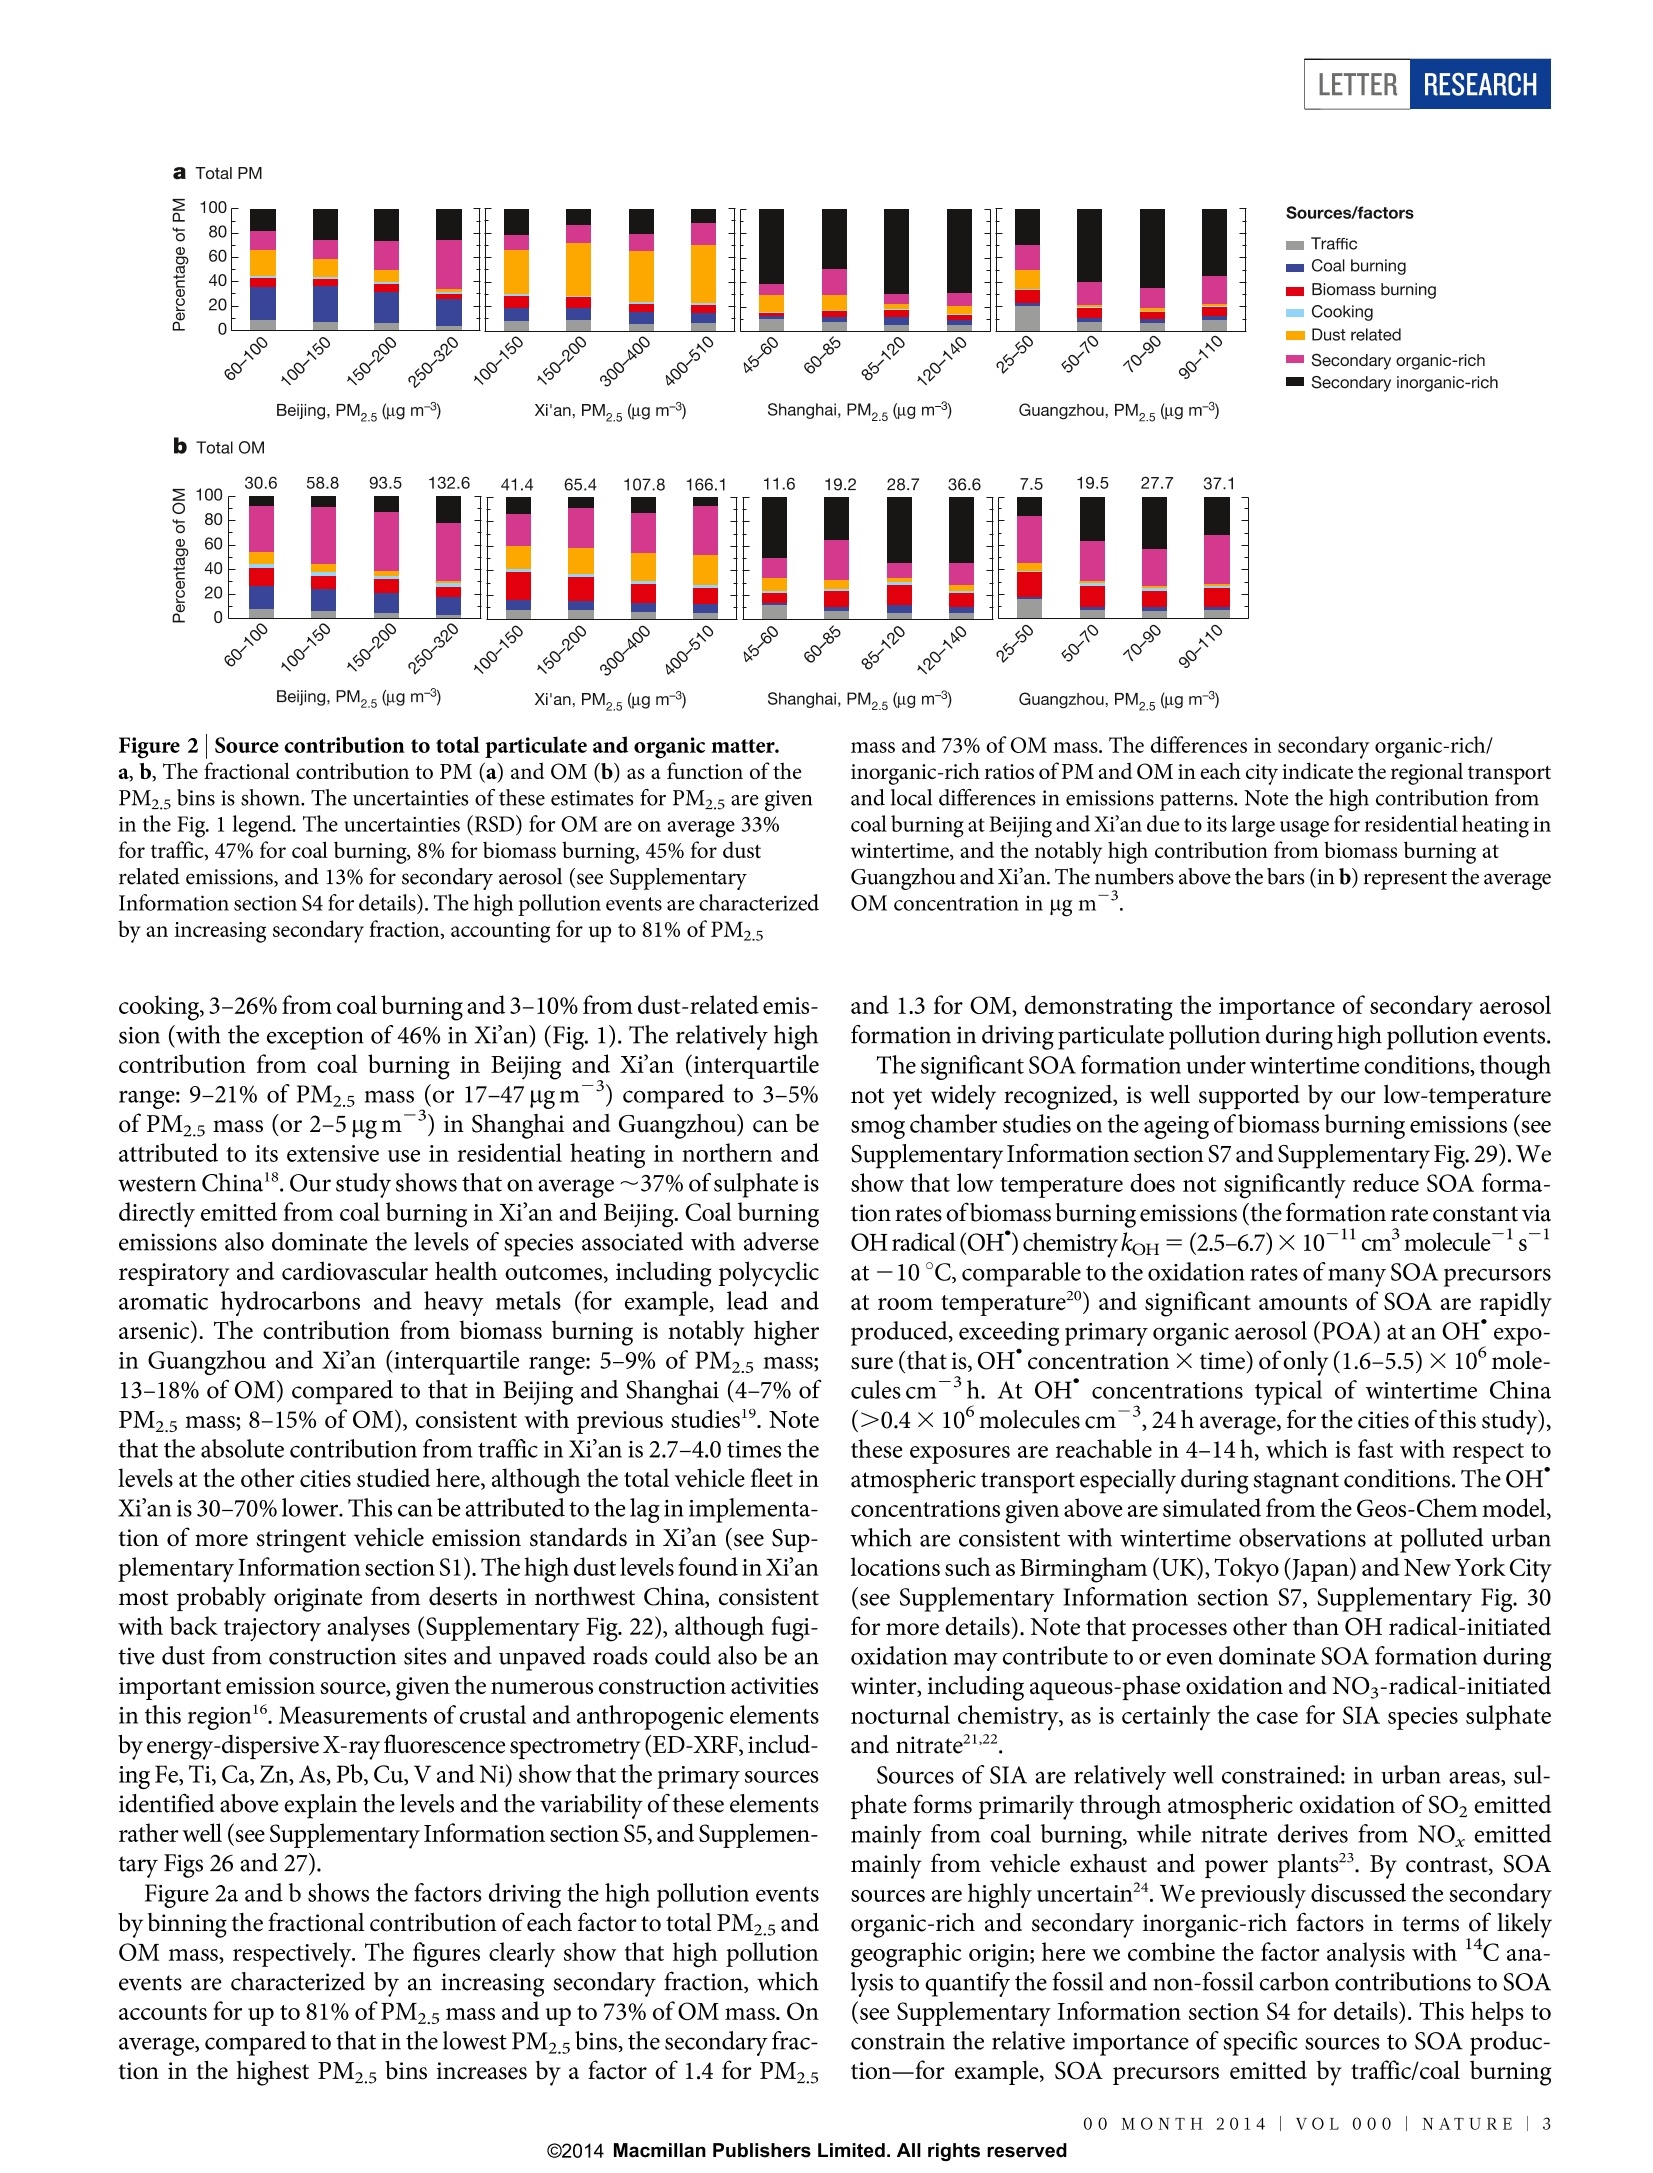
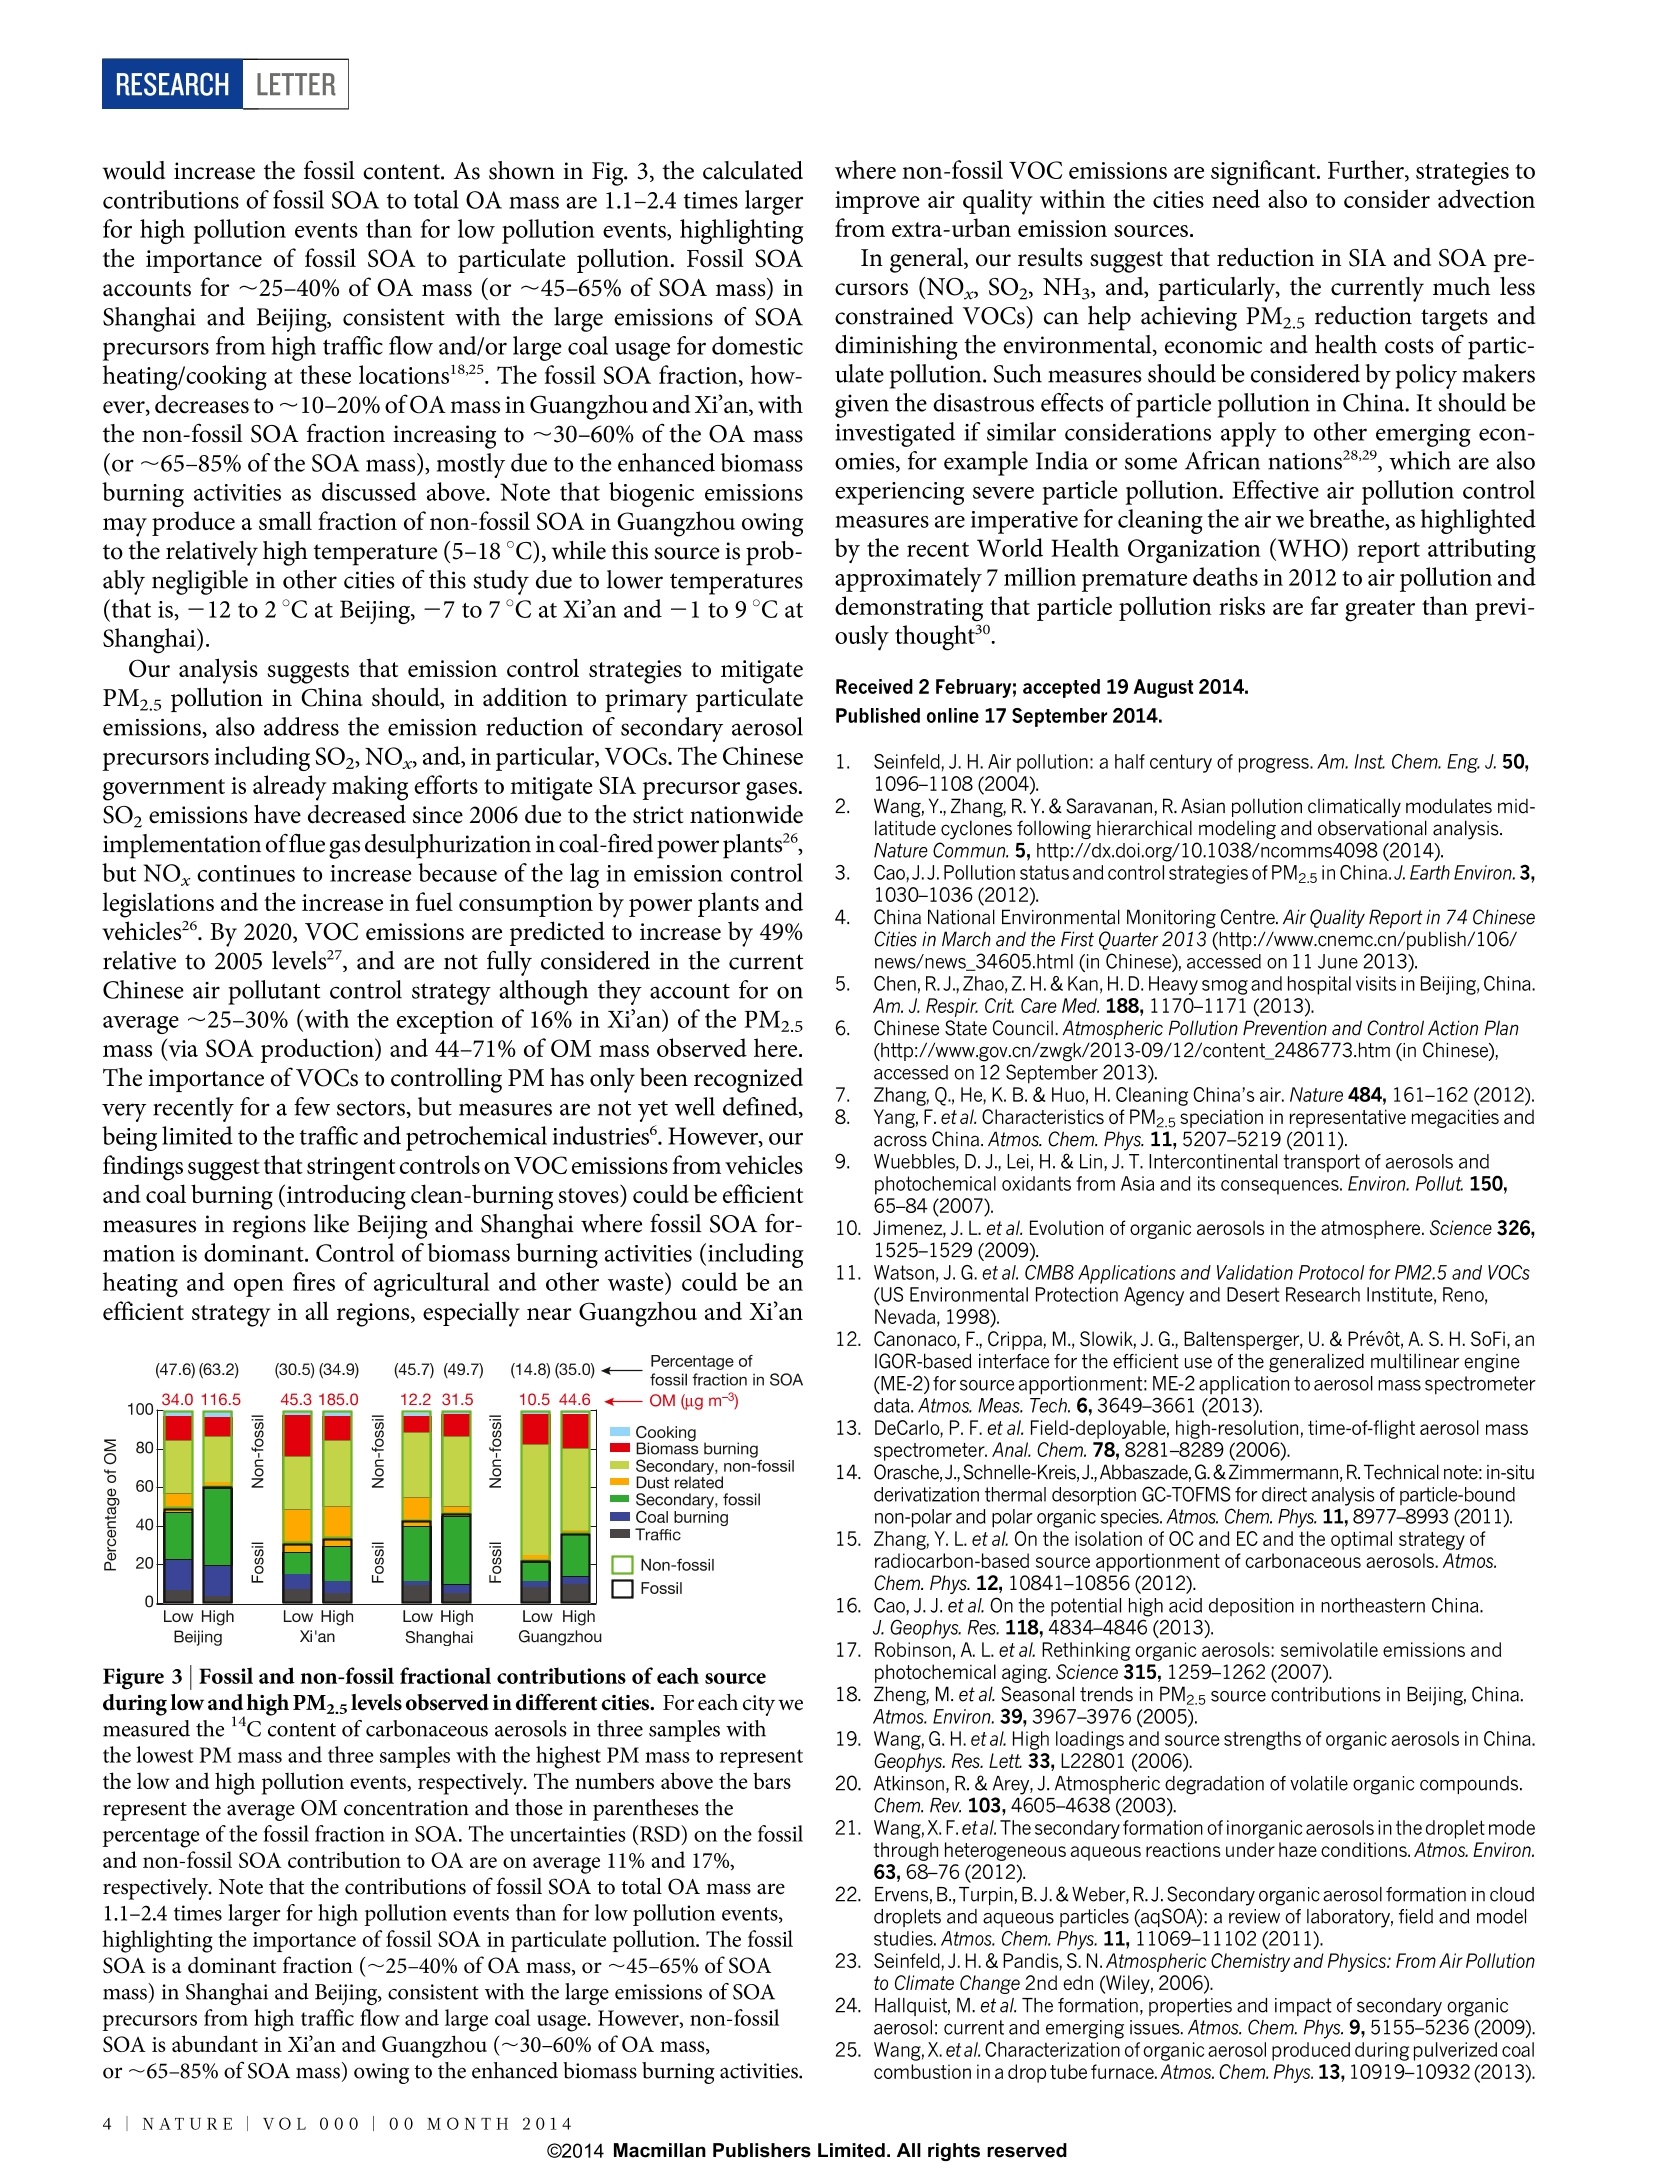
LETTERdoi:10.1038/nature13774 RESEARCHLETTERBeijing: 158.5 ug m-3 High secondary aerosol contribution to particulatepollution during haze events in China Ru-Jin Huangl,2*, Yanlin Zhang, Carlo Bozzettil, Kin-Fai Ho, Jun-Ji Cao?, Yongming Han’, Kaspar R. Daellenbach',Jay G. Slowik, Stephen M. Platt , Francesco Canonaco , Peter Zotter, Robert Wolf, Simone M. Pieber, Emily A. Bruns,Monica Crippat, Giancarlo Ciarelli , Andrea Piazzalunga°, Margit Schwikowski4, Gilcin Abbaszade, Jiirgen Schnelle-Kreis,Ralf Zimmermann7.8, Zhisheng An’, Sonke Szidat’, Urs Baltensperger, Imad El Haddad * & Andre S. H. Prevot Rapid industrialization and urbanization in developing countrieshas led to an increase in air pollution, along a similar trajectory tothat previously experienced by the developed nations . In China,particulate pollution is a serious environmental problem that isinfluencing air quality, regional and global climates, and humanhealth23. In response to the extremely severe and persistent hazepollution experienced by about 800 million people during the firstquarter of 2013 (refs 4,5), the Chinese State Council announced itsaim to reduce concentrations of PM2.5 (particulate matter with anaerodynamic diameter less than 2.5 micrometres) by up to 25 percent relative to 2012 levels by 2017 (ref. 6). Such efforts howeverrequire elucidation of the factors governing the abundance andcomposition of PM2.5, which remain poorly constrained in China.Here we combine a comprehensive set of novel and state-of-the-artoffline analytical approaches and statistical techniques to investi-gate the chemical nature and sources of particulate matter at urbanlocations in Beijing, Shanghai, Guangzhou and Xi'an during January2013. We find that the severe haze pollution event was driven to alarge extent by secondary aerosol formation, which contributed30-77 per cent and 44-71 per cent (average for all four cities) ofPM2.5 and of organic aerosol,respectively. On average, the contri-bution of secondary organic aerosol (SOA) and secondary inorganicaerosol (SIA) are found to be of similar importance (SOA/SIA ratiosrange from 0.6 to 1.4). Our results suggest that, in addition tomitigating primary particulate emissions, reducing the emissionsof secondary aerosol precursors from, for example, fossil fuel com-bustion and biomass burning is likely to be important for con-trolling China’s PM2.5 levels and for reducing the environmental,economic and health impacts resulting from particulate pollution. In the first quarter of 2013, China experienced extremely severe andpersistent haze pollution, affecting~1.3 million km and~800 millionpeople.Measurements at 74 major cities showed that the daily averageconcentrations of PM2.5 exceeded the Chinese pollution standard of75 ug m(about twice that of the US EPA standard of 35 ug m) for69% of days in January, with a record-breaking daily concentration of772ug m(ref. 4). This acute pollution was accompanied by extre-mely poor visibility and air quality, as reflected in the aerosol opticaldepth (AOD; Fig. 1), and a sharp increase in respiratory diseases. On alonger timescale, long-range transport of pollutants from China mayaffect North America, the Pacific and the Arctic, making Chinese airpollution a truly global problem2. In response to the severehaze eventsof 2013, the Chinese State Council quickly released the ‘AtmosphericPollution Prevention and Control Action Plan’on 10 September 2013, which aims to reduce PM2.5 by up to 25% by 2017 relative to 2012levels, and is backed by US $277 billion in investments from the centralgovernment. Achieving this highly ambitious goal requires targeted,optimized emission control strategies. However, the factors governingPM.5 concentrations in China are poorly constrained3.8, significantlyhindering such efforts. Here we combine a comprehensive set of noveland state-of-the-art offline (filter-based) analytical approaches andstatistical techniques to elucidate the chemical nature and predominantsources of aerosol particles during the January 2013 severe haze pollutionevents in China. O9uru rresults may aid the initiation of practical measuresfor PM2.5 emission reductions. Furthermore, owing to the widespreadavailability of ambient filters, the measurement strategies and analysistechniques developed herein are applicable to other emerging economiesor developing countries, potentially facilitating their efforts to designeffective mitigation strategies. We investigated the 2013 haze pollution events with measurementsat urban locations in Beijing, Shanghai, Guangzhou and Xi’an,locatedrespectively in the northern, eastern, southern and western regions ofChina (see Supplementary Information section S1 for details). AveragePM2.5 concentrations were approximately one to two orders of mag-nitude higher than those observed in urban areas in the US and Europeancountries310. As shown in Fig.1, daily average PM2.5 concentrations atXi’'an (345 ug m) were more than twice those of the other sites, fol-lowed by Beijing (159 ugm), Shanghai (91 ugm) and Guangzhou(69ug m). Chemical analyses (see Supplementary Information sec-tion S2, and Supplementary Table 1) shows that organic matter (OM)constitutes a major fraction (30-50%) of the total PM2.5 in all citiesstudied here, followed by sulphate (8-18%), nitrate (7-14%), ammo-nium (5-10%), elemental carbon (EC, 2-5%) and chloride (2-4%)(Fig. 1). Only about 10-15% was unidentified for Beijing, Shanghaiand Guangzhou, though this increases to ~35% in Xi’an owing to ele-vated dust concentrations (see below), most probably consisting ofcrustal material such as aluminium and silicon oxides. The sources ofPM2.5 and OM are apportioned by applying two com-plementary bilinear receptor models-that is, chemical mass balance(CMB)and positive matrix factorization (PMF) using the multilinearengine ME-2 (ref. 12), see Supplementary Information section S3,SupplementaryTable 2, and Supplementary Figs 1-21-and a samplingalgorithm (that is, pseudo Monte Carlo calculation, see Supplemen-tary Information section S4) to an unprecedented data set. This dataset includes (1) high resolution (HR) mass spectra (by analysing neb-ulized water-extracts of the filter samples with a high resolution time-of-flight aerosol mass spectrometer, HR-ToF-AMS13), (2) organic ( L aboratory of Atmospheric Chemistry,Paul ScherrerInstitute (PSI), 5232 V illigen, Switz e rland.State K ey Laboratory of Loess an d Quaternary Geology (S K LLQG), and Key Labo r ator y of Aerosol Chemistryand Physics,Institute of Earth Environment, Chinese Academy of Sciences,Xi' a n 710075,China . Departmentof Chemistry and Biochemistry,andOeschger Centre for Climate Change Research,University of B ern, 3 012 Bern, Switzerland.“Laboratory of Radiochemistry and Env i ronmental Chem i stry,Paul Scherrer Institute (PSI ) , 523 2 Villigen, Sw i tzerland.The Jockey Club School of Pu b lic Health and Primary C are,T h e Chinese University of Hong Kong, Hong Kong,China.Department ofEar t h and Environmental Sci e nces, University of Milano Bicocca,Piazza della Scienza 1,Milan 20126, Italy.Helmholtz Zentrum M unchen, German Research Center for Environmental Health (GmbH), Joint Mass Spectrometry Centre, Cooperation Group Comprehensive Molecular Analytics and Helmholtz Virtual Institute of Complex M olecular Systems in Environmental He a lth -Aerosol and Health (HICE), 85764 Neuh e rberg, Germany. University of Rostock, Joint Mass Spectrometry Centre, I nstitute of Chemistry,Analytical Chemistry, 18015 Rostock, Germany. tPre s ent address: European Commission,Joint Research C e ntre,Institute for Environment and Sustainability, Air and Climate Unit, Via Fermi, 2749, 2 1027 Ispra, I t aly. ) ( *These authors contributed equally to this work. ) 59.0 Figure 1| Chemical composition and source apportionment of PM2.5collected during the high pollution events of 5-25 January 2013 at the urbansites of Beijing, Shanghai, Guangzhou and Xi’an. Centre, map showinglocations of the four sites, indicated by arrows. Pie charts around the mapshow PM2.5 composition and sources for each site.The measured PM2.5concentrations (shown next to the site name) are approximately one to twoorders of magnitude higher than those observed in the urban areas of US andEuropean countries3,10.OM is the main PM2.5 component, and secondaryorganic-rich and inorganic-rich aerosols are the major contributor to thePM2.5 mass in all cities studied here except Xi’an where dust aerosol is thedominant contributor. The uncertainties (relative standard deviation, RSD) on marker compounds, (3) radiocarbon (4C) content of EC and OC(organic carbon), (4) EC and OC, and (5) ions (see SupplementaryInformation section S2). The performance of the models was exten-sively evaluated. Model uncertainty and the sensitivity of the results tomodel inputs were assessed via pseudo Monte Carlo simulations (seeSupplementary Information section S4, Supplementary Table 3, andSupplementary Figs 22-25). The representativeness of the measure-ment sites is justified in Supplementary Information section S6 and inSupplementary Fig. 28. C( Critical questions for the development ofpollution control strategiesinclude both the identification of predominant sources and whetherthese sources are primary (that is, particles that are directly emitted tothe atmosphere) or secondary (aerosol mass formed in the atmospherefrom reaction products of gaseous precursors). Seven sources/factorswere identified; their mean contributions are shown in Fig. 1 and factorprofiles in Supplementary Fig. 17. A large fraction (51-77%) of PM2.5mass in Beijing, Shanghaiand Guangzhou consists ofsecondary species,that is, SOA and SIA (thelatter being sulphate, nitrate and ammonium),though this drops to ~30% in Xi’an due to higher dust levels (46% of)fPM.s mass) in western China.The SOA/SIA ratios were significantlyhigher in north China (for example, 1.4 at Xi’an and 1.3 at Beijing) thanin south China (for example, 0.6 at Shanghai and 0.7 at Guangzhou).The total secondary fraction is separated into two subtypes, secondary the source contribution estimates depend on the site considered, but are onaverage 24% for traffic, 39% for coal burning, 8% for biomass burning, 35% fordust related emissions, 145% for cooking, and 7% for secondary aerosols,respectively (see Supplementary Information section S4 for details). Themeasured trace elements include K,Na, Ca, Mg, Fe, Ti, Pb, As, Cu, Zn and Ni,while the major crustal elements, Si and Al, could not be measured due tointerference from the quartz fibre substrate of the sample. The central mappresents aerosol optical depth (AOD, colour-coded, see key at right), retrievedfrom satellite (Terra/Modis) observations over the whole month of January2013 (http://www.nasa.gov), and shows the large coverage of severe particlepollution in China. organic-rich and secondary inorganic-rich, reflecting differences inprecursor emission patterns. The secondary organic-rich fraction cor-relates with the aggregate primary emissions from traffic, coal burning,biomass burning and cooking (R²=0.77, see Supplementary Fig. 14),suggesting that this fraction is probably from oxidation products of co-emitted volatile organic compounds (VOCs), including semivolatileand intermediate volatility species. The secondary inorganic-rich frac-tion correlates with the SIA species (R²= 0.72-0.82, see SupplementaryFig. 13), indicating a more regional nature. Because Beijing, Shanghai,Guangzhou and Xi’an are part of larger city clusters (Beijing-Tianjin-Hebei, Yangtze River Delta, Pearl River Delta and Guanzhong cityclusters, respectively), our results suggest that the transport of pollu-tants from the heavily populated, urbanized and industrialized sur-rounding areas to the city core, and probably emissions over broadergeographical scales, may also contribute significantly to the formationof secondary aerosol. The differences in the contribution of secondaryorganic-rich/inorganic-rich fraction in each city (see Fig. 2 and morediscussion below) suggest that targeted measures for SOA and SIAneed to consider the effects of regional transport and local differencesin emissions patterns. Compared to the secondary fraction, the relative contribution ofprimary particulate emissions to PM2.5 from individual sources issmaller: ~6-9% from traffic, 5-7% from biomass burning, 1-2% from Sources/factors Traffic Coal burning i Biomass burning Cooking i Dust related Secondary organic-rich i Secondary inorganic-rich Figure 2 Source contribution to total particulate and organic matter.a, b, The fractional contribution to PM (a) and OM (b) as a function of thePM2.5 bins is shown. The uncertainties of these estimates for PM2.5 are givenin the Fig. 1 legend. The uncertainties (RSD) for OM are on average 33%for traffic,47% for coal burning, 8% for biomass burning, 45% for dustrelated emissions,and 13% for secondary aerosol (see SupplementaryInformation section S4 for details). The high pollution events are characterizedby an increasing secondary fraction, accounting for up to 81% of PM2.s cooking, 3-26% from coal burning and 3-10% from dust-related emis-sion (with the exception of 46% in Xi'an) (Fig.1). The relatively highcontribution from coal burning in Beijing and Xi'an (interquartilerange: 9-21% of PM2.5 mass (or 17-47 ug m-) compared to 3-5%of PM2.s mass (or 2-5ugm) in Shanghai and Guangzhou) can beattributed to its extensive use in residential heating in northern andwestern China.Our study shows that on average ~37% of sulphate isdirectly emitted from coal burning in Xi’an and Beijing. Coal burningemissions also dominate the levels of species associated with adverserespiratory and cardiovascular health outcomes, including polycyclicaromatic hydrocarbons and heavy metals (for example, lead andarsenic). The contribution from biomass burning is notably higherin Guangzhou and Xi’an (interquartile range: 5-9% of PM2.5 mass;13-18% of OM) compared to that in Beijing and Shanghai (4-7% ofPM25 mass; 8-15% of OM), consistent with previous studies9. Notethat the absolute contribution from traffic in Xi'an is 2.7-4.0 times thelevels at the other cities studied here, although the total vehicle fleet inXi’an is 30-70%lower. This can be attributed to the lag in implementa-tion of more stringent vehicle emission standards in Xi'an (see Sup-plementary Information section S1). The high dust levels found in Xi'anmost probably originate from deserts in northwest China, consistentwith back trajectory analyses (Supplementary Fig. 22), although fugi-tive dust from construction sites and unpaved roads could also be animportant emission source, given the numerous construction activitiesin this region. Measurements of crustal and anthropogenic elementsby energy-dispersive X-ray fluorescence spectrometry (ED-XRF,includ-ing Fe, Ti, Ca,Zn, As, Pb, Cu, V and Ni) show that the primary sourcesidentified above explain the levels and the variability of these elementsrather well (see Supplementary Information section S5, and Supplemen-tary Figs 26 and 27). Figure 2a and b shows the factors driving the high pollution eventsby binning the fractional contribution of each factor to total PM2.s andOM mass, respectively. The figures clearly show that high pollutionevents are characterized by an increasing secondary fraction, whichaccounts for up to 81% of PM2.s mass and up to 73% of OM mass. Onaverage, compared to that in the lowest PM2.5 bins, the secondary frac-tion in the highest PM2.5 bins increases by a factor of 1.4 for PM2.5 mass and 73% of OM mass. The differences in secondary organic-rich/inorganic-rich ratios of PM and OM in each city indicate the regional transportand local differences in emissions patterns. Note the high contribution fromcoal burning at Beijing and Xi’an due to its large usage for residential heating inwintertime, and the notably high contribution from biomass burning atGuangzhou and Xi’an. The numbers above the bars (in b) represent the averageOM concentration in ug m3 and 1.3 for OM, demonstrating the importance of secondary aerosolformation in driving particulate pollution during high pollution events. The significant SOA formation under wintertime conditions, thoughnot yet widely recognized, is well supported by our low-temperaturesmog chamber studies on the ageing of biomass burning emissions (seeSupplementary Information section S7 and Supplementary Fig.29). Weshow that low temperature does not significantly reduce SOA forma-tion rates of biomass burning emissions (the formation rate constant viaOHradical(OH) chemistry koH=(2.5-6.7)×10-cm’moleculesat -10C, comparable to the oxidation rates of many SOA precursorsat room temperature20) and significant amounts of SOA are rapidlyproduced, exceeding primary organic aerosol (POA) at an OH expo-sure (that is, OHconcentration X time) ofonly (1.6-5.5)×10° mole-cules cmh. At OH’ concentrations typical of wintertime China(>0.4×10°molecules cm, 24 h average, for the cities of this study),these exposures are reachable in 4-14 h, which is fast with respect toatmospheric transport especially during stagnant conditions. The OHconcentrations given above are simulated from the Geos-Chem model,which are consistent with wintertime observations at polluted urbanlocations such as Birmingham (UK), Tokyo (Japan) and New York City(see Supplementary Information section S7, Supplementary Fig. 30for more details). Note that processes other than OH radical-initiatedoxidation may contribute to or even dominate SOA formation duringwinter, including aqueous-phase oxidation and NO3-radical-initiatednocturnal chemistry, as is certainly the case for SIA species sulphateand nitrate21,22 Sources of SIA are relatively well constrained: in urban areas, sul-phate forms primarily through atmospheric oxidation of SO2 emittedmainly from coal burning, while nitrate derives from NO, emittedmainly from vehicle exhaust and power plants. By contrast, SOAsources are highly uncertain24. We previously discussed the secondaryorganic-rich and secondary inorganic-rich factors in terms of likelygeographic origin; here we combine the factor analysis with 4C ana-lysis to quantify the fossil and non-fossil carbon contributions to SOA(see Supplementary Information section S4 for details). This helps toconstrain the relative importance of specific sources to SOA produc-tion-for example, SOA precursors emitted by traffic/coal burning would increase the fossil content. As shown in Fig. 3, the calculatedcontributions of fossil SOA to totalOA mass are 1.1-2.4 times largerfor high pollution events than for low pollution events, highlightingthe importance of fossil SOA to particulate pollution. Fossil SOAaccounts for ~25-40% of OA mass (or ~45-65% of SOA mass) inShanghai and Beijing, consistent with the large emissions of SOAprecursors from high traffic flow and/or large coal usage for domesticheating/cooking at these locations18.25. The fossil SOA fraction, how-ever,decreases to ~10-20% of OA mass in Guangzhou and Xi’an, withthe non-fossil SOA fraction increasing to ~30-60% of the OA mass(or~65-85% of the SOA mass), mostly due to the enhanced biomassburning activities as discussed above. Note that biogenic emissionsmay produce a small fraction of non-fossil SOA in Guangzhou owingto the relatively high temperature(5-18℃), while this source is prob-ably negligible in other cities of this study due to lower temperatures(that is, -12 to 2 ℃ at Beijing, -7 to 7°C at Xi’an and -1 to 9℃ atShanghai). Our analysis suggests that emission control strategies to mitigatePM2.5 pollution in China should, in addition to primary particulateemissions, also address the emission reduction of secondary aerosolprecursors including SO2,NO,,and, in particular,VOCs. The Chinesegovernment is already making efforts to mitigate SIA precursor gases.SO2 emissions have decreased since 2006 due to the strict nationwideimplementation of flue gas desulphurization in coal-fired power plants2,but NO, continues to increase because of the lag in emission controllegislations and the increase in fuel consumption by power plants andvehicles2. By 2020, VOC emissions are predicted to increase by 49%relative to 2005 levels, and are not fully considered in the currentChinese air pollutant control strategy although they account for onaverage ~25-30% (with the exception of 16% in Xi’an) of the PM2.5mass (via SOA production) and 44-71% of OM mass observed here.The importance of VOCs to controlling PM has only been recognizedvery recently for a few sectors, but measures are not yet well defined,being limited to the traffic and petrochemical industries°. However, ourfindings suggest that stringent controls on VOCemissions from vehiclesand coal burning (introducing clean-burning stoves) could be efficientmeasures in regions like Beijing and Shanghai where fossil SOA for-mation is dominant. Control of biomass burning activities (includingheating and open fires of agricultural and other waste) could be anefficient strategy in all regions, especially near Guangzhou and Xi’an Figure3 Fossil and non-fossil fractional contributions of each sourceduring low and high PM2.s levels observed in different cities. Foreach city wemeasured the 4c content of carbonaceous aerosols in three samples withthe lowest PM mass and three samples with the highest PM mass to representthe low and high pollution events, respectively. The numbers above the barsrepresent the average OM concentration and those in parentheses thepercentage of the fossil fraction in SOA. The uncertainties (RSD) on the fossiland non-fossil SOA contribution to OA are on average 11% and 17%,respectively. Note that the contributions of fossil SOA to total OA mass are1.1-2.4 times larger for high pollution events than for low pollution events,highlighting the importance of fossil SOA in particulate pollution. The fossilSOA is a dominant fraction (~25-40% ofOA mass, or ~45-65% of SOAmass) in Shanghai and Beijing, consistent with the large emissions of SOAprecursors from high traffic flow and large coal usage. However, non-fossilSOA is abundant in Xi’an and Guangzhou (~30-60% of OA mass,or ~65-85% of SOA mass) owing to the enhanced biomass burning activities. where non-fossil VOC emissions are significant. Further, strategies toimprove air quality within the cities need also to consider advection.from extra-urban emission sources. In general, our results suggest that reduction in SIA and SOA pre-cursors (NO,, SO2, NH, and, particularly, the currently much lessconstrained VOCs) can help achieving PM2.5 reduction targets anddiminishing the environmental, economic and health costs of partic-ulate pollution. Such measures should be considered by policy makersgiven the disastrous effects of particle pollution in China. It should beinvestigated if similar considerations apply to other emerging econ-omies, for example India or some African nations28.29, which are alsoexperiencing severe particle pollution. Effective air pollution controlmeasures are imperative for cleaning the air we breathe, as highlightedby the recent World Health Organization (WHO) report attributingapproximately 7 million premature deaths in 2012 to air pollution anddemonstrating that particle pollution risks are far greater than previ-ously thought ( Received 2 February; accepted 19 August 2014. P ublished o nline 17 September 2014. ) 1.Seinfeld, J. H. Air pollution: a half century of progress. Am. Inst. Chofeldo ceoonollution:em. Eng. J.50, 2. .Wang,Y.,Zhang,R. Y. & Saravanan,R. Asian pollution climatically modulates mid-latitude cyclones following hierarchical modeling and observational analysis.Nature Commun. 5,http://dx.doi.org/10.1038/ncomms4098 (2014). 3. Cao,J.J. Pollution status and control strategies of PM2.5 in China.J. Earth Environ.3,1030-1036(2012). 4. China National Environmental Monitoring Centre. Air Quality Report in 74 ChineseCities in March and the First Quarter 2013 (http://www.cnemc.cn/publish/106/ news/news_34605.html (in Chinese), accessed on 11 June 2013). J5.ntm5. Chen,R.J.,Zhao,Z. H.& Kan,H. D. Heavy smog and hospital visits in Beijing,ChinaAm. J.Respir. Crit. Care Med. 188,1170-1171(2013). 6. Chinese State Council. Atmospheric Pollution Prevention and Control Action Plan(http://www.gov.cn/zwgk/2013-09/12/content_2486773.htm (in Chinese),accessed on 12 September 2013). Zhang, Q, He, K. B. & Huo, H. Cleaning China’s air. Nature 484,161-162(2012) ( 78 Y ang, F. et al. Characteristics of PM2.5 speciation in representative megacities and a cross China. Atmos. Chem. Phys. 11 , 5207-5219(2011). ) ( 9. W uebbles, D.J.,Lei, H. & Lin,J. T. I n tercontinental transport of aerosols and p hotochemical oxidants from Asia and it s consequences. Environ. Pollut 150, 65-84 (2007). ) 10.Jimenez,J. L. et al. Evolution of organic aerosols in the atmosphere. Science 326,1525-1529(2009). 11. Watson,J. G. et al. CMB8 Applications and Validation Protocol for PM2.5 and VOCs(US Environmental Protection Agency and Desert Research Institute,Reno,Nevada,1998). 12.Canonaco,F., Crippa,M., Slowik, J. G., Baltensperger, U. & Prevot, A. S. H. SoFi,anIGOR-based interface for the efficient use of the generalized multilinear engine(ME-2) for source apportionment: ME-2 application to aerosol mass spectrometerdata. Atmos. Meas. Tech. 6,3649-3661(2013) 13. DeCarlo, P. F. et al. Field-deployable,high-resolution, time-of-flight aerosol massspectrometer. Anal. Chem.78,8281-8289(2006). 14. Or(asche,J.,Schnelle-Kreis,J.,Abbaszade,G.& Zimmermann,R. Technical note:in-situderivatization thermal desorption GC-TOFMS for direct analysis of particle-boundnon-polar and polar organic species. Atmos. Chem. Phys. 11,8977-8993(2011). 15. Zhang, Y. L. et al. On the isolation of OC and EC and the optimal strategy ofradiocarbon-based source apportionment of carbonaceous aerosols. Atmos.Chem. Phys. 12, 10841-10856(2012). 16. Cao,J.J.et al. On the potential high acid deposition in northeastern China.J. Geophys. Res. 118,4834-4846(2013).3). 17. Robinson, A. L. et al. Rethinking organic aerosols: semivolatile emissions and photochemical aging. Science 315,1259-1262(2007). 18. Zheng, M. et al. Seasonal trends in PM2.5 source contributions in Beijing, China.Atmos. Environ. 39,3967-3976(2005). 19. Wang, G.H. et al. High loadings and source strengths of organic aerosols in China.Geophys. Res. Lett. 33,L22801 (2006). 20. Atkinson, R. & Arey,J. Atmospheric degradation of volatile organic compounds.Chem. Rev.103,4605-4638 (2003). 21. Wang,X.F.etal.The secondary formation ofinorganic aerosols in the droplet modethrough heterogeneous aqueous reactions under haze conditions.Atmos. Environ.63,68-76(2012). 22. Erven/se,B.,Turpin, B.J.& Weber,R.J.Secondary organic aerosol formation in clouddroplets and aqueous particles (aqSOA): a review of laboratory, field and modelstudies. Atmos. Chem.Phys. 11,11069-11102(2011). 23. Seinfeld,J. H.& Pandis,S.N. Atmospheric Chemistry and Physics: From Air Pollutionto Climate Change 2nd edn (Wiley,2006). 24. Hallquist, M. et al. The formation, properties and impact of secondary organicaerosol: current and emerging issues. Atmos. Chem. Phys. 9,5155-5236(2009) 25. Wang,X.etal.Characterization oforganic aerosol produced during pulverized coal. combustion in a drop tube furnace.Atmos. Chem. Phys. 13,10919-10932(2013). 26. Wang,Y., Zhang, Q. Q., He, K.,Zhang, Q. & Chai, L. Sulfate-nitrate-ammoniumaerosols over China: response to 2000-2015 emission changes of sulfur dioxide,nitrogen oxides, and ammonia. Atmos. Chem. Phys. 13,2635-2652(2013). 27. Xing, J. et al. Projections of air pollutant emissions and its impacts on regional airquality in China in 2020. Atmos. Chem. Phys. 11,3119-3136(2011). 28.Tiwari, S. et al. Diurnal and seasonal variations of black carbon and PM2.5 overNew Delhi,India: Influence of meteorology. Atmos. Res. 125-126,50-62(2013). 29. The United Nations Environment Program (UNEP). Africa Environment Outlook 3:Our Environment, Our Health (2013); available at http://www.unep.org/pdf/aeo3.pdf. 30. The World Health Organization (WHO). 7 Million Premature Deaths Annually Linkedto Air Pollution (published online 25 March 2014); available at http://www.who.int/mediacentre/news/releases/2014/air-pollution/en/. Supplementary Information is available in the online version of the paper. Acknowledgements The research leading to these results received funding from the European Community's Seventh Framework Programme (FP7/2007-2013)undergrant agreement no. 290605, the Swiss National Science Foundation (SAPMAV, no.200021_13016,WOOSHI, no. 200021L_140590, and Ambizione,PZ0OP2_131673), the Swiss Competence Centers Environment and Sustainabilityas well as Energy and Mobility under project OPTIWARES, the National ScienceFoundation of China(no. 40925009), the“Strategic Priority Research Program” of theChinese Academy of Sciences (XDA05100402), and the Helmholtz Virtual Institute ofComplex Molecular Systems in Environmental Health-Aerosol and Health (HICE). Thehelp of G. Salazar (University of Bern) during 14C analysis is acknowledged. Author Contributions R.-J.H.,I.E.H.and C.B. wrote the paper. R.-J.H.,J.-J.C. and A.S.H.P.designed the study. R.-J.H.,I.E.H., C.B. and K.R.D. performed the offline AMS analysis.Y.z., P.Z. and S. S. performed the 14C analysis. M.S. performed the IC analysis. G.A. andJ.S.-K. performed the TD-GC-MS analysis. R.-J.H.,I.E.H., C.B. and A.S.H.P. analysed thedata. All authors reviewed and commented on the paper. Author Information Reprints and permissions information is available atwww.nature.com/reprints. The authors declare no competing financial interests.Readers are welcome to comment on the online version of the paper. Correspondenceand requests for materials should be addressed to J.-J.C. (jjcao@ieecas.cn) or A.S.H.P.(andre.prevot@psi.ch). MONTH VOL NATURE|Macmillan Publishers Limited.All rights reserved
确定
还剩3页未读,是否继续阅读?

产品配置单

北京赛克玛环保仪器有限公司为您提供《二次有机气溶胶在中国对灰霾的污染贡献》,该方案主要用于空气中颗粒物检测,参考标准--,《二次有机气溶胶在中国对灰霾的污染贡献》用到的仪器有Magee AE33型 七波段黑碳仪
推荐专场

相关方案
更多