


方案详情
文
利用高效液相色谱-高分辨飞行时间质谱,对尿液中Acetaminophen扑热息痛, Dextromethorphan美沙芬, and Doxylamine抗敏安的代谢物进行分析。通过精确质谱、同位素分布、离子碎片信息进行定性定量分析。
方案详情

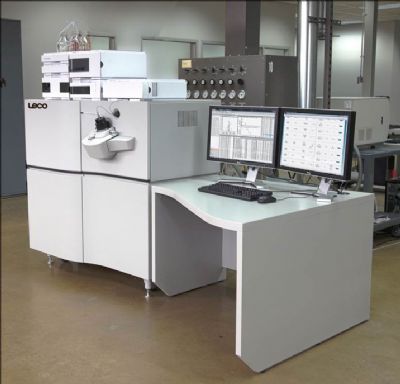
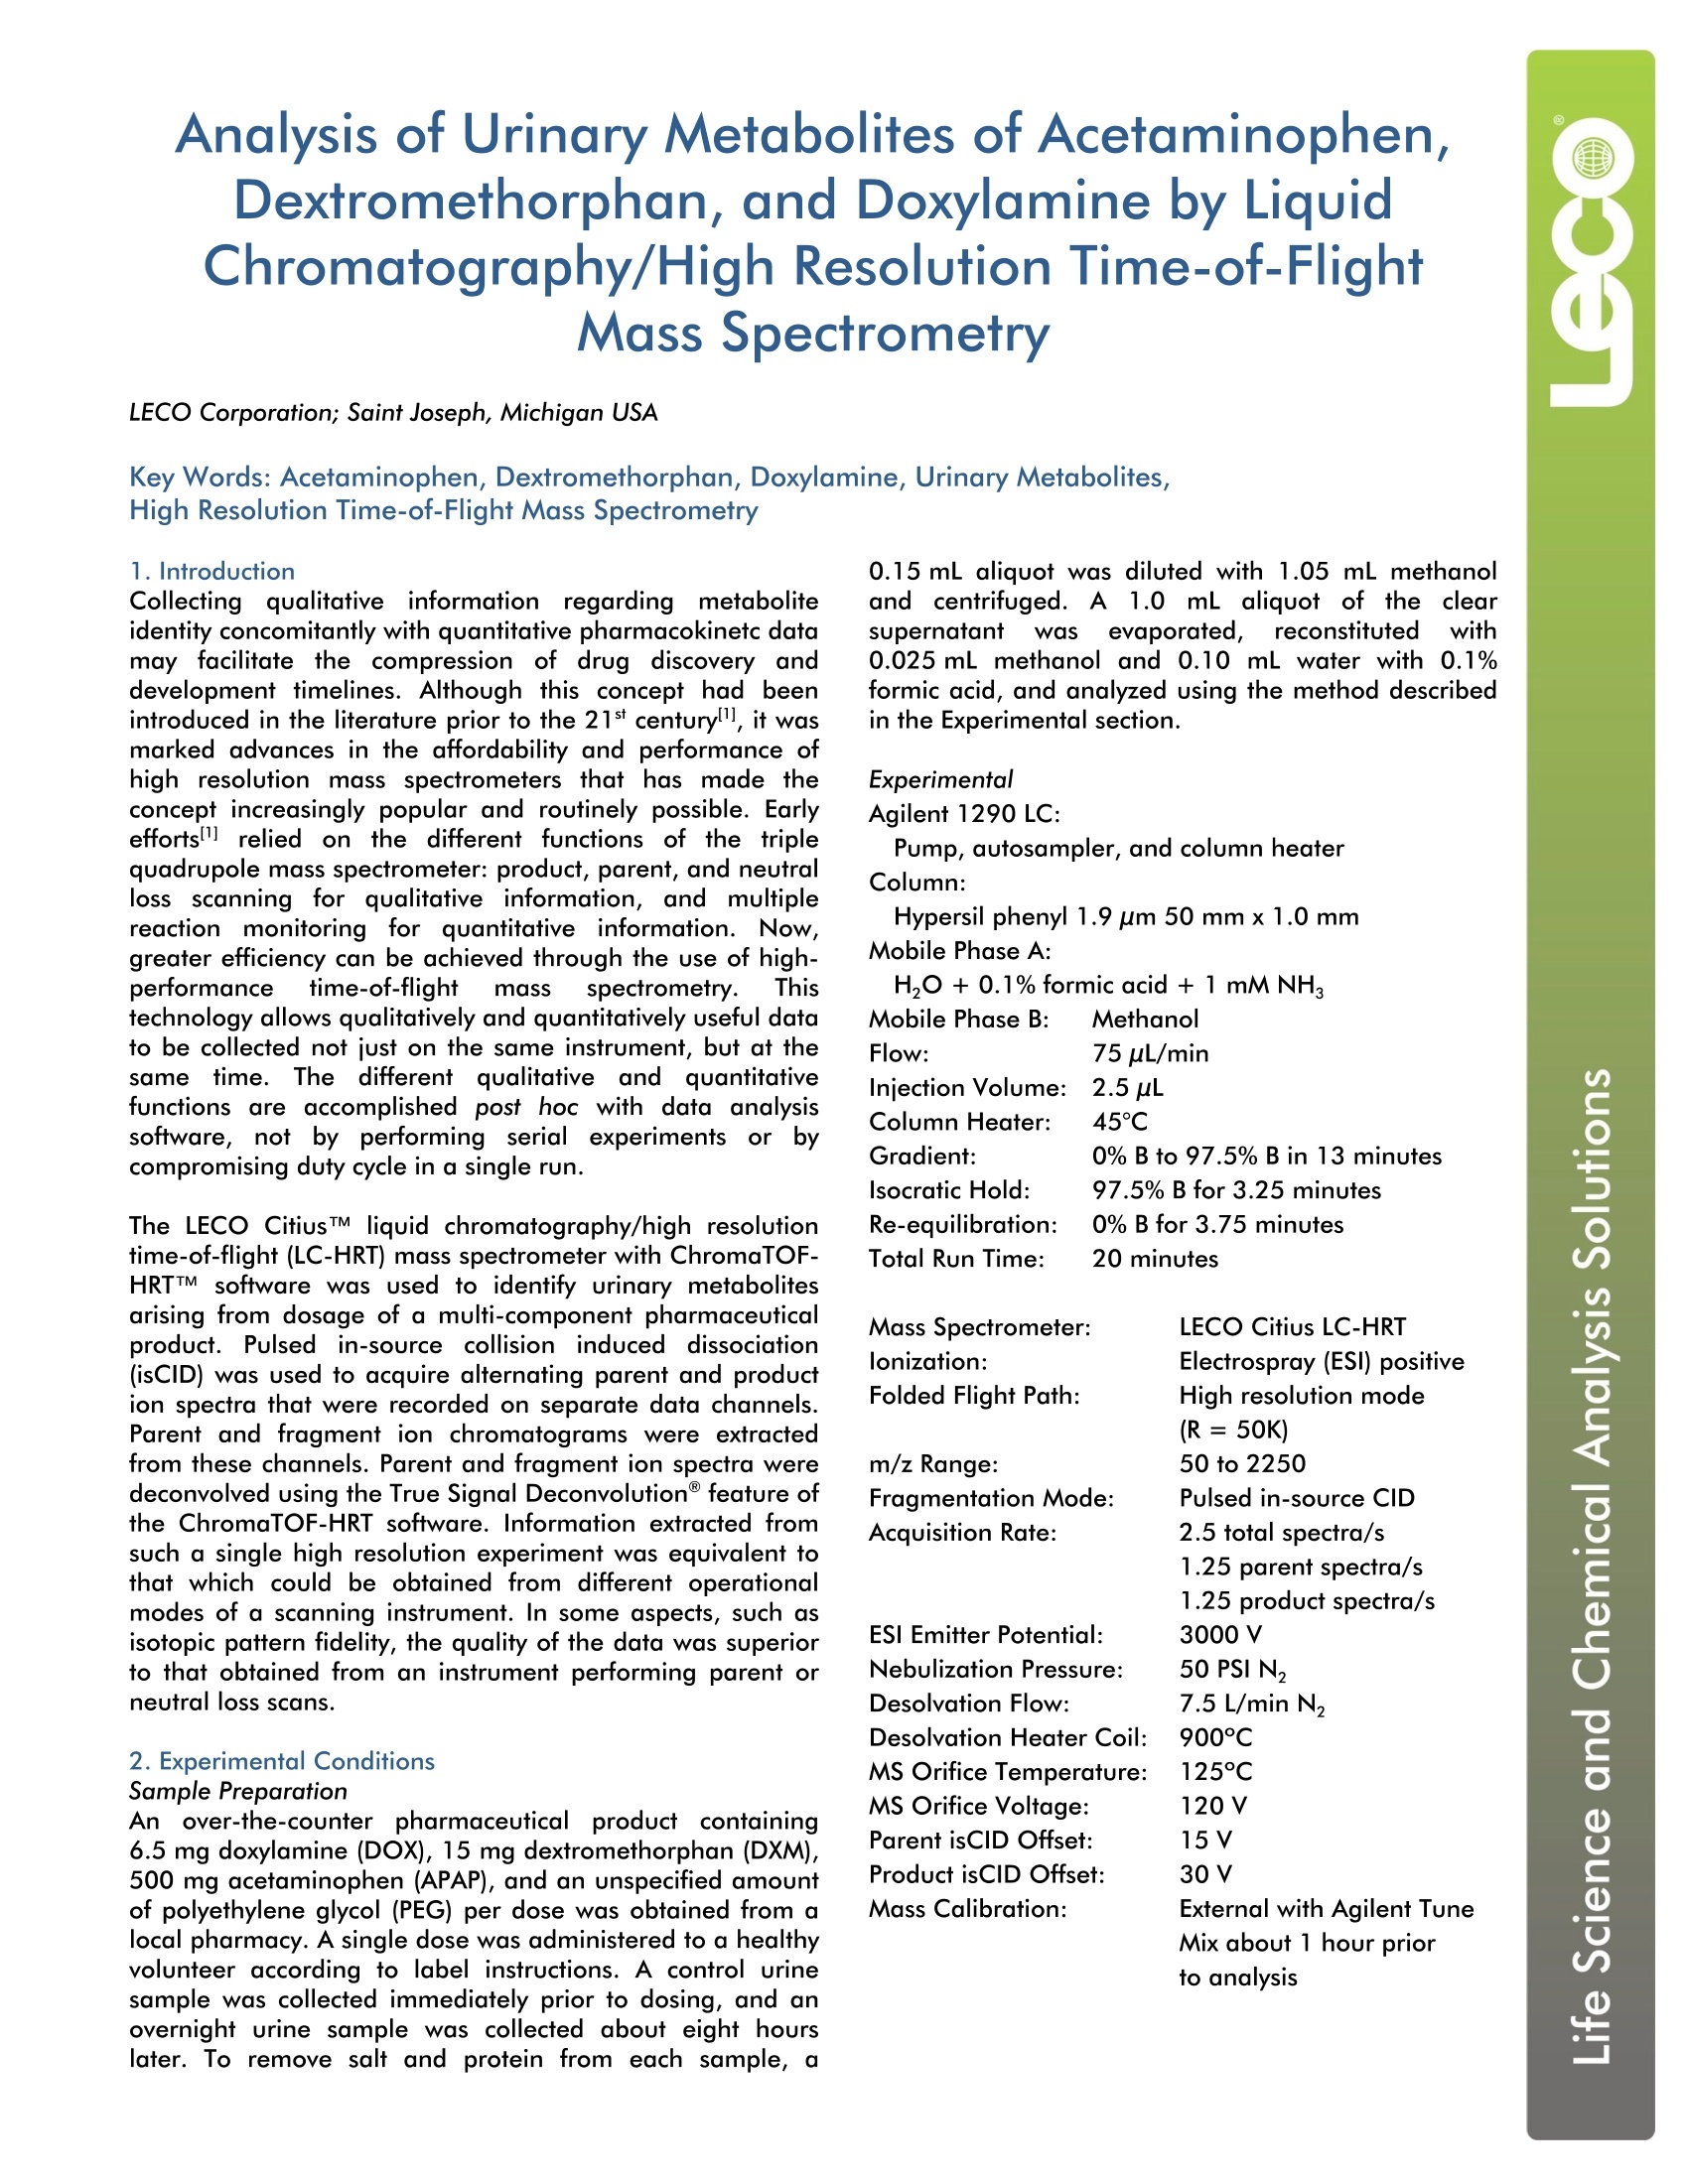
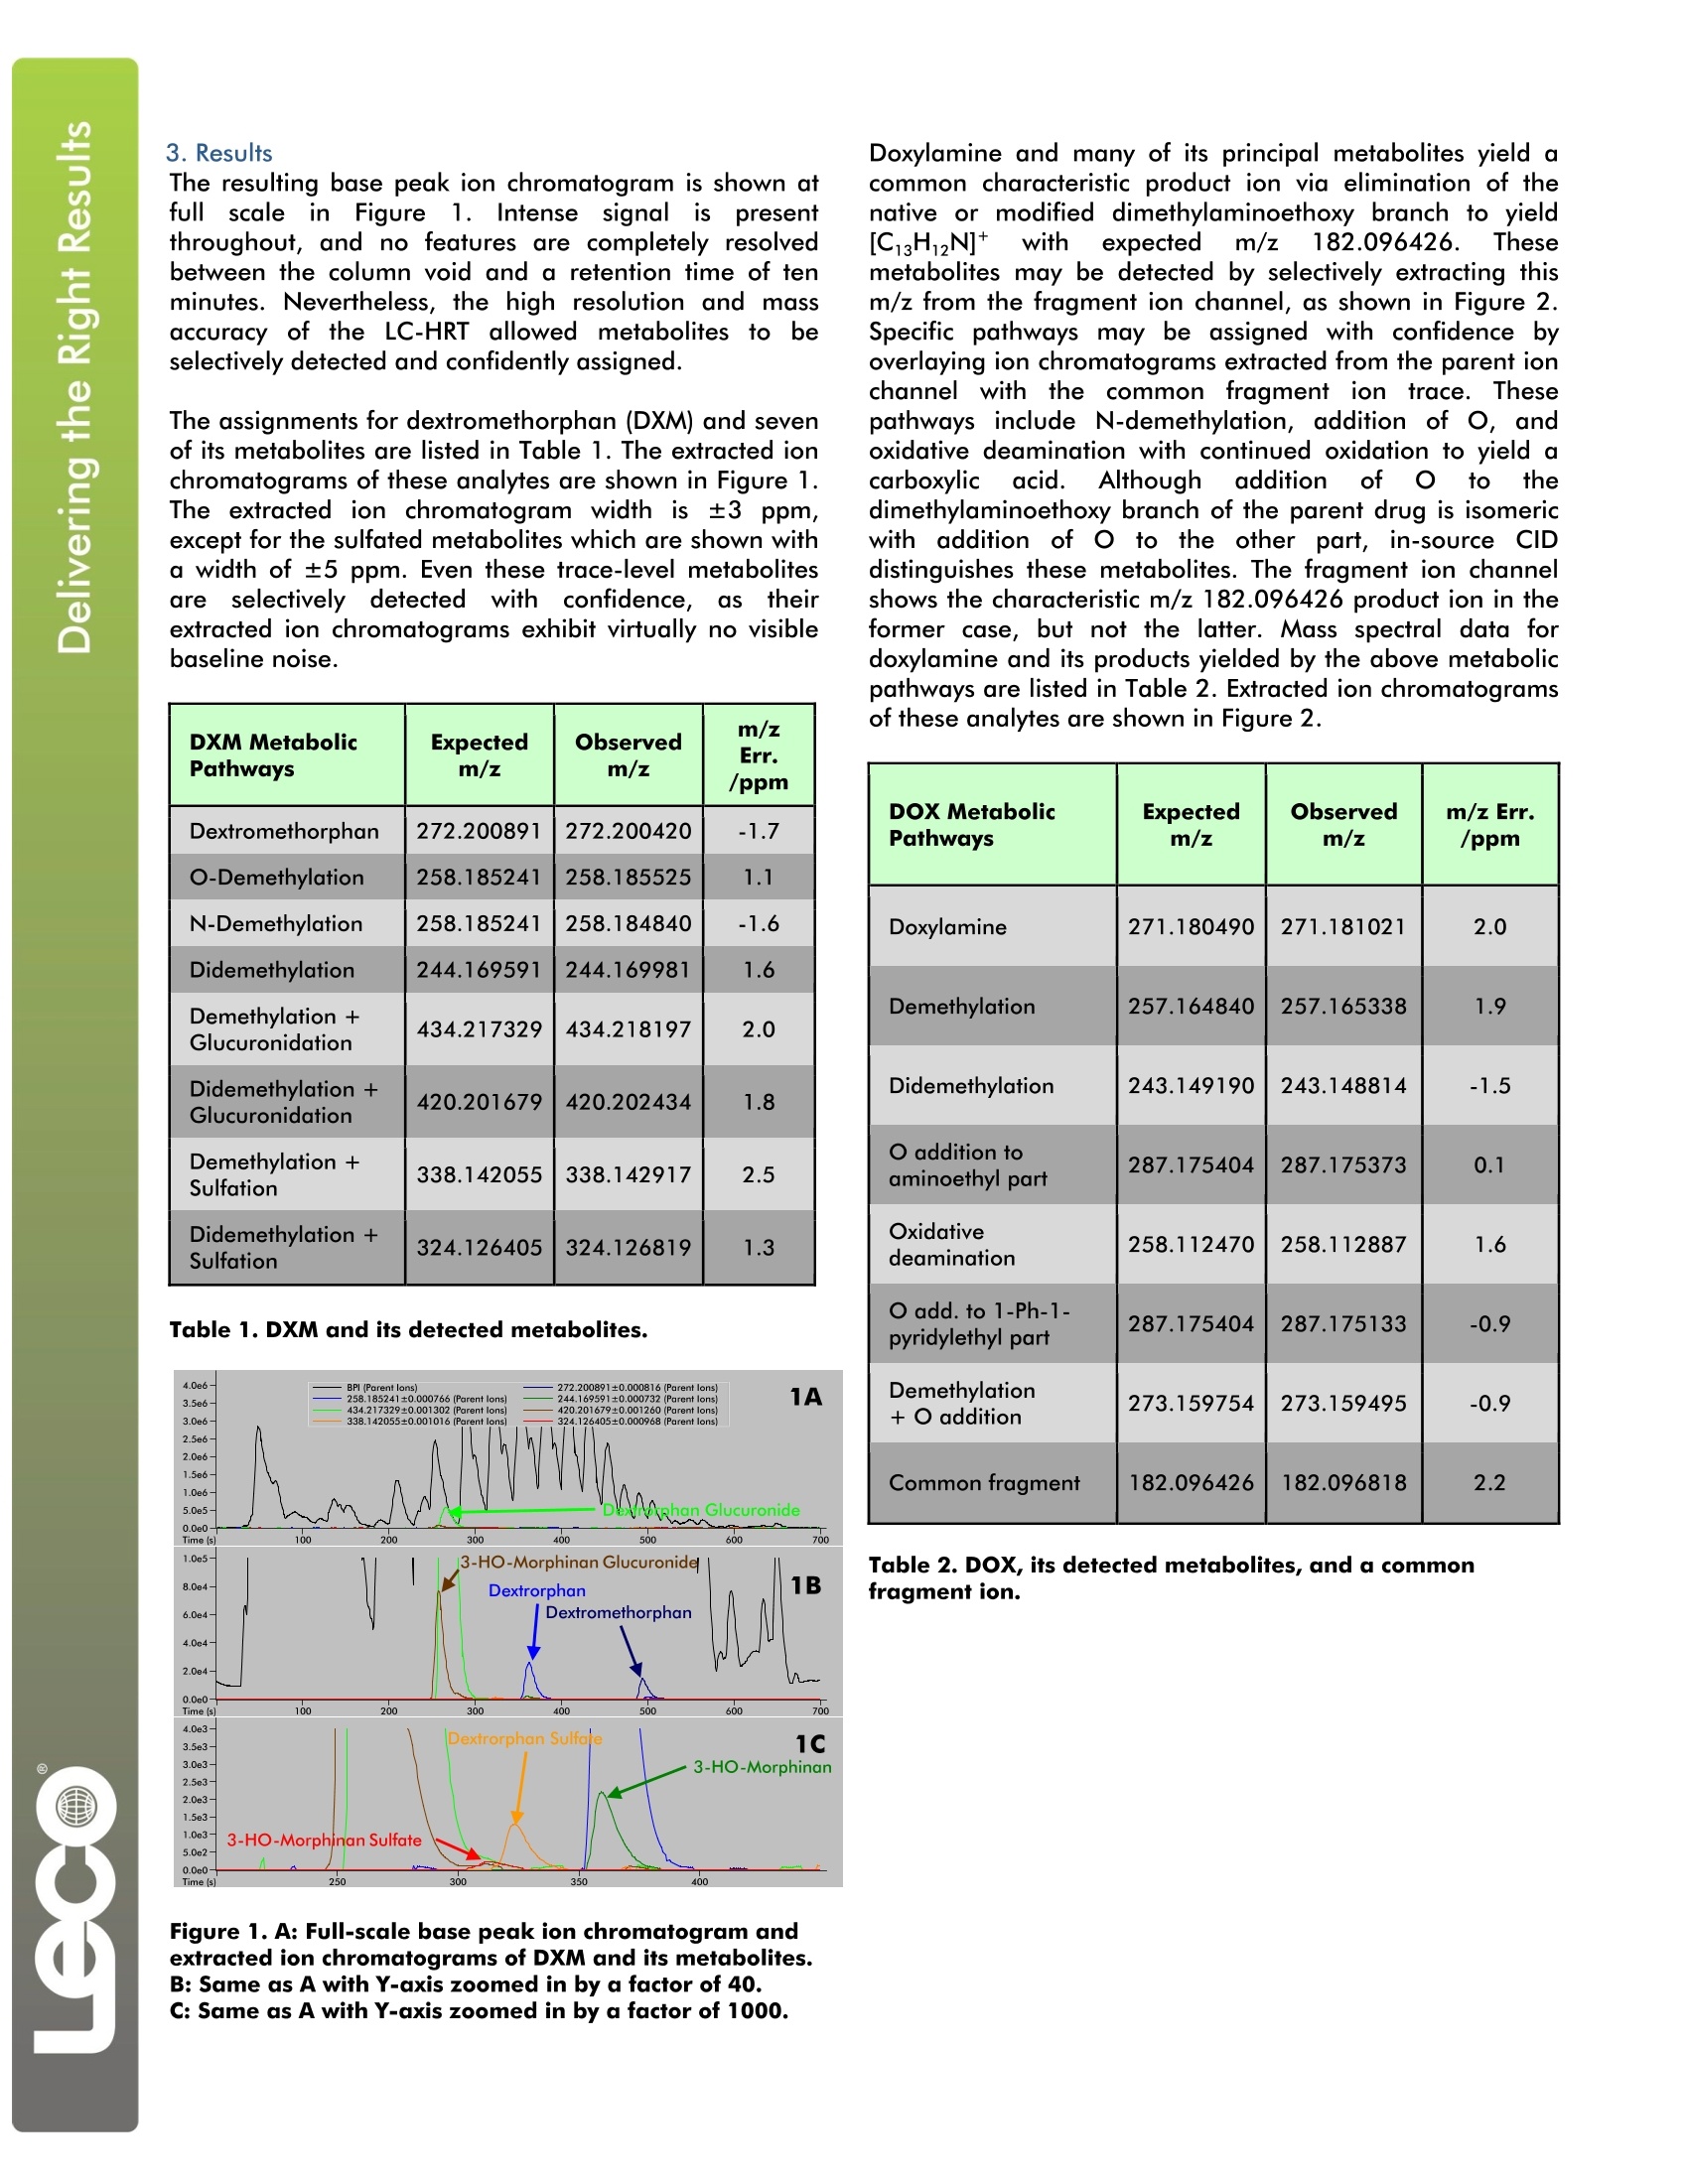
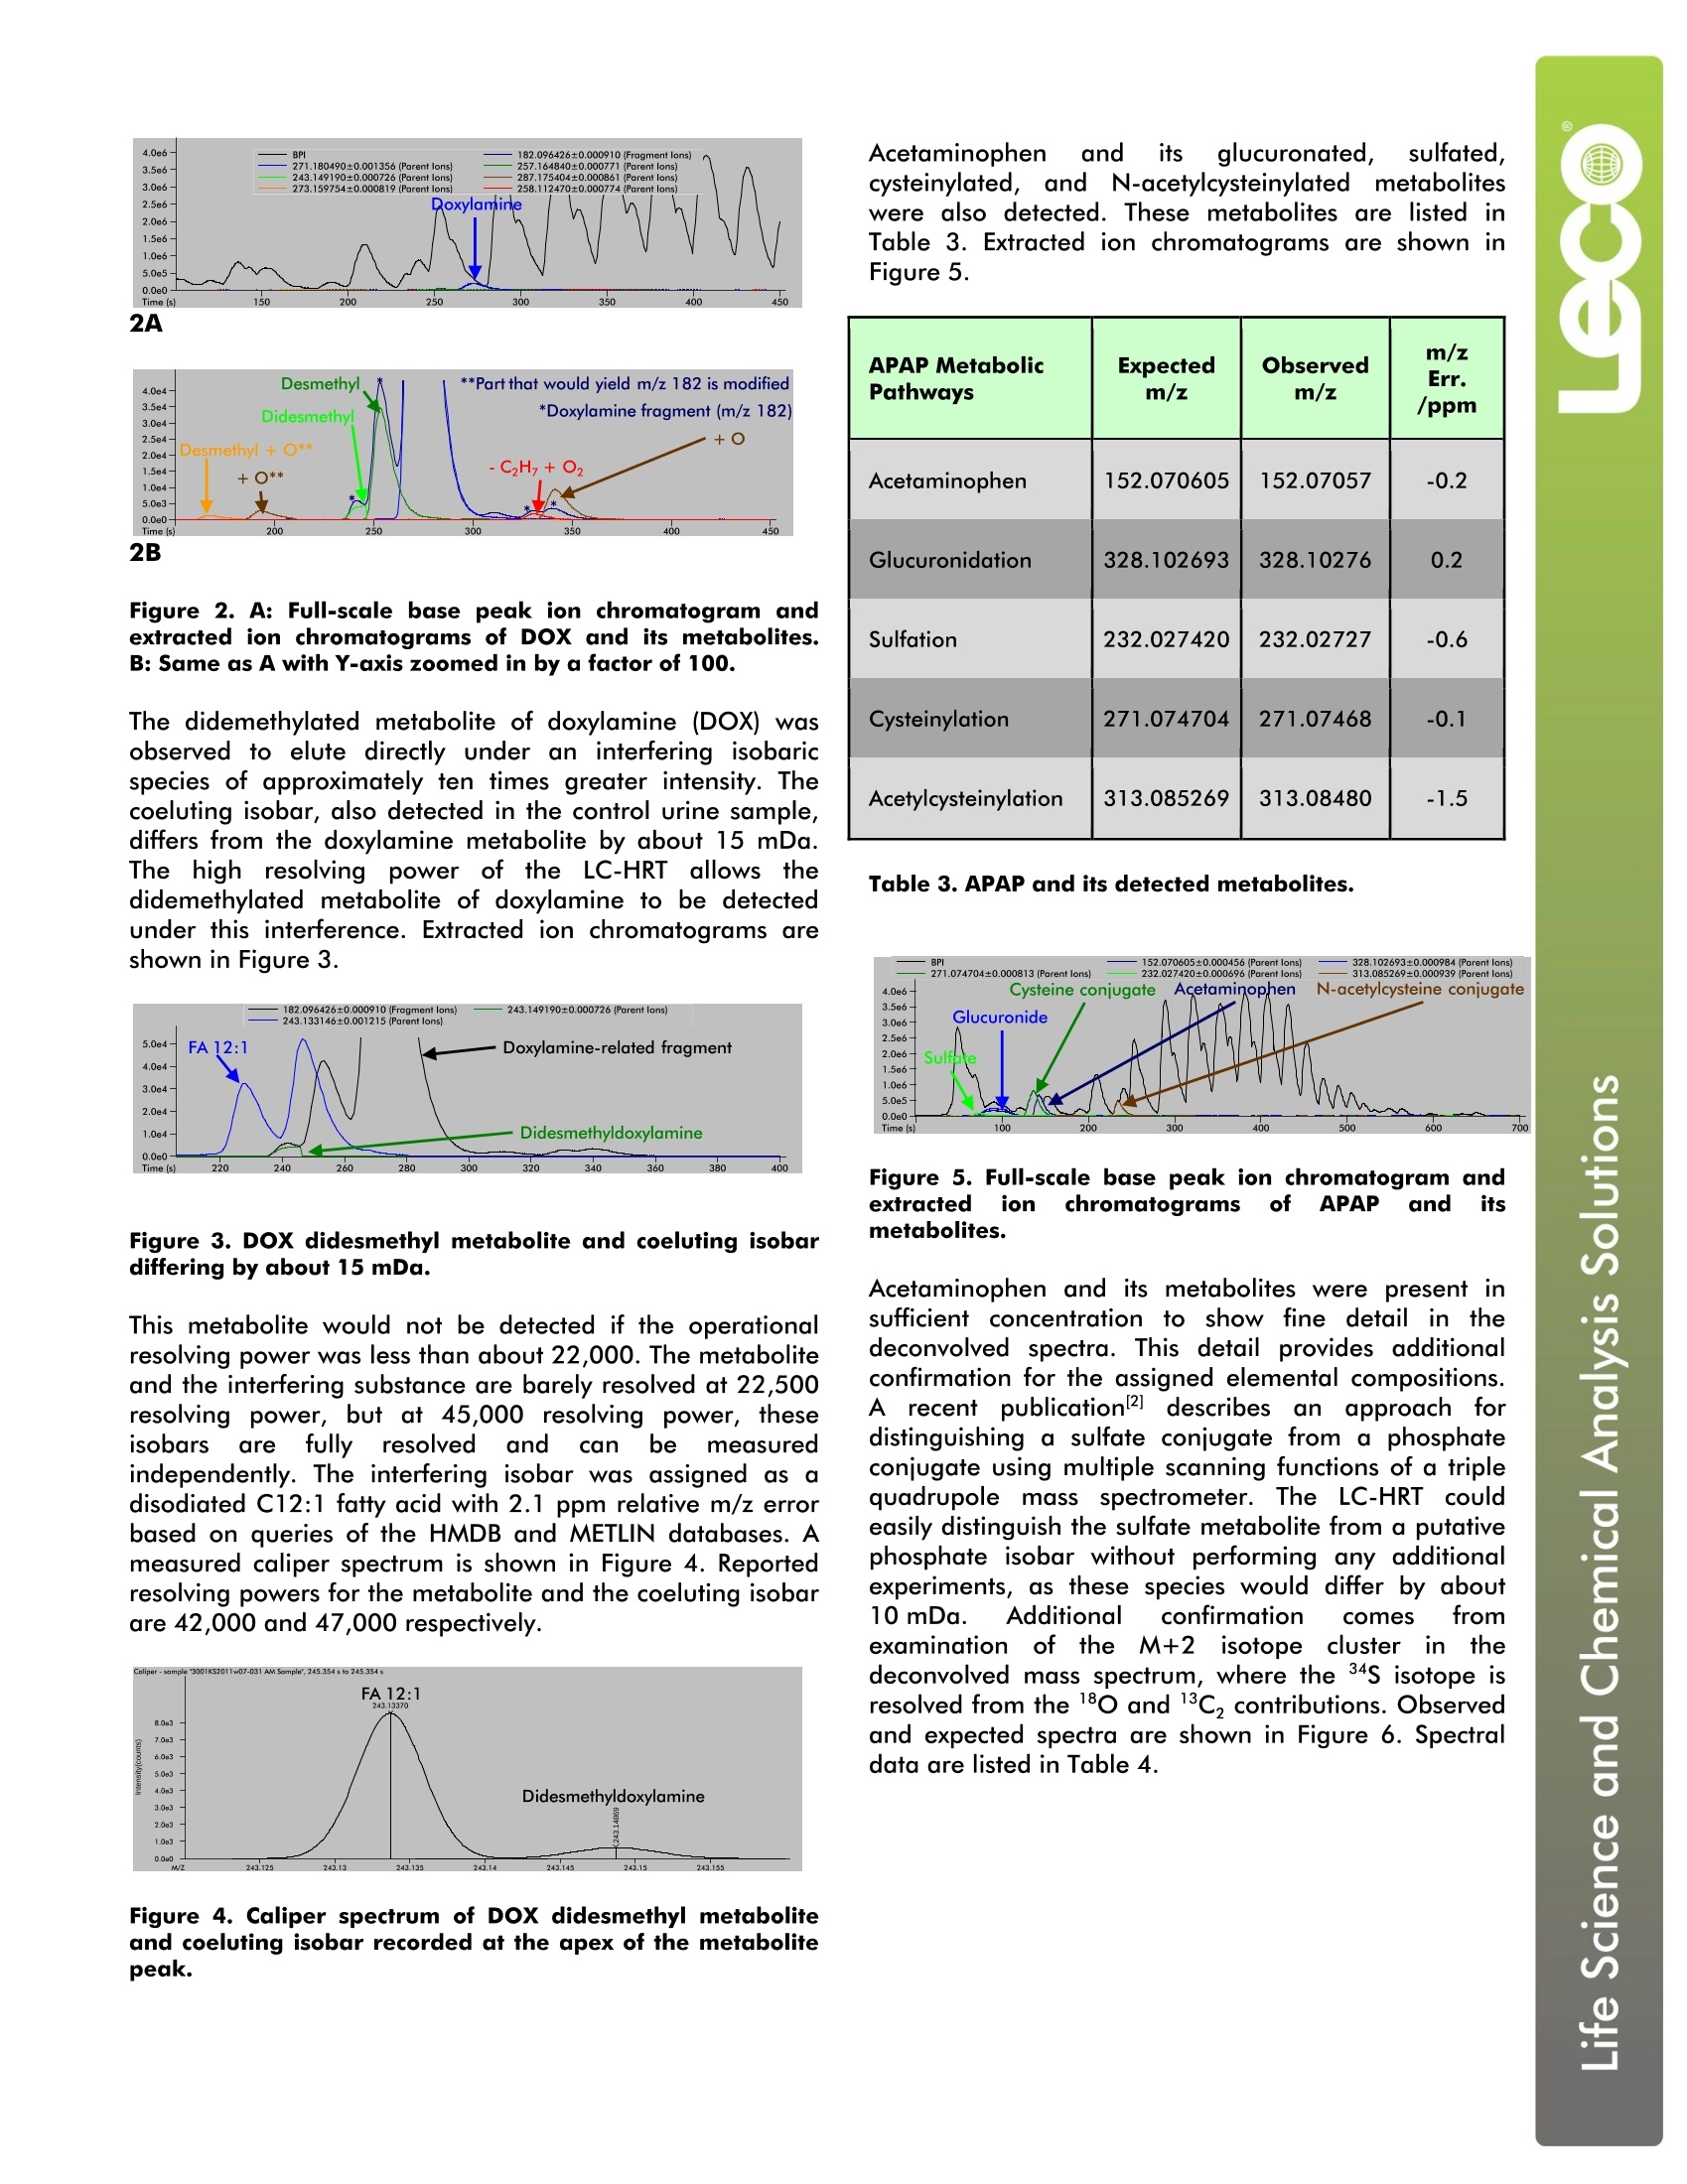
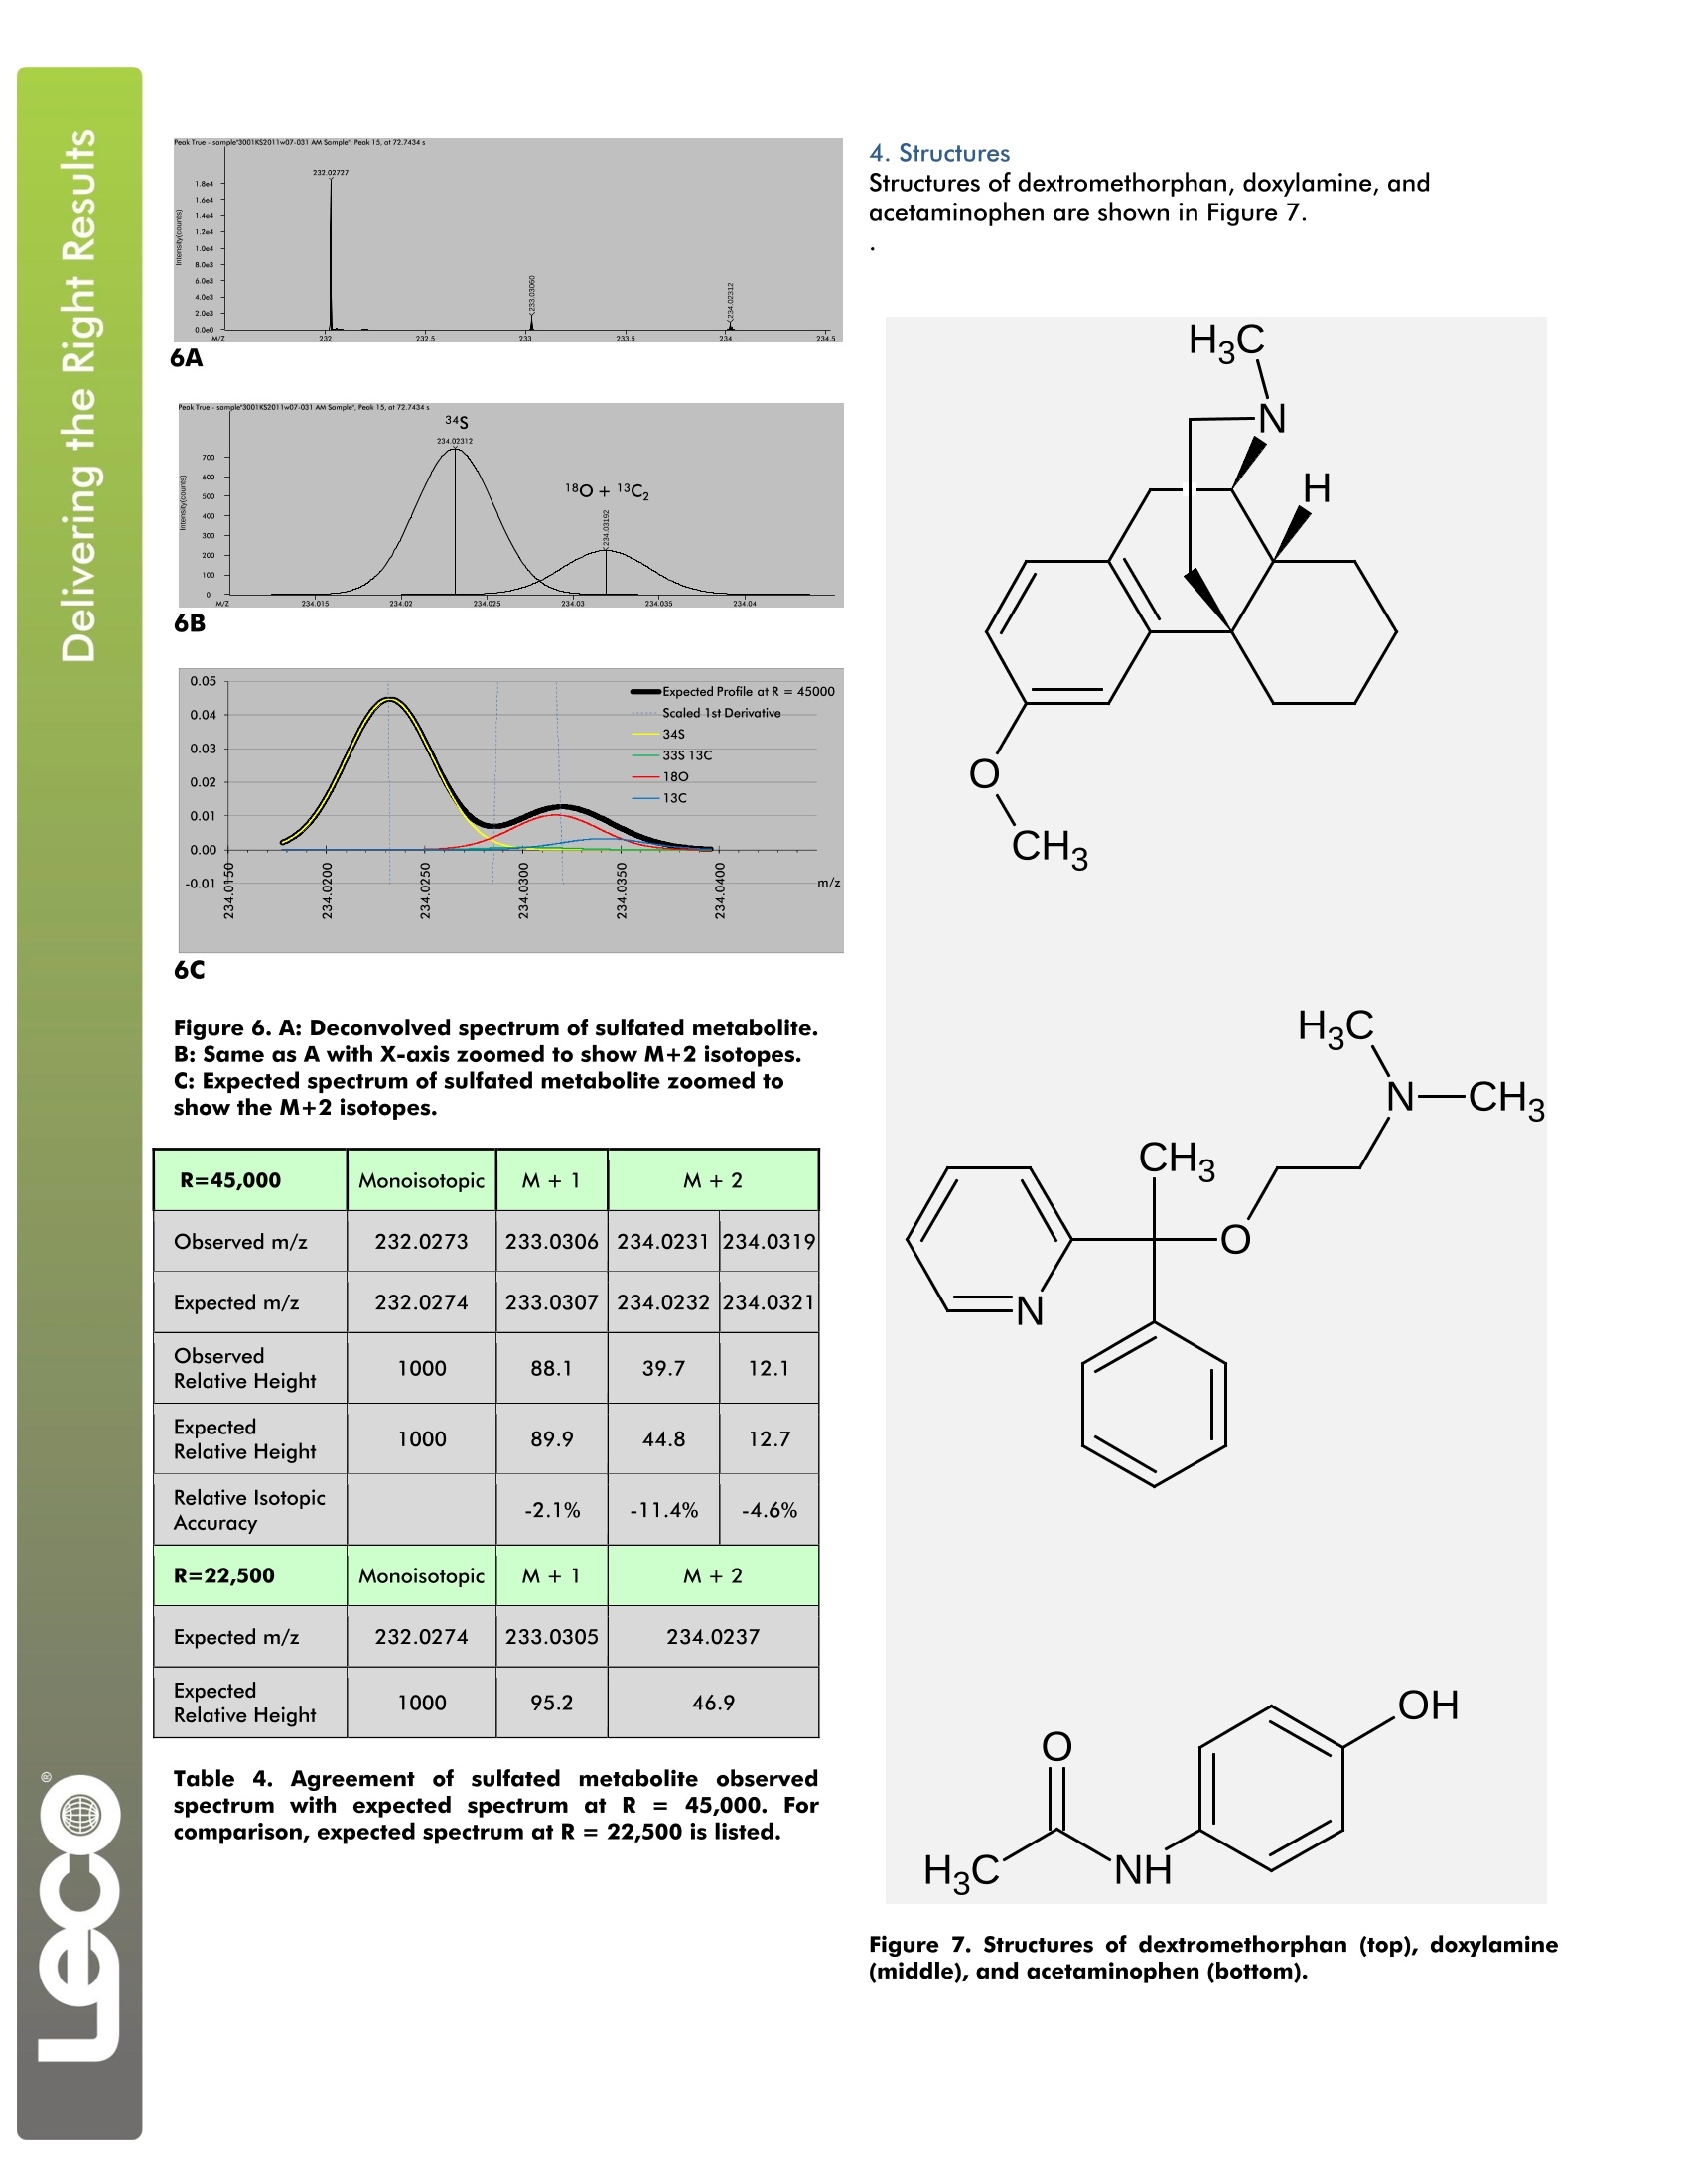
LECO Corporation·3000 Lakeview Avenue·St. Joseph, MI 49085·Phone: 800-292-6141·Fax: 269-982-8977info@leco.com·www.leco.com·ISO-9001:2008·No. FM 24045·LECO is a registered trademark of LECO Corporation.Form No.203-821-4007/11-REVOC 2011 LECO Corporation Analysis of Urinary Metabolites of Acetaminophen,Dextromethorphan, and Doxylamine by LiquidChromatography/High Resolution Time-of-FlightMass Spectrometry LECO Corporation; Saint Joseph, Michigan USA Key Words: Acetaminophen, Dextromethorphan, Doxylamine, Urinary Metabolites, High Resolution Time-of-Flight Mass Spectrometry 1. Introduction Collecting qualitative information regarding metaboliteidentity concomitantly with quantitative pharmacokinetc datamay facilitate the compression of drug discovery anddevelopment timelines. Although this concept had beenintroduced in the literature prior to the 21st centuryl, it wasmarked advances in the affordability and performance ofhigh resolution mass spectrometers that has made theconcept increasingly popular and routinely possible. Earlyefforts" relied on the different functions of the triplequadrupole mass spectrometer: product, parent, and neutralloss scanning for qualitative information, and multiplereaction monitoring for quantitative information. Now,greater efficiency can be achieved through the use of high-performance time-of-flight mass spectrometry. Thistechnology allows qualitatively and quantitatively useful datato be collected not just on the same instrument, but at thesame time. The different qualitative and quantitativefunctions are accomplished post hoc with data analysissoftware, nottby performing serial experiments or bycompromising duty cycle in a single run. The LECO Citius TM liquid chromatography/high resolutiontime-of-flight (LC-HRT) mass spectrometer with ChromaTOF-HRTTM software was used to identify urinary metabolitesarising from dosage of a multi-component pharmaceuticalproduct. Pulsediinn-source collision induced dissociation(isCID) was used to acquire alternating parent and production spectra that were recorded on separate data channels.Parent and fragment ion chromatograms were extractedfrom these channels. Parent and fragment ion spectra weredeconvolved using the True Signal Deconvolution° feature ofthe ChromaTOF-HRT software. Information extracted fromsuch a single high resolution experiment was equivalent tothat which could be obtained from different operationalmodes of a scanning instrument. In some aspects, such asisotopic pattern fidelity, the quality of the data was superiorto that obtained from an instrument performing parent orneutral loss scans. 2. Experimental Conditions Sample Preparation An over-the-counter pharmaceutical product containing6.5 mg doxylamine (DOX), 15 mg dextromethorphan (DXM),500 mg acetaminophen (APAP), and an unspecified amountof polyethylene glycol (PEG) per dose was obtained from alocal pharmacy. A single dose was administered to a healthyvolunteer according to label instructions. A control urinesample was collected immediately prior to dosing, and anovernight urine sample was collected about eight hourslater. To remove salt and protein from each sample, a 0.15 mL aliquot was diluted with 1.05 mL methanoland centrifuged. A 1.0 mL aliquot of the clearsupernatantwasevaporated,, reconstituted with0.025 mL methanol and 0.10 mL water with 0.1%formic acid, and analyzed using the method describedin the Experimental section. Experimental Agilent 1290 LC:Pump, autosampler, and column heater Column: Hypersil phenyl 1.9 um 50 mm x 1.0 mmMobile Phase A: H,O +0.1% formic acid + 1 mMNH,Mobile Phase B: MethanolFlow: 75 uL/minInjection Volume: 2.5 uLColumn Heater: 45°CGradient: 0% B to 97.5% B in 13 minutesIsocratic Hold: 97.5% B for 3.25 minutesRe-equilibration: 0% B for 3.75 minutesTotal Run Time: 20 minutes Mass Spectrometer: LECO Citius LC-HRT lonization: Electrospray (ESI) positive Folded Flight Path: High resolution mode (R=50K) m/z Range: 50 to 2250 Fragmentation Mode: Pulsed in-source CID Acquisition Rate: 2.5 total spectra/s 1.25 parent spectra/s 1.25 product spectra/s ESI Emitter Potential: 3000 V Nebulization Pressure: 50 PSIN, Desolvation Flow: 7.5 L/min N. Desolvation Heater Coil: 900°C MS Orifice Temperature: 125°C MS Orifice Voltage: 120v Parent isCID Offset: 15V Product isCID Ofset: 30V Mass Calibration: External with Agilent Tune Mix about 1 hour prior to analysis The resulting base peak ion chromatogram is shown atfulll scalein Figure1. Intense :signal isIS presentthroughout, and no features are completely resolvedbetween the column void and a retention time of tenminutes. Nevertheless, the high resolution and massaccuracy of the LC-HRT allowed metabolites to Ibeselectively detected and confidently assigned. The assignments for dextromethorphan (DXM) and sevenof its metabolites are listed in Table 1. The extracted ionchromatograms of these analytes are shown in Figure 1.The extracted ion chromatogram width is ±3 ppm,except for the sulfated metabolites which are shown witha width of ±5 ppm. Even these trace-level metabolitesare selectively detectedd with confidence, asttheirextracted ion chromatograms exhibit virtually no visiblebaseline noise. DXM MetabolicPathways Expectedm/z Observedm/z m/zErr./ppm Dextromethorphan 272.200891 272.200420 -1.7 O-Demethylation 258.185241 258.185525 1.1 N-Demethylation 258.185241 258.184840 -1.6 Didemethylation 244.169591 244.169981 1.6 Demethylation +Glucuronidation 434.217329 434.218197 2.0 Didemethylation +Glucuronidation 420.201679 420.202434 1.8 Demethylation +Sulfation 338.142055 338.142917 2.5 Didemethylation +Sulfation 324.126405 324.126819 1.3 Table 1. DXM and its detectedmetabolites. Figure 1. A: Full-scale base peak ion chromatogram andextracted ion chromatograms of DXM and its metabolites.B: Same as A with Y-axis zoomed in by a factor of 40.C: Same as A with Y-axis zoomed in by a factor of 1000. Doxylamine and many of its principal metabolites yield acommon characteristic product ion via elimination of thenative or modified dimethylaminoethoxy branch to yield[C13H12N]+ withexpectedm/z 182.096426.Thesemetabolites may be detected by selectively extracting thism/z from the fragment ion channel, as shown in Figure 2.Specific pathways may be assigned with confidence byoverlaying ion chromatograms extracted from the parent ionchannel with the common fragment ion trace. Thesepathways include N-demethylation, addition of O, andoxidative deamination with continued oxidation to yield acarboxylic acid. Although additioni offo tto thedimethylaminoethoxy branch of the parent drug is isomericwith addition of o to the other part, in-source CIDdistinguishes these metabolites. The fragment ion channelshows the characteristic m/z 182.096426 product ion in theformer case, but not the latter. Mass spectral data fordoxylamine and its products yielded by the above metabolicpathways are listed in Table 2. Extracted ion chromatogramsof these analytes are shown in Figure 2. DOX MetabolicPathways Expectedm/z Observedm/z m/z Err./ppm Doxylamine 271.180490 271.181021 2.0 Demethylation 257.164840 257.165338 1.9 Didemethylation 243.149190 243.148814 -1.5 O addition toaminoethyl part 287.175404 287.175373 0.1 Oxidative deamination 258.112470 258.112887 1.6 O add. to 1-Ph-1-pyridylethyl part 287.175404 287.175133 -0.9 Demethylation+O addition 273.159754 273.159495 -0.9 Common fragment 182.096426 182.096818 2.2 Table 2. DOX, its detected metabolites, and a commonfragment ion. 4.0e6 Figure 2. A: Full-scale base peak ion chromatogram andextracted ion chromatograms of DOX and its metabolites.B: Same as A with Y-axis zoomed in by a factor of 100. The didemethylated metabolite of doxylamine (DOX) wasobserved to elute directly under an interfering isobaricspecies of approximately ten times greater intensity. Thecoeluting isobar, also detected in the control urine sample,differs from the doxylamine metabolite by about 15 mDa.The high resolving power of the LC-HRT allows thedidemethylated metabolite of doxylamine to be detectedunder this interference. Extracted ion chromatograms areshown in Figure 3. Figure 3. DOX didesmethyl metabolite and coeluting isobardiffering by about 15 mDa. This metabolite would not be detected if the operationalresolving power was less than about 22,000. The metaboliteand the interfering substance are barely resolved at 22,500resolving power, but at 45,000 resolving power, theseisobars areffullyresolvedand ccan bemeasuredindependently. The interfering isobar was assigned as adisodiated C12:1 fatty acid with 2.1 ppm relative m/z errorbased on queries of the HMDB and METLIN databases. Ameasured caliper spectrum is shown in Figure 4. Reportedresolving powers for the metabolite and the coeluting isobarare 42,000 and 47,000 respectively. Acetaminophen and its glucuronated,sulfated,cysteinylated, and N-acetylcysteinylatedd metaboliteswere also detected. These metabolites are listed5IinTable 3. Extracted ion chromatograms are shown inFigure 5. APAP MetabolicPathways Expectedm/z Observedm/z m/zErr./ppm Acetaminophen 152.070605 152.07057 -0.2 Glucuronidation 328.102693 328.10276 0.2 Sulfation 232.027420 232.02727 -0.6 Cysteinylation 271.074704 271.07468 -0.1 Acetylcysteinylation 313.085269 313.08480 -1.5 Table 3. APAP and its detected metabolites. Figure 5. Full-scale base peak ion chromatogram andextracted ion chromatograms of APAP and itsmetabolites. Acetaminophen and its metabolites were present insufficient concentration to show fine detail in thedeconvolved spectra. This detail provides additionalconfirmation for the assigned elemental compositions.A recent publication2]describesSan approach fordistinguishing a sulfate conjugate from a phosphateconjugate using multiple scanning functions of a triplequadrupole mass spectrometer. The LC-HRT couldeasily distinguish the sulfate metabolite from a putativephosphate isobar without performing any additionalexperiments, as these species would differ by about10mDa. Additional confirmation comes fromexaminationn oftheNM+2isotopecluster in11thedeconvolved mass spectrum, where the 34S isotope isresolved from the 180 and 13C, contributions. Observedand expected spectra are shown in Figure 6. Spectraldata are listed in Table 4. 6C Figure 6. A: Deconvolved spectrum of sulfated metabolite.B: Same as A with X-axis zoomed to show M+2 isotopes.C: Expected spectrum of sulfated metabolite zoomedtoshow the M+2 isotopes. R=45,000 Monoisotopic M+1 M+2 Observed m/z 232.0273 233.0306 234.0231 234.0319 Expected m/z 232.0274 233.0307 234.0232 234.0321 ObservedRelative Height 1000 88.1 39.7 12.1 ExpectedRelative Height 1000 89.9 44.8 12.7 Relative IsotopicAccuracy -2.1% -11.4% -4.6% R=22,500 Monoisotopic M+1 M+2 Expected m/z 232.0274 233.0305 234.0237 Expected Relative Height 1000 95.2 46.9 Table 4. Agreement of sulfated metabolite observedspectrum with expected spectrum at R = 45,000. Forcomparison, expected spectrum at R = 22,500 is listed. Structures of dextromethorphan, doxylamine, andacetaminophen are shown in Figure 7. Figure 7. Structures of dextromethorphan (top), doxylamine(middle), and acetaminophen (bottom). 5.Conclusions The described experiments demonstrate the use of the LECOCitius LC-HRT for identification of xenobiotic urinarymetabolites. The high resolution allows sensitive detection ofmetabolites in the presence of abundant chromatographicinterferences. In one case, a metabolite could be clearlydetected under the presence of a more abundant coelutingisobar separated by aboutit 15 mDa. Pulsed in-sourcecollision-inducedddissociationallowedmonitorintogofcharacteristic fragmentionsfacilitatedetectiondoxylamine metabolites. Accurate mass measurement andaccurate isotopic patterns allowed confident assignment ofelemental composition. Resolvedisotopic fine structureallowed additional confirmation of sulfated metabolites. Allthis information was obtained from a single chromato-graphic analysis, demonstrating several advantages of highresolution time-of-flight mass spectrometry. 9 6.References 1.Poon, G. K.; Kwei, G.; Wang, R.; Lyons, K.; Chen, Q.;Didolkar, V.; Hop, C. E. C. A. Integrating qualitative andquantitative liquid chromatography/tandem massspectrometric analysis to support drug discovery. RapidCommunications in Mass Spectrometry 1999, 13,1943-1950. 2. Wu, S. T.; Cao, K.; Bonacorsi, S. J.; Zhang, H.; Jemal,M. Distinguishing a phosphateester prodrug from itsisobaric sulfate metabolite by mass spectrometrywithout the metabolite standard. Rapid Communicationsin Mass Spectrometry 2009, 23, 3107-3113.
确定
还剩3页未读,是否继续阅读?

产品配置单
美国力可公司为您提供《尿液中药品代谢物检测方案 》,该方案主要用于尿液中药品代谢物检测,参考标准--,《尿液中药品代谢物检测方案 》用到的仪器有液相色谱高分辨飞行时间质谱
推荐专场
相关方案
更多
该厂商其他方案
更多