


方案详情
文
The determination of major elements in food,cereals or nutritive solutions is essential for nutritional significance. This necessitates a reliable technique for good accuracy and precision. The JY ULTIMA 2 ICP-OES spectrometer was used.This paper presents a description of the technique,operating conditions and some results of certified materials.
方案详情

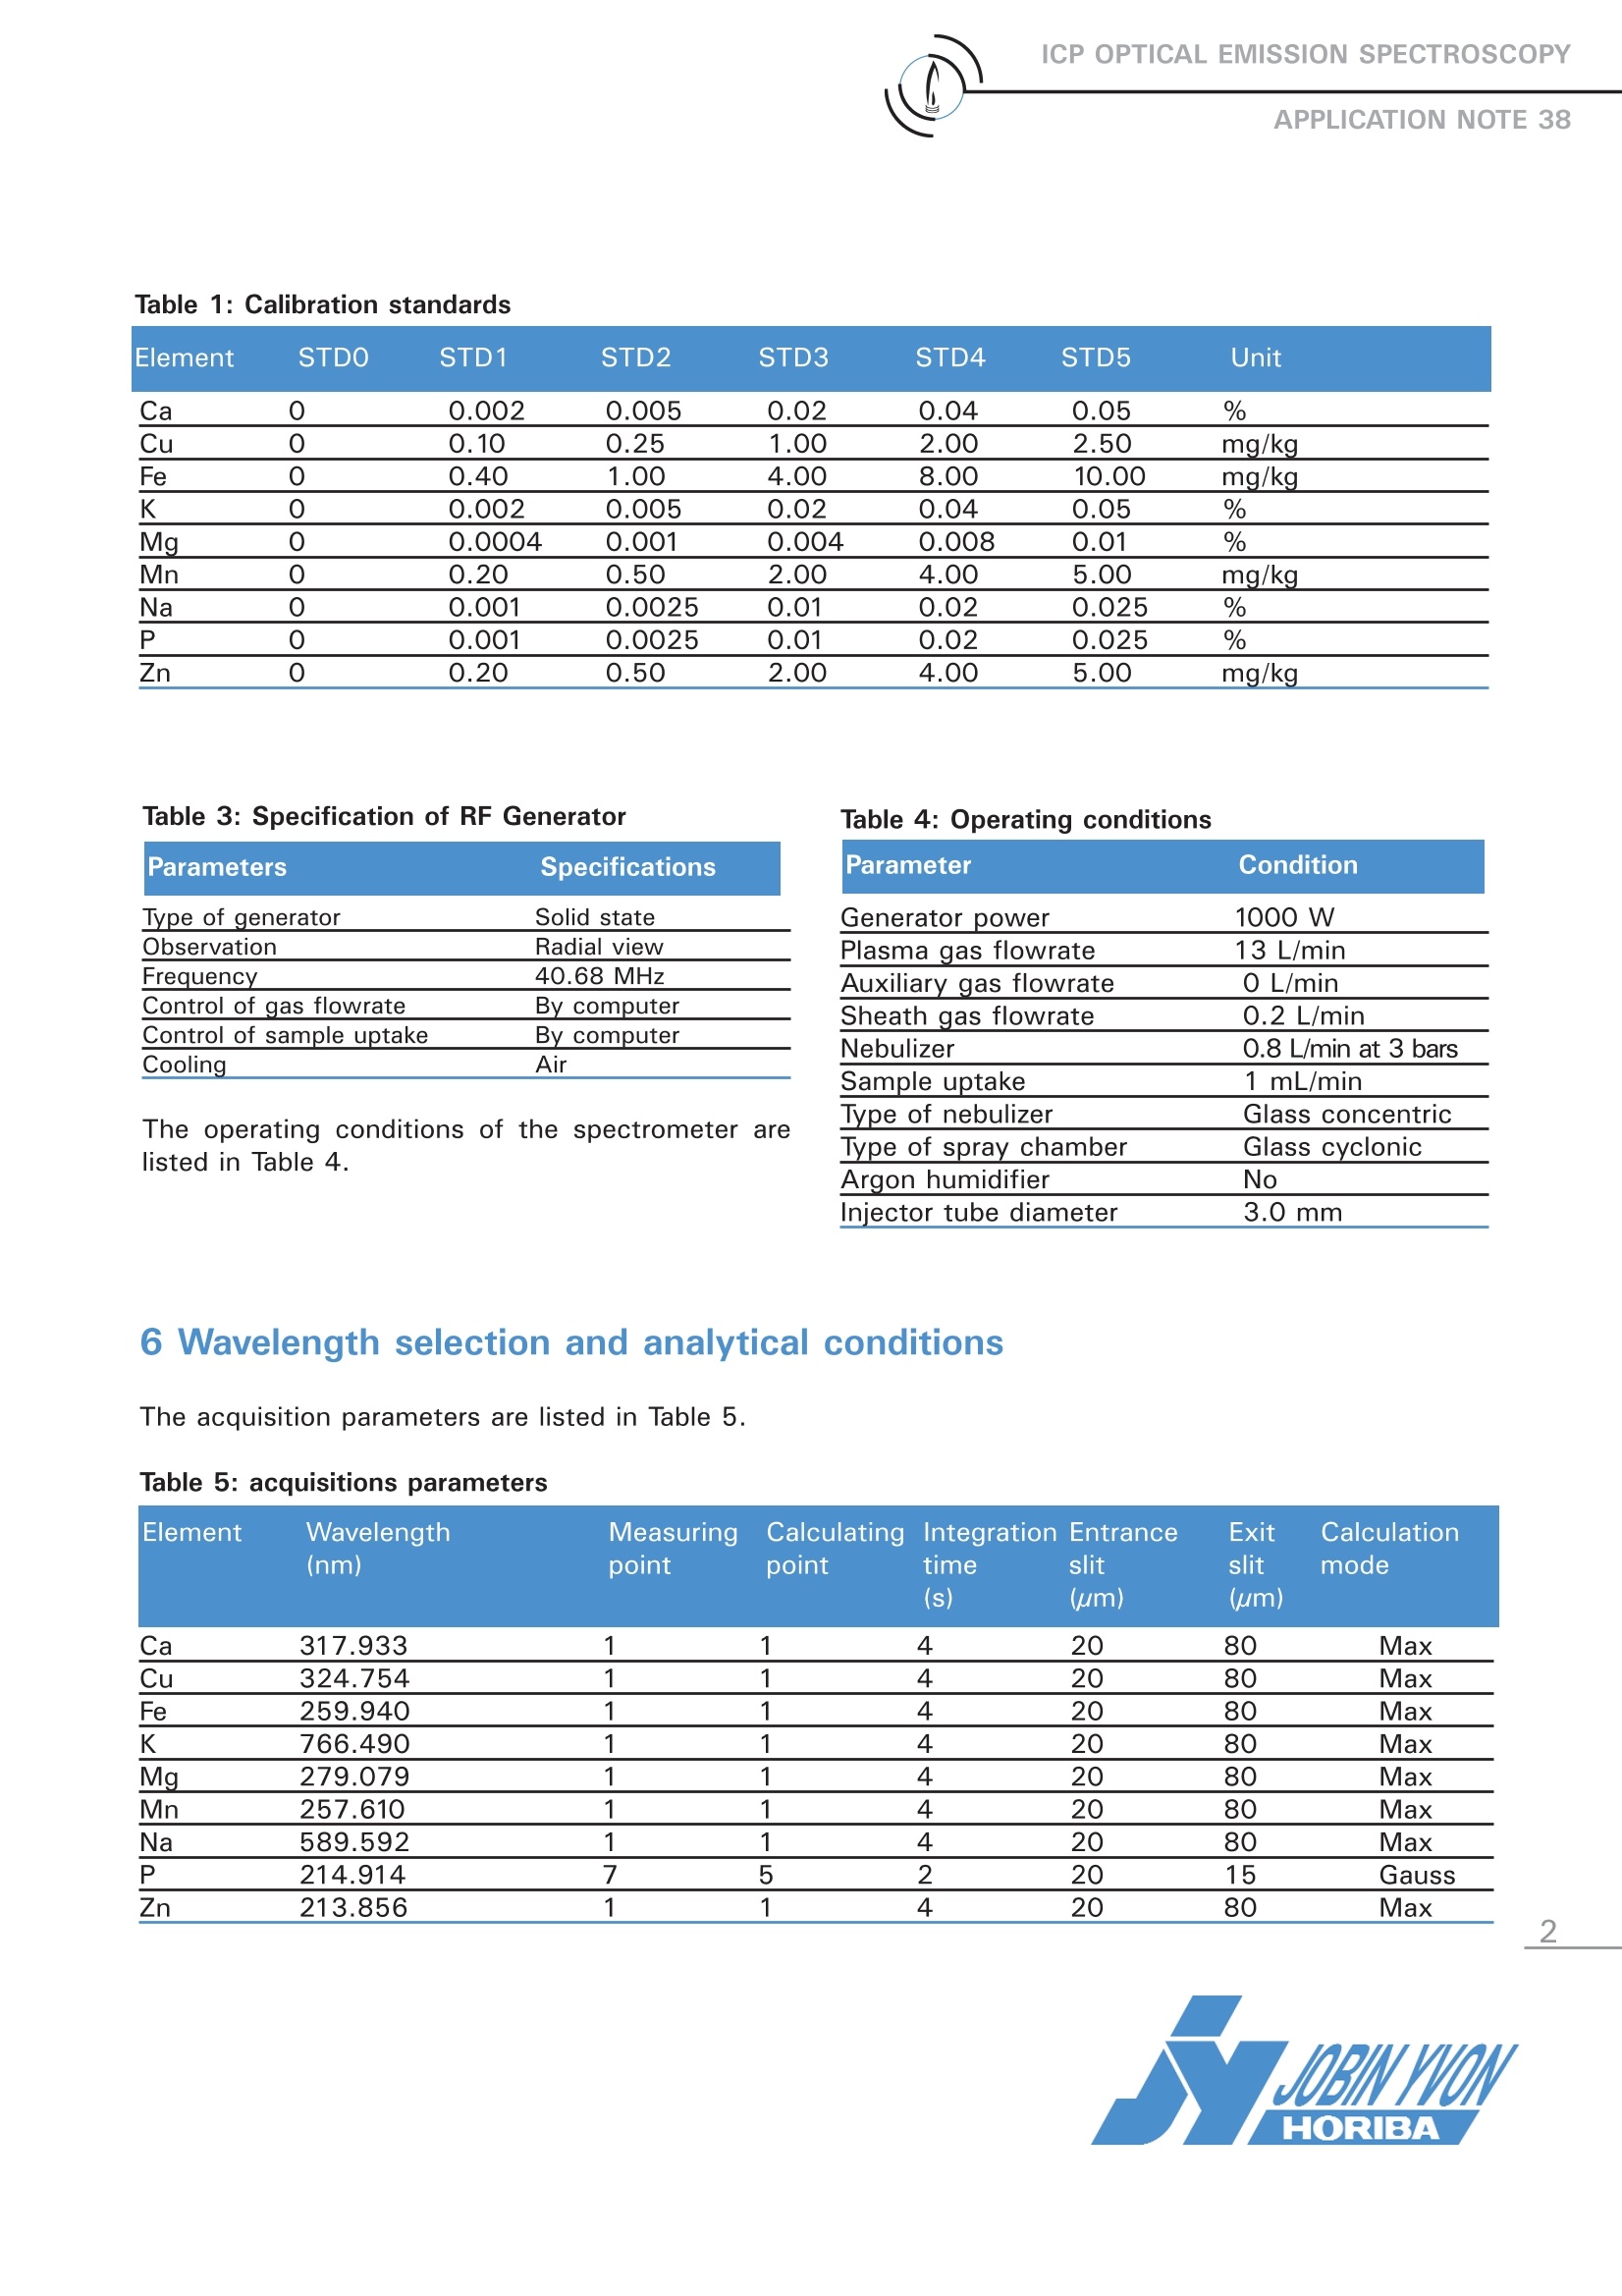
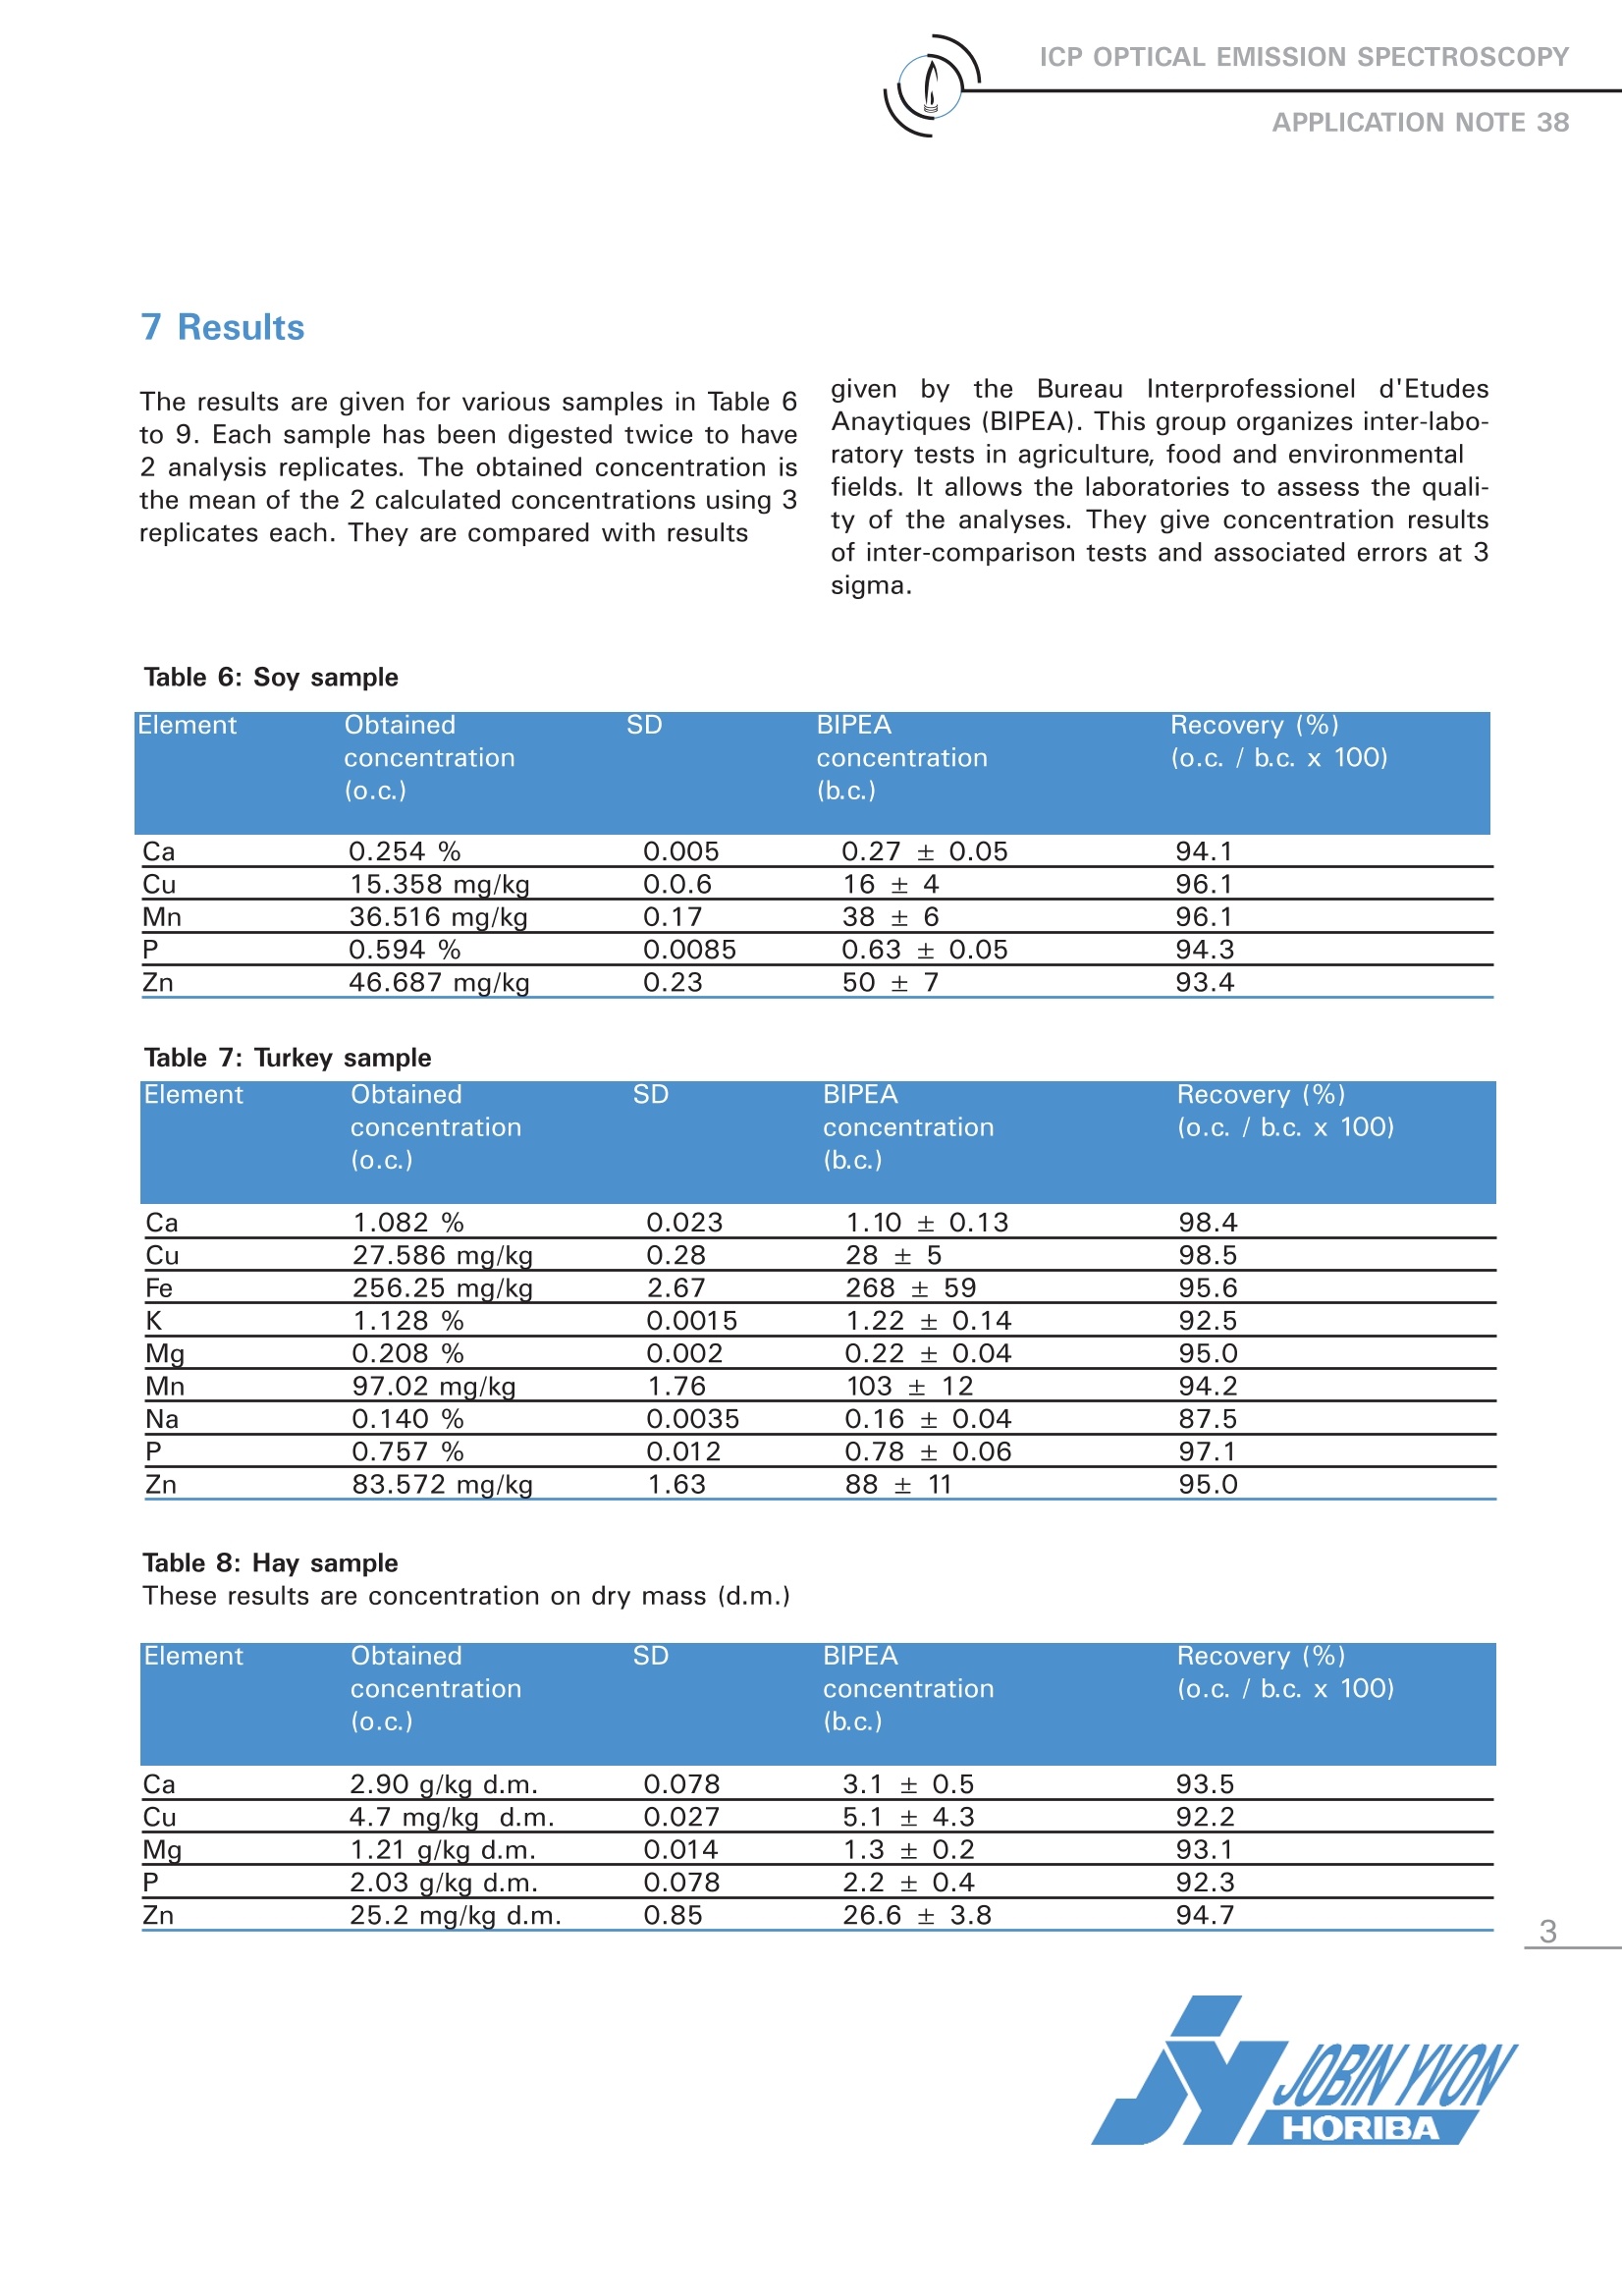
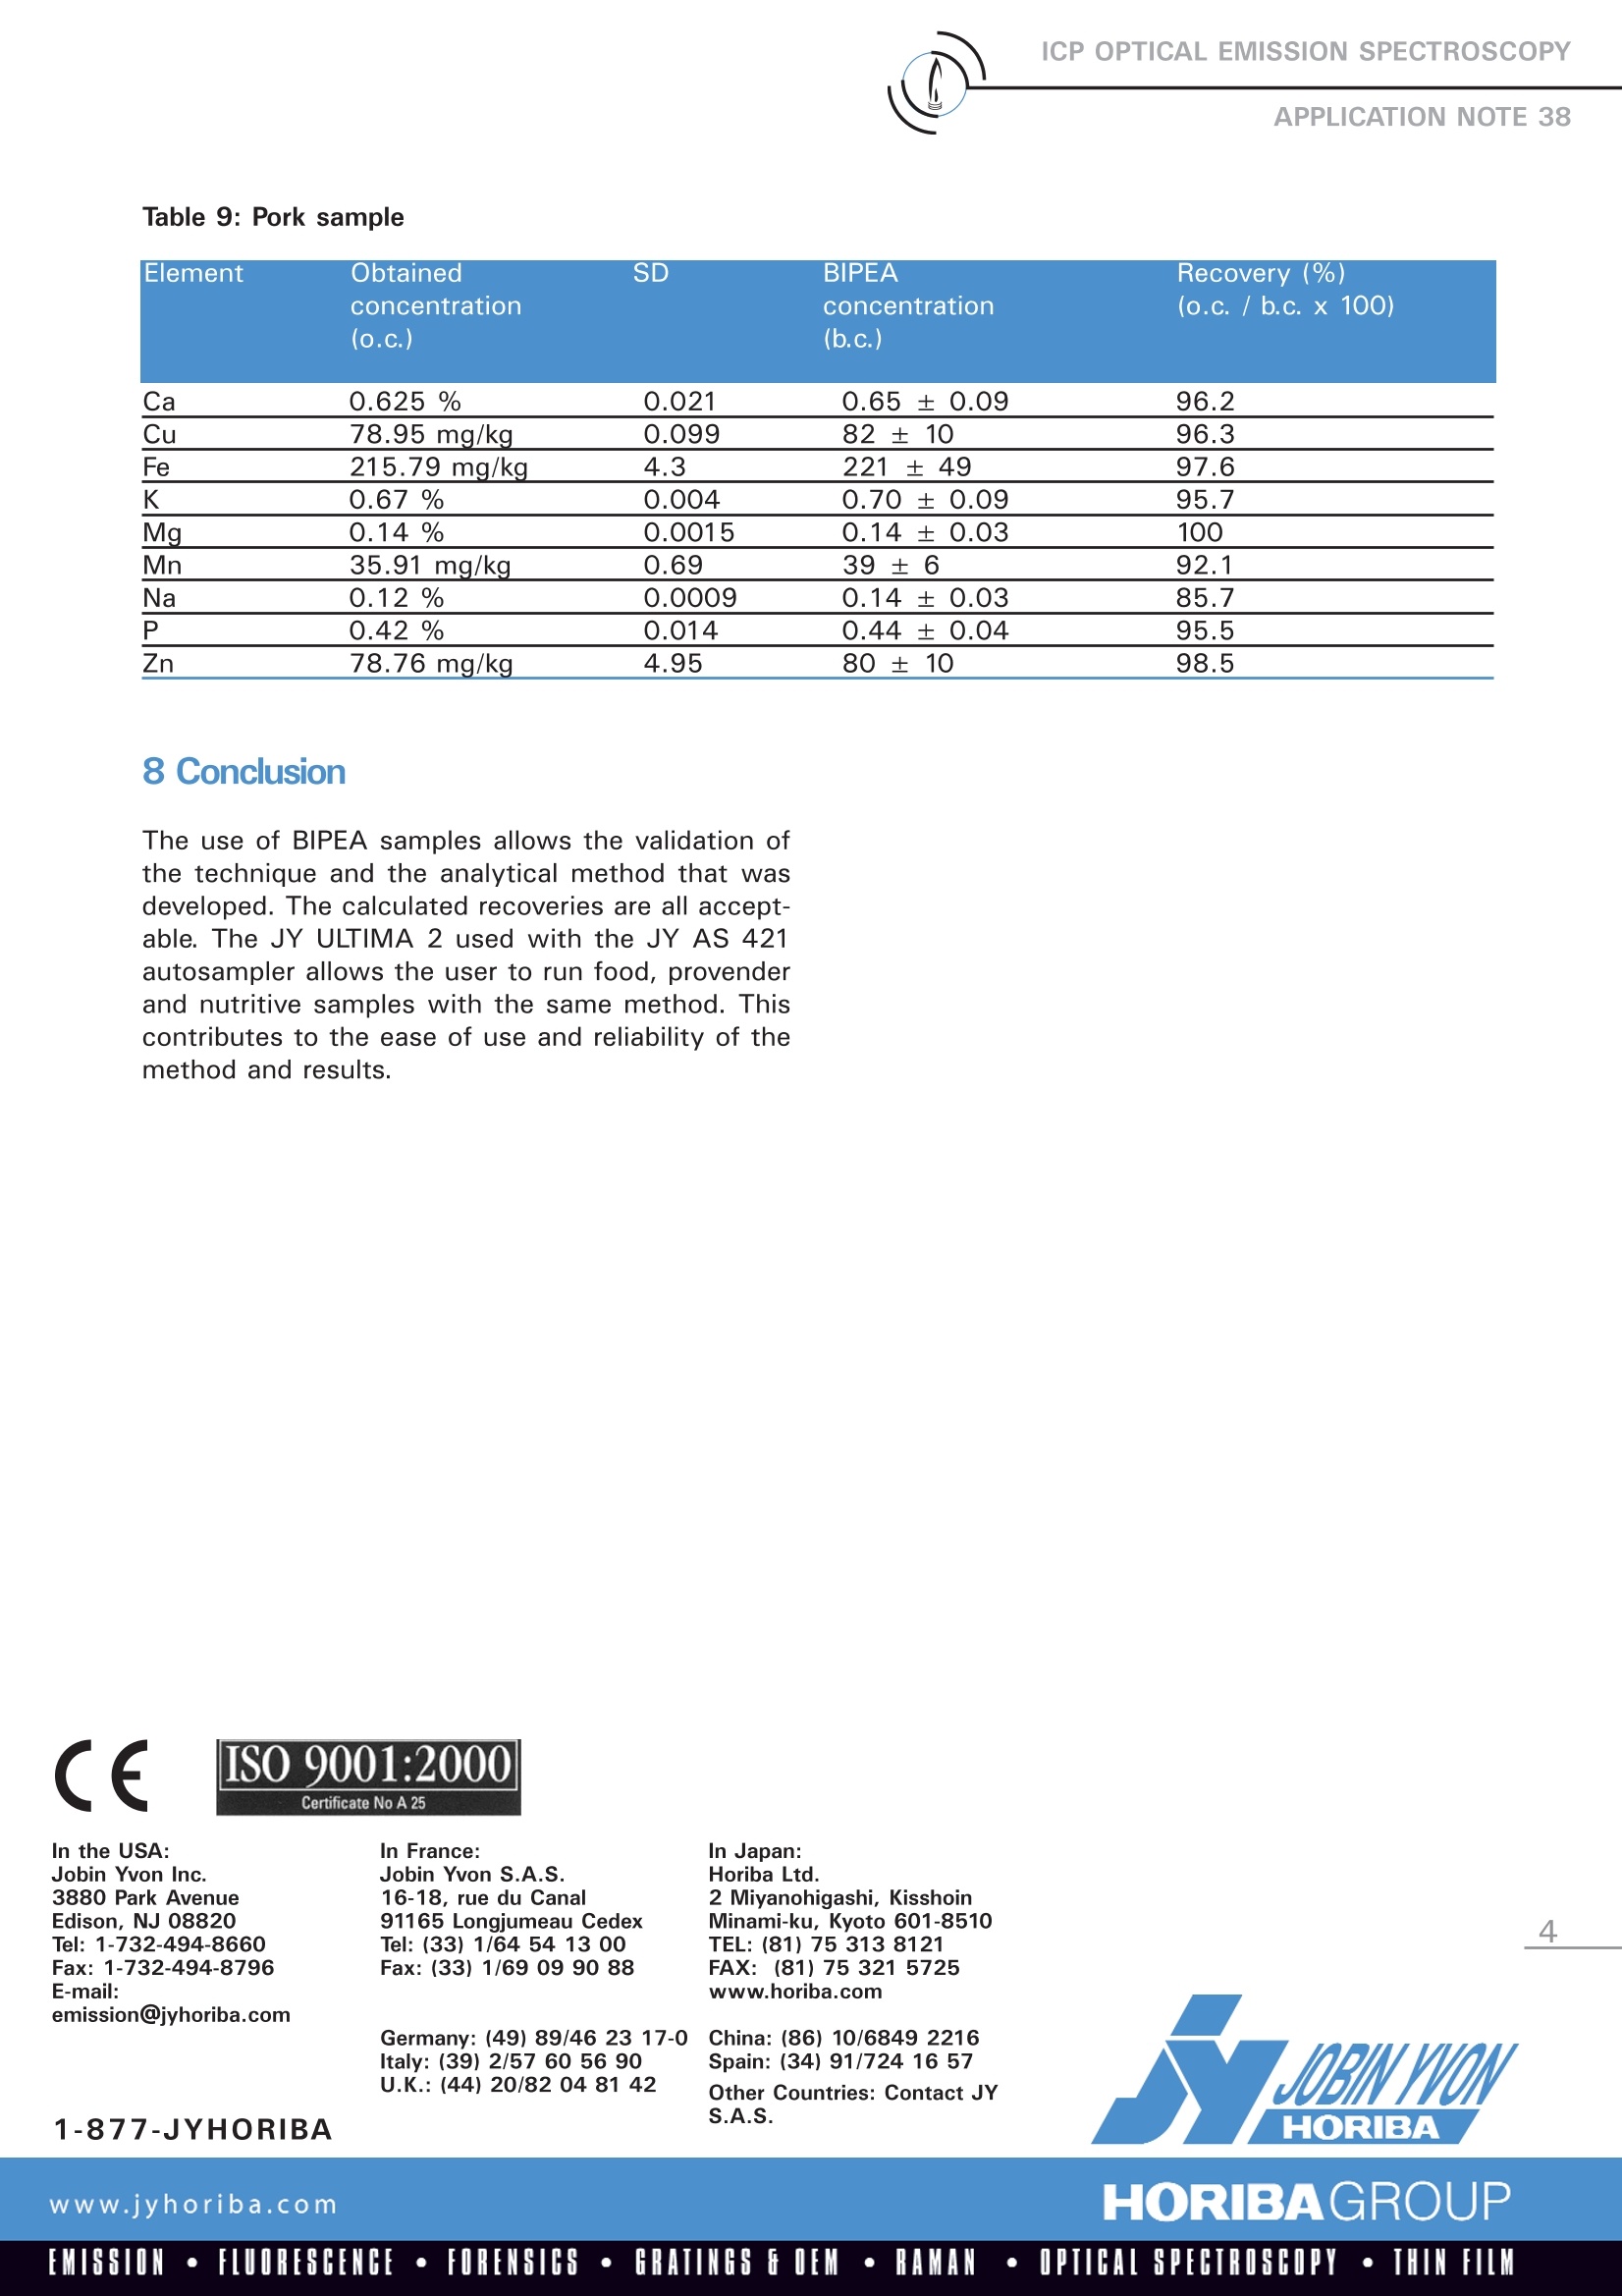
ICP OPTICAL EMISSION SPECTROSCOPYAPPLICATION NOTE 38 Application of ICP-OES to the Analysis of Food andAgriculture: turkey, pork, hay and soy samples M. SORIN, Cana, Laboratoire Central, Ancenis, France Agnes COSNIER, Jobin Yvon S.A.S., Horiba Group, Longjumeau, France Keywords: food, agriculture The determination of major elements in food,cereals or nutritive solutions is essential for nutri-tional significance. This necessitates a reliabletechnique for good accuracy and precision. TheJY ULTIMA 2 ICP-OES spectrometer was used.This paper presents a description of the tech-nique, operating conditions and some results ofcertified materials. 2Principle 2.1 Technique used The elemental analysis of these samples wasundertakenn by Inductively Coupled】 PlasmaOptical Emission Spectrometry (ICP-OES). Thesample is nebulized then transferred to an argonplasma. It is decomposed, atomized and ionizedwhereby the atoms and ions are excited. Wemeasure the intensity of the light emitted whenthe atoms or ions return to lower levels of ener-gy. Each element emits light at characteristicwavelengths and these lines can be used forquantitative analysis after a calibration. 2.2 Wavelength choice The choice of the wavelength in a given matrixcan be made using the profile function, or byusing Win-IMAGE, which is rapid semi-quantita-tive analysis mode using multiple wavelengths.The principle is the same in either case: recordthe scans of analytes at low concentration andof the matrix. By superimposing the spectra, wesee possible interferences. 3 Sample Preparation The preparation was done following the NormXPV 18-116, Dec 1995.5 g of sample are calci-nated at 550 °C during 6 hours. The ashes arethen diluted with 37 % HCl and demineralizedwater (solution completed to 250 ml). The finaconcentration of acid is 2.5%. 4 Calibration and analysis mode 6multi-elementt standardswere;preparedir2.5% HCl. The solutions used for calibration arelisted in the Table 1 (in mg/L). 5 Instrument specification lThe work was performed on a JY ULTIMA 2 withthe specifications shown below. Table 2: Specification of spectrometer Parameters Specifications Mounting Czerny-Turner Focal length 1 m Optics thermoregulation Yes Variable resolution Yes Nitrogen purge Yes Grating (number of grooves) 2400 gr/mm Orders 2 1st order resolution 0.005 nm 2nd order resolution 0.010 nm Element STDO STD1 STD2 STD3 STD4 STD5 Unit Ca 0 0.002 0.005 0.02 0.04 0.05 % Cu 0 0.10 0.25 1.00 2.00 2.50 mg/kg Fe 0 0.40 1.00 4.00 8.00 10.00 mg/kg K 0 0.002 0.005 0.02 0.04 0.05 % Mg 0 0.0004 0.001 0.004 0.008 0.01 % Mn 0 0.20 0.50 2.00 4.00 5.00 mg/kg Na 0 0.001 0.0025 0.01 0.02 0.025 % P 0 0.001 0.0025 0.01 0.02 0.025 % Zn 0 0.20 0.50 2.00 4.00 5.00 mg/kg Table 3: Specification of RF Generator Parameters Specifications Iype of generator Solid state Observation Radial view Frequency 40.68 MHz Control of gas flowrate By computer Control of sample uptake By computer Cooling Air The operating conditions of the spectrometer arelisted in Table 4. Table 4: Operating conditions Parameter Condition Generator power 1000 W Plasma gas flowrate 13 L/min Auxiliary gas flowrate O L/min Sheath gas flowrate 0.2 L/min Nebulizer 0.8 L/min at 3 bars Sample uptake 1 mL/min Type of nebulizer Glass concentric Type of spray chamber Glass cyclonic Argon humidifier No Injector tube diameter 3.0 mm 6 Wavelength selection and analytical conditions The acquisition parameters are listed in Table 5. Table 5: acquisitions parameters Element Wavelength Measuring Calculating Integration Entrance Exit Calculation (nm) point point time slit slit mode (s) (um) (um) Ca 317.933 1 1 4 20 80 Max Cu 324.754 1 1 4 20 80 Max Fe 259.940 1 1 4 20 80 Max K 766.490 1 1 4 20 80 Max Mg 279.079 1 1 4 20 80 Max Mn 257.610 1 1 4 20 80 Max Na 589.592 1 1 4 20 80 Max P 214.914 7 5 2 20 15 Gauss Zn 213.856 1 1 4 20 80 Max The results are given for various samples in Table 6to 9. Each sample has been digested twice to have2 analysis replicates. The obtained concentration isthe mean of the 2 calculated concentrations using 3replicates each. They are compared with results givenby the Bureau Interprofessioneld'EtudesAnaytiques (BIPEA). This group organizes inter-labo-ratory tests in agriculture, food and environmentalfields. It allows the laboratories to assess the quali-ty of the analyses. They give concentration resultsof inter-comparison tests and associated errors at 3sigma. Element Obtained SD BIPEA Recovery (%) concentration concentration (o.c./ b.c. x 100) (o.c.) (b.c.) Ca 0.254% 0.005 0.27±0.05 94.1 Cu 15.358 mg/kg 0.0.6 16±4 96.1 Mn 36.516 mg/kg 0.17 38±6 96.1 P 0.594% 0.0085 0.63±0.05 94.3 Zn 46.687 mg/kg 0.23 50±7 93.4 Table 7: Turkey sample Element Obtained SD BIPEA Recovery (%) concentration concentration (o.c. / b.c. x 100) (o.c.) (b.c.) Ca 1.082% 0.023 1.10±0.13 98.4 Cu 27.586 mg/kg 0.28 28±5 98.5 Fe 256.25 mg/kg 2.67 268±59 95.6 K 1.128% 0.0015 1.22±0.14 92.5 Mg 0.208% 0.002 0.22±0.04 95.0 Mn 97.02 mg/kg 1.76 103±12 94.2 Na 0.140% 0.0035 0.16±0.04 87.5 P 0.757% 0.012 0.78±0.06 97.1 Zn 83.572 mg/kg 1.63 88±11 95.0 Table 8: Hay sampleThese results are concentration on dry mass (d.m.) Element Obtained SD BIPEA Recovery (%) concentration concentration (o.c. / b.c. x 100) (o.c.) (b.c.) Ca 2.90 g/kg d.m. 0.078 3.1±0.5 93.5 Cu 4.7mg/kg d.m. 0.027 5.1±4.3 92.2 Mg 1.21 g/kg d.m. 0.014 1.3±0.2 93.1 P 2.03 g/kg d.m. 0.078 2.2±0.4 92.3 Zn 25.2 mg/kg d.m. 0.85 26.6±3.8 94.7 Table 9: Pork sample Element Obtained SD BIPEA Recovery (%) concentration concentration (o.c. / b.c. x 100) (o.c.) (b.c.) Ca 0.625% 0.021 0.65±0.09 96.2 Cu 78.95 mg/kg 0.099 82±10 96.3 Fe 215.79 mg/kg 4.3 221 ±49 97.6 K 0.67% 0.004 0.70±0.09 95.7 Mg_ 0.14% 0.0015 0.14±0.03 100 Mn 35.91 mg/kg 0.69 39±6 92.1 Na 0.12% 0.0009 0.14±0.03 85.7 P 0.42% 0.014 0.44±0.04 95.5 Zn 78.76 mg/kg 4.95 80±10 98.5 In the USA:Jobin Yvon Inc.3880 Park AvenueEdison, NJ 08820Tel: 1-732-494-8660Fax:1-732-494-8796E-mail:emission@jyhoriba.com
确定
还剩2页未读,是否继续阅读?

产品配置单

HORIBA(中国)为您提供《食物中微量元素检测方案(ICP-AES)》,该方案主要用于豆类中微量元素检测,参考标准--,《食物中微量元素检测方案(ICP-AES)》用到的仪器有HORIBA Ultima Expert高性能ICP光谱仪
推荐专场
相关方案
更多
该厂商其他方案
更多