


A vitamin mineral sample was presented to this laboratory for trace and major element determination.
The sample was previously digested by microwave heating. The assay required was Zn,Fe, Cu, Mn, I2 at % levels and Pb, Cd, Hg, Al at
ppm levels in the solid sample. This report gives the best wavelengths for the determination of analytes in these matrices, as well as the operating conditions and the analytical results.
方案详情

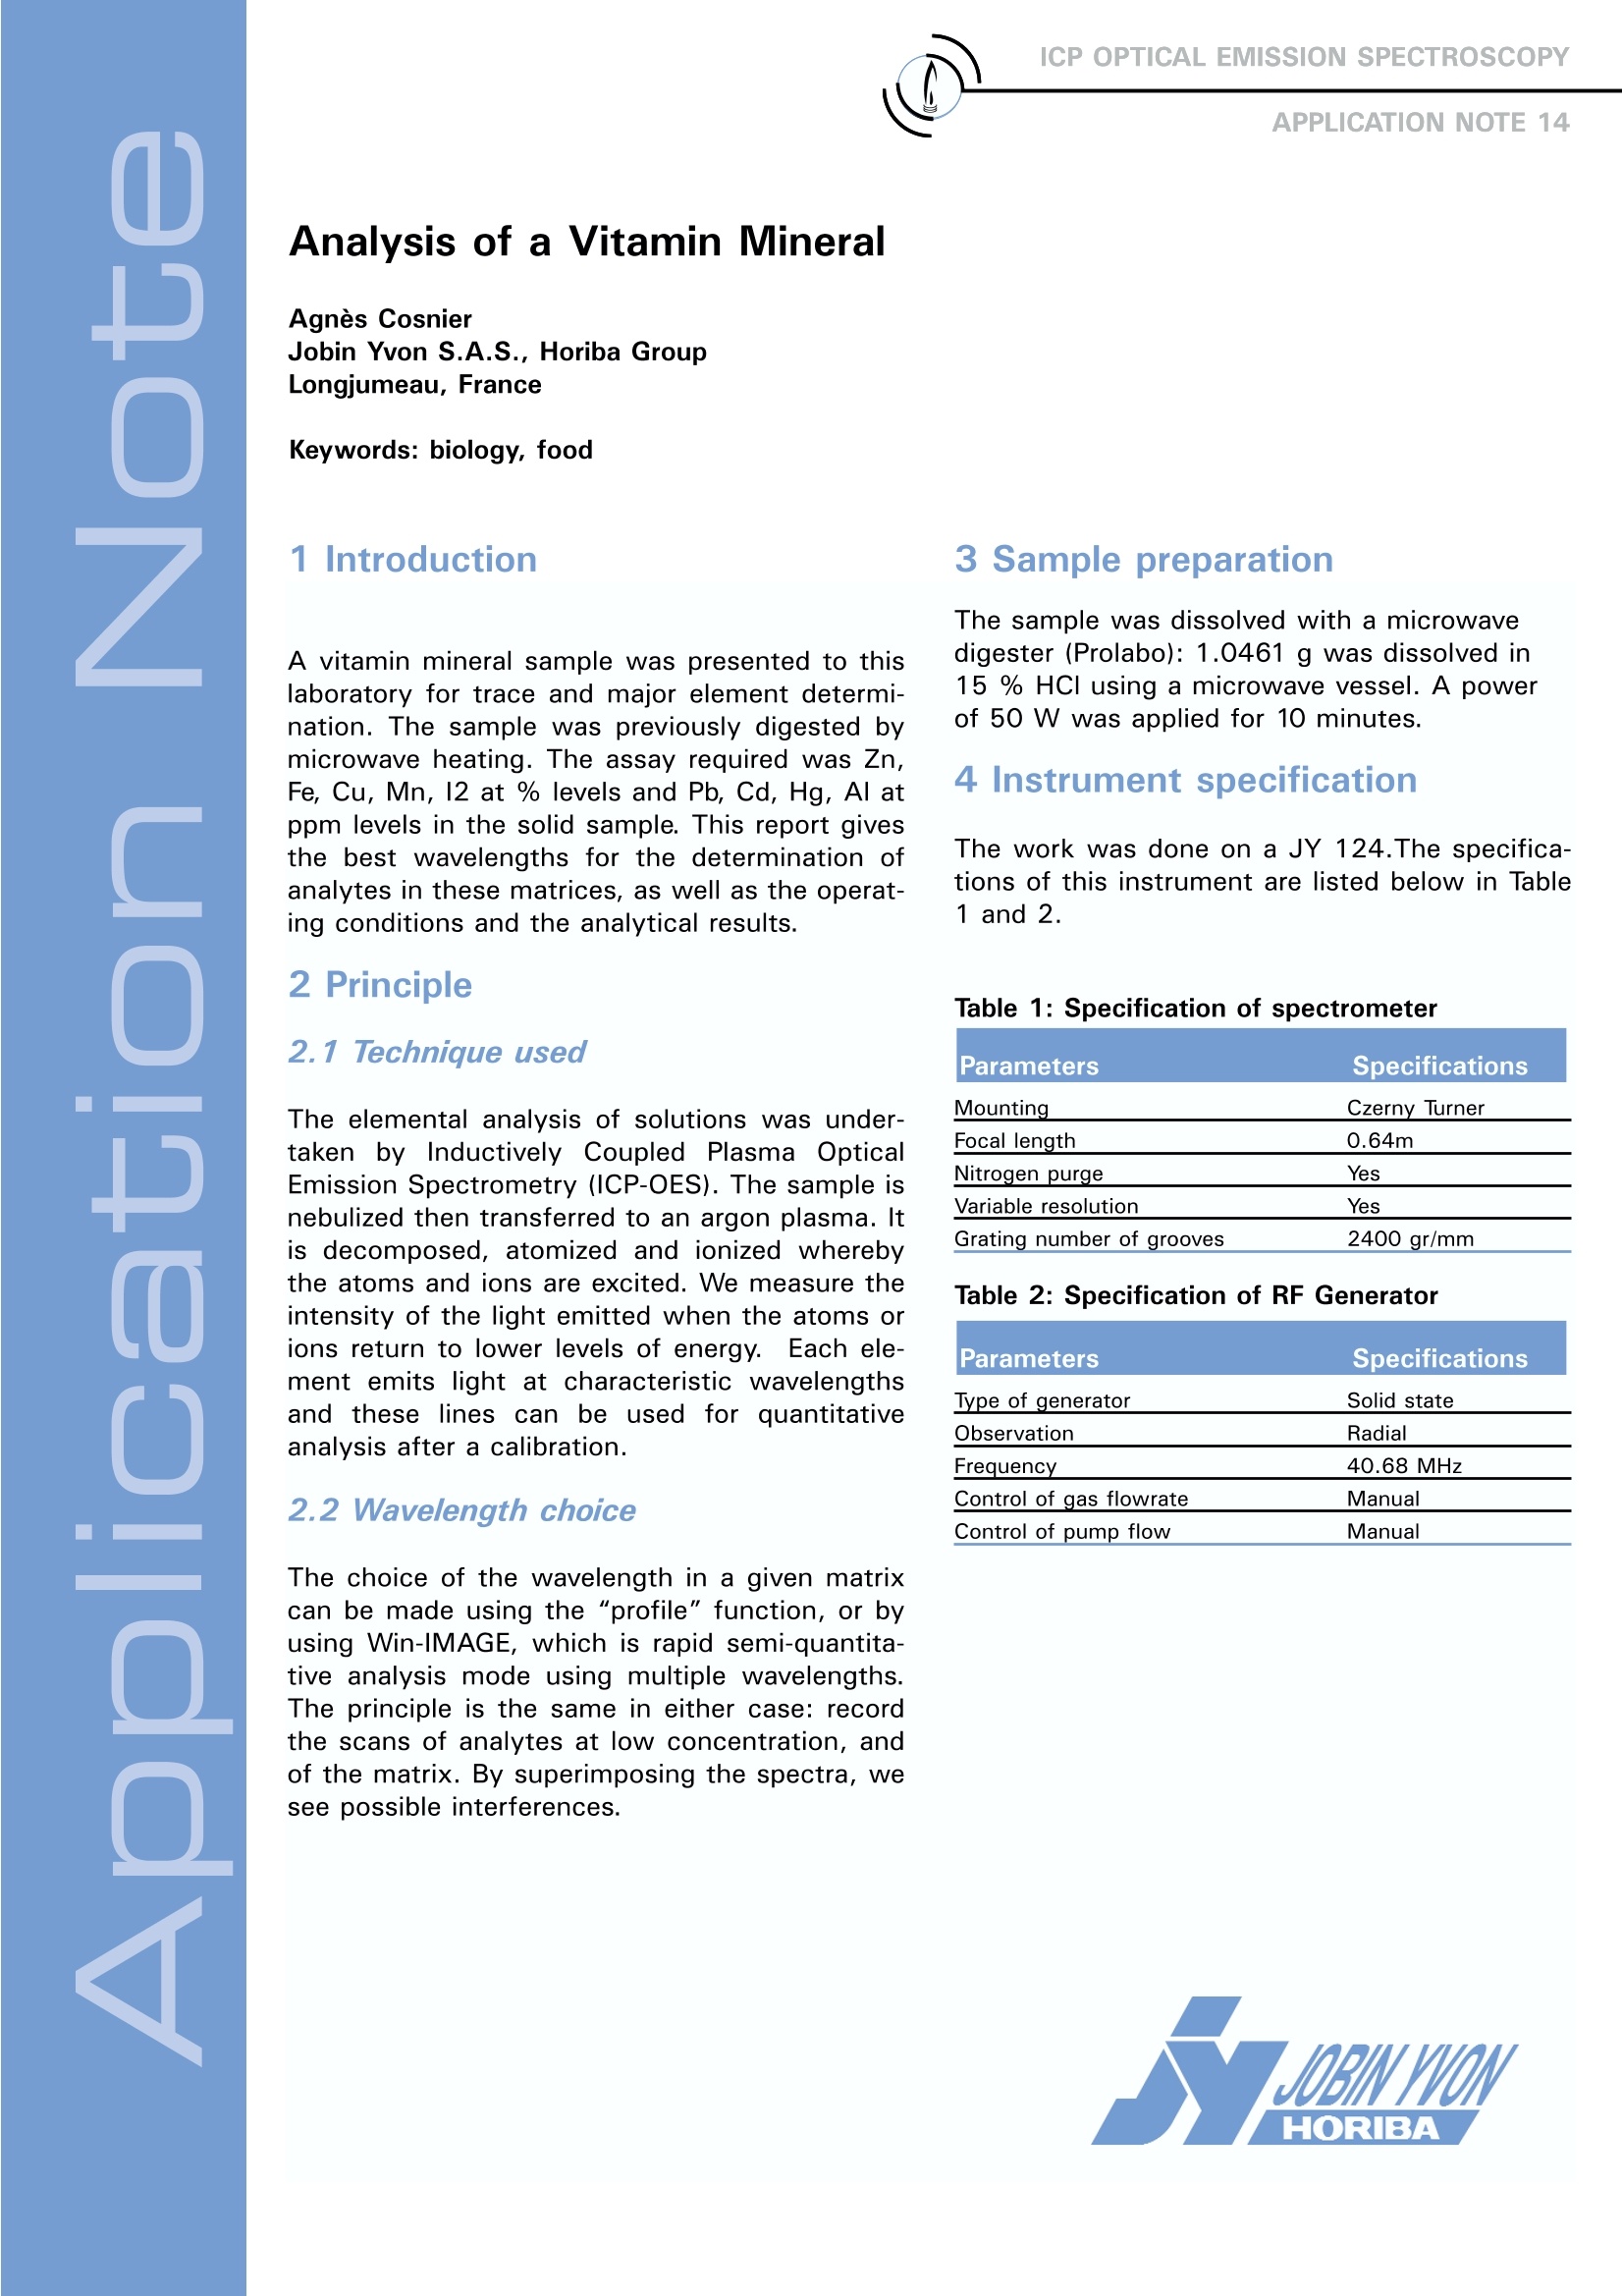
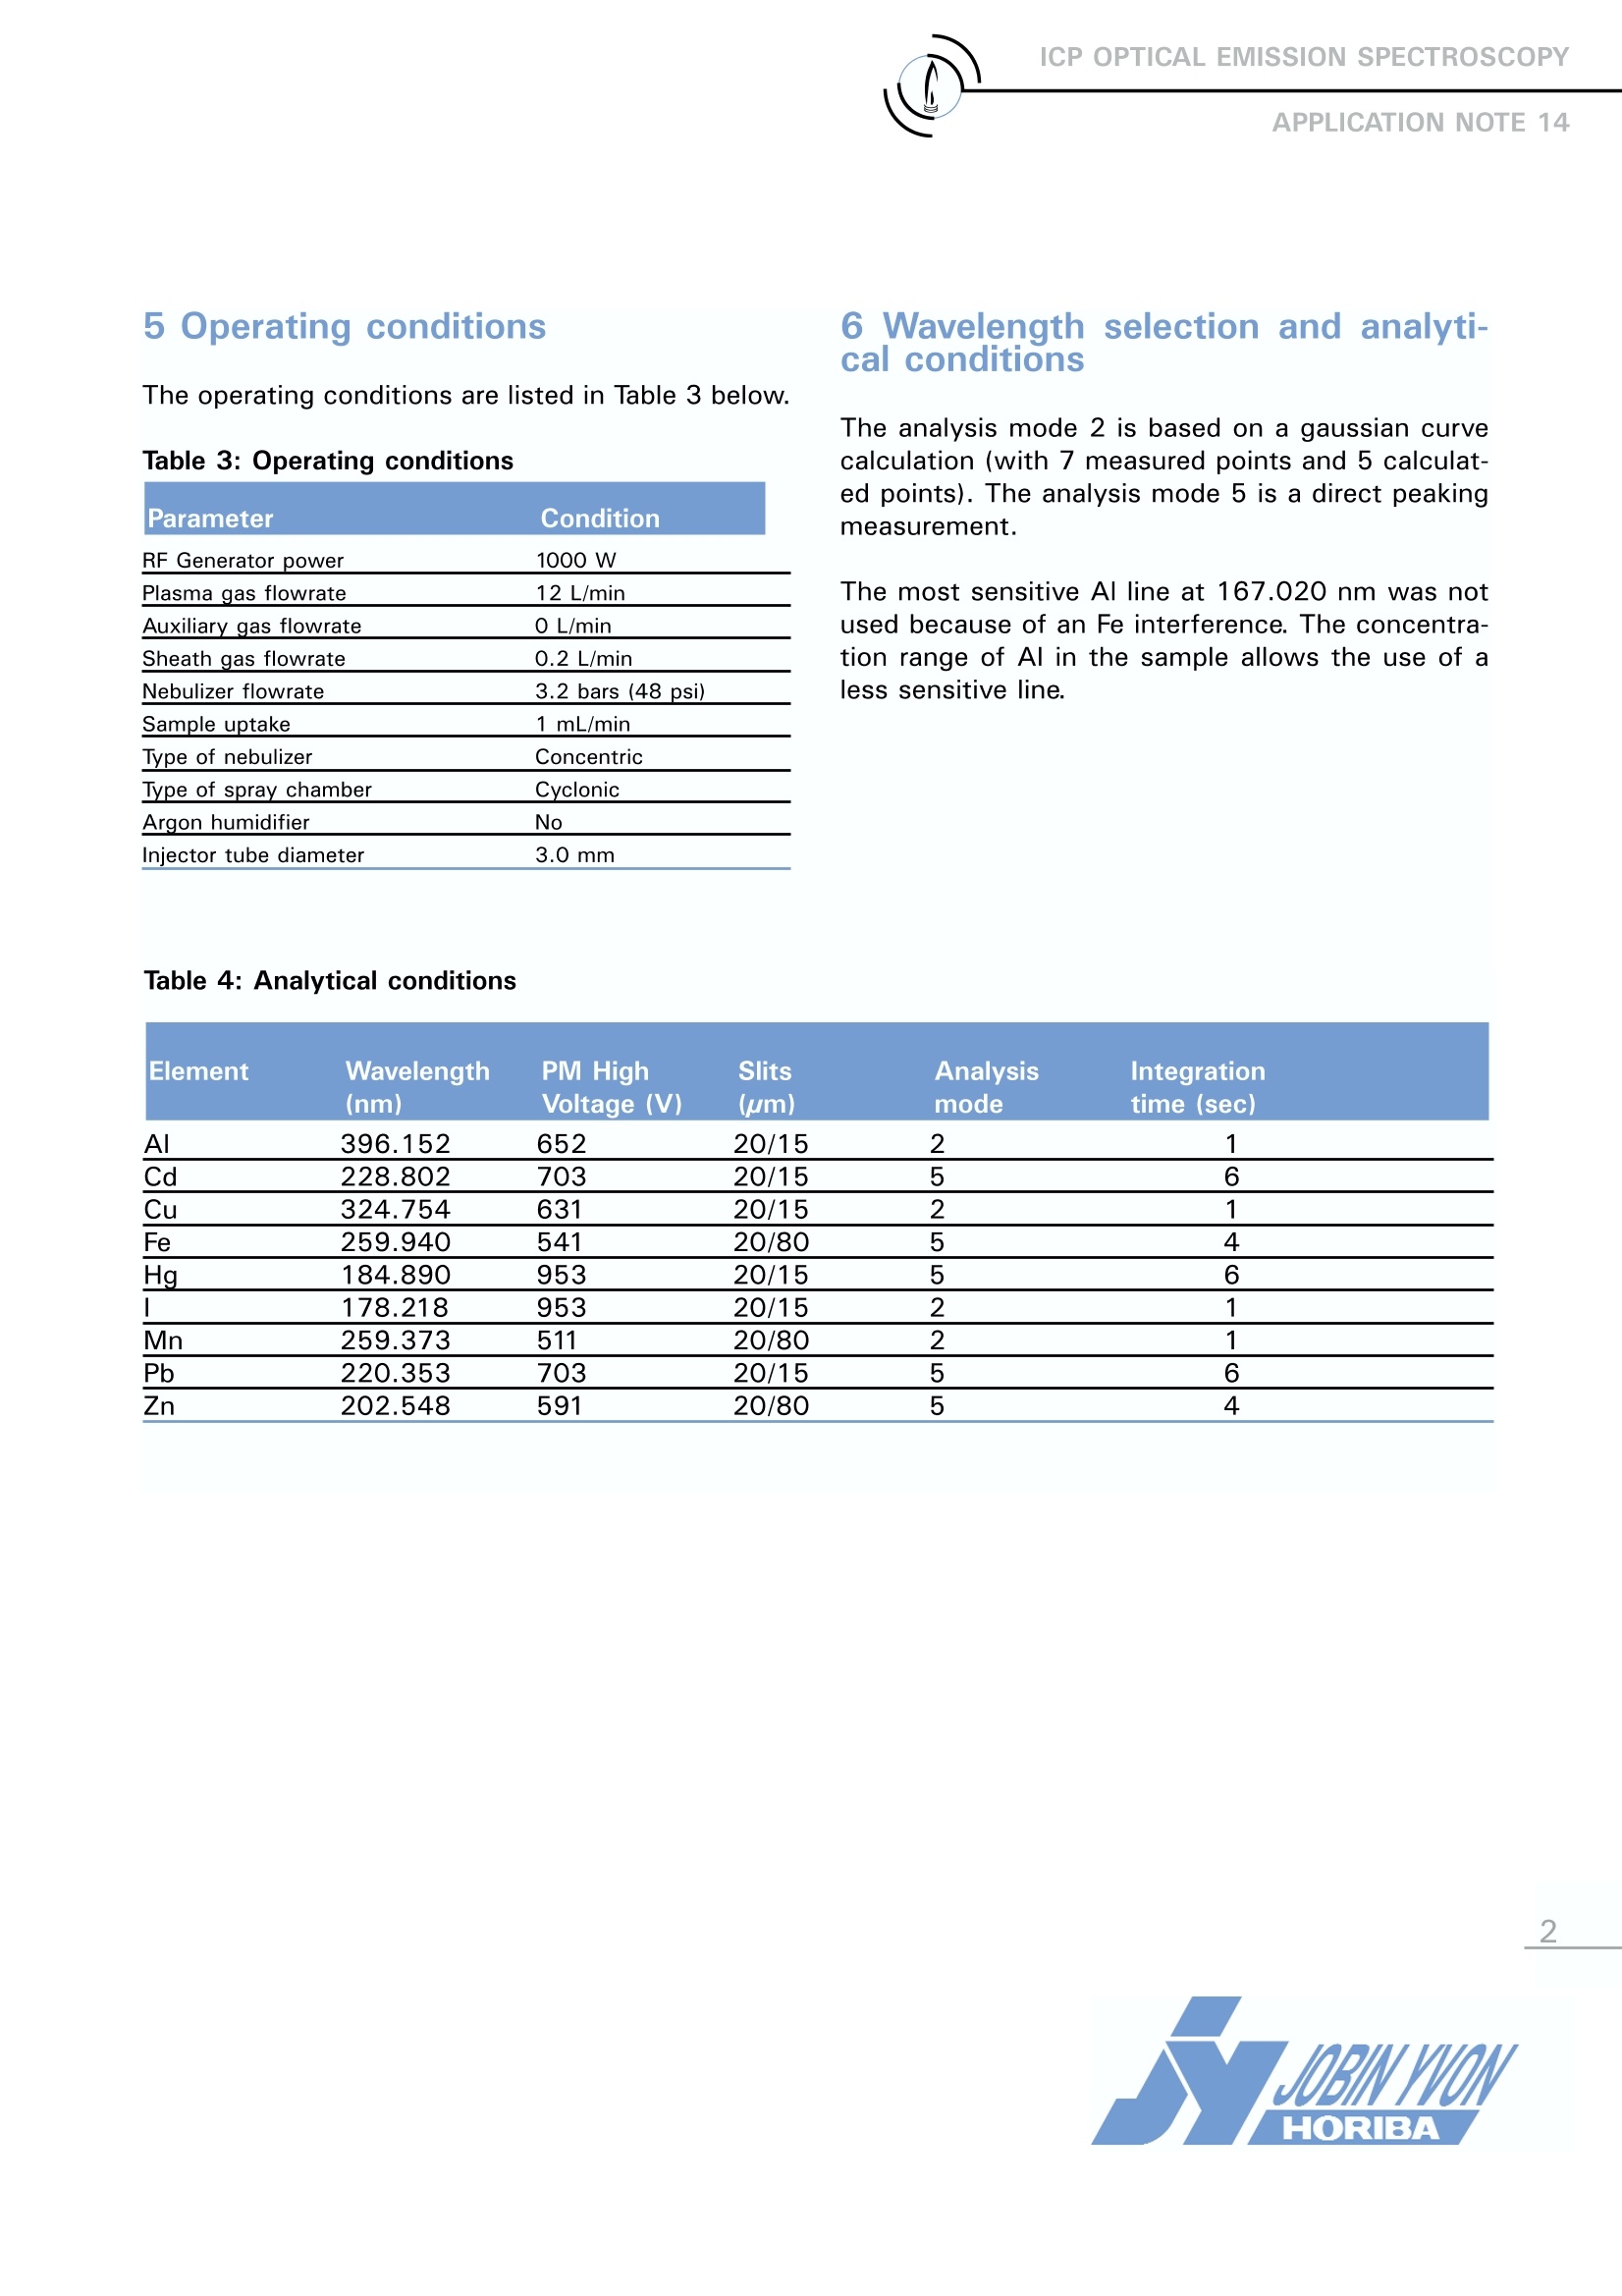
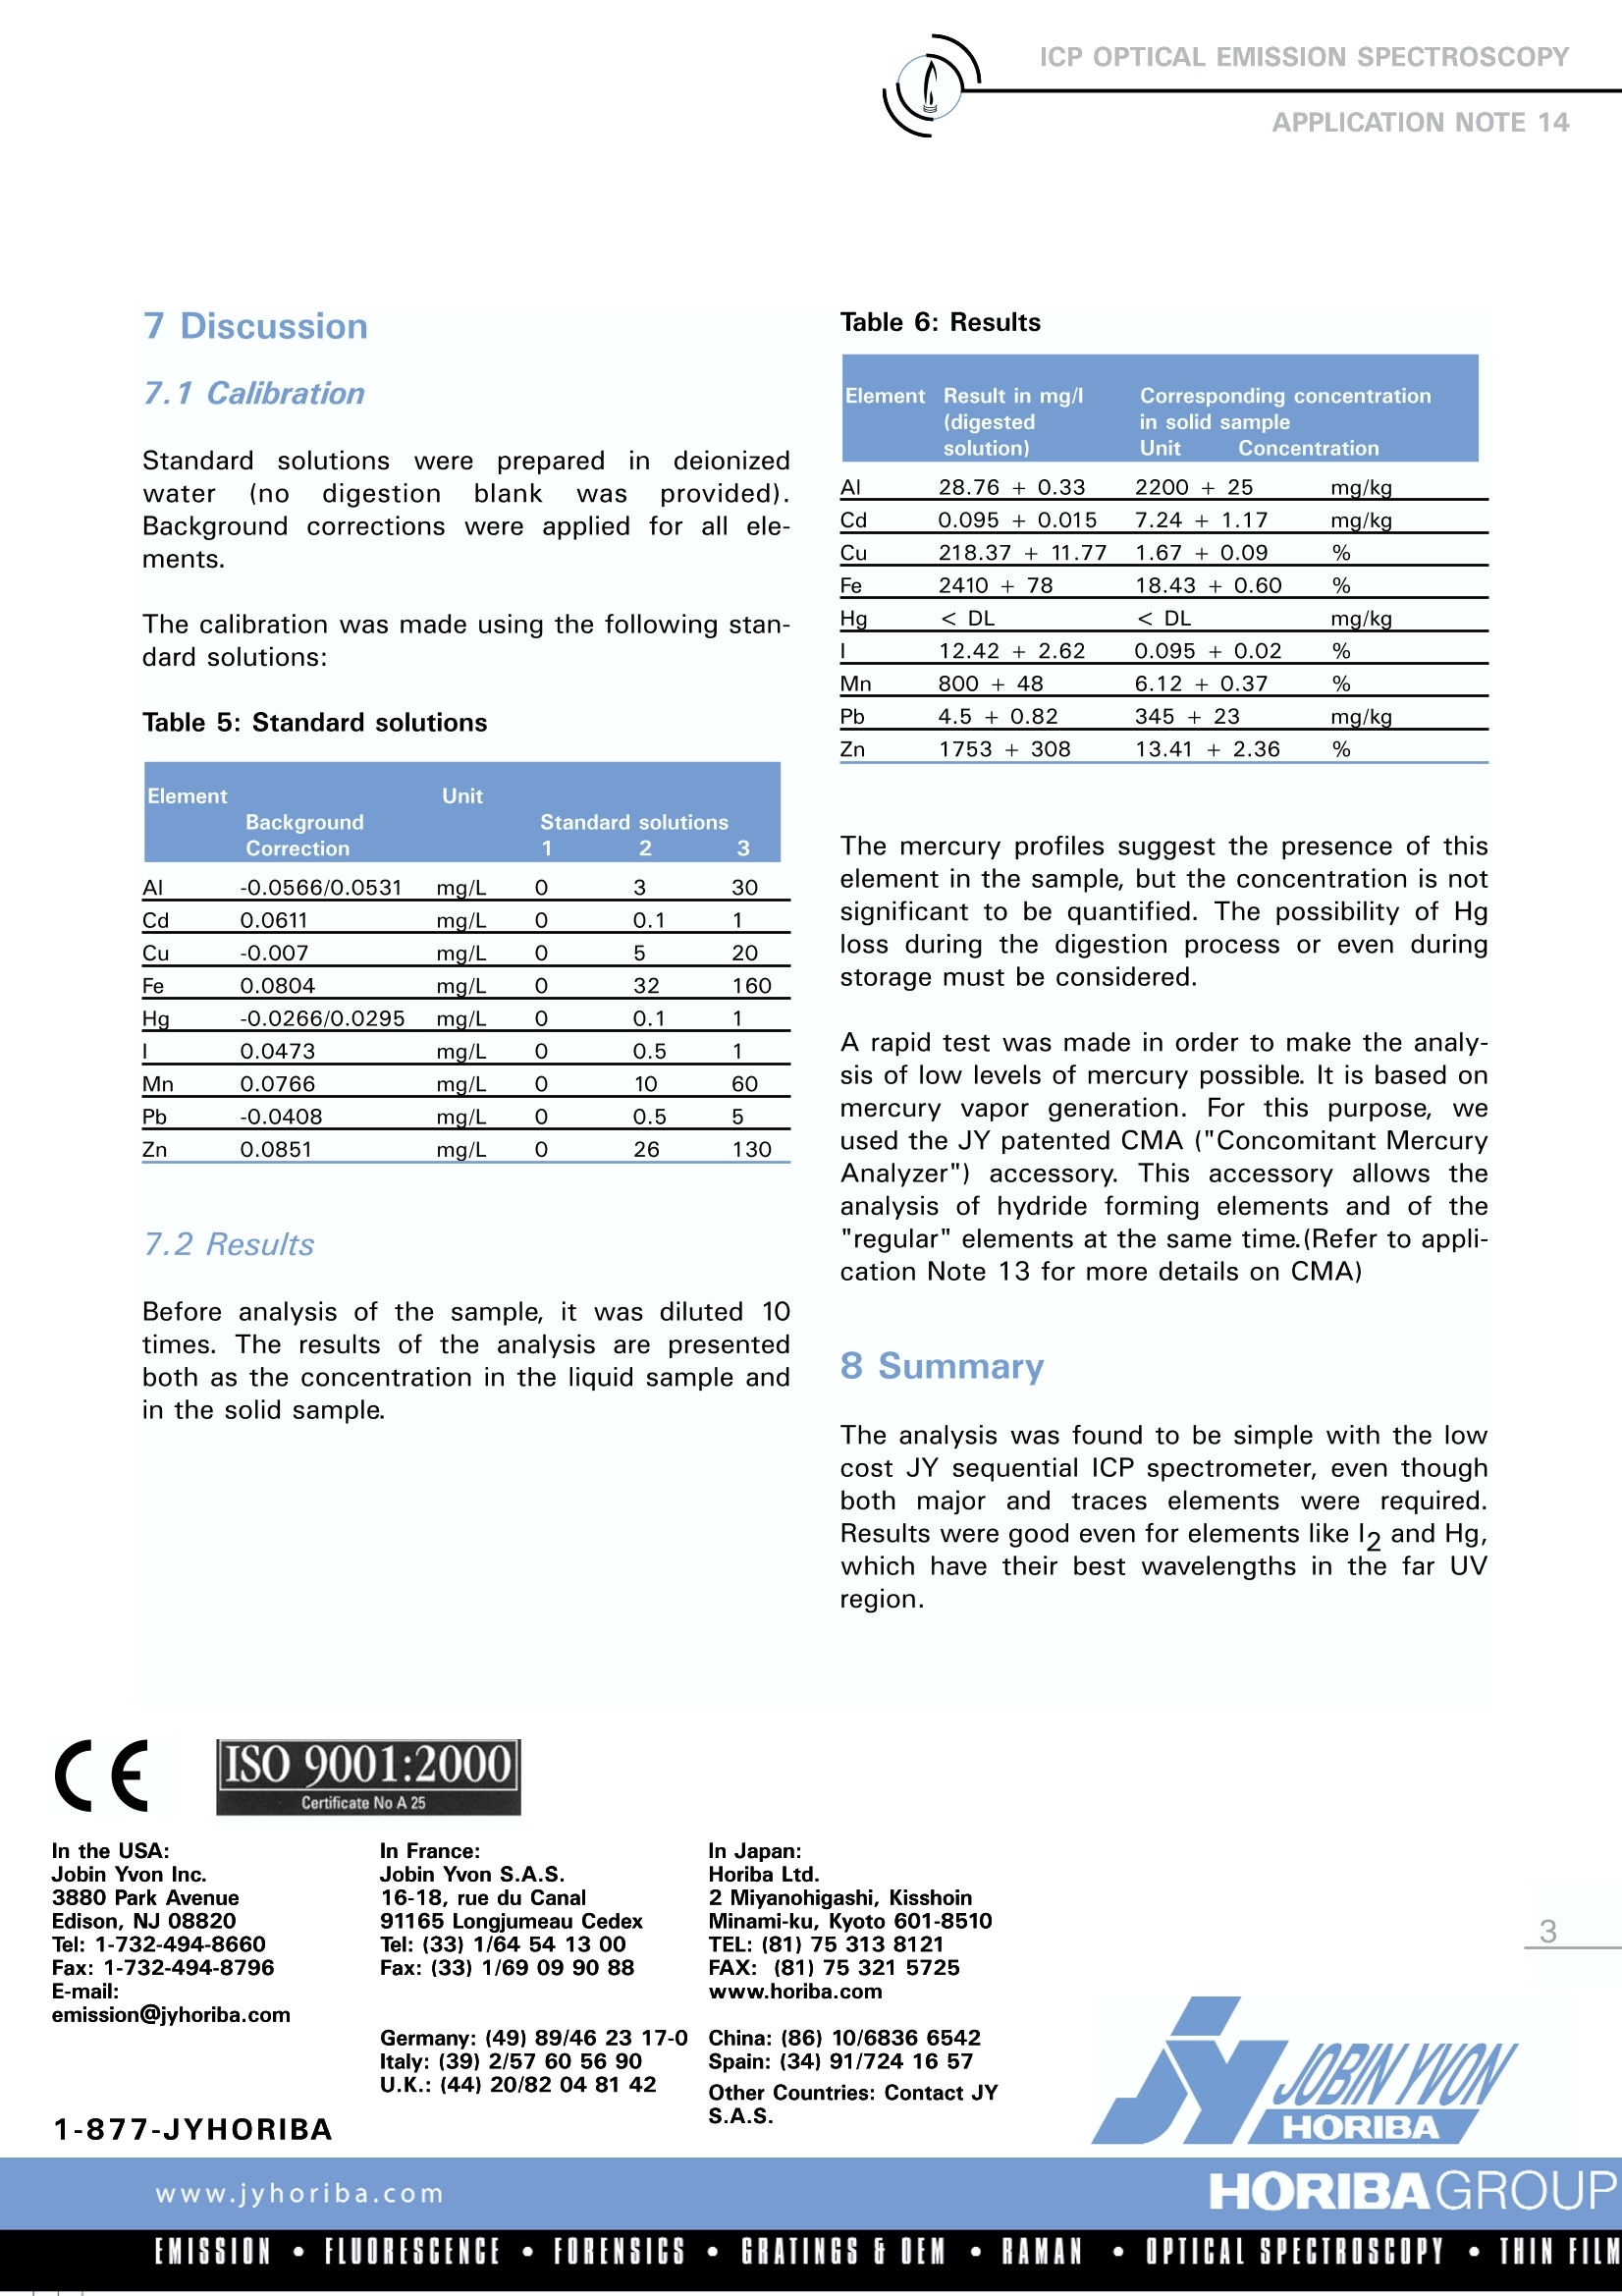
ICP OPTICAL EMISSION SPECTROSCOPYAPPLICATION NOTE 14 Analysis of a Vitamin Mineral Agnes Cosnier Jobin Yvon S.A.S., Horiba Group Longjumeau, France Keywords: biology, food 1 Introduction A vitamin mineral sample was presented to thislaboratory for trace and major element determi-nation. The sample was previously digested bymicrowave heating. The assay required was Zn,Fe, Cu, Mn, 12 at % levels and Pb, Cd, Hg, Al atppm levels in the solid sample. This report givesthe best wavelengths for the determination ofanalytes in these matrices, as well as the operat-ing conditions and the analytical results. 2 Principle 2. 1 Technique used The elemental analysis of solutions was under-taken by Inductively Coupled Plasma OpticalEmission Spectrometry (ICP-OES). The sample isnebulized then transferred to an argon plasma. Itis decomposed, atomized and ionized wherebythe atoms and ions are excited. We measure theintensity of the light emitted when the atoms orions return to lower levels of energy.y.Each ele-ment emits light at characteristic wavelengthsand these lines can be used for quantitativeanalysis after a calibration. 2.2 Wavelength choice The choice of the wavelength in a given matrixcan be made using the “profile"function, or byusing Win-IMAGE,which is rapid semi-quantita-tive analysis mode using multiple wavelengths.The principle is the same in either case: recordthe scans of analytes at low concentration, andof the matrix. By superimposing the spectra, wesee possible interferences. The sample was dissolved with a microwavedigester (Prolabo): 1.0461 g was dissolved in15 % HCl using a microwave vessel. A powerof 50 W was applied for 10 minutes. 4 Instrument specification The work was done on a JY 124.The specifica-tions of this instrument are listed below in Table1 and 2. Table 1: Specification of spectrometer Parameters Specifications Mounting Czerny Turner Focal length 0.64m Nitrogen purge Yes Variable resolution Yes 2400 gr/mm Table 2: Specification of RF Generator Parameters Specifications Type of generator Solid state Observation Radial Frequency 40.68 MHz Control of gas flowrate Manual Control of pump flow Manual 5 Operating conditions The operating conditions are listed in Table 3 below. Table 3: Operating conditions Parameter Condition RF Generator power 1000 W Plasma gas flowrate 12 L/min Auxiliary gas flowrate 0 L/min Sheath gas flowrate 0.2 L/min Nebulizer flowrate 3.2 bars (48 psi) Sample uptake 1 mL/min Type of nebulizer Concentric Type of spray chamber Cyclonic Argon humidifier No Injector tube diameter 3.0 mm 6 Wavelength selection and analyti-cal conditions The analysis mode 2 is based on a gaussian curvecalculation (with 7 measured points and 5 calculat-ed points). The analysis mode 5 is a direct peakingmeasurement. The most sensitive Al line at 167.020 nm was notused because of an Fe interference. The concentra-tion range of Al in the sample allows the use of aless sensitive line. Element Wavelength PM High Slits Analysis Integration (nm) Voltage (V) (um) mode time (sec) AI 396.152 652 20/15 2 1 Cd 228.802 703 20/15 5 6 Cu 324.754 631 20/15 2 1 Fe 259.940 541 20/80 5 4 Hg 184.890 953 20/15 5 6 178.218 953 20/15 2 1 Mn 259.373 511 20/80 2 1 Pb 220.353 703 20/15 5 6 Zn 202.548 591 20/80 5 4 Table 6: Results Element Result in mg/l Corresponding concentration (digested in solid sample solution) Unit Concentration AI 28.76+0.33 2200+ 25 mg/kg Cd 0.095+0.015 7.24+1.17 mg/kg Cu 218.37 +11.77 1.67+0.09 % Fe 2410 + 78 18.43+0.60 % Hg < DL < DL mg/kg 12.42 +2.62 0.095+0.02 % Mn 800+48 6.12 +0.37 % Pb 4.5+0.82 345+23 mg/kg Zn 1753+308 13.41 + 2.36 % The mercury profiles suggest the presence of thiselement in the sample, but the concentration is notsignificant to be quantified. The possibility of Hgloss during the digestion process or even duringstorage must be considered. A rapid test was made in order to make the analy-sis of low levels of mercury possible. It is based onmercury vapor generation. For this purpose, weused the JY patented CMA ("Concomitant MercuryAnalyzer") accessory. This accessory allows theanalysis of hydride forming elements and of the"regular" elements at the same time.(Refer to appli-cation Note 13 for more details on CMA) 8 Summary The analysis was found to be simple with the lowcost JY sequential ICP spectrometer, even thoughboth major and traces elements were required.Results were good even for elements like l2 and Hg,which have their best wavelengths in the far UVregion. In the USA: Jobin Yvon Inc. 3880 Park Avenue Edison, NJ 08820 Tel: 1-732-494-8660 Fax: 1-732-494-8796 E-mail: emission@jyhoriba.com 7 Discussion 7.1 Calibration Standard solutionswereprepared in deionizedwater (nodigestion blank Was provided).Background corrections were applied for all ele-ments. The calibration was made using the following stan-dard solutions: Table 5: Standard solutions Element Background Unit Standard solutions Correction 1 2 3 AI -0.0566/0.0531 mg/L 0 3 30 Cd 0.0611 mg/L 0 0.1 1 Cu -0.007 mg/L 0 5 20 Fe 0.0804 mg/L 0 32 160 Hg -0.0266/0.0295 mg/L 0 0.1 1 0.0473 mg/L 0 0.5 1 Mn 0.0766 mg/L 0 10 60 Pb -0.0408 mg/L 0 0.5 5 Zn 0.0851 mg/L 0 26 130 7.2 Results Before analysis of the sample, it was diluted 10times. The results of the analysis are presentedboth as the concentration in the liquid sample andin the solid sample. ISO 9001:2000Certificate No A 25 In France: In Japan: Jobin Yvon S.A.S. Horiba Ltd. 16-18, rue du Canal 91165 Longjumeau Cedex Tel: (33) 1/64 54 1300 Fax: (33) 1/69 09 90 88 Germany: (49) 89/46 23 17-0 Italy: (39) 2/57 60 56 90 U.K.: (44) 20/82 04 81 42 2 Miyanohigashi, Kisshoin Minami-ku, Kyoto 601-8510 TEL: (81) 75 313 8121 FAX: (81)753215725 www.horiba.com China: (86) 10/6836 6542 Spain: (34)91/724 16 57 Other Countries: Contact JY MISSION·FLUORESCENCE·FORENSICS·GRATINGSGOEM·RAMAN·OPTICAL SPECTROSCOPY·THIN FILM
确定
还剩1页未读,是否继续阅读?

产品配置单

HORIBA(中国)为您提供《维生素矿物质中采用ICP方法分析检测方案 》,该方案主要用于乳粉中营养成分检测,参考标准--,《维生素矿物质中采用ICP方法分析检测方案 》用到的仪器有HORIBA Ultima Expert高性能ICP光谱仪
推荐专场
相关方案
更多
该厂商其他方案
更多