


方案详情
文
The analysis of beer is important to the brewery industry, both for production purposes as well as to the final consumer. The analysis can pose several problems due to both the CO2 gas dissolved in the beer and the dissolved and undissolved protein. This report demonstrates several approaches and compares the results obtained.
方案详情

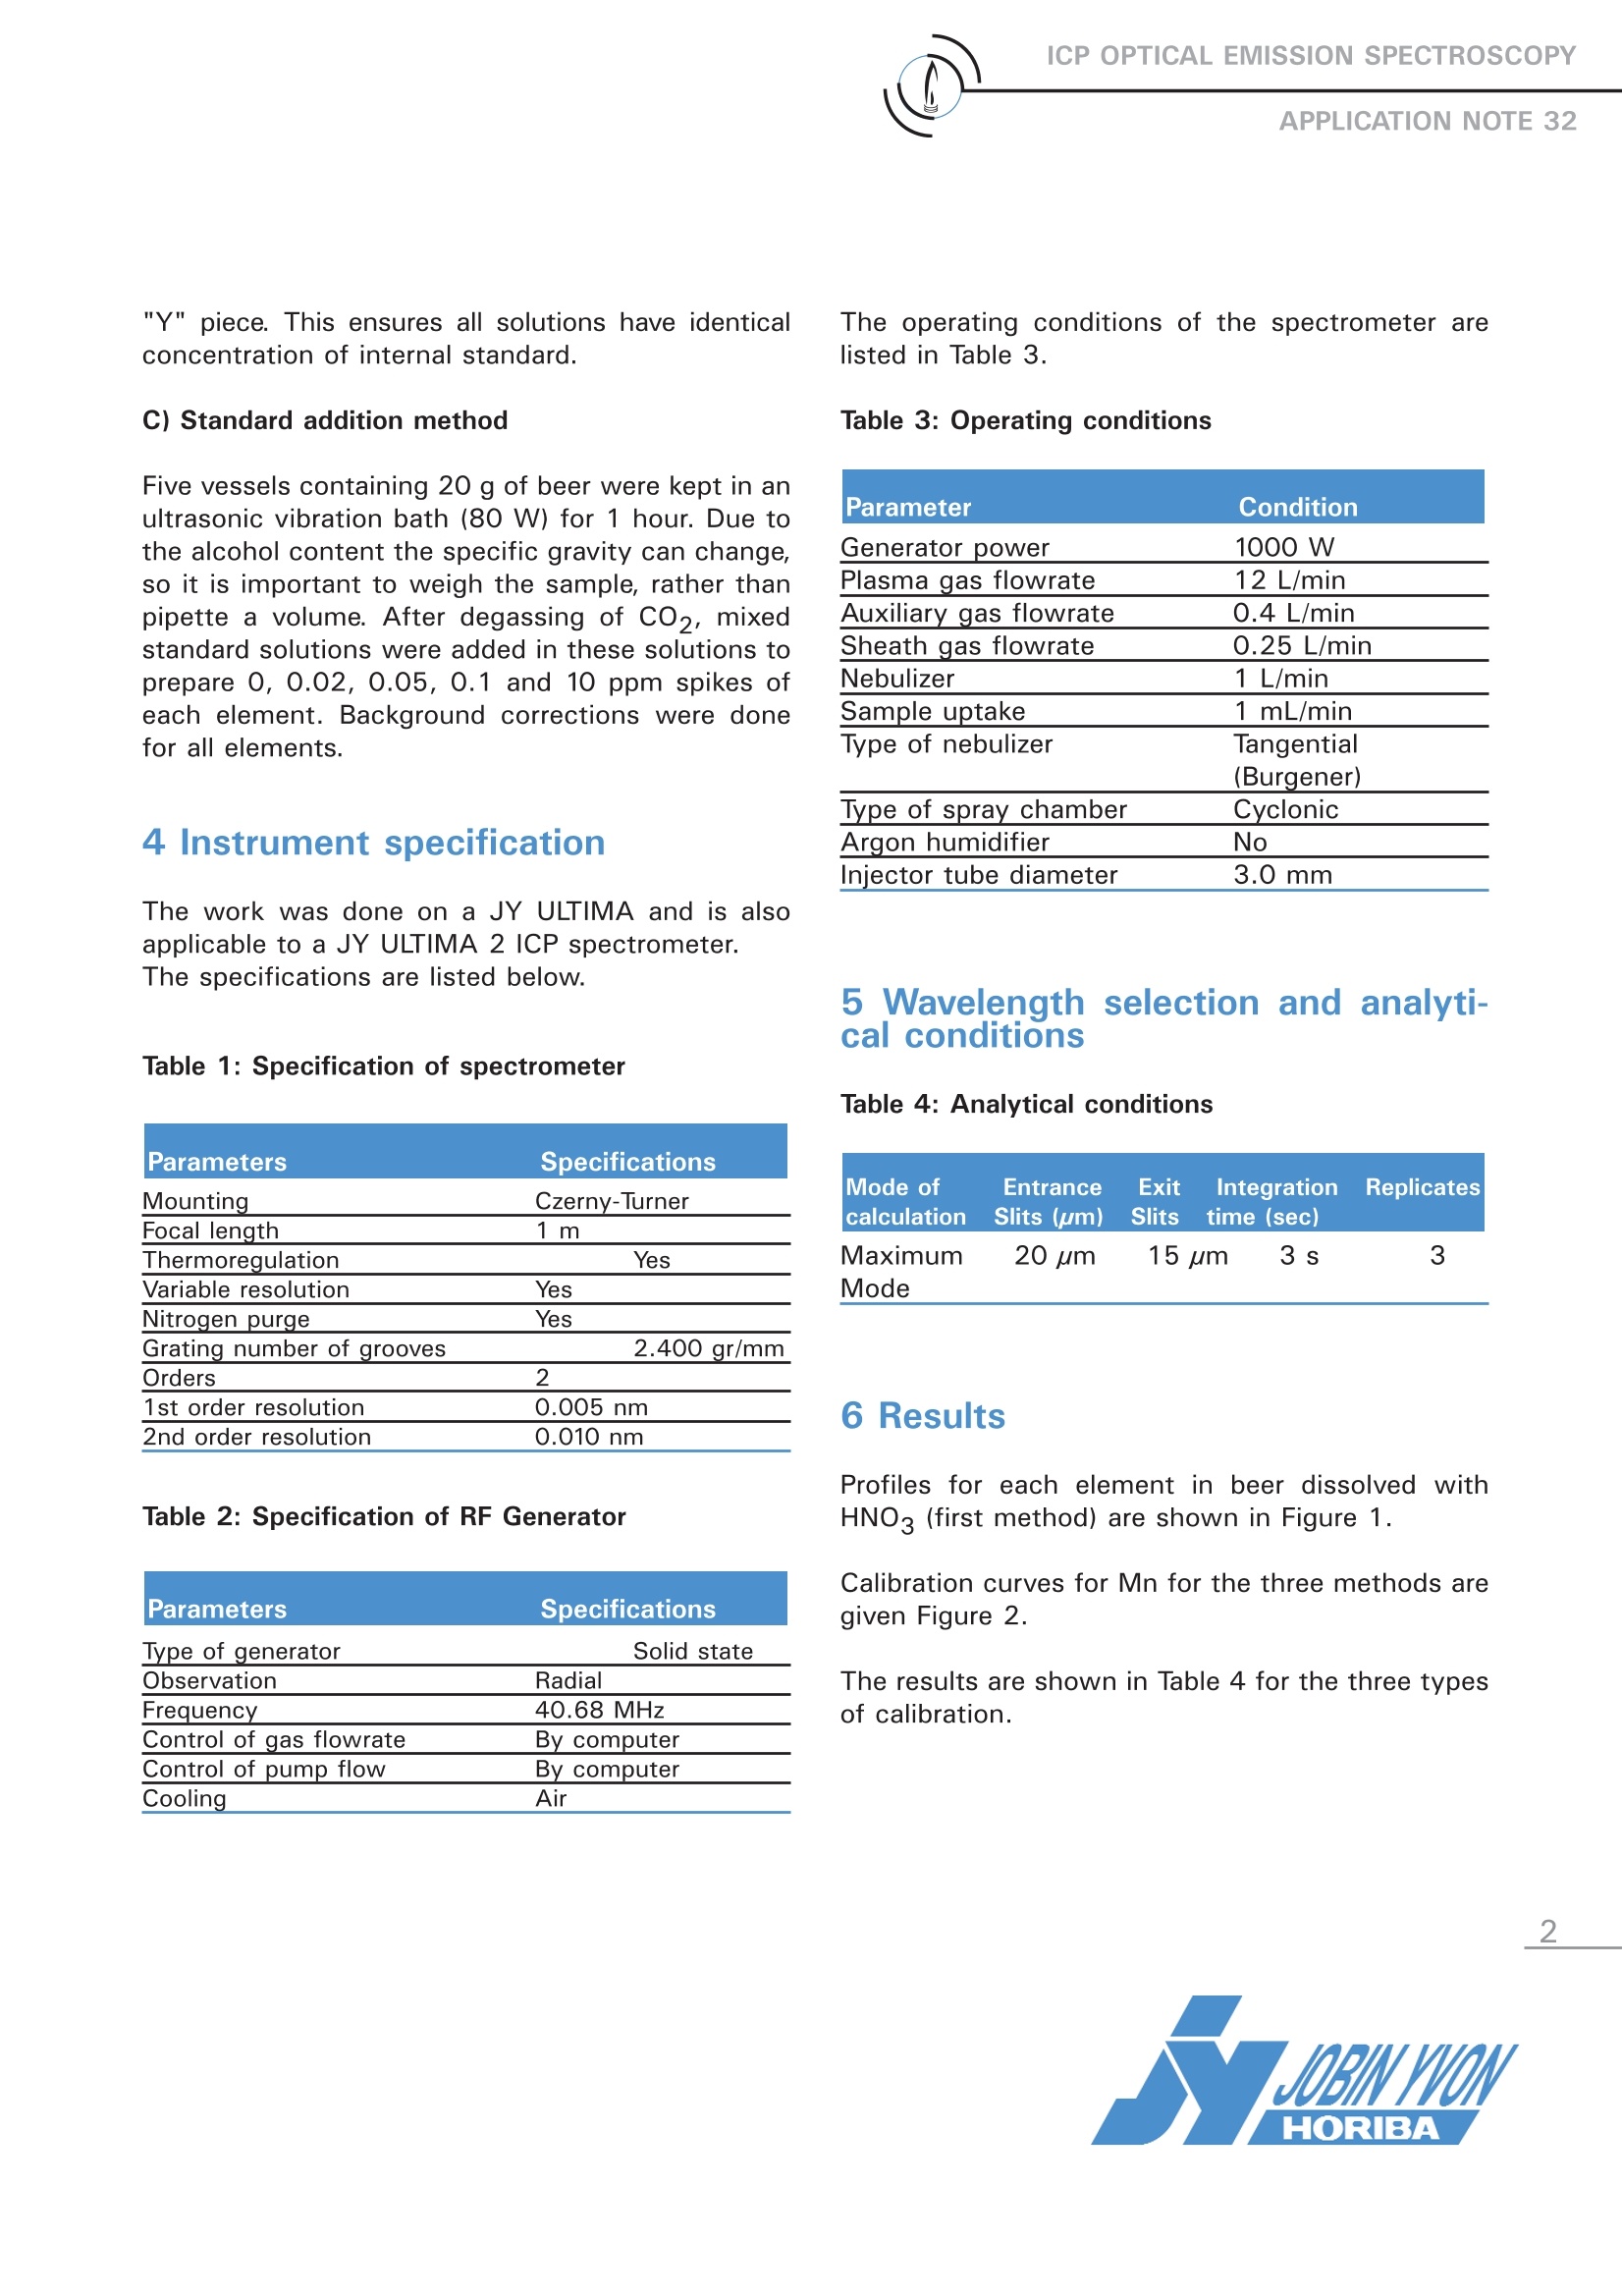
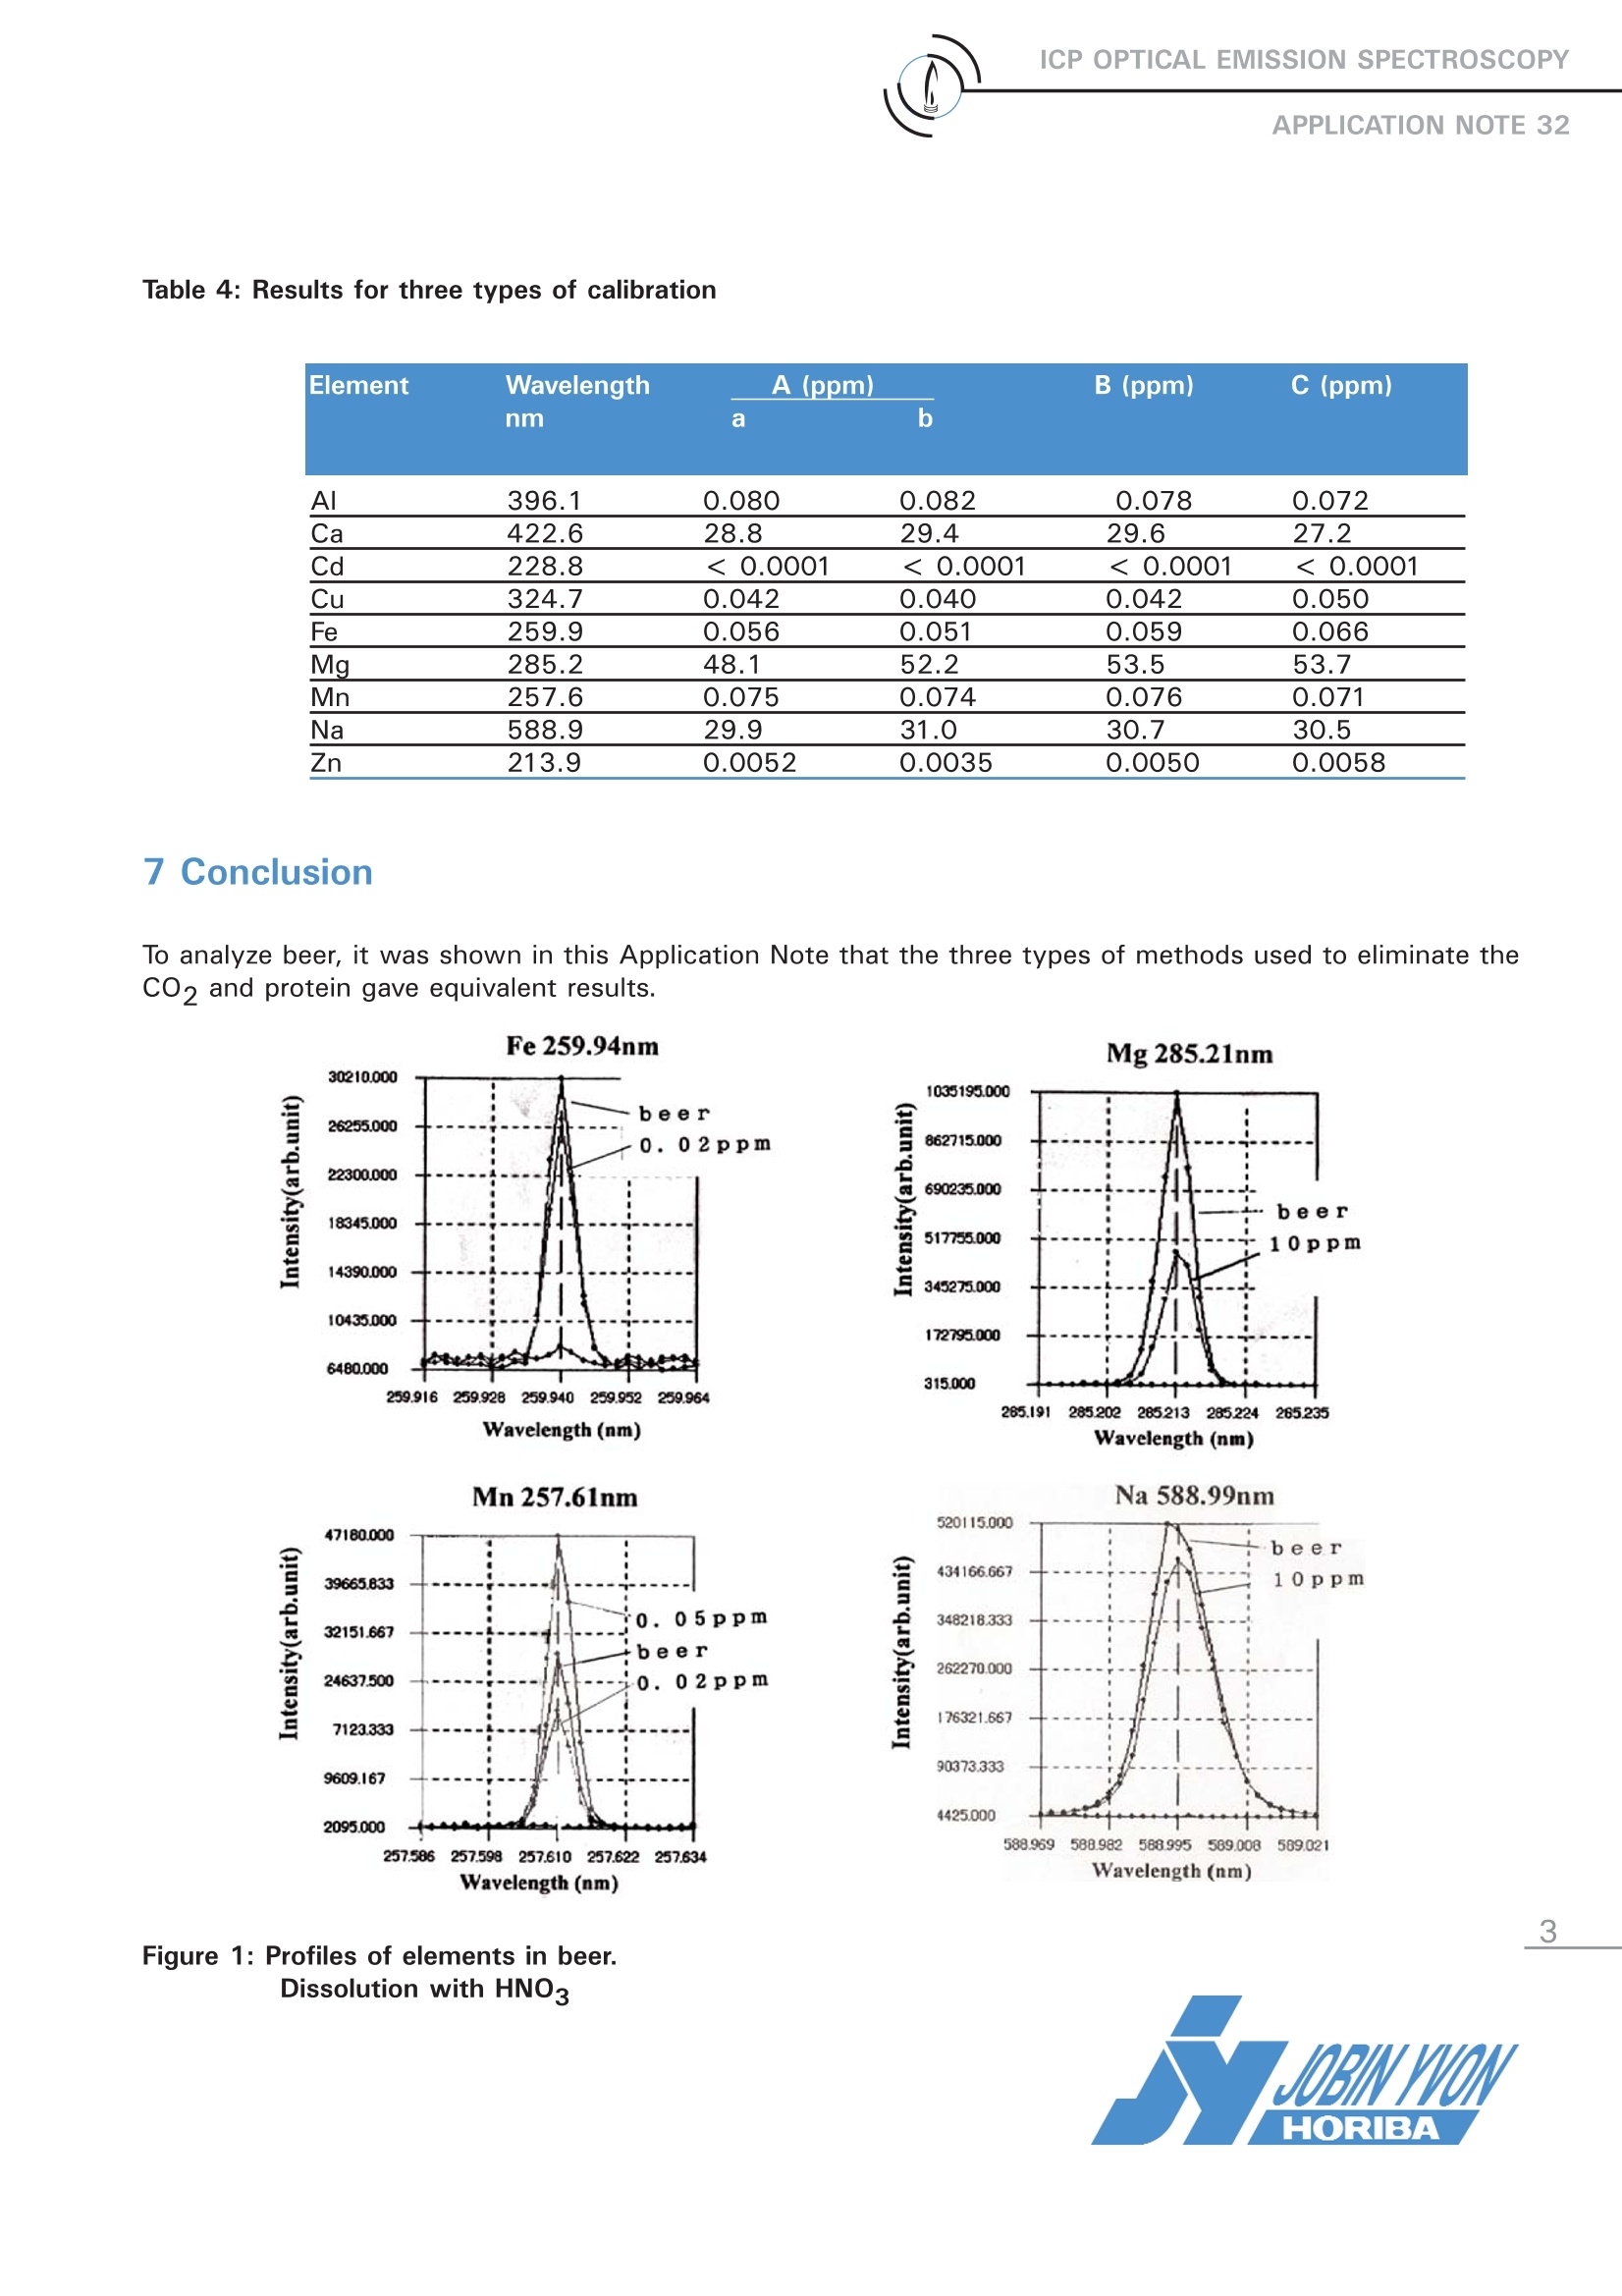
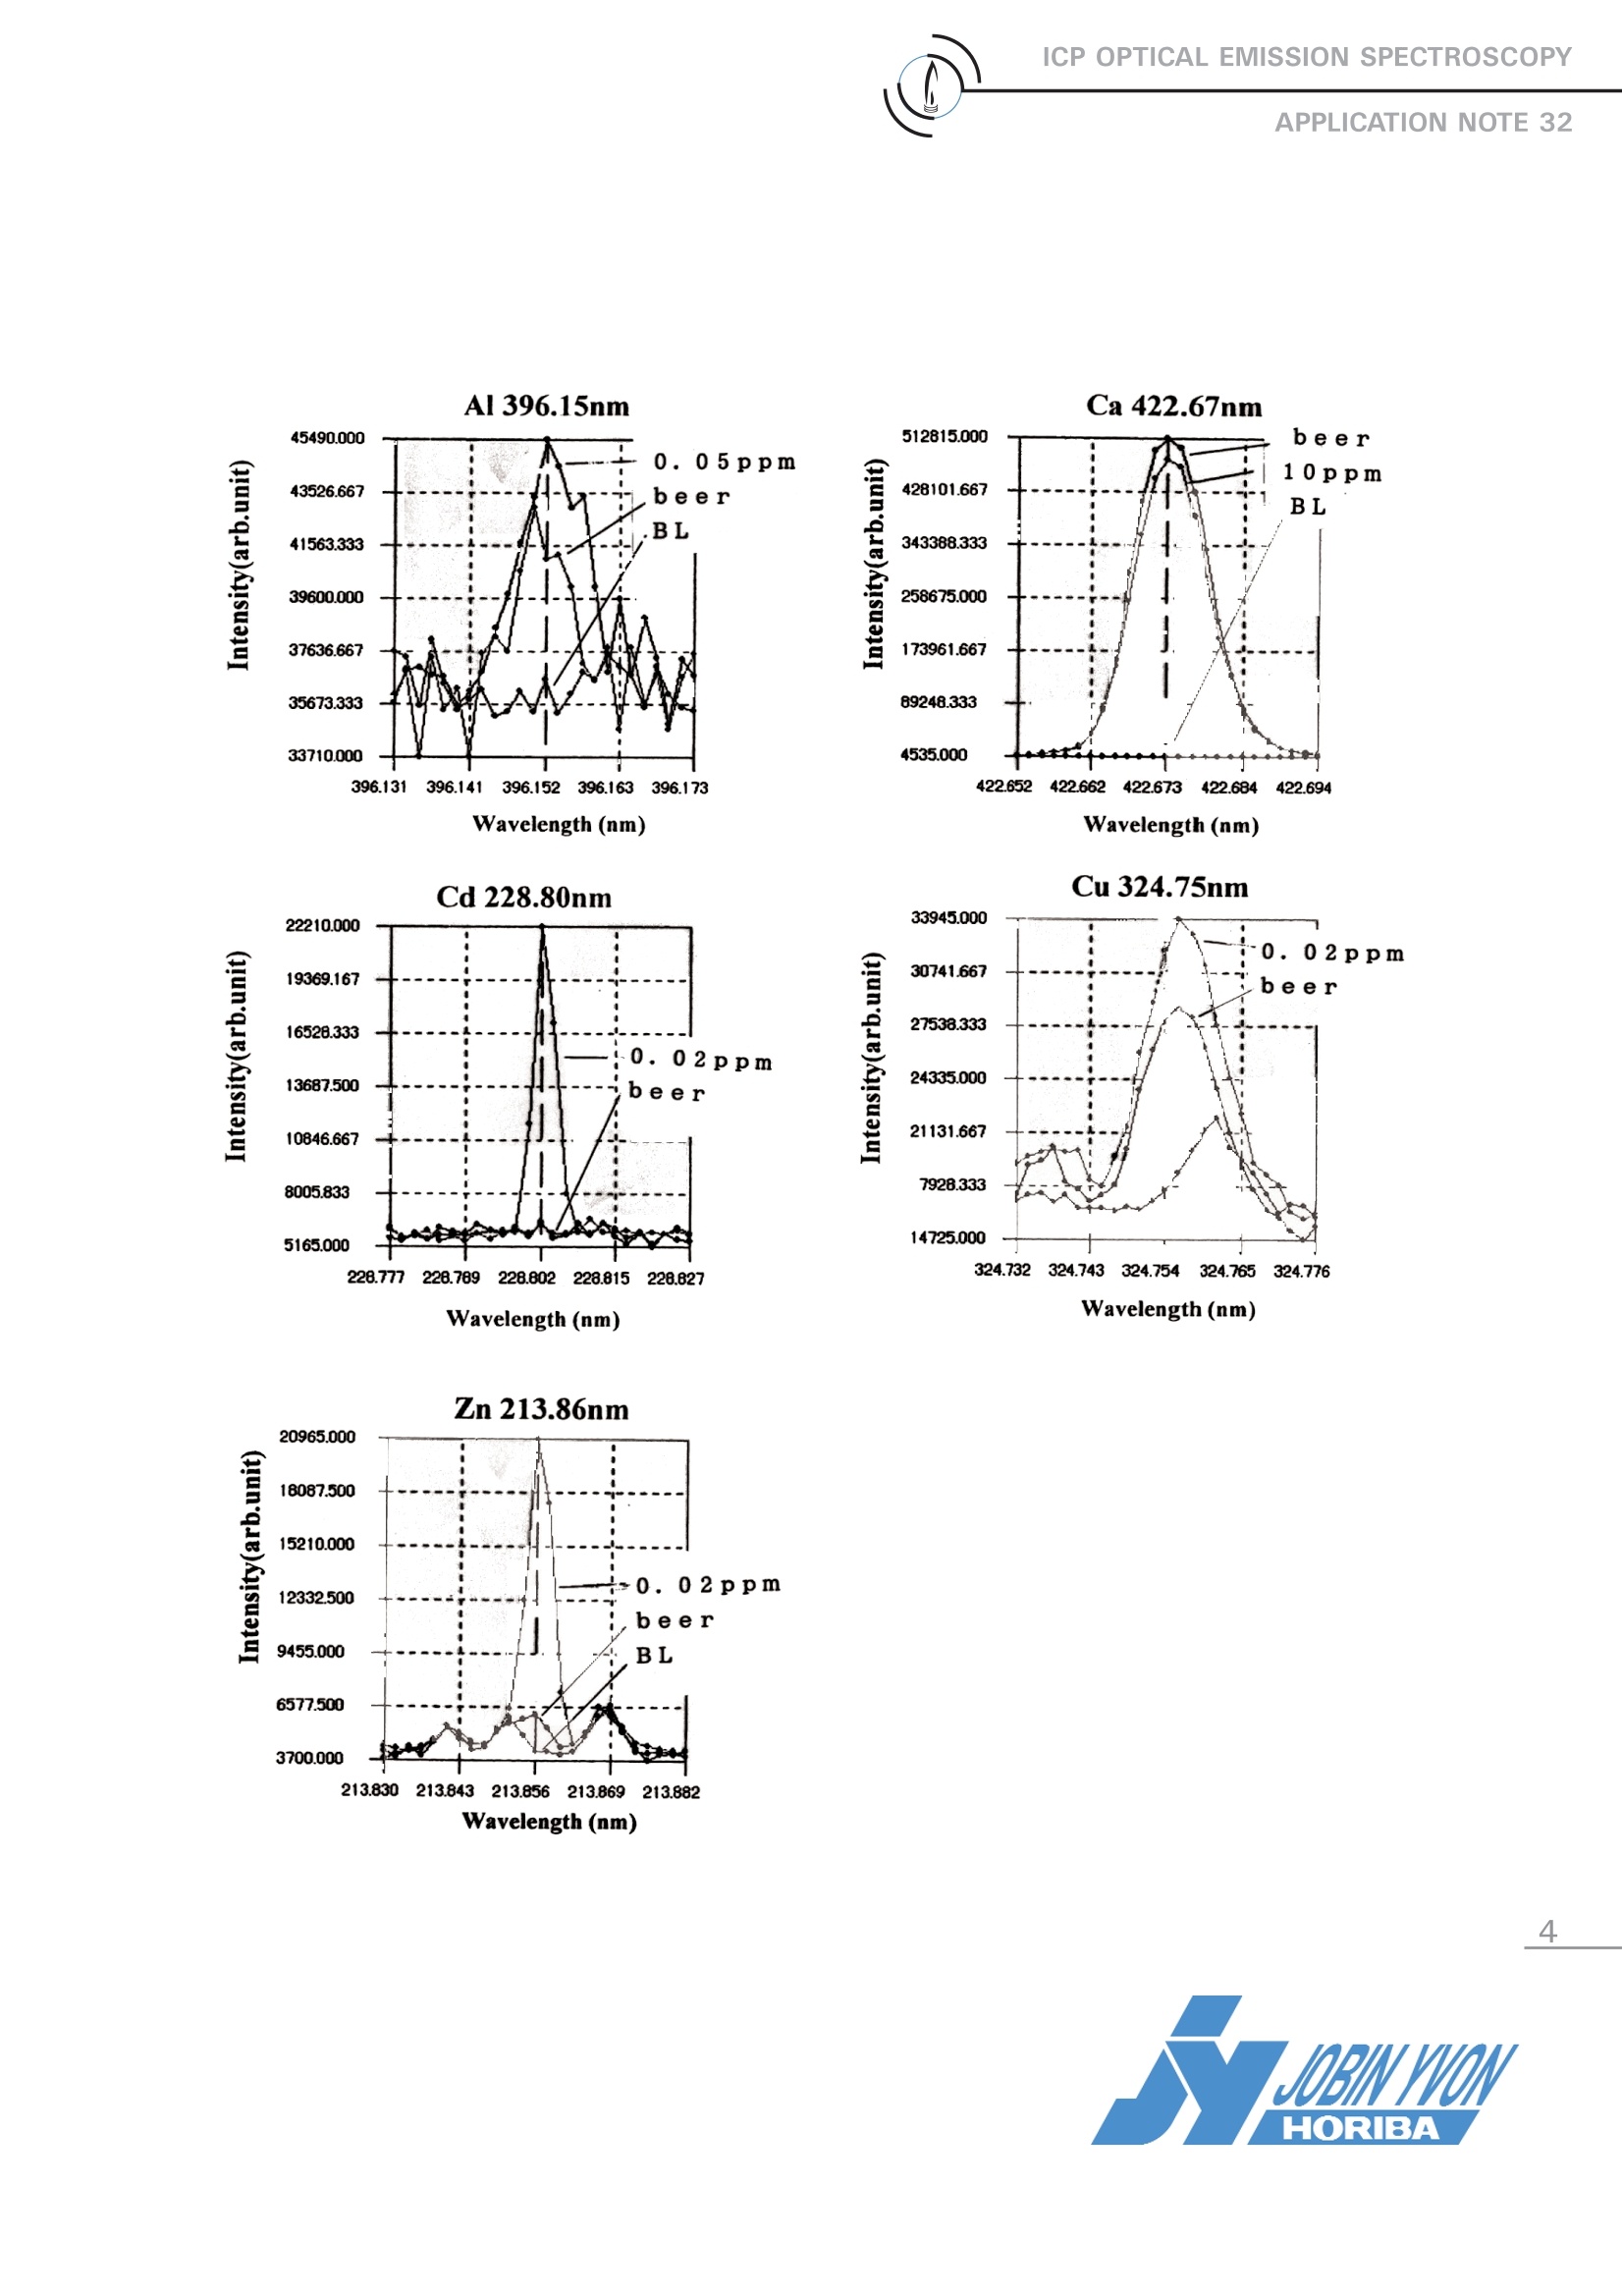
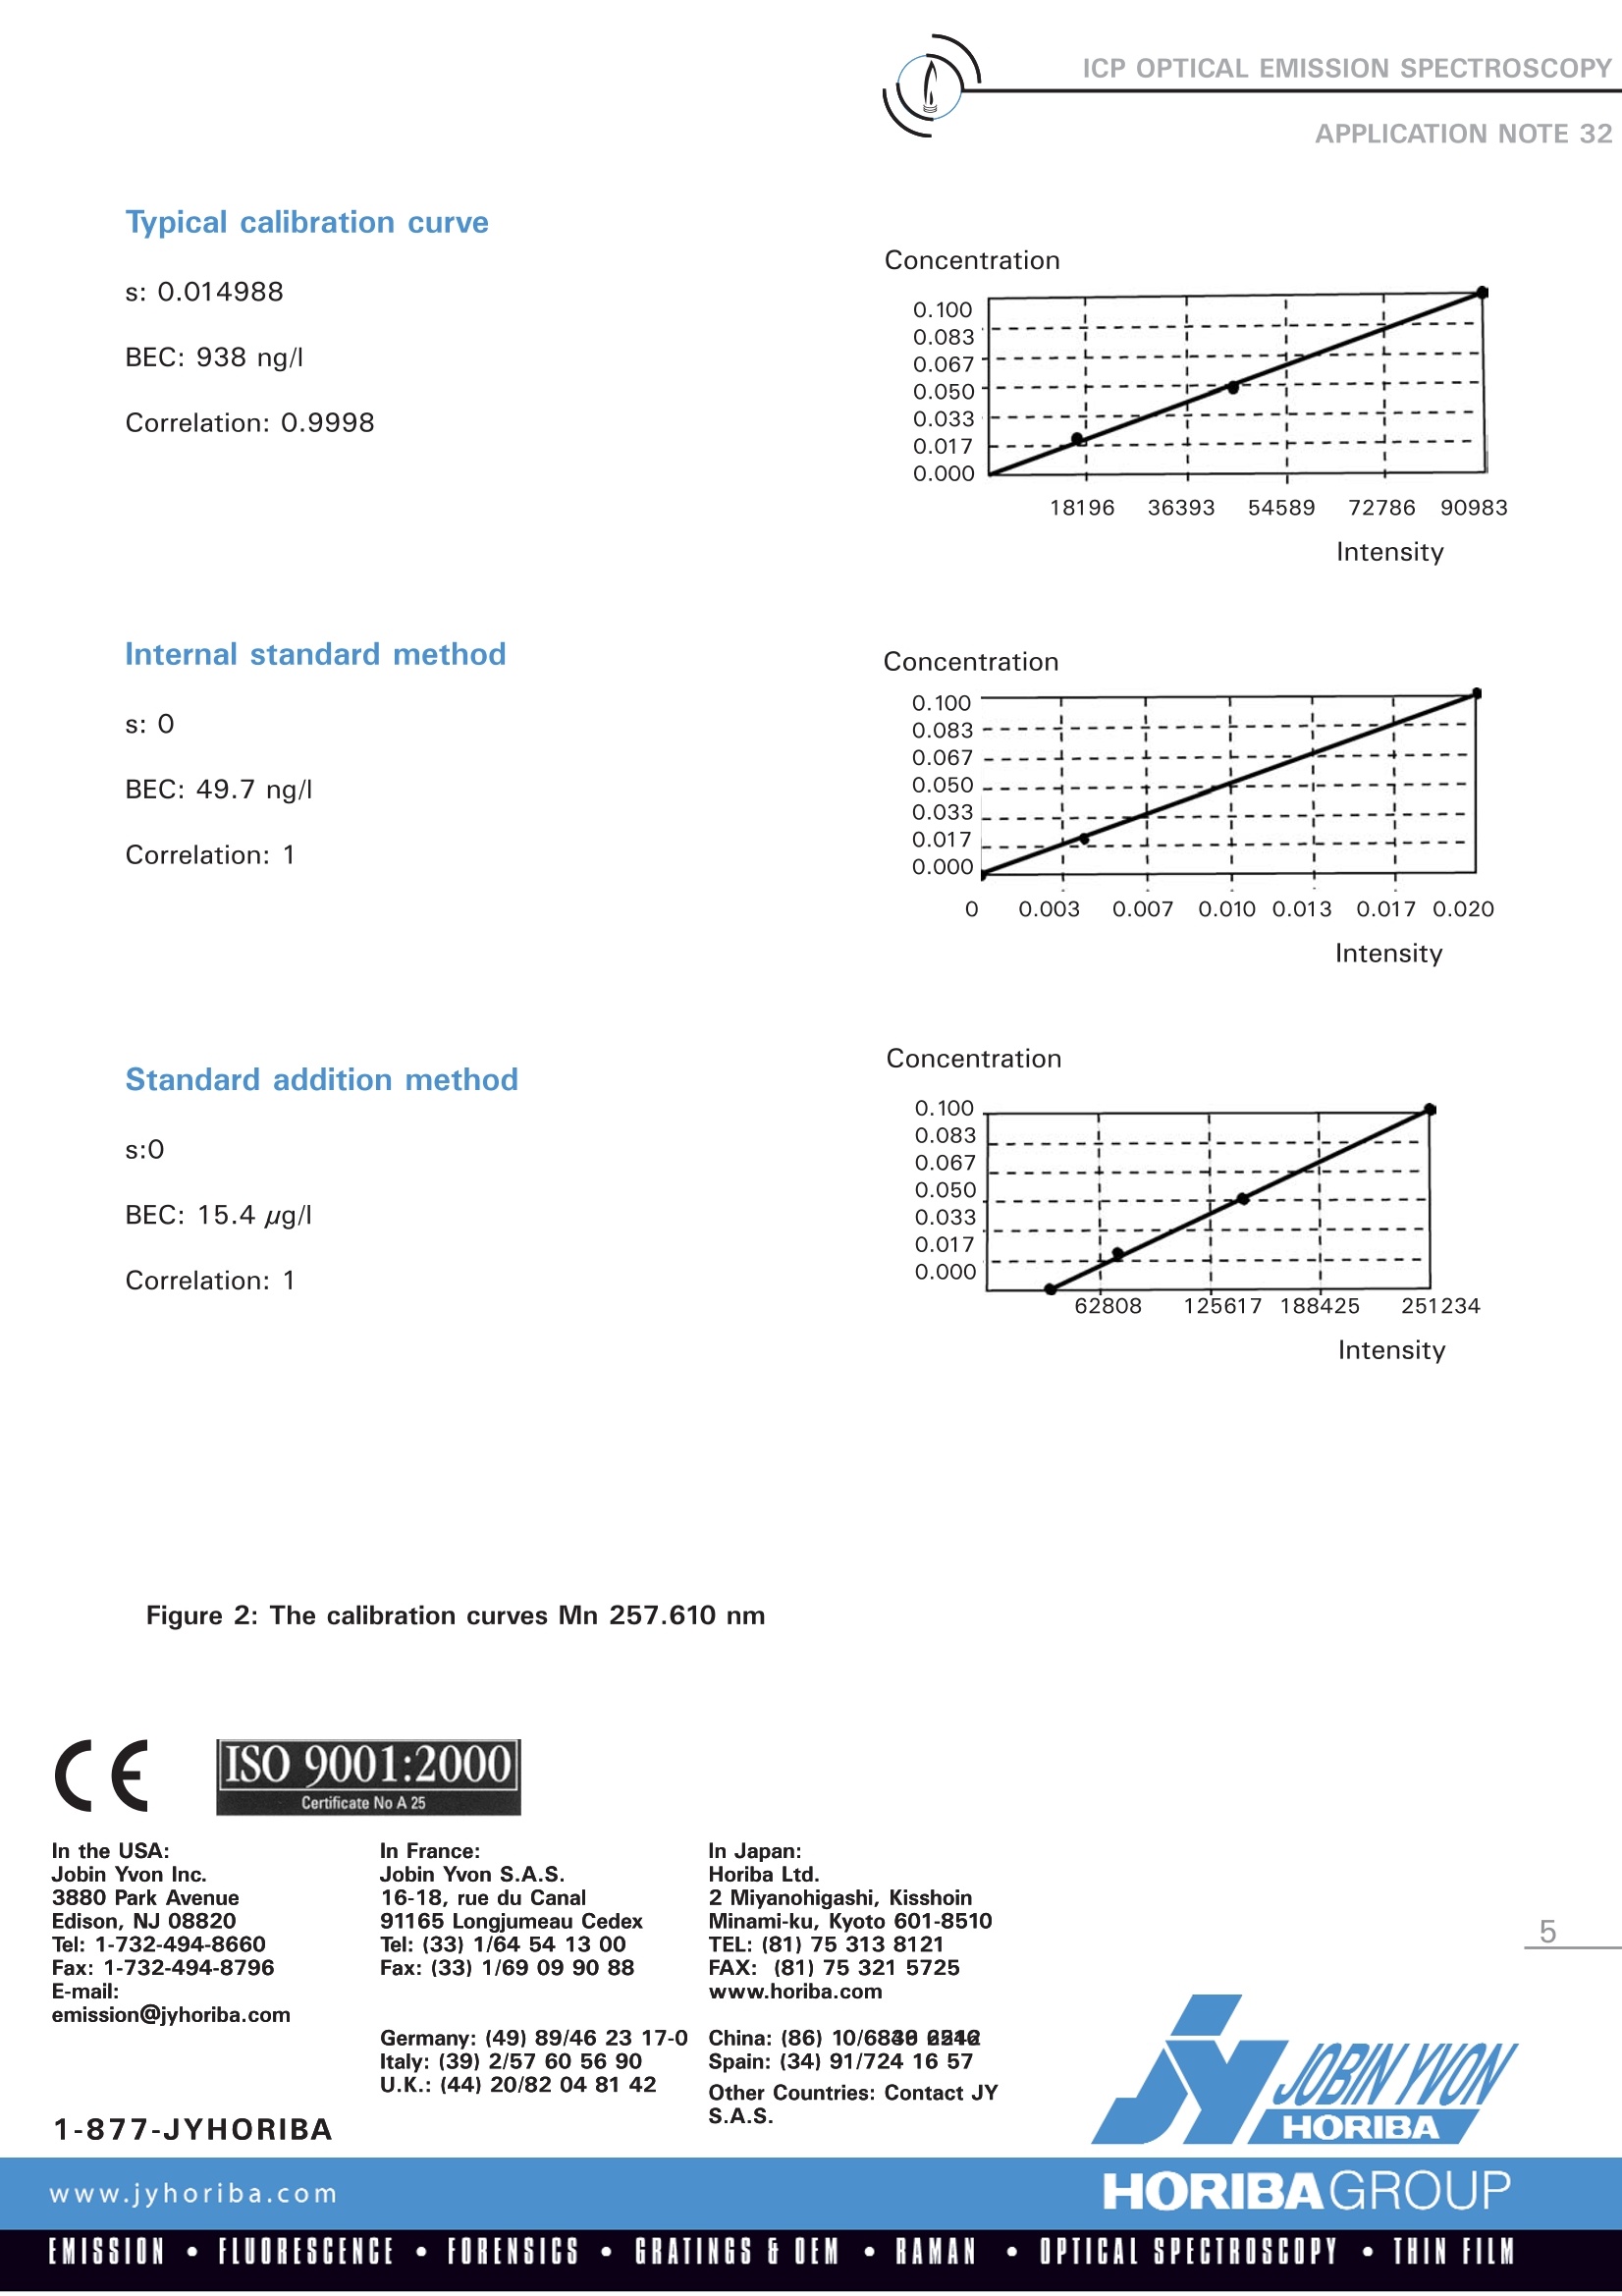
ICP OPTICAL EMISSION SPECTROSCOPYAPPLICATION NOTE 32 .Analysis of Beer H. Daidoji,HORIBA Ltd, Japan Keywords: food, beverage, method developmentElements: Al, Ca, Cd, Cu, Fe, Mg, Mn, Na, Zn 1 Introduction The analysis of beer is important to the breweryindustry, both for production purposes as well asto the final consumer. The analysis can pose sev-eral problems due to both the CO2 gas dissolvedin the beer and the dissolved and undissolvedprotein.ThisrreporttCdemonstrates severalapproaches and compares the results obtained. 2 Principle 2.1 Technique used The elemental analysis of these samples wasundertaken by Inductively Coupled PlPalasmaOptical Emission Spectrometry (ICP-OES). Thesample is nebulized then transferred to an argonplasma. It is decomposed, atomized and ionizedwhereby the atoms and ions are excited. Wemeasure the intensity of the light emitted whenthe atoms or ions return to lower levels of ener-gy. Each element emits light at characteristicwavelengths and these lines can be used forquantitative analysis after a calibration. 2.2 Wavelength choice The choice of the wavelength in a given matrixcan be made using the profile function, or byusing "Win-Image", which is rapid semi-quantita-tive analysis mode using multiple wavelengths.The principle is the same in either case: recordthe scans of analytes at low concentration, andof the matrix. By superimposing the spectra, wesee possible interferences 3 Sample Preparation The analysis of beer is affected by CO2 andorganic materials such as protein. The CO2 must be degassed, otherwise CO, breaks out of solu-tion during the pumping stage and nebulization.There are several methods to achieve this includ-ing bubbling N2 into the solution, ultrasonicvibration and heating. We tried three methods for the analysis. A) Typical calibration curve B) Internal standard method C) Standard addition method A) Typical calibration curve To each 20 g or 40 g sample of beer, about 5 mlof concentrated HNO3 was added to dissolveorganic materials. It was heated at 80 °C for 3minutes.The action of HNO3 and heat is todegas the CO2. Distilled water was added to a totalvolume of 50 mL. The standards for the calibration, for all ele-ments, were made from Spex Certiprep Mix stan-dard solutions. B) Internal standard method A vessel containing 20 g of beer was kept in anultrasonic vibration bath (80W) for 111hour todegas the CO2 in the beer. Due to the alcoholcontent the specific gravity can change, so it isimportant to weigh the sample, rather thanpipettee a volume. Then, 5 ppm Yttrium wasadded as an internal standard element in thissolution and distilled water was added to make atotal weight of 50 g. The standards for calibra-tion curves, for each element, was made fromSpex Certiprep Mix standard solutions and 5 ppmYttrium was added at the same concentrationsas the samples. An alternative to adding the Y tothe samples directly is to introduce 5ppm using a "Y" piece. This ensures all solutions have identicalconcentration of internal standard. C) Standard addition method Five vessels containing 20 g of beer were kept in anultrasonic vibration bath (80 W) for 1 hour. Due tothe alcohol content the specific gravity can change,so it is important to weigh the sample, rather thanpipette a volume. After degassing of CO2, mixedstandard solutions were added in these solutions toprepare 0, 0.02,0.05,0.1 and 10 ppm spikes ofeach element. Background corrections were donefor all elements. 4 Instrument specification The work was done on a JY ULTIMA and is alsoapplicable to a JY ULTIMA 2 ICP spectrometer.The specifications are listed below. Table 1: Specification of spectrometer Parameters Specifications Mounting Czerny-Turner Focal length 1 m Thermoregulation Yes Variable resolution Yes Nitrogen purge Yes Grating number of grooves 2.400 gr/mm Orders 2 1st order resolution 0.005 nm 2nd order resolution 0.010 nm Table 2: Specification of RF Generator Parameters Specifications Type of generator Solid state Observation Radial Frequency 40.68 MHz Control of gas flowrate By computer Control of pump flow By computer Cooling Air The operating conditions of the spectrometer arelisted in Table 3. Table 3: Operating conditions Parameter Condition Generator power 1000 W Plasma gas flowrate 12 L/min Auxiliary gas flowrate 0.4 L/min Sheath gas flowrate 0.25 L/min Nebulizer 1 L/min Sample uptake 1 mL/min Type of nebulizer Tangential (Burgener) Type of spray chamber Cyclonic Argon humidifier No Injector tube diameter 3.0 mm 5 Wavelength selection and analyti-cal conditions Table 4: Analytical conditions Mode of Entrance Exit Integration Replicates calculation Slits (um) Slits time (sec) Maximum 20 um 15 um 3s 3 Mode 6 Results Profiles for each element in beer dissolved withHNO3 (first method) are shown in Figure 1. Calibration curves for Mn for the three methods aregiven Figure 2. The results are shown in Table 4 for the three typesof calibration. Table 4: Results for three types of calibration Element Wavelength nm a A (ppm) b B (ppm) C (ppm) Al 396.1 0.080 0.082 0.078 0.072 Ca 422.6 28.8 29.4 29.6 27.2 Cd 228.8 <0.0001 <0.0001 <0.0001 <0.0001 Cu 324.7 0.042 0.040 0.042 0.050 Fe 259.9 0.056 0.051 0.059 0.066 Mg 285.2 48.1 52.2 53.5 53.7 Mn 257.6 0.075 0.074 0.076 0.071 Na 588.9 29.9 31.0 30.7 30.5 Zn 213.9 0.0052 0.0035 0.0050 0.0058 To analyze beer, it was shown in this Application Note that the three types of methods used to eliminate theCO, and protein gave equivalent results. Figure 1: Profiles of elements in beer.Dissolution with HNO。 Al396.15nm 45490.000 0.05ppm 43526.667 beer BL 41563.333 39600.000 37636.667 35673.333整 Ca 422.67nm 512815.000 bee r 10ppm 428101.667 BL 343388.333 258675.000 173961.667 89248.333 4535.000 章 艹 422.652 422.662 422.673422.68444242.694 Wavelength (nm) Cu 324.75nm Wavelength (nm) Typical calibration curve Concentration s: 0.014988 BEC: 938 ng/l Correlation: 0.9998 - Intensity Internal standard method Concentration s: 0 BEC: 49.7 ng/I Correlation:1 Intensity Concentration Standard addition method s:0 BEC: 15.4 ug/I Correlation: 1 Intensity Figure 2: The calibration curves Mn 257.610 nm CEISO 9001:2000 www.jyhoriba.com HORIBAGROUP EMISSION·FLUORESCENCE·FORENSICS·GRATINGSGOEM·RAMAN·IPTICAL SPECTROSCOPY·THIN FILM
确定
还剩3页未读,是否继续阅读?

产品配置单

HORIBA(中国)为您提供《酒类中理化分析检测方案 》,该方案主要用于啤酒中重金属检测,参考标准--,《酒类中理化分析检测方案 》用到的仪器有HORIBA Ultima Expert高性能ICP光谱仪
推荐专场
相关方案
更多
该厂商其他方案
更多