


方案详情
文
开发了可检测牛奶中的?-内酰胺抗生素的全自动分析方法, 包括6种青霉素 (阿莫西林, 氨比西林,邻氯青霉素, 双氯青霉素, 苯唑西林和青霉素G) 以及4种头孢霉菌素(头孢唑啉,头孢噻夫,头孢哌酮及头孢氨苄)。 本方法采用了在线固相萃取-液相色谱/电喷雾串联质谱(SPE-LC/ESI-MS-MS)联用系统。采用在线SPE方法,离心后的500微升牛奶中的目标化合物被浓缩在C18 HD小柱上。然后用流动相(水+ 0.1%乙酸 / 甲醇 + 0.1%乙酸)在0.7 mL/min的流速下用梯度方式将目标化合物洗脱下来。采用C12反相分析柱在10分钟内实现色谱分离。 为了准确定性并进行确证,在正离子电喷雾离子化模式下(ESI(+))对每个组分采集两种多反应监测(MRM)跃迁数据。对于牛奶中的所有目标化合物,方法检测限 (LOD)都低于欧盟规定的最大残留水平(MRL)。在牛奶中,定量限在0.09至1.44 ng/mL之间。根据欧盟要求对方法进行了验证,准确度在80至116%之间。采用该方法分析了20个实际牛奶样品。这种新开发的方法具有较高的灵敏度和准确性,只需进行最少的样品预处理,并且首次运用了全自动在线SPE技术,分析通量较高。因此,本方法适用性较好,是食品安全控制部门不可或缺的检验方法。
方案详情

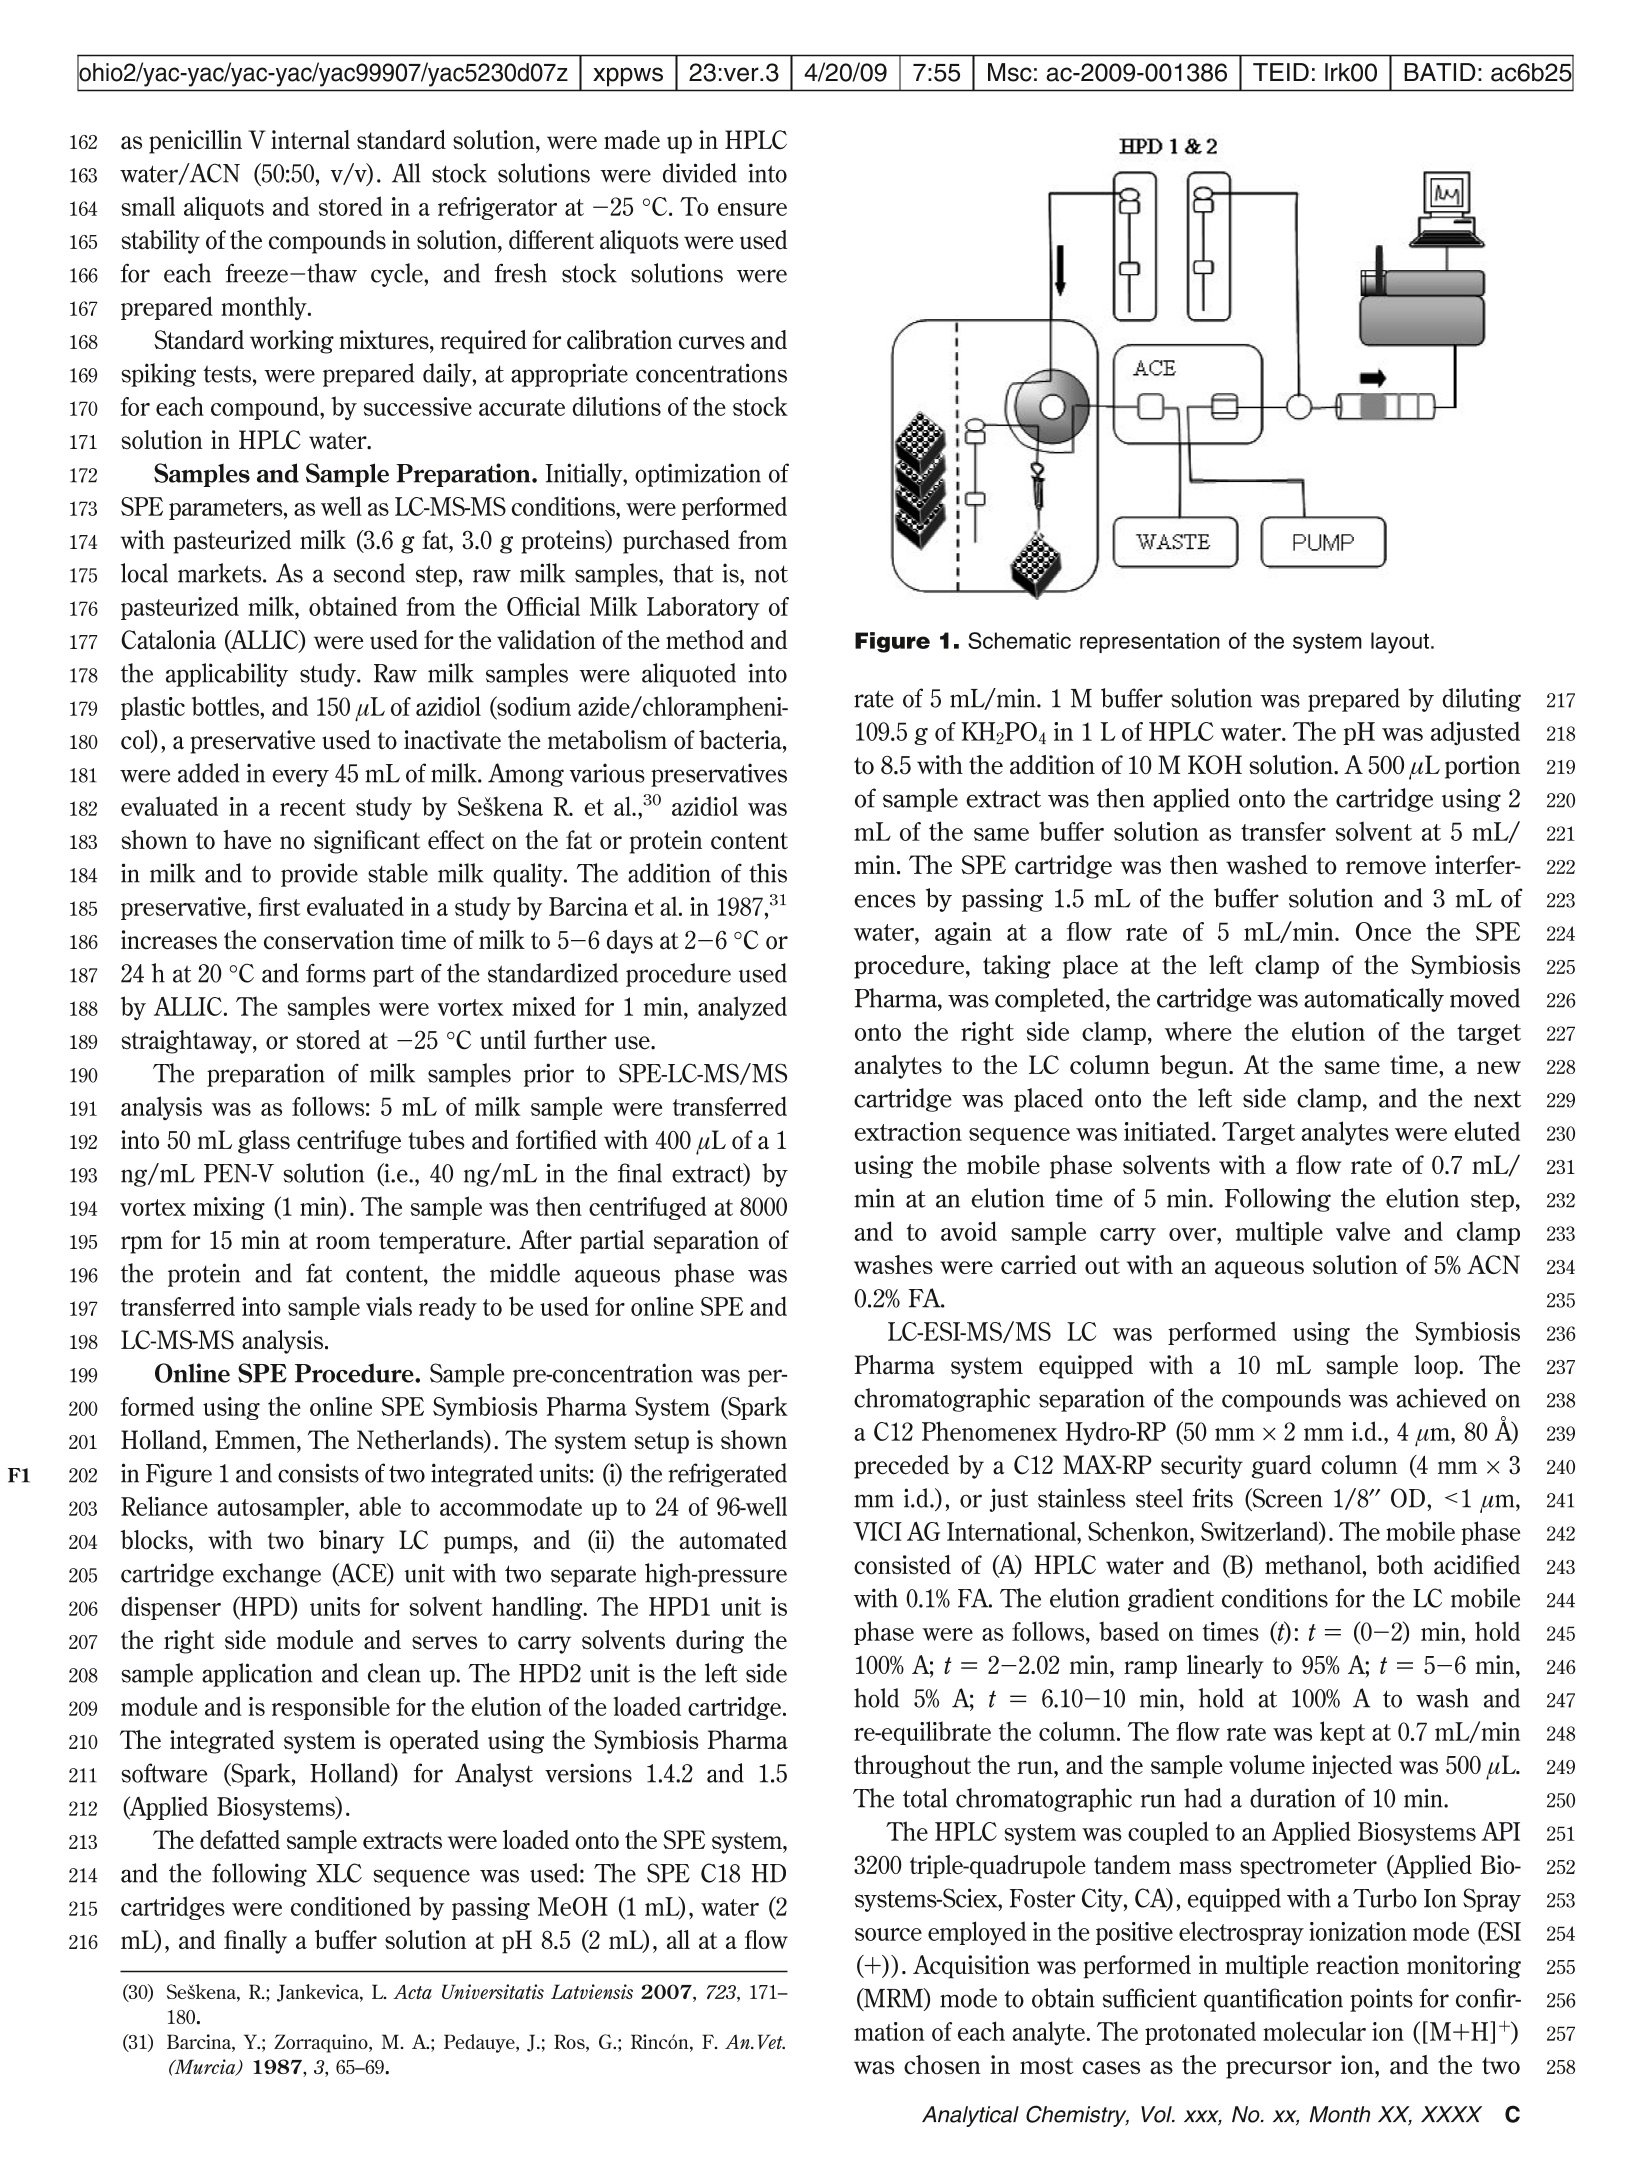
ohio2/yac-yac/yac-yac/yac99907/yac5230d07z xppws 23:ver.3 4/20/09 7:55 Msc: ac-2009-001386 TEID: Irk00BATID: ac6b25|Anal. Chem. XXXX, xxx, 000-000 1 Fully Automated Analysis of B-Lactams in Bovine2 Milk by Online Solid Phase Extraction-Liquid3 Chromatography-Electrospray-Tandem Mass4 Spectrometry 5 Lina Kantiani,t Marinella Farre,t Martin Sibum,* Cristina Postigo,t Miren López de Alda,t and6 Damia Barcel6*,t,s 7 Department of Environmental Chemistry, IDAEA-CSIC, c/Jordi Girona 18-26, 08034, Barcelona, Spain, Spark Holland8 B.V., P.O. Box 388, 7800 AJ Emmen, The Netherlands, and Catalan Institute for Water Research (ICRA), Parc9 Cientific i Tecnologic de la Universitat de Girona, Edifici Jaume Casademont, Porta A, Planta 1-Despatx 13C/ Pic de 10 Peguera, 15, E-17003 Girona, Spain 11 A fully automated method for the detection of B-lactam 12 antibiotics, including six penicillins (amoxicillin, ampi-13 cillin,cloxacillin, dicloxacillin, oxacillin, and penicillin G)14 and four cephalosporins (cefazolin, ceftiofur, cefopera-15 zone, and cefalexin) in bovine milk samples has been16 developed. The outlined method is based on online solid-17 phase extraction-liquid chromatography/electrospray-18 tandem mass spectrometry (SPE-LC/ESI-MS-MS). Target19 compounds were concentrated from 500 uL of centrifuged20 milk samples using an online SPE procedure with C1821 HD cartridges. Target analytes were eluted with a gradient22 mobile phase (water + 0.1% acetic acid/methanol +0.1%23 acetic acid) at a flow rate of 0.7 mL/min. Chromato-24 graphic separation was achieved within 10 min using a25 C-12 reversed phase analytical column. For unequivocal26 identification and confirmation, two multiple reaction27 monitoring (MRM) transitions were acquired for each28 analyte in the positive electrospray ionization mode29 (ESI(+)). Method limits of detection (LODs) in milk were30 well below the maximum residue limits (MRLs) set by the31 European Union for all compounds. Limits of quantifica-32 tion in milk were between 0.09 ng/mL and 1.44 ng/mL.33 The developed method was validated according to EU’s34 requirements, and accuracy results ranged from 80 to35 116%. Finally, the method was applied to the analysis of36 twenty real samples previously screened by the inhibition37 of microbial growth test Eclipse 100. This new developed38 method offers high sensitivity and accuracy of results,39 minimum sample pre-treatment, and uses for the first40 time an automated online SPE offering a high throughput41 analysis. Because of all these characteristics, the pro-42 posed method is applicable and could be deemed neces- 43 sary within the field of food control and safety. 44 Beta-lactam antibiotics, which consist of penicillins and cepha-45 losporins, form one of the oldest and most important groups of ( * To whom c o rrespondence should be addressed.E-mail: dbcqam@cid.csic.es. ) ( T D epartment o f Environmental Chemistry, I DAEA-CSIC. ) ( + Spark Holland B.V. ) ( S Catalan I nstitute for Water Research (ICRA). ) antibiotics. They are widely used in veterinary medicine to treat46and/or prevent bacterial infections and diseases, such as bovine47mastitis, pneumonia, bacterial diarrhea, and bacterial arthritis,1 48or as supplements that are provided illegally to promote growth 49in food-producing animals. 50 Antibiotic residues in foods are of concern as they present51potential health risks because of possible allergic reactions,552carcinogenicity, and promotion of the spread ofbacterial resistance553to antibiotics used in human medicine.A high number of studies54reported cases of allergic reaction in humans upon consumption55of contaminated food.3-6 In addition, the whole fermentation56process in the production of cultured dairy products, for example,57yogurt, is disturbed and can be adversely affected by traces of58antibiotics in raw milk. This may result in considerable economic59loss as product batches may be downgraded or discarded.60Producers are required to offer an antibiotic free product and are61responsible to ensure illegal antibiotic residues are prevented. 62 To reduce human exposure to p-lactam antibiotics, tolerance63levels have been established by regulatory agencies for antibiotics64that are approved to be used in food-producing animals. The665European Union [2002/657/CE and amendments]has set specific666maximum residue limits (MRLs) for each of these substances to67protect human health. The presence of antibiotics in animal68products can lead to heavy penalties being imposed on producers.69In 2002, it is estimated that one tank in a thousand has an antibiotic70failure in England. 71 (1) Goto, T.; Ito, Y.; Yamada, S.; Matsumoto, H.; Oka, H. J. Chromatogr. A 2005,1100,193-199. ( ( 2) B ogialli, S .; Capitolino, V.; C urini, R.; Di C orcia,A.; Nazzari, M.; Sergi, M.J. Agric. Food Che m .2004,52,3286-3291. ) (3) Dayan, A. D. Vet. Microbiol. 1993,35, 213-226. ( (4) Tsujikawa, K.; Kuwayama, K.;Miyaguchi, H.; Kanamori, T.; Iwata,Y.; Inoue, H .; Kishi, T. J. Forensic Sci . 2008, 5 3, 2 26-231. ) ( (5) S Schwartz, H. J; S her, T . H . Ann. Allergy 1984, 5 2 . ) ( (6) S undlof, S . F .; Cooper, J . V eterinary drug residues: Human health risks a ssociated with drug residues in animal derived foods; American Chemical S ociety: Washington, D C, 1996. ) (7)G(runwald, L.; Petz, M. Anal. Chim. Acta 2003,483,73-79. ( (8) I mplementing Council Directive 96/23/EC c o ncerning t h e performance o f analytical methods and t he interpretation of result s (2002/657/EC and a mendments) Off. J. Eur. Commun. 2002, L2218. ) ( (9) E dmondson, P. Avoiding antibiotic re s idues in mi l k, 2002, ht t p://www. m ilkproduction.com ( accessed during August 2008). ) ( Analytical Chemistry, Vol . xxx, No. x x , Month XX, XXXX A ) ohio2/yac-yac/yac-yac/yac99907/yac5230d07z xppws 23:ver.3 4/20/09 7:55 Msc: ac-2009-001386 TEID: Irk00 BATID:ac6b25 72 The most commonly used antibiotics in food animals can be73 grouped into five major classes. These include the beta-lactams74 (B-lactams) (e.g., penicillins and cephalosporins), tetracyclines75 (e.g., oxytetracycline, tetracycline, and chlortetracycline), ami-76 noglycosides (e.g., streptomycin and gentamicin), macrolides (e.g.,77 erythromycin), and sulfonamides (e.g., sulfamethazine). In this78 study, we have dealt with the analysis of six penicillins and four79 cephalosporins in milk, compounds that are currently used most80 in food producing animals in Europe, and for which certain81 limitations on veterinary usage have been placed. The basic82 structure of penicillins consists of a B-lactam ring attached to a83 five-membered thiazolidine ring and a side chain, whereas that84 of cephalosporins has a six-membered dihydrothiazine ring85 attached to the B-lactam ring. 86 87 88 For the compounds included in this study the EU set MRLs inmilk-based matrixes are the following: Amoxicillin (AMO) -4 ng/mL,Ampicillin (AMP)- 4 ng/mL, Penicillin G (PEN-G) -4 ng/mL, Oxacillin (OXA) - 30 ng/mL, Cloxacillin (CLO) - 30 ng/mL,Dicloxacillin (DICLO) - 30 ng/mL, Cefoperazone (CEFOP) - 50ng/mL, Cefazolin (CEFAZ) - 50 ng/mL, Cefalexin (CEFAL)- 100ng/mL, and Ceftiofur (CEFT) - 100 ng/mL. Molecular structure,CAS number, molecular weight, and physical properties for the targetanalytes are provided in the Supporting Information, Table 1. 89 90 91 92 93 94 95 Various screening methods using rapid test kits are being96 regularly employed to control chemical residues in milk. Recent97 developments include optical biosensors using surface plasmon98 resonance (SPR) and microplate assays based on the penicillin-99 binding protein PBP 2x*.10-12 However, although these tests have100a wide range of selectivity, which can give evidence of one or101more groups of antibiotics in a milk sample, they do not provide102high specificity, which results in semiquantitative measurements103and can also lead to false positive results. For this reason, sensitive104and reliable analytical methods have been developed mainly105employing liquid chromatography coupled to mass spectrometry106(LC-MS) or tandem MS (LC-MS-MS) following a pre-concentration 107step, usually achieved by solid-phase extraction (SPE). 108 To the present many single-analyte and multiresidue methods 109have been developed for the extraction and detection of one or110more B-lactam compounds in milk and animal tissues and111kidney.1,2,13-21 Although limits of detection presented in these112studies are below the set MRLs, the chromatographic runs are 113usually long leading to low sample throughput. To our knowledge, 114all existing methods employ manual sample preparation, extrac- 115 tion, and pre-concentration, usually a lengthy and laborious ( (10) C acciatore, G.; Petz, M.;Rachid, S.; Hakenbeck,R.; B ergwerff, A. A. Anal. Chim. Acta 2004,520, 105-115. ) ( (11) G ustavsson, E.; S ternesjo, A. J . AOAC Int. 2004, 87, 614-620. ) ( (12) Lamar,J; Petz, M. Anal . Chim. Act a 2007,586,296-303. ) ( (13) H olstege, D. M . ; P u schner, B.; Whitehead, G.; Ga l ey, F. D. J. Agric. F o odChem. 2002,50, 406-411. ) ( (14) Becker, M.; Z i ttlau, E.; Petz, M. Anal. Chim. A cta 2 004,520, 19- 3 2. ) (15) Bruno, F.; Curini, R.; Di Corcia, A.; Nazzari, M.; Samperi, R. J. Agric. FoodChem. 2001,49,3463-3470. ( (16) Riediker, S.; Diserens, J . M.; Stadler, R . H. J. Agric. Food Chem.2001,49,4171-4176. ) ( (17) Daeseleire, E.; De Ruyck, H.; Van Renterghem, R. Rapid Commun. MassSpectrom. 2000, 14,1404-1409. ) ( (18 ) T urnipseed, S . B .; Andersen, W . C .; Karbiwnyk, C. M .; Madson, M. R. ; M iller, K. E. Rapid Commun. Mass Spectrom. 2008, 22,1467-1480. ) (19) Fagerquist, C. K.; Lightfield, A. R.; Lehotay, S. J. Anal. Chem. 2005, 77,1473-1482. ( (20) M astovska, K . ; L ightfield, A. R. J. Chromatogr. A2008, 1 2 02,11 8 -123. ) ( (21) Msagati, T. A. M.; Nindi,M. M . Food Chem. 2007, 100,836-844. ) ( B Analytical Chemistry, Vol . xxx, No. x x , Month XX, XXXX ) procedure, or dispersive SPE cleanup, a somewhat simplified and116speeded up sample preparation, 19,20 or supported liquid membrane117for sample purification and enrichment, which reduces the cost118of analysis.Recent reviews have included this particular group119of antibiotics and their detection in animal-derived products.22-26 120 In the last years, fully automated extraction methods have beengaining attention for the detection and quantification of emergingpollutants and B-lactams in environmental samples and plasma.27-29The main advantages of online SPE methods are the significantreduction in preparation time resulting in higher sample through-put and the small sample volume requirements needed for highsensitivity and accuracy. In the case of B-lactam antibiotics, ananalytical method with an online SPE procedure and a shortchromatographic elution time is crucial to avoid potential degrada-tion of the compounds under study in the milk matrix. Followingthis need for fast and reliable analytical methods, the mainobjectives for the present work were as follows: 121 122 123 124 125 126 127 128 129 130 131 132 To develop a fully automated online SPE-LC-MS/MS methodfor the detection and quantification of 6 penicillins and 4 cepha-losporins in milk. 133 134 135 To validate this new analytical method according to the EC 136requirements at levels below the set MRLs so that it can be137applicable toward the control of milk samples by the food industry.138 To analyze selected analytes in real raw milk samples. 139 To the authors'knowledge this is the first analytical methodreported for online analysis of the selected compounds in foodsamples. 140 141 142 EXPERIMENTAL SECTION 143 Chemical and Reagents. Amoxicillin (T trihydrate), ampi-1-cillin, cefazolin (sodium salt), cefoperazone (sodium salt), ceftiofur,cefalexin, cloxacillin (sodium salt hydrate), dicloxacillin (sodiumsalt hydrate), oxacillin (sodium salt monohydrate), penicillin G(benzathine salt hydrate), and penicillin V (potassium salt), usedas internal standard, were purchased from Sigma Aldrich (Madrid,1,Spain). All SPE cartridges used for sorbent screening tests andvalidation were supplied by Spark Holland (Emmen, The Neth-erlands). HPLC-grade water, methanol and acetonitrile werepurchased from Merck (Darmstadt, Germany). Potassium dihy-drogen phosphate and potassium hydroxide were obtained fromScharlau (Barcelona, Spain), and Formic acid (98-100%) (FA) wasfrom Merck. 144 145 146 147 148 149 150 151 152 153 154 155 Standard Solutions. Individual stock solutions were preparedby dissolving 1 mg of each compound in 1 mL of HPLC water instained glass stopper bottles at room temperature. Oxacillin anddicloxacillin stock solutions were prepared in HPLC water/MeOH(50:50, v/v), while ceftiofur,penicillin G, and ampicillin, as well ( (22) D i Corcia,A.; N azzari, M. J. Chromatogr. A 2002,974,53-89. ) ( ( 23) C areri, M .; B ianchi, F.; Corradini, C. J . Chromatogr. A 2002, 970,3-64. ) (24) Stolker,A. A. M.; Brinkman, U. A. T. J. Chromatogr. A 2005, 1067,15-53. (25)G(entili, A.; Perret, D.;Marchese, S. TrAC, Trends Anal. Chem. 2005, 24,622-634. (26) Ricci, F.; Volpe, G.; Micheli, L.; Palleschi, G. Anal. Chim. Acta 2007, 605,111-129. (27) Postigo, C.; Lopez De Alda, M. J.; Barcelo, D. Anal. Chem. 2008,80,3123-3134. (28) Feitosa-Felizzola,J.; Temime, B.; Chiron, S. J. Chromatogr. A 2007, 1164,95-104. (29) de Castro, A.; Fernandez, M.d. M. R.; Laloup, M.; Samyn, N.; De Boeck,G.; Wood, M.; Maes, V.; Lopez-Rivadulla, M. J. Chromatogr.A 2007,1160,3-12. 162as penicillin V internal standard solution, were made up in HPLC 163water/ACN (50:50,v/v). All stock solutions were divided into 164small aliquots and stored in a refrigerator at -25℃. To ensure165stability of the compounds in solution, different aliquots were used 166for each freeze-thaw cycle, and fresh stock solutions were167prepared monthly. 168 Standard working mixtures, required for calibration curves and169spiking tests, were prepared daily, at appropriate concentrations 170for each compound, by successive accurate dilutions of the stock171solution in HPLC water. 172 Samples and Sample Preparation. Initially, optimization of 173SPE parameters, as well as LC-MS-MS conditions, were performed 174with pasteurized milk (3.6 g fat, 3.0 g proteins) purchased from 175local markets. As a second step, raw milk samples, that is, not 176pasteurized milk, obtained from the Official Milk Laboratory of 177Catalonia (ALLIC) were used for the validation of the method and178the applicability study. Raw milk samples were aliquoted into179plastic bottles, and 150 uL of azidiol (sodium azide/chlorampheni-180col), a preservative used to inactivate the metabolism of bacteria,181were added in every 45 mL of milk. Among various preservatives182evaluated in a recent study by Seskena R. et al.,30 azidiol was183shown to have no significant effect on the fat or protein content 184in milk and to provide stable milk quality. The addition of this 185preservative, first evaluated in a study by Barcina et al. in 1987, 186increases the conservation time of milk to 5-6 days at2-6℃ or 18724 h at 20℃ and forms part of the standardized procedure used 188by ALLIC. The samples were vortex mixed for 1 min, analyzed189straightaway, or stored at -25℃ until further use. 190 The preparation of milk samples prior to SPE-LC-MS/MS 191analysis was as follows: 5 mL of milk sample were transferred 192into 50 mL glass centrifuge tubes and fortified with 400 uL of a 1193ng/mL PEN-V solution (i.e., 40 ng/mL in the final extract) by194 vortex mixing (1 min). The sample was then centrifuged at 8000rpm for 15 min at room temperature. After 195partial separation ofthe protein and fat content, the middle aqueous phase was 197transferred into sample vials ready to be used for online SPE andLC-MS-MS analysis. Online SPE Procedure. Sample pre-concentration was per- 200formed using the online SPE Symbiosis Pharma System (Spark 201Holland, Emmen, The Netherlands). The system setup is shown202in Figure 1 and consists of two integrated units: (i) the refrigerated203Reliance autosampler, able to accommodate up to 24 of 96-well204 blocks, with two binary LC pumps, and (ii) the automated205cartridge exchange (ACE) unit with two separate high-pressure206dispenser (HPD) units for solvent handling. The HPD1 unit is207the right side module and serves to carry solvents during the208sample application and clean up. The HPD2 unit is the left side209module and is responsible for the elution of the loaded cartridge.210The integrated system is operated using the Symbiosis Pharma211software (Spark, Holland) for Analyst versions 1.4.2 and 1.5212 (Applied Biosystems). 213 The defatted sample extracts were loaded onto the SPE system, 214 and the following XLC sequence was used: The SPE C18 HD 215cartridges were conditioned by passing MeOH (1 mL), water (2 216mL), and finally a buffer solution at pH 8.5 (2 mL), all at a flow ( (30) S eskena, R .; Jankevica, L. Acta Universitatis Latviensis 2007 , 723, 171-180. ) ( (31) B arcina, Y .; Zorraquino, M . A.; P edauye, J . ; Ros, G .; R incon, F . A n.Vet.(Murcia) 1987,3,65-69. ) Figure 1. Schematic representation of the system layout. rate of 5 mL/min. 1 M buffer solution was prepared by diluting217109.5 g of KHPO4 in 1 L of HPLC water.The pH was adjusted218to 8.5 with the addition of 10 M KOH solution. A 500 uL portion219of sample extract was then applied onto the cartridge using 2220mL of the same buffer solution as transfer solvent at 5 mL/221min. The SPE cartridge was then washed to remove interfer-222ences by passing 1.5 mL of the buffer solution and 3 mL of223water, again at a flow rate of 5 mL/min. Once the SPE224procedure, taking place at the left clamp of the Symbiosis225Pharma, was completed, the cartridge was automatically moved226onto the right side clamp, where the elution of the target 227analytes to the LC column begun. At the same time, a new 228cartridge was placed onto the left side clamp, and the next229extraction sequence was initiated. Target analytes were eluted230using the mobile phase solvents with a flow rate of 0.7 mL/231min at an elution time of 5 min. Following the elution step, 232and to avoid sample carry over, multiple valve and clamp 233washes were carried out with an aqueous solution of 5% ACN 2340.2% FA. 235 LC-ESI-MS/MS LC was performed using the Symbiosis 236Pharma system equipped with a 10 mL sample loop. The 237chromatographic separation of the compounds was achieved on 238a C12 Phenomenex Hydro-RP (50 mm×2 mm i.d., 4 um,80 A) 239preceded by a C12 MAX-RP security guard column (4 mm ×3 240mm i.d.), or just stainless steel frits (Screen 1/8"OD, <1 um, 241VICIAG International, Schenkon, Switzerland). The mobile phase 242consisted of (A) HPLC water and (B) methanol, both acidified 243with 0.1% FA. The elution gradient conditions for the LC mobile 244phase were as follows, based on times (t): t=(0-2) min, hold 245100%A;t=2-2.02 min, ramp linearly to 95% A;t=5-6 min, 246hold 5% A; t=6.10-10 min, hold at 100% A to wash and 247re-equilibrate the column. The flow rate was kept at 0.7 mL/min 248throughout the run, and the sample volume injected was 500 uL. 249The total chromatographic run had a duration of 10 min. 250 The HPLC system was coupled to an Applied Biosystems API 2513200 triple-quadrupole tandem mass spectrometer (Applied Bio-2252systems-Sciex, Foster City, CA), equipped with a Turbo Ion Spray253source employed in the positive electrospray ionization mode (ESI254(+)). Acquisition was performed in multiple reaction monitoring 255(MRM) mode to obtain sufficient quantification points for confir- 256mation of each analyte. The protonated molecular ion ([M+H]+) 257was chosen in most cases as the precursor ion, and the two 258 Table 1. Parent and Fragment lons, Declustering Potential (DP), Collision Energy (CE), Entrance Potential (EP) andCollision Cell Entrance Potential (CEP) Optimal Conditions for Each Compound target retention time precursor product ions DP CE EP CEP SRM ratio milk-online compounds (min.) ion (m/z) (m/z) SRM1 SRM2 (eV) (eV) (eV) (eV) SPE (SRM1/SRM2) AMO 3.15±0.02 366 349 16 27 4.5 30 1.82±0.11 114 16 13 4.5 30 CEFAL 3.67±0.02 348 158 21 15 4.5 34 6.55±0.23 174 21 39 4.5 34 AMP 3.78±0.04 350 106 31 25 9 20 2.22±0.07 192 31 18 9 42 CEFAZ 4.03±0.02 455 323 21 17 3.5 60 1.77±0.25 156 21 25 3.5 60 CEFOP 4.12±0.02 646 143 31 45 9.5 84 3.25±0.06 148 31 75 9.5 84 CEFT 4.40±0.02 524 241 41 23 5 70 1.41±0.07 125 41 81 5 70 PEN G 4.55±0.09 335 160 61 29 4 32 1.16±0.11 176 61 29 4 32 PEN V (I.S.) 4.70±0.02 351 160 35 17 4 19.97 1.32±0.08 114 21 47 4 19.97 OXA 4.75±0.01 402 243 66 37 5 16 4.42±0.21 144 66 19 5 16 CLOX 4.83±0.03 436 277 61 19 4.5 46 1.00±0.04 160 61 21 4.5 46 DICLOX 4.88±0.03 470 160 66 21 5 46 1.70±0.21 311 71 21 5 46 259most abundant product ions were used for identification,260confirmation, and quantification. Quantification was performed261with Analyst software versions 1.4.2 and 1.5 (Applied Biosys-262.tems). 263 Parameters were optimized by continuous infusion of a mixture264of 1 ppm standard solution of each analyte, via syringe pump at a265flow rate of 10 mL/min, mixed with the mobile phase by means266of a T piece. The optimal ESI source conditions were as follows:267Source temperature at 700 C, Curtain gas pressure (CUR) at 30268psi, Ion Spray transfer voltage (IS) at 5500 V, Ion source gas 1269 (GS1) at 40 V and gas 2 (GS2) at 70 V, Interface heater on,270Collision Gas (CAD) Low, Collision Cell Exit Potencial (CXP) at271 4 V, and Channel Electron Multiplier (CEM) at 2200 V.272 Fragment ions, and optimal values for declustering potential 273 (DP), collision energy (CE), collision cell entrance potential (CEP), 274 and entrance potential (EP), for each analyte transition, are shown275 in Table 1 276 RESULTS AND DISCUSSION 277 Optimization of Sample Pre-Treatment. To minimize as 278much as possible the handling of the milk sample prior to the279online extraction, while at the same time to eliminate any major280matrix effects,the sample pre-treatment procedure was optimized.281The selected antibiotics possess a wide range of physicochemical282properties (logKow, pKa, etc.), which often requires a compro-283mise when selecting experimental conditions. Different pre-284 treatment steps were studied on pasteurized milk, in an attempt285 to find the most appropriate extract, which, on analyzing, would286 give acceptable recoveries for all target analytes. 287 Various compositions of solvents like ACN, MeOH, or acids288 like FA and acetic acid, were added at a 1:1 or 1:0.5 of milk sample 289in an attempt to fully or partially precipitate the protein part in 290milk and separate the fat content. After vortex mixing, the sample 291extract was centrifuged at 8000 or 13000 rpm for 10-20 min. 292Although some of the mixtures resulted in clear extracts (1:1 293addition of ACN and centrifugation at 13000 rpm for 10 min), Thus, the best extracting recoveries for the simultaneousdetection of all analytes within the desired limits were obtainedafter centrifuging the milk samples for 15 min at a mediumresolution (8000 rpm), resulting in an upper fat layer and a proteinprecipitate. The middle layer was carefully transferred into glassvials, ready for the online extraction and subsequent analysis byLC-MS/MS. The validation of the developed methodology was performedby using 5 mL of milk for the treatment prior to online extraction.However, tests have shown that the method also works well withsample volumes as low as 0.5 mL, in which case the whole extractis injected for analysis. analysis showed that some of the compounds were not sufficiently 294recovered. Relative recoveries obtained by the analysis of differ- 295ently prepared extracts are provided in the Supporting Information, 296Figure 1. With the addition of ACN or FA, the recoveries for 297CEFT, CLOX, DICLOX, and PEN G were seriously affected. 298Addition of formic acid had a generally milder effect on analyte 299recoveries but still significant when comparing to the relevant 300results obtained if no solvent is added (not the case for CEFAL 301and AMP). 302303304305306307308309310311312313314Rapid assessment on the stability of the selected compounds 315in solution was performed to verify if spiked milk extracts were 316stable 2 days after their preparation. Fresh and second-day extracts 317were analyzed by the optimized method and comparison of the 318results confirmed the high instability of B-lactams. In more detail, 319the two amphoterics, amoxicillin, and ampicillin showed a 45-50% 320signal decrease, whereas other penicillins revealed higher de- 32Dcrease levels (penicillin G, 67-72%; oxacillin and cloxacillin, 32286-89%). In the cephalosporin group, cefalexin was affected the 323least (30-36%) but cefazolin and ceftiofur showed a significant 324signal reduction (73-75% and 66-71%, respectively). Dicloxacillin 325and cefoperazone were not detected at all in the second-day 326extract, making them the less stable analytes in solution. 327 Figure 2. Comparison of results obtained by the LC-MS/MS analysis of a standard solution spiked with 1 ng/mL of each target analyte usingdifferent extraction sorbents: C18HD (Black peaks) and PLRPs (Grey peaks). The PLRP corresponding peaks were offset by 1 min to make theportrayed differences noticeable. 328 Optimization of SPE Procedure. To optimize the SPE 329procedure for this multianalyte method, different sorbent types 330 were studied, including Isolute Silica based Cation Exchange 331sorbents SCX, PRS, CBA and mixed mode sorbent HCX, non- 332polar sorbents CN, C2, CgEC, C18EC, C18HD, Oasis Mixed-Mode333Cation-Exchanger (MCX), HLB, Hysphere Resin GP, Resin SH,334 MM anion, and Varian polymer phase PLRPs. Oasis HLB and335the PLRPs cartridges gave similar results for most analytes,336 but based on their extraction efficiency for amoxicillin, a337 compound which was hardly extracted with the Oasis HLB338 cartridge, PLRPs cartridges were chosen for further testing.339 On comparing the PLRPs with the C18HD type cartridges,340 which also showed good recuperation, we finally chose the341 C18HDs because of better peak shape and higher response342for all analytes. Figure 2 shows the comparison between the two343 cartridges based on peak area,peak height, signal-to-noise (S/344 N) ratio, and peak shape (the latter shown only for the most 345prevalent cases). As can be seen in the above figure, although 346resulting peak areas and heights were similar for the two sorbents, 347the S/N ratio was much higher when using the C18 HD 348cartridges, leading to much lower limits of detection and quantification. Several preliminary tests were performed using first aqueous spikes at 1, 10, 50, and 100 ng/mL and then confirmed by the 352use of the same spikes made up in the matrix. The injection 353volumes tested were between 50 uL to 1500 uL, and within this354 range no breakthrough was observed. To obtain good sensitivity355for all compounds, the injected sample volume was set at 500 uL, 356 but in some cases, as in the case of DICLOX, the same sensitivity F3 357 was obtained when injecting lower volumes (e.g., 400 uL). 358 Here, it is worth mentioning that by switching to a 2 mL loop 359and injecting 1 mL of extract in full loop mode (i.e., 1.5 mL injected 360 volume), results were better for all analytes (most significant effect 361on AMP). However, to minimize the required sample volume 362 363 364 365 366 367 368 369 370 371 372 373 374 375 376 377 378 379 380 381 382 383 384 385 without compromising on quality of analysis, the injected volumethroughout validation was kept at 0.5 mL. Conditioning of the SPEcartridge was done with methanol to match the already optimizedorganic component in the mobile phase. Addition of FA in theconditioning solvent did not improve sensitivity for the targetanalytes, and therefore it was kept to 100% methanol. Equilibrationof the cartridge was done in two steps; first by passing water and,second,by passing a buffer solution previously optimized at pH8.5. Two wash steps were applied to the cartridge after sampleextraction to eliminate interferences and possible matrix effects.Here, the solvents were added in the opposite order than in theequilibration step, that is, buffer at pH 8.5 first and water second.Tests with organic composed mixtures showed poor recoveriesfor the polar penicillin compounds. This can be explained by thefact that with higher percentage of organic in the wash solution,the most polar compounds in the group (i.e., the first eluting)will be washed off the SPE cartridge and therefore lost beforereaching the analytical column. The wash volume was optimizedat 1500 uL with buffer at pH 8.5. Higher wash volumes increasedthe response for CLOX but decreased significantly the responsefor AMOX. The use of a potassium buffer solution at the proposedpH value was first suggested by Becker et al.4 but was optimizedduring the present study against the same type of buffer but atthe lower pH value (pH 5). This study showed distorted peakshape for CEFT, as well as significantly lower intensity for AMOX,AMP, and CLOX (Supporting Information, Figure 2). The flowrate for the wash steps was another important parameter to beoptimized. Tests were done with low (2 mL/min) and high (5mL/min) flow rates. The results obtained with the low flow rateelution revealed approximate signal reduction for AMP (40%),CEFT and CEFAL (55%), and PEN V (35%), indicating that thecleanup efficiency by employing a low flow rate in the wash stepwas not sufficient for the detection of all analytes. Elution timewas optimized at 5 min; longer time (6 min) affected significantly 386 387 388 389 390 391 392 393 394 395 Time, min Figure 3. LC-MS/MS analysis of a standard solution spiked with 1000 ng/mL of all target analytes. Comparison of different mobile phases:MeOH (Black peaks), ACN (Dark gray peaks), and MeOH:ACN (1:1) (Light gray peaks). using the same cartridge at least four times in sequence, butduring this study cartridges were only used once. 396the response for PEN V and AMP, whereas shorter elution time 397 (4 min) decreased the sensitivity for AMOX, DICLOX, OXA, and398CLOX (4 min did not achieve complete elution of the cartridge,399affecting the last eluting compounds). Recoveries for all experi-400 ments above were calculated from the peak areas obtained for401 each analyte (data not shown). Finally, a study on potential ( 402 reusage of the S PE cartridges yielded reproducible results after ) 403 404 Optimization of LC Mobile-Phase Composition and Gradi- 405ent. Three different compositions were studied as mobile phase 406(MeOH, ACN, and MeOH:ACN (1:1), all with the addition of 0.1% 407FA) with one of the mobile phase components being always 0.1% 408FA in HPLC water. The mobile phase gradient was also optimized 409 Table 2.Accuracy (%), Intra- and Inter-Day Precision (%) on Analyzing B-Lactam Antibiotics in Bovine Milk atConcentrations Close or Equal to the Set MRLs accuracy intraday interday accuracy intraday interday accuracy intraday interday analyte (%) precision (%) precision (%) (%) precision (%) precision (%) (%) precision (%) precision (%) AMOX 100 13 6 112 6 na 84 33 na AMP 109 7 io 139 9 na 96 na CEFAz 83 4 na 89 3 8 89 na CEFOP 88 100 3 107 CEFT 100 112 6 102 CEFAL 110 12 na 115 1 na 104 CLOX 99 0 na 80 na OXA 95 na 103 na PEN G 116 i2 na 143 na DICLOX 92 4 101 na 96 na 410by varying the percentage of organic solvent throughout the run.411A comparison of the most intense transition obtained for each of 412the compounds using MeOH, ACN, or a 1:1 mixture ofMeOH: 413ACN is shown in Figure 3. An identical optimized gradient run 414 was used in all cases. Acetonitrile was immediately ruled out 415 because of its poor performance with the two amphoteric 416 compounds, AMOX and AMP. More specifically, in the case of 417AMOX the use of ACN in the mobile phase produced a very well- 418 defined doublet, not acceptable when developing a quantitative 419 method, whereas in the case of AMP, the obtained intensity was 420very poor, making detection of this compound at concentrations421as low as 4 ng/mL (the set MRL) very uncertain. Acombination422of two organic solvents, methanol and acetonitrile, in the constitu-423tion of the mobile phase, gave overall better chromatographic424peaks (except for AMP), though the peak shapes for OXA and425 DICLOX were significantly affected. For the above reasons,426methanol, with the addition of 0.1% FA, was chosen as the optimal427organic mobile phase. There are a number of studies supporting428the fact that -lactams can degrade in methanol20,32,33 and can429therefore give reduced signals. However, this effect was not430observed in the development of the outlined method, possibly431 because the proposed method utilizes an online SPE procedure432:(of a total time of approximately 3 min and a total chromatographic433 run of 10 min, a time period not sufficiently long for the434 compounds to show any degradation effects. In addition, new stock435 solutions were prepared monthly, and diluted solutions were made436 up on a daily basis to further ensure the stability of the 437 compounds. 438 Optimization of MS/MS Conditions. To select the ionization439 mode and investigate the product ions of the parent target440 compounds, individual solutions of each analyte were made up at441 a concentration of 1000 ng/mL in HPLC water and 0.1% FA, and442 directly injected in MS/MS, by infusion at a constant flow rate of443 10 uL/min. From a total of 10 compounds investigated,7 showed444 response in the positive mode (PI) only, whereas 3 (PEN G, OXA,445 DICLOX) were satisfactorily ionized in both modes (PI and NI).446Since the essential purpose of this study was to develop a 447multianalyte method to simultaneously detect all selected B-lac- ( (32) Tyczkowska, K. L . ;Voyksner, R. D.; A r onson, A. L. J . C hromatogr. 1 9 92,594, 1 95-201. ) ( (33) Pozo, O .J; Guerrero,C.; S a ncho,J. V . ; Ibanez, M .; P itarch, E.; Hogendoorn,E.; Hernandez, F. J. Chromatog r . A 2006 , 1103,83-93. ) tams, the conditions optimized for ionization in the positive modewere selected. 448 449 Validation. The validation procedure for the developedmethod was carried out conforming to the EU requirements, asstated in the commission decision 2002/657/EC for compoundswith permitted usage in food-producing animals for therapeuticpurposes.Raw milk samples were supplied by ALLIC. The mostsignificant parameters considered are described in the followingpoints. Identification and Quantification.A total of four identifica-tion points, required by the EC, were obtained for each analyteby monitoring two transition products for every precursor ioncorresponding to each target analyte in the MRM mode. The mostintense transition served for quantification purposes, and thesecond transition is monitored to confirm the relevant analyte. Having identified the most abundant fragment ions for each 450compound, as well as the ionization parameters for each particular 451transition, full-scan chromatograms were obtained, indicating the 452retention order for the selected compounds. Flow injection analysis 453(FIA) was then performed for the first and last eluting compounds, 454to optimize the conditions for the ion source in the mass 455spectrometer, namely, the ion source temperature, curtain gas, 456gas 1 and 2, CEP, and so on. Final MS/MS conditions, as well as 457precursor ion and product ions, selected for the identification and 458quantification of each compound, are summarized in Table 1. 459460461462463464465466467468469470471472Accuracy and Intra- and Interday Precision. The accuracy 473and intraday precision of the developed method was assessed at 474three different concentration levels, corresponding to half the 475MRL, the MRL, and 1.5 times the MRL limits set by the EU for 476each compound. The internal standard was added in all three 477solutions at a concentration of 40 ng/mL, and, at each level, the 478analysis was performed in six replicates. Accuracy is expressed 479as the mean, from six measurements, percent closeness between 480the calculated and the theoretical concentrations for each analyte, 481whereas intraday precision, or within-day reproducibility, was 482calculated as the percent relative standard deviation (RSD %) of 483the six replicates. Interday precision was calculated by running 484spiked samples in three consecutive days, with a different analyst 485performing the analysis each day, and expressed as the relative 486standard deviation between the obtained results. Results shown 487in Table 2 represent accuracies ranging between 80 (CLOX) and 488 F4116% (PEN G) for all compounds. The RSDs derived from the 489 ohio2/yac-yac/yac-yac/yac99907/yac5230d07z xppws 23:ver.3 4/20/09 7:55 Msc: ac-2009-001386 TEID: Irk00 BATID: ac6b25 Table 3. LODs, LOQs, and Correlation Coefficients on Analyzing B-Lactam Antibiotics in Spiked Bovine Milk Samples analyte MRLs (ng/mL) LOD (ng/mL) LOQ(ng/mL) linearity (Corr. Coef.) LOD (ng/mL) LOQ (ng/mL) linearity (Corr. Coef.) AMOX 4 0.0059 0.0197 0.9897 0.0144 0.0478 0.9957 AMP 4 0.0023 0.0078 0.9764 0.0028 0.0092 0.9720 CEFAZ 50 0.0055 0.0182 0.9989 0.0826 0.2753 0.9988 CEFOP 50 0.0032 0.0106 0.9995 0.0899 0.2995 0.9975 CEFT 100 0.0010 0.0035 0.9995 0.0217 0.0724 0.9961 CEFAL 100 0.0086 0.0287 0.9766 0.0158 0.0525 0.9879 CLOX 30 0.0018 0.0801 0.9981 0.0062 0.2670 0.9878 OXA 30 0.0018 0.0059 0.9955 0.1921 0.4178 0.9953 PEN G 4 0.0078 0.0260 0.9977 0.5115 1.4415 0.9953 DICLOX 30 0.0008 0.0028 0.9945 0.0505 0.1684 0.9934 Table 4. Recoveries of β-Lactam Antibiotics in SpikedBovine Milk Samples absolute total relative total absolute recovery recovery in recovery in of SPE analyte milk (%)" milk (%)' method (%) AMOX 75 103 78 AMP 70 96 98 CEFAZ 83 114 99 CEFOP 79 109 100 CEFT 97 132 99 CEFAL 87 119 97 CLOX 71 98 100 OXA 71 98 100 PEN G 64 88 99 DICLOX 79 109 100 PEN V 73 83 “ Calculated from the peak areas obtained in online analysis ofspiked milk samples as percentages of the peak areas obtained fromdirect chromatographic injection of equivalent amounts of the standardsin hplc water. Relative to the surrogate standard.‘Calculated fromthe peak areas obtained in the second eluted cartridge (two cartridgeexperiment) and the sum of the peak areas in both cartridges. real samples AMOX CEFAL AMP PEN G CLOX sample 1 1.01 4.97 sample 2 0.02 11.32 sample 3 sample 4 sample 5 sample 6 0.49 0.05 sample 7 3.30 sample 8 sample 9 sample 10 1.28 10.11 sample 11 nd1 48.68 sample 12 0.03 1.45 sample 13 1.08 0.04 1.51 sample 14 0.02 2.23 sample 15 0.02 bql sample 16 2.70 0.07 0.02 1.18 sample 17 sample 18 2.15 sample 19 2.03 0.03 sample 20 nd 0.04 3.36 “ bql: below quantification limit; nd: not detected. 490replicate analysis of the matrix spikes were between 0% (CLOX, 491 DICLOX) and 19% (CEFOP), demonstrating very good within- ( 492 day reproducibility for all analytes. The only exception was AMOX, ) where the intraday precision was relatively high (above 30%) for493the high concentrated sample. Interday precision was calculated494from raw milk samples spiked at a single level, the closest to the495relevant MRL value. Obtained results are shown in Table 2, and 496values ranged between 4% (DICLOX) and 36% (CEFT). 497 Limits of Detection (LODs) and Quantification (LOQs). 498LODs for the 10 B-lactams were calculated as 3 and 8 times the499signal-to-noise (S/N) value for the quantifier ion of each analyte.5500Although, usually, these terms refer to the method’s limits, in this501case the reported values represent detection and quantification502limits of the method taking into account the relevant matrix effects.503Table 3 summarizes the calculated mean values obtained from504the analysis of six aliquots of HPLC water and blank raw milk505sample, both fortified with 3, 10, 50, and 120 ng/mL of each506substance. As expected, the limits corresponding to raw milk were507in all cases higher than the relevant values in HPLC water.508Linearity results were also good, and correlation coefficients509corresponding to both water and milk are also shown in Table 3.510 Recoveries and Matrix Effects. Fortified samples were511prepared by diluting exact amounts of the appropriate working512mixtures to 5 mL of sample. After fortification, the samples were 513kept at room temperature for 10 min to ensure that antibiotics 514were homogenously distributed through the sample. Calibration 515series were prepared in water, pasteurized milk, and raw milk 516samples to calculate recoveries and address matrix ionization 517suppression or enhancement effects. Recoveries for the com-0- 518pounds under study were evaluated by analyzing spiked samples 519in HPLC water and raw milk and are shown in Table 4. Injections 520were performed in both offline, that is, by direct chromatographic 521injection, and online, that is, by undergoing SPE, modes. 522 Two types of recoveries were calculated. The first represents 523the recovery of each analyte when samples are subjected to 524the full method (pre-treatment, online extraction,mass spec- 525trometric detection) and is derived by comparing the response 526from a direct chromatographic LC injection of a spiked HPLC 527water sample to the response from an online XLC injection of 528a spiked raw milk sample (Total recovery).To determine the 529recovery of the extraction process an experiment involving two 530cartridges, of the same sorbent type, were placed in series, 531and a sample with the optimized online SPE method was 532 ( (34) R oca,M . Z o rraquino, M . A. Igualada, C.; Althaus, R. L . Molina , M. P.“M87:Effect of heat t reatments on s t ability o f p-lactams i n m ilk”J. Anim. Sc i . V ol. 8 5, S uppl. 1/ J . D airy Sci. Vol.90, Suppl. 1/ P oult. Sci. Vol. 86 , Su p pl. 1, 31. ) Figure 4. Online SPE-LC-MS/MS chromatograms for positively identified compounds: (A) Real bovine milk sample; (B) 10 ng/mL standardsolution. 533injected. The first cartridge eluted, depicted in the first half of 534 the resulting chromatogram, reflects the amount of analyte that 535 breaks through (breakthrough), whereas the last eluting 536cartridge, shows the amount of each analyte trapped in the 537cartridge (recovery) and is illustrated in the second half of the 538 chromatogram. The extraction recovery was then determined by comparing the response in the first cartridge to the sum of 539the response in the first and second cartridge. 540 Matrix effects were also addressed only for the analysis of541raw milk since no significant differences were obtained between 542pasteurized milk samples and raw milk samples. Matrix effects 543were calculated according to the following equation: 544 ohio2/yac-yac/yac-yac/yac99907/yac5230d07z xppws 23:ver.3 4/20/09 7:55 Msc: ac-2009-001386 TEID:Irk00 BATID: ac6b25 545 The results showed ion suppression effects for all analytes 546 where AreaxLcmilk is the peak area obtained in online analysis547of spiked milk samples (after subtracting the relevant area548in the blank milk sample) and AreaxLCwater is the peak area549obtained in online analysis of spiked HPLC water sam-550ples.551552553554555556557558559560561562563567568569572573574575576577578579580581582583584585586587588589590 Three analyzed raw milk samples were found to be negative591with respect to p-lactam concentrations and another two592samples contained one B-lactam but at a concentration lower593 than the corresponding quantification limit. AMOX, AMP,594 CEFAL, PENG, and CLOX were detected in real milk samples,595 and the relevant results are shown in Table 5. From a total of596 20 samples, 15 samples were found to contain at least one target597 analyte at a quantifiable level. For one sample the concentration598 quantified for CLOX (48.68 ng/mL) exceeded the permitted599limit set by the EU (30 ng/mL) by more than 50%. In particular,600CEFAL was found only in one sample and AMOX was found in in the range 5-75%. More specifically, the calculated valuesfor each substance were as follows: 53% (AMOX), 75% (AMP),42% (CEFAZ), 69%(CEFOP), 41%(CEFT), 60% (CEFAL), 6%(CLOX and DICLOX), 7% (OXA), 11% (PEN G) and 5% (PENV). Even with these observed effects, the newly developedmethod is accomplished within legal requirements. Neverthe-less, different procedures were tested to try and minimize ionsuppression. In many cases these manipulations producedlosses by degradation of some compounds such as DICLOXand PEN G (Supporting Information, Figure 1), and a significantincrease in the time of analysis. Thus, because of the use ofinternal standard for quantification and the satisfactory recover-ies for most compounds with minimum required manipulation, the present method was considered as the optimal one. As an additional verification step, eight real milk samples were spiked in the laboratory and were blind tested by theproposed method. The same samples were also analyzed inparallel by the “Eclipse 100”, an assay based on the inhibitionof microbial growth. Very good agreement was obtainedbetween spiked concentrations and quantified concentrations,and no false positives or negatives were obtained (results notshown). B-Lactams Antibiotic Levels in Real Samples. Twenty raw bovine milk samples were provided by ALLIC and analyzed forthe target analytes. In the absence of surrogate deuteratedstandards, and even when the use of such compounds isfeasible, calibration curves should always be made up in thesame matrix (milk type) as the samples analyzed. It has beenreported that under LTLT pasteurization (60 °℃ for 30 min.),cephalosporins can degrade to a 16-43%, and HTST pasteuriza-tion (72 °C for 15 s.) can cause very small losses in all p-lactams.Sterilization (120 °C for 20 min.) can cause significant degrada-tion: 47% for AMOX, 93% for AMP, and>90% for all cepha-losporins.34 For these reasons, as well as the variability insample’s components (proteins, fat, etc) between the differenttypes of milk, matrix-matched calibration curves were alwaysused to avoid significant quantification errors and thereforemisinterpretation of results. four samples at a mean concentration of 1.57 ng/mL. Concen- 601trations for AMP, PENG, and CLOX ranged between 0.02-1.28, 6021.18-3.36, and 4.97-48.68,respectively.Mean concentrations 603were 0.23 ng/mL for AMP, 2.17 ng/mL for PEN G, and 18.77 604ng/mL for CLOX. The presence of AMOX, CEFAL, AMP, and 605PENG was confirmed but not quantified (concentrations being 606lower than the LOQ but higher than the LOD) in one, four, 607one, and six samples, respectively. Figure 4 shows online SPE- 608LC-MS/MS chromatograms acquired for the samples contain- 609ing the most pronounced concentrations, as well as for a 610standard solution of 10 ng/mL. 611 This analytical method presents an easy and cost-effectiveprocedure for the identification and quantification of selectedantibiotic compounds in raw milk samples and is a useful tool forthe confirmatory analysis of these compounds in previous posi-tively screened milk samples in routine food analysis. 612 613 615 616 CONCLUSIONS 617 Numerous previously developed methods for the analysis 618of B-lactams in milk based matrixes involve lengthy and 619laborious steps for the pre-treatment of the samples, involving 620de-proteinization by the addition of solvents or strong acids, 621and evaporation usually under a stream of nitrogen. 622 The SPE procedure is unquestionably the most important 623step when developing a multi-analyte method. Because of 624variations between physicochemical properties of the com- 625pounds under study,when optimizing different parameters one 626needs to be very cautious on the compromises that need to be 627made in order for all analytes to be detected under the specified 628requirements. 629 In this study, the applicability, high sensitivity, and accuracy 630of a novel, fully automated method for confirmatory analysis, 631unequivocally identification and quantification of p-lactam 632antibiotics (six penicillins: amoxicillin, ampicillin, cloxacillin, 633dicloxacillin, oxacillin, and penicillin G; and four cephalosporins: 634cefazolin, ceftiofur, cefoperazone, and cefalexin) in bovine milk 635have been demonstrated. In addition, the method requires 636minimum sample preparation, allowing high sample throughput 637(10 min as analysis time). LODs in milk were well below the 638MRLs set by the European Union for all compounds, and LOQs 639in milk ranged between 0.09 ng/mL (AMP) and 1.44 ng/mL 640(PEN G). The method has been demonstrated to serve as a 641useful tool for identification and quantification of the selected 642compounds in previously positive screened samples by routine 643analysis. 644 The analysis of spiked real samples showed no false negative 645or positive results, whereas the analysis of real samples 646revealed that 15 out of 20 samples contained quantifiable 647concentrations for five target B-lactams (AMOX, AMP, CEFAL, 648PENG, and CLOX). In fact, one of the samples presented a 649concentration for CLOX exceeding the maximum legal limits 650set for this compound in milk. 651 ACKNOWLEDGMENT 652 The work described in this article was supported by the 653European Union through project CONffIDENCE (Contract No. 654211326). Lina Kantiani acknowledges Alexander S. Onassis 655 ohio2/yac-yac/yac-yac/yac99907/yac5230d07z xppws 23:ver.3 4/20/09 7:55 Msc: ac-2009-001386 TEID: Irk00 BATID: ac6b25 656public benefit foundation (F-ZD 029/2007-2008). The authors 657acknowledge Spark Holland for continuous support throughout 658 the project and supply of the SPE cartridges used, Frederique 659van Holthoon (Rikilt-Institute of Food Safety) and J.M. Fernan- 660 dez (SIA Enginyers). This article reflects only the author's 661 views, and the EU is not liable for any use that may be made ( 662 of the information contained therein. ) SUPPORTING INFORMATION AVAILABLE 663 Additional information as noted in the text.This material is 664available free of charge via the Internet at http://pubs.acs.org. 665 Received for review January 20, 2009. Accepted April 15, 6662009. 667 AC9001386 668 acCCC: $C XXXX American Chemical SocietyPAGE EST: Analytical Chemistry, Vol. xxx, No. xx, Month XX, XXXXx C 开发了可检测牛奶中的内酰胺抗生素的全自动分析方法。 本方法采用了在线固相萃取-液相色谱/电喷雾串联质谱(SPE-LC/ESI-MS-MS)联用系统。采用在线SPE方法,离心后的500微升牛奶中的目标化合物被浓缩在C18 HD小柱上。然后用流动相(水+ 0.1%乙酸 / 甲醇 + 0.1%乙酸)在0.7 mL/min的流速下用梯度方式将目标化合物洗脱下来。采用C12反相分析柱在10分钟内实现色谱分离。 为了准确定性并进行确证,在正离子电喷雾离子化模式下(ESI(+))对每个组分采集两种多反应监测(MRM)跃迁数据。对于牛奶中的所有目标化合物,方法检测限 (LOD)都低于欧盟规定的最大残留水平(MRL)。在牛奶中,定量限在0.09至1.44 ng/mL之间。根据欧盟要求对方法进行了验证,准确度在80至116%之间。采用该方法分析了20个实际牛奶样品。这种新开发的方法具有较高的灵敏度和准确性,只需进行最少的样品预处理,并且首次运用了全自动在线SPE技术,分析通量较高。因此,本方法适用性较好,是食品安全控制部门不可或缺的检验方法。
确定


还剩9页未读,是否继续阅读?

产品配置单
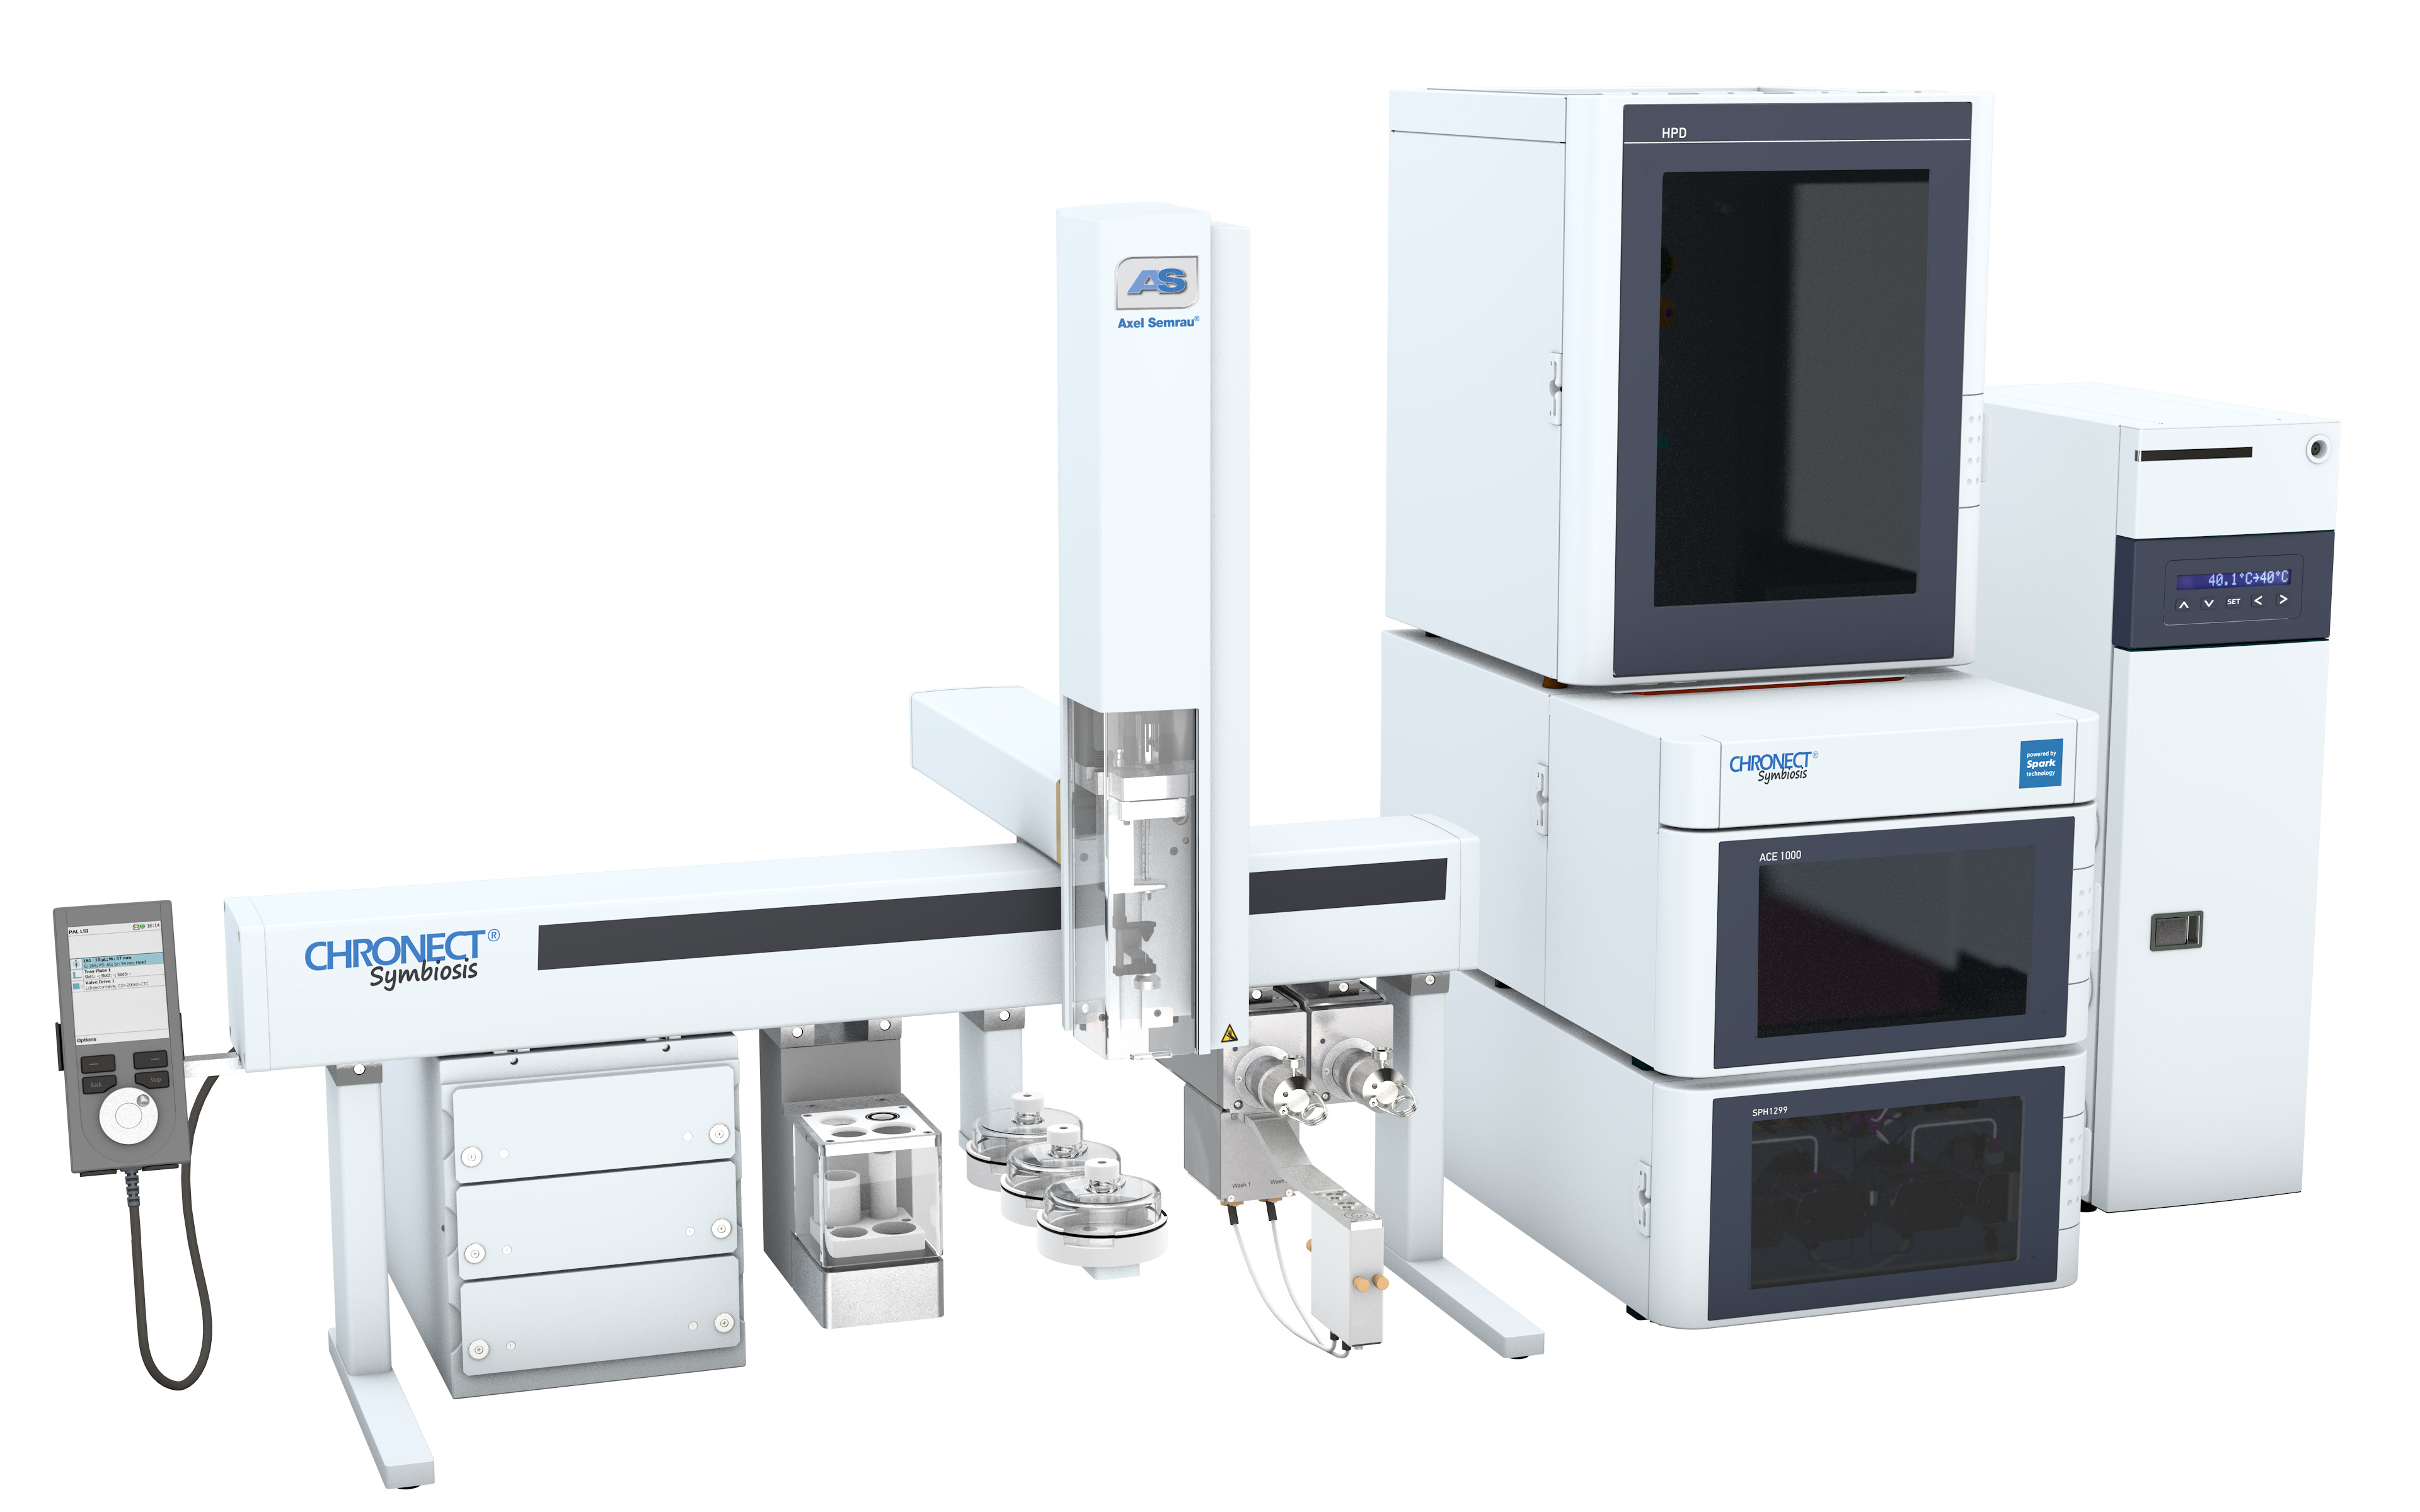
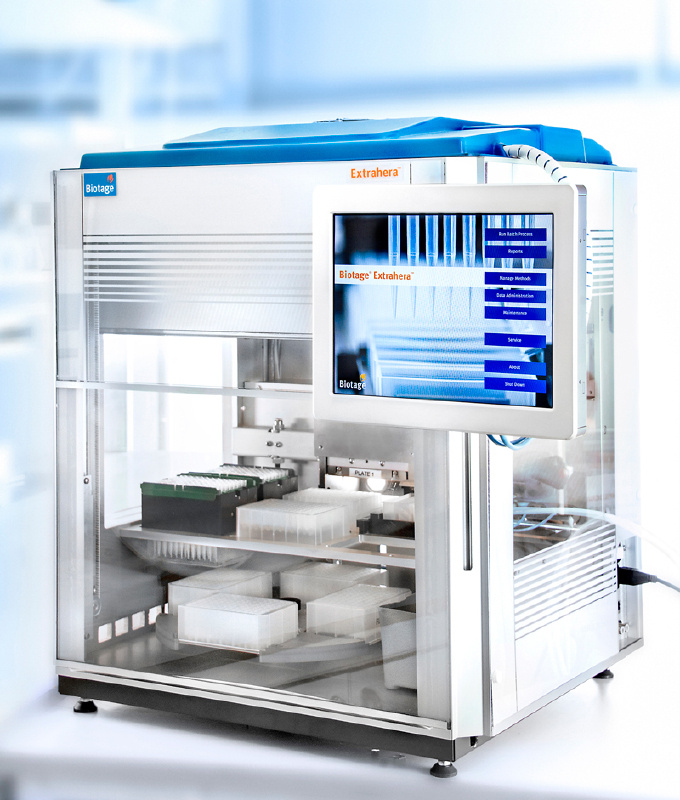
仪真分析仪器有限公司为您提供《乳粉中β-内酰胺类检测方案(固相萃取仪)》,该方案主要用于乳粉中兽药残留检测,参考标准--,《乳粉中β-内酰胺类检测方案(固相萃取仪)》用到的仪器有超高压液相在线SPE色谱联用系统CHRONECT Symbiosis
推荐专场

该厂商其他方案
更多