


部分选定水体沉积物中重金属(镉、铬、铁、铅、锰、锌)污染的评价 Evaluation of heavy metals contamination in the sediments of some selected water of South Senatorial District of Niger State, Nigeria
方案详情

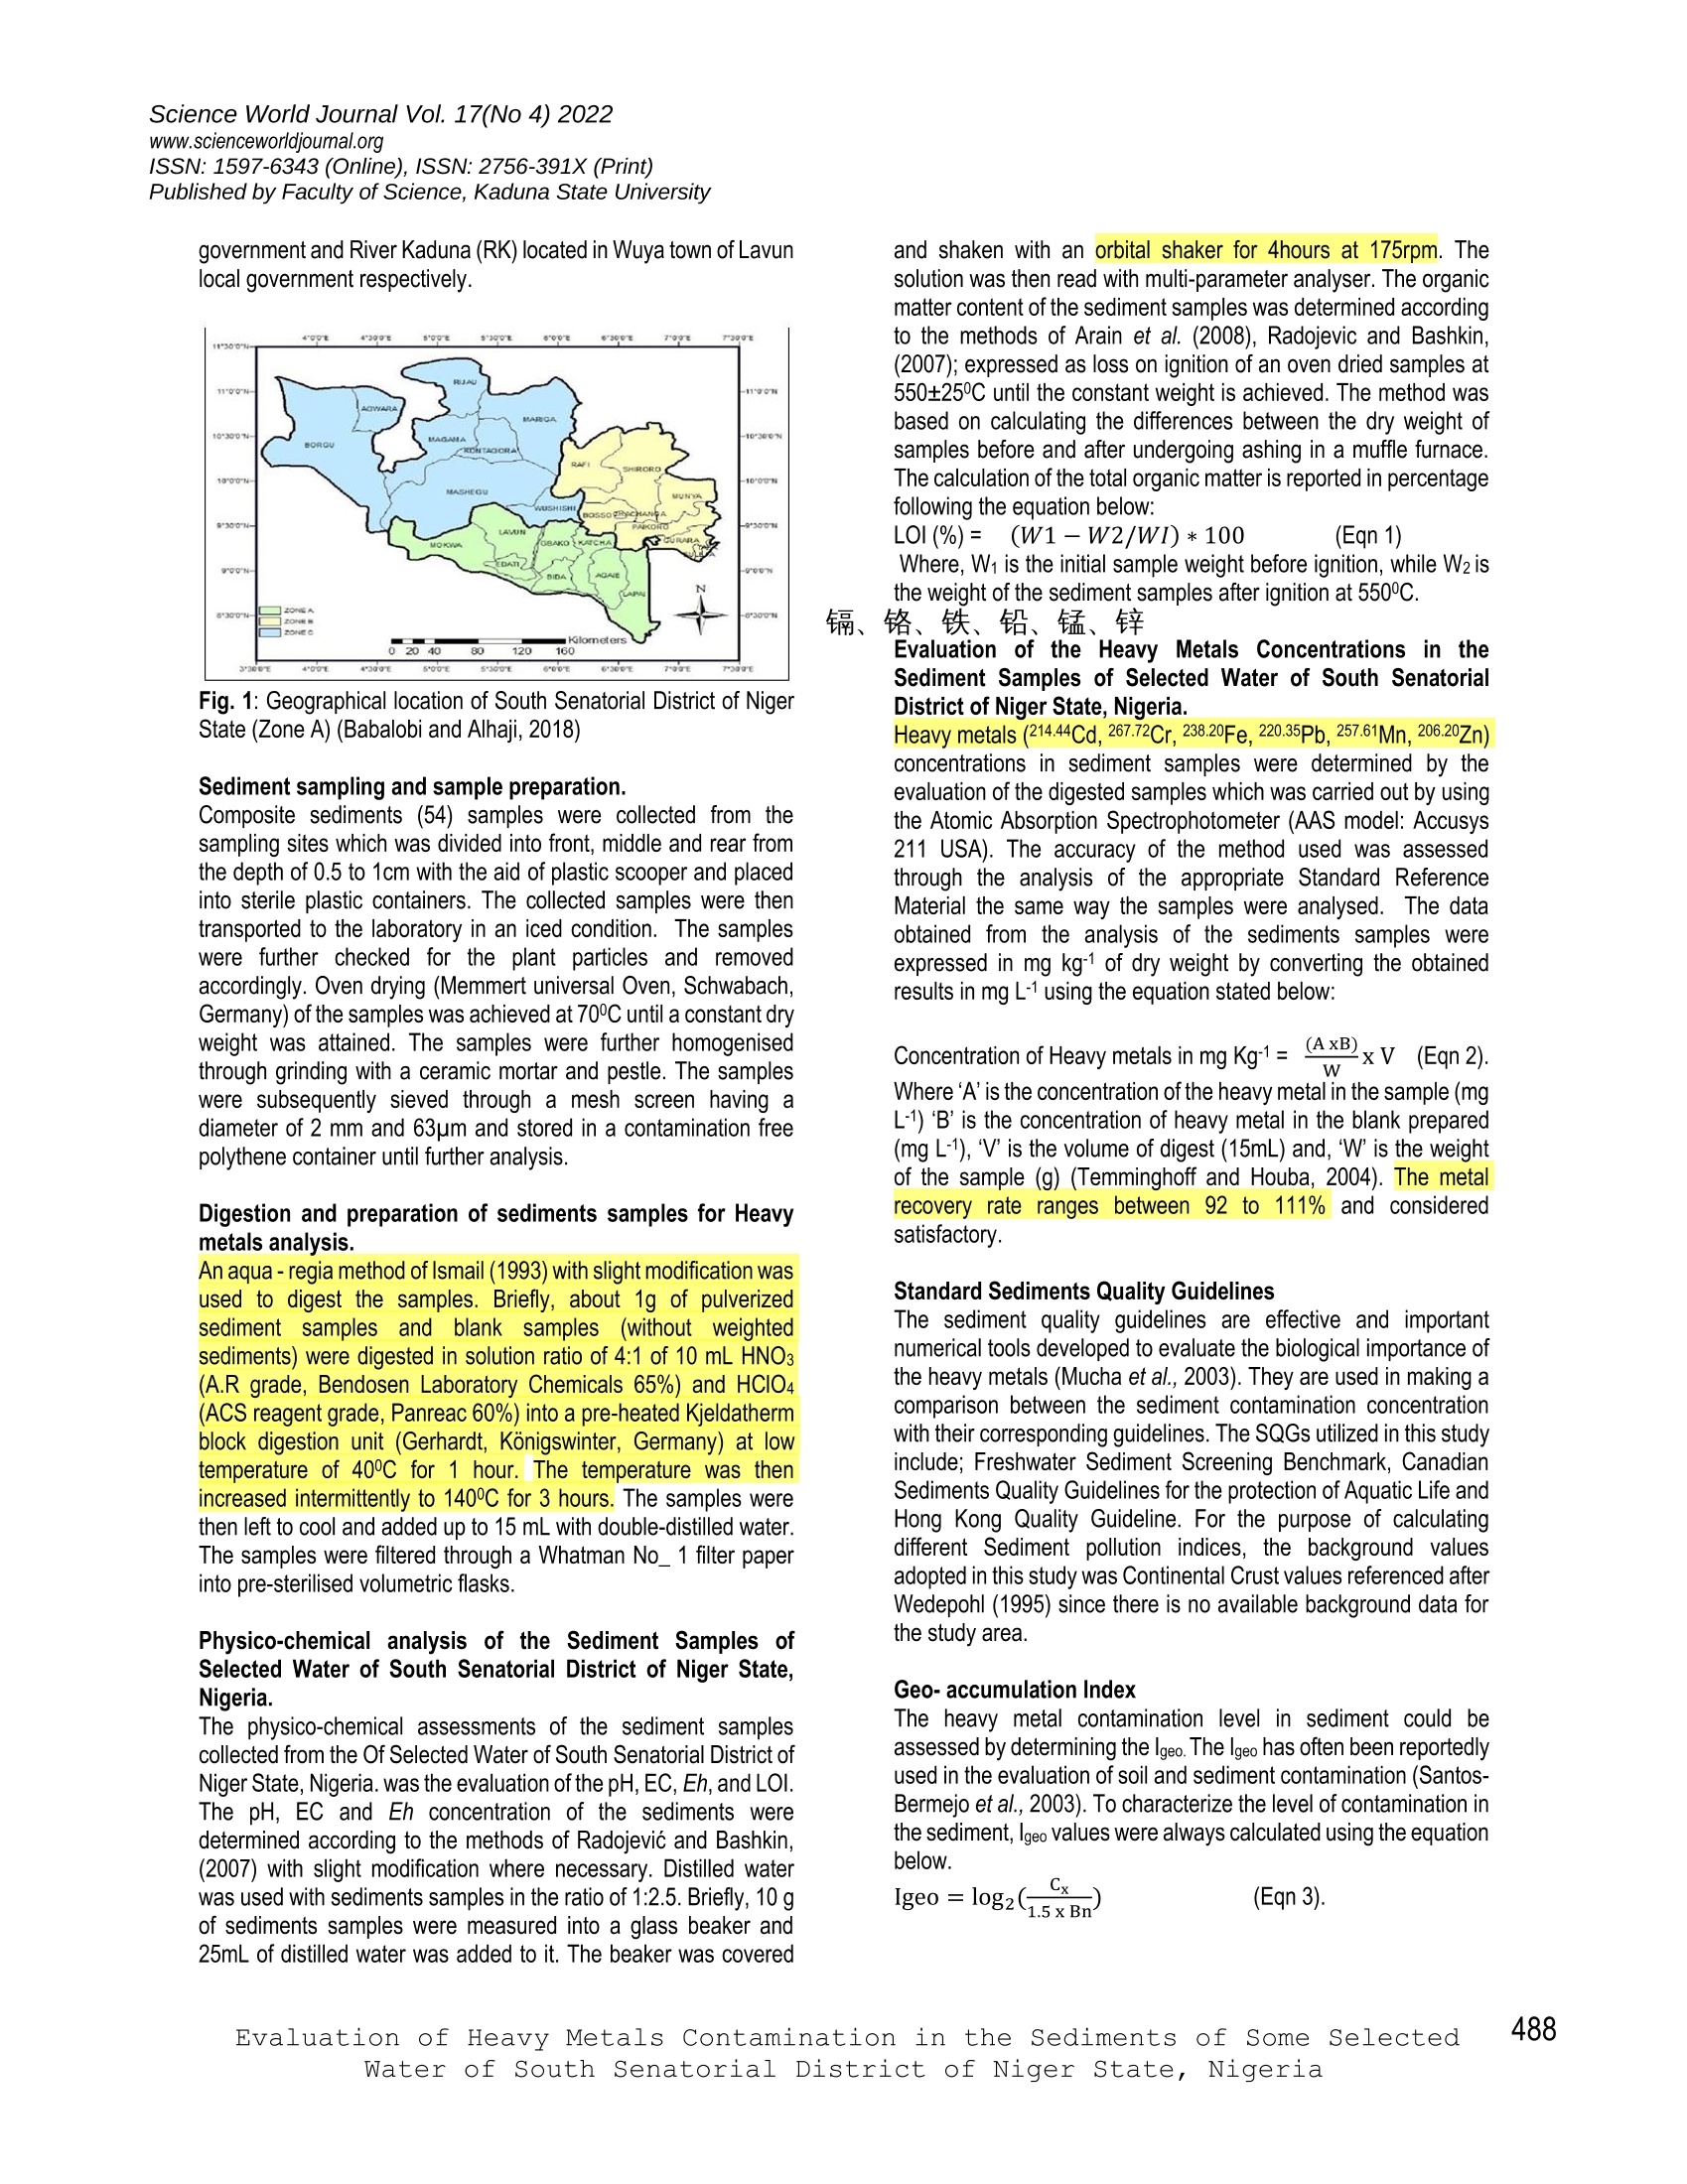
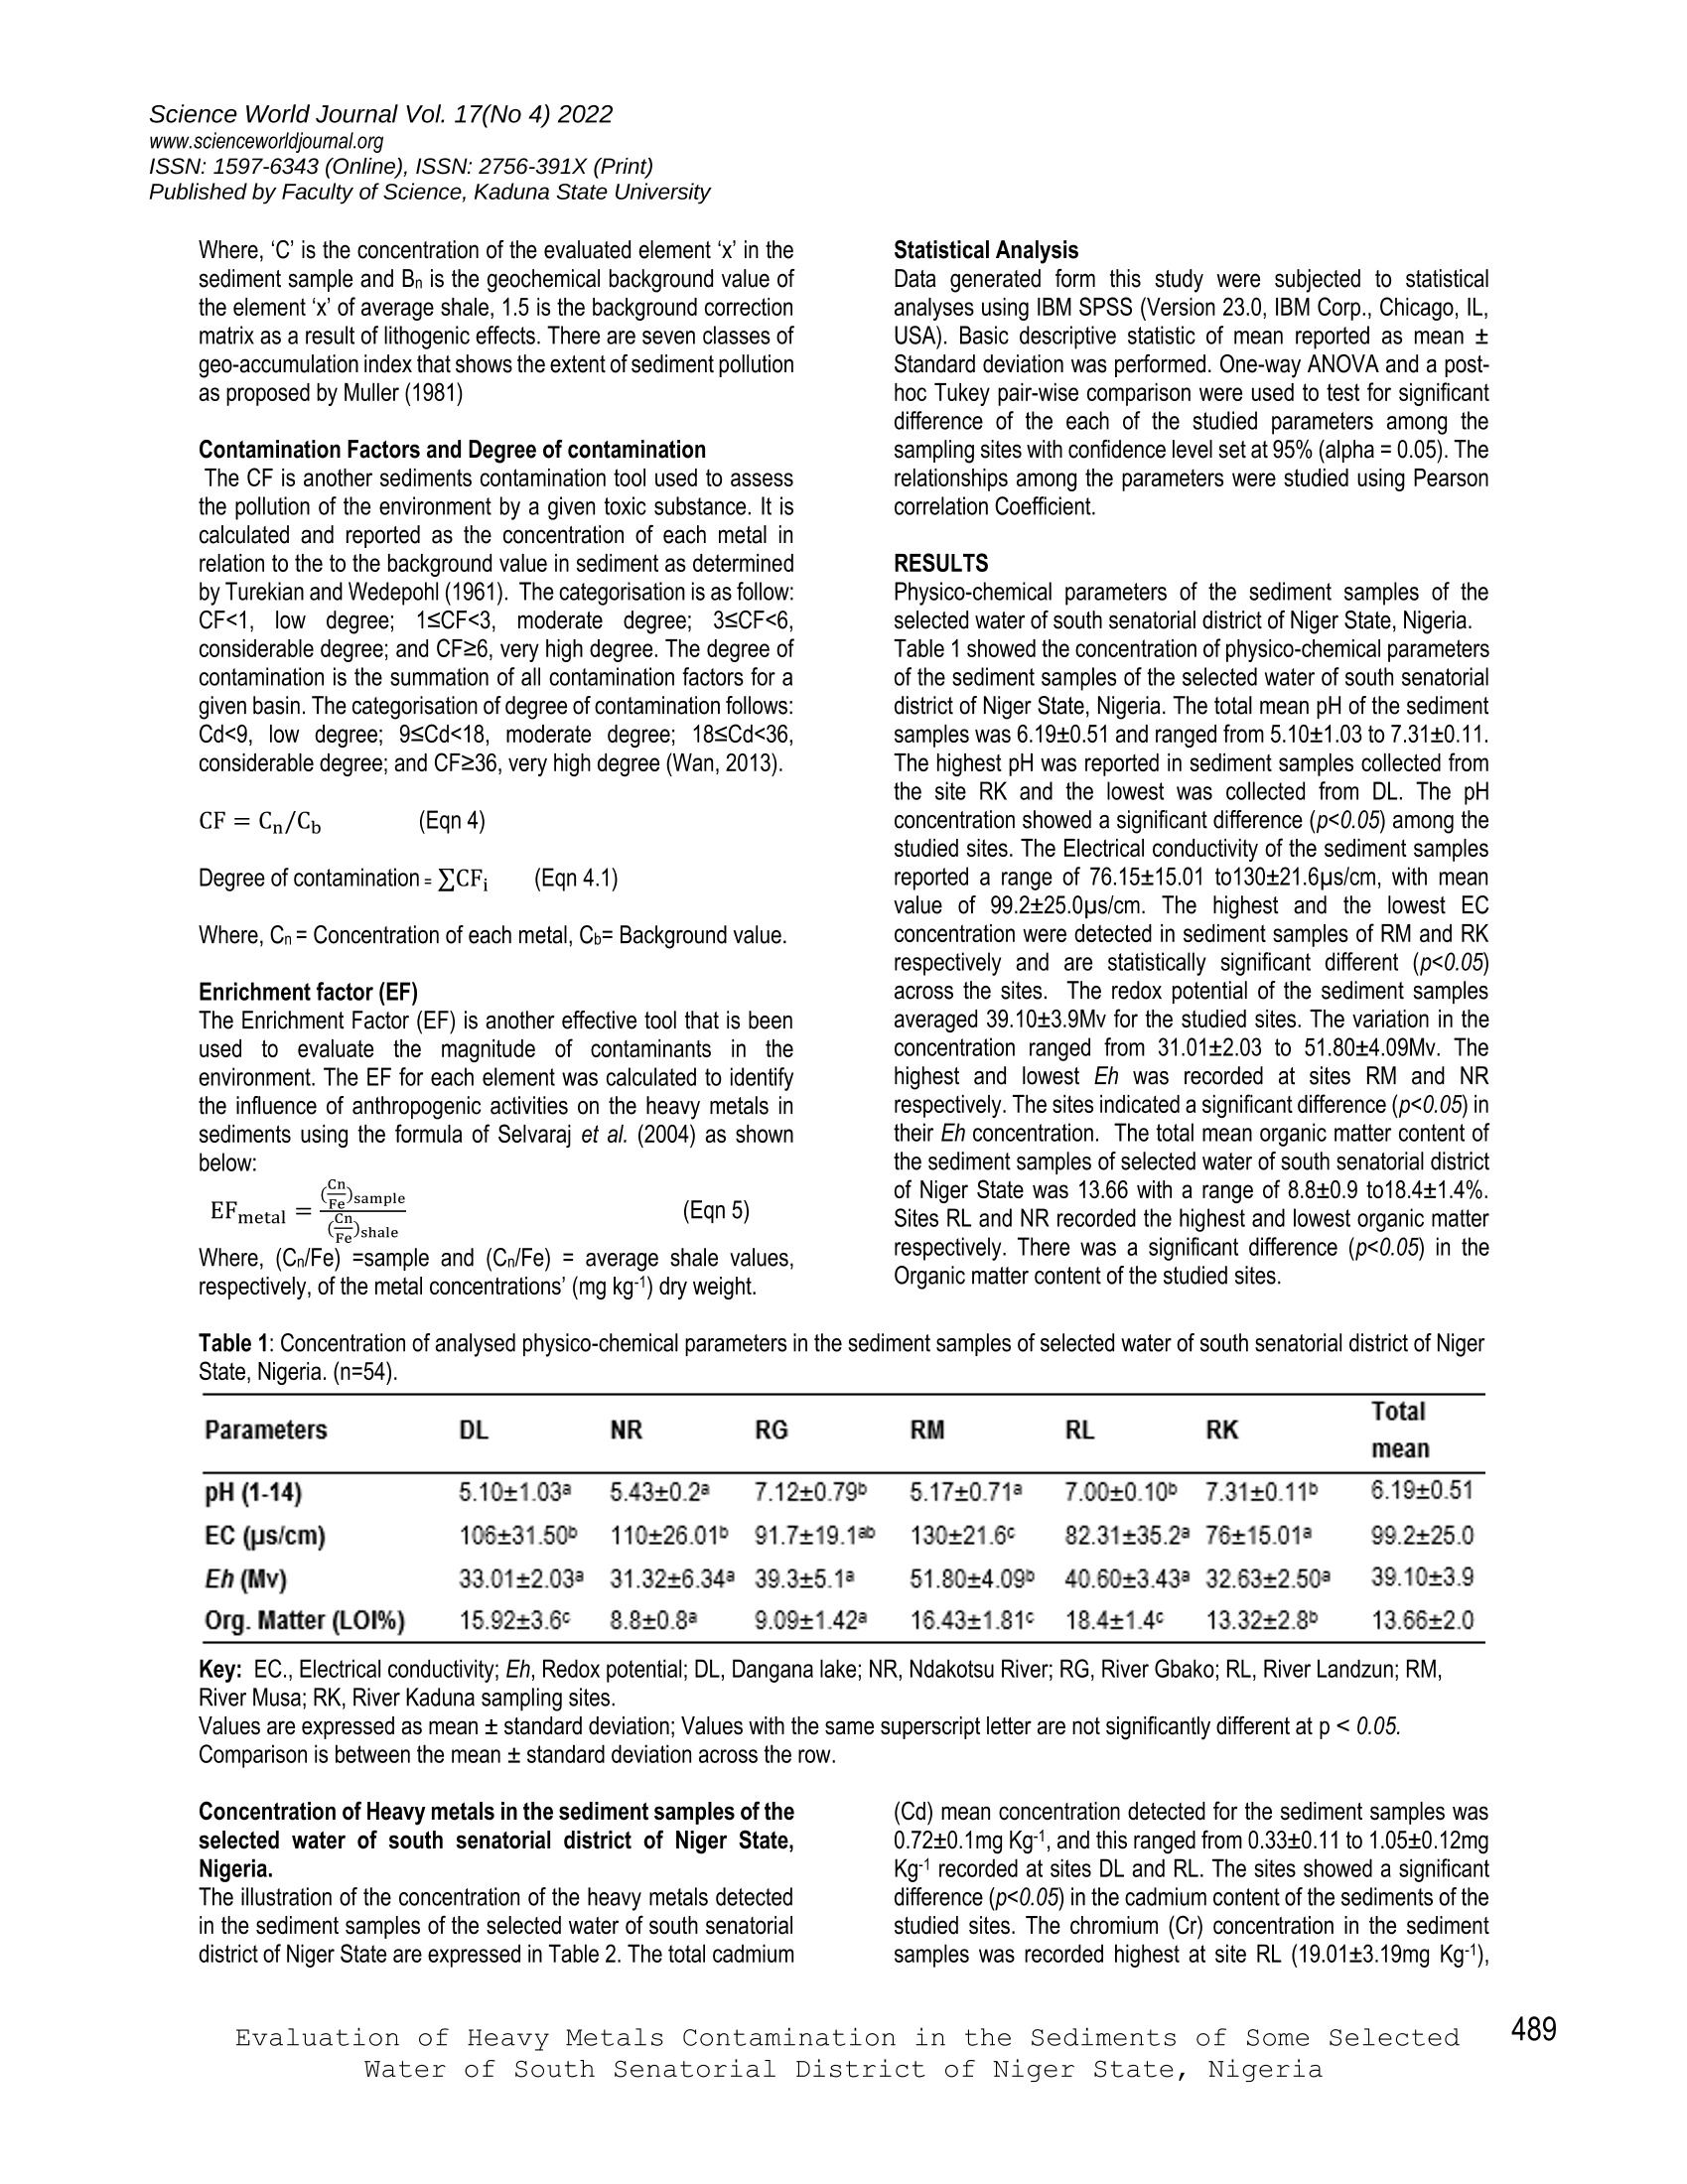
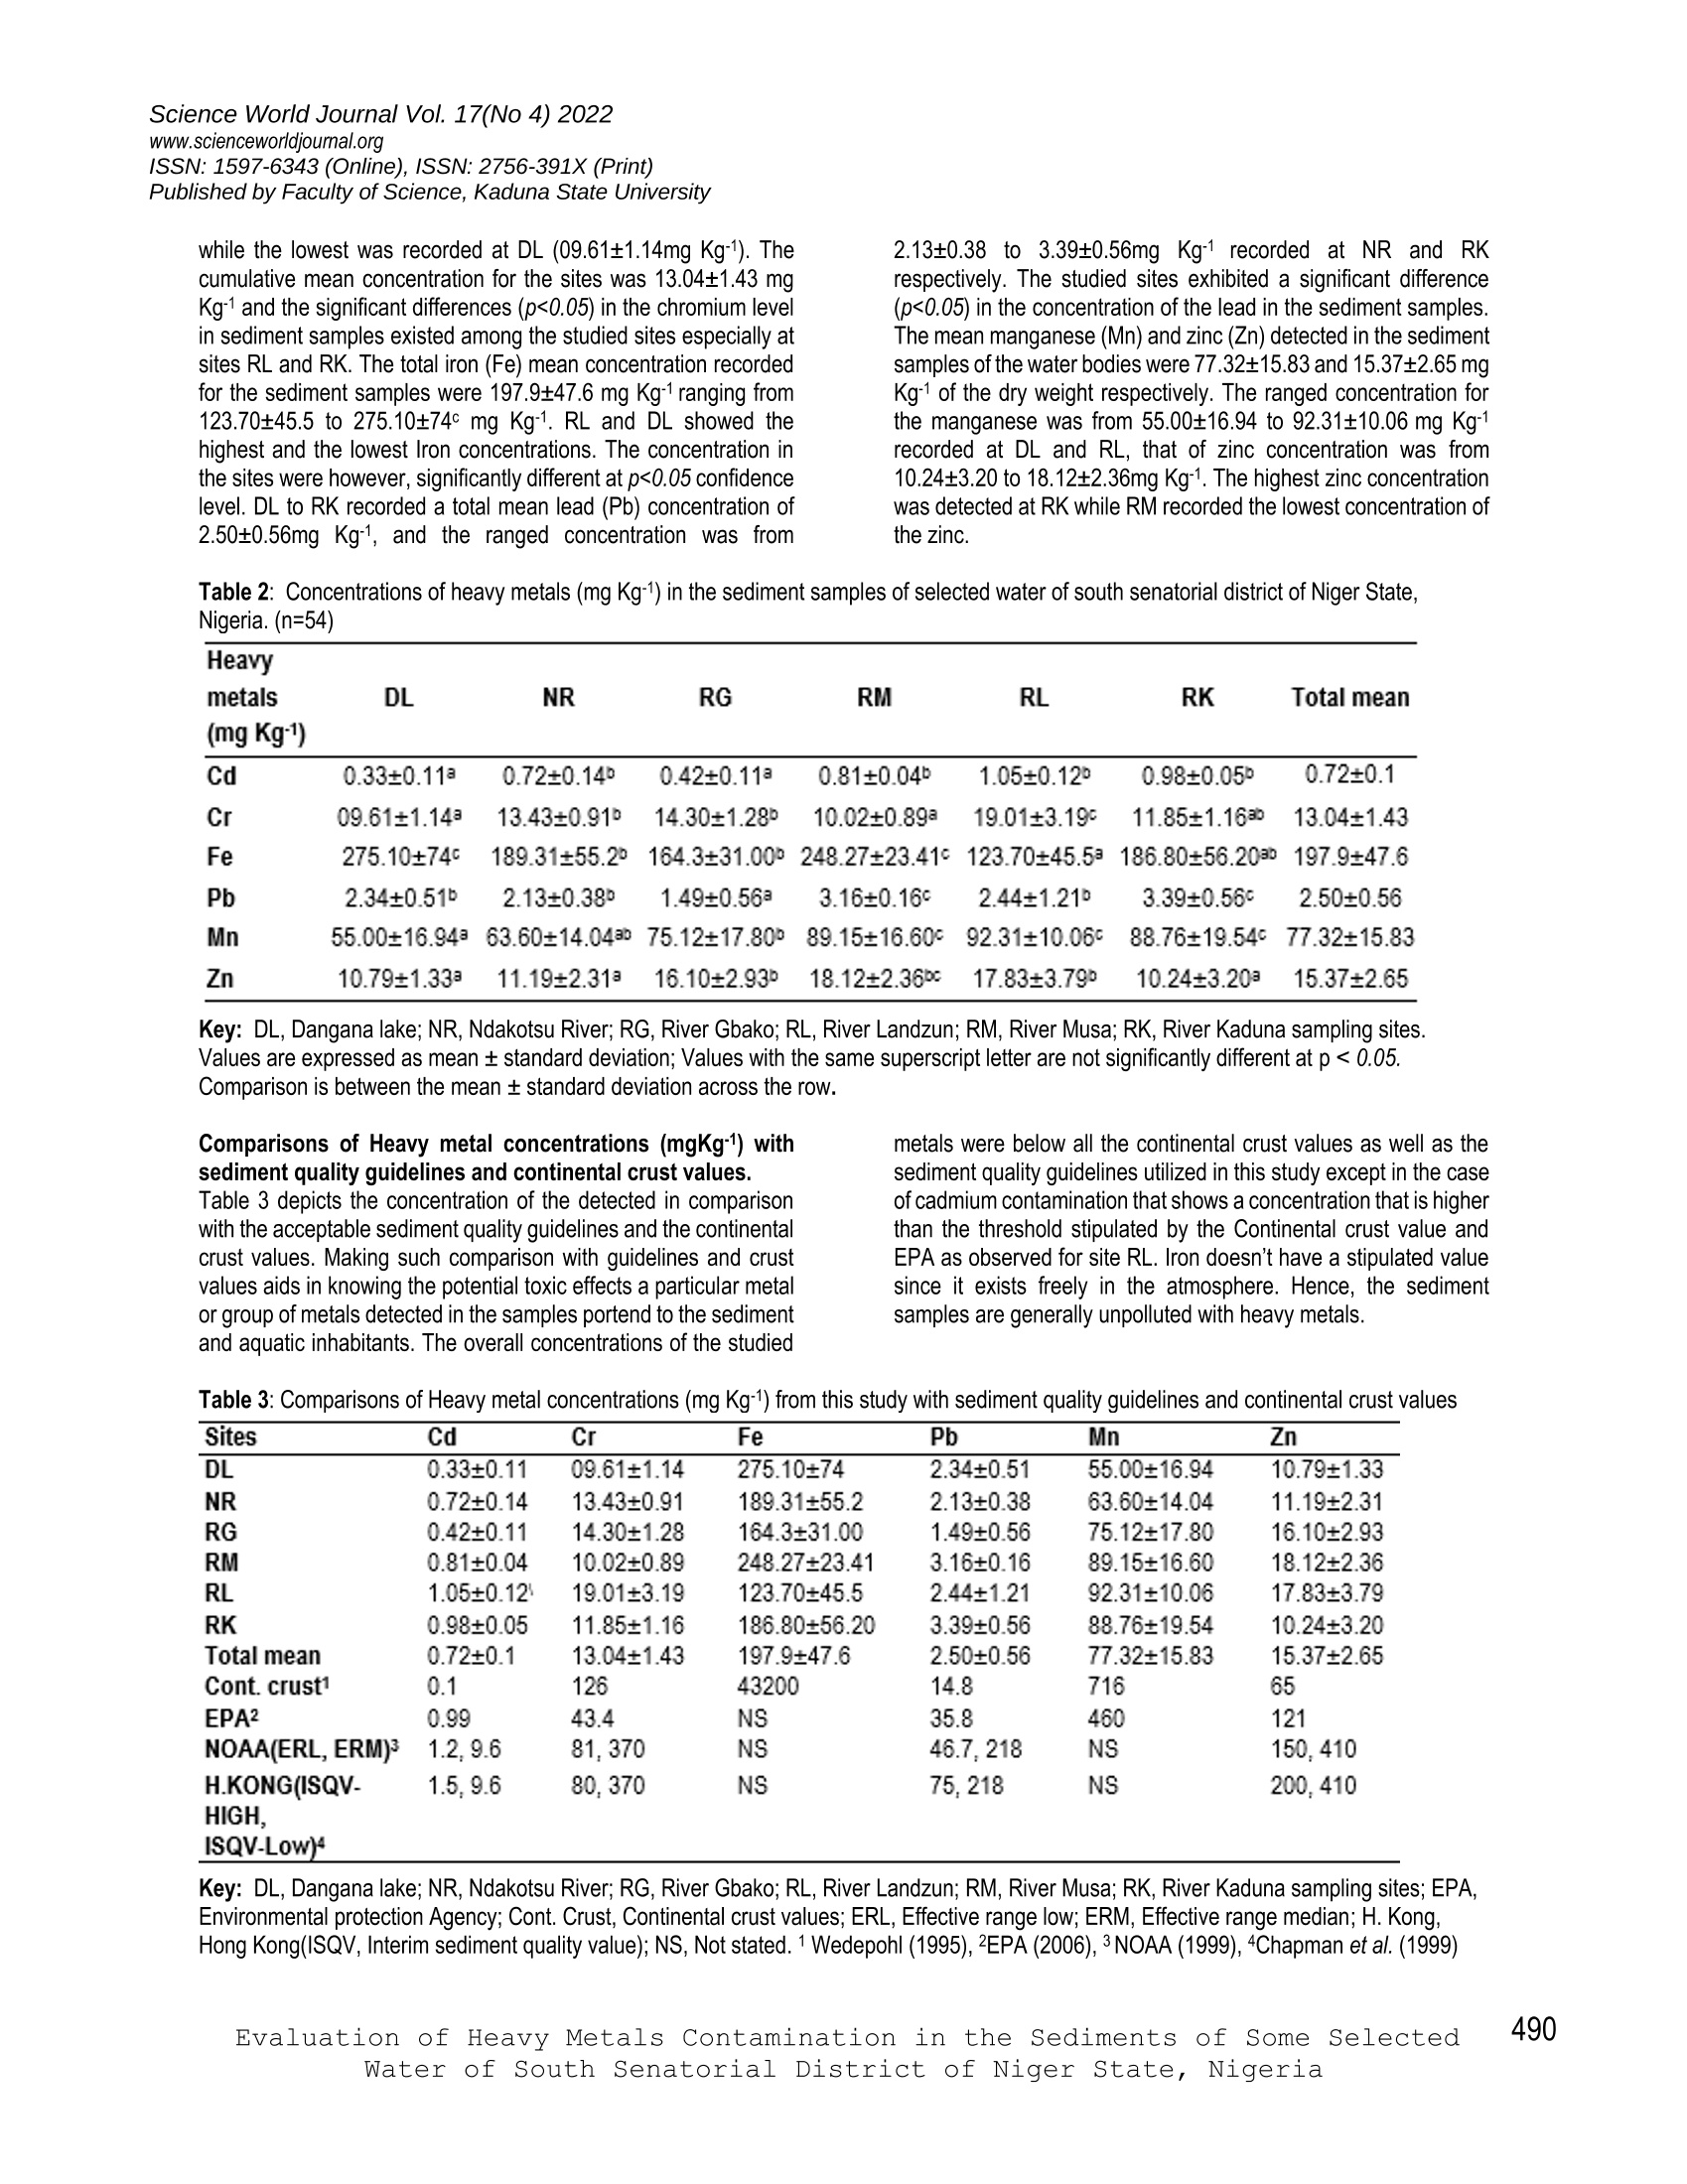
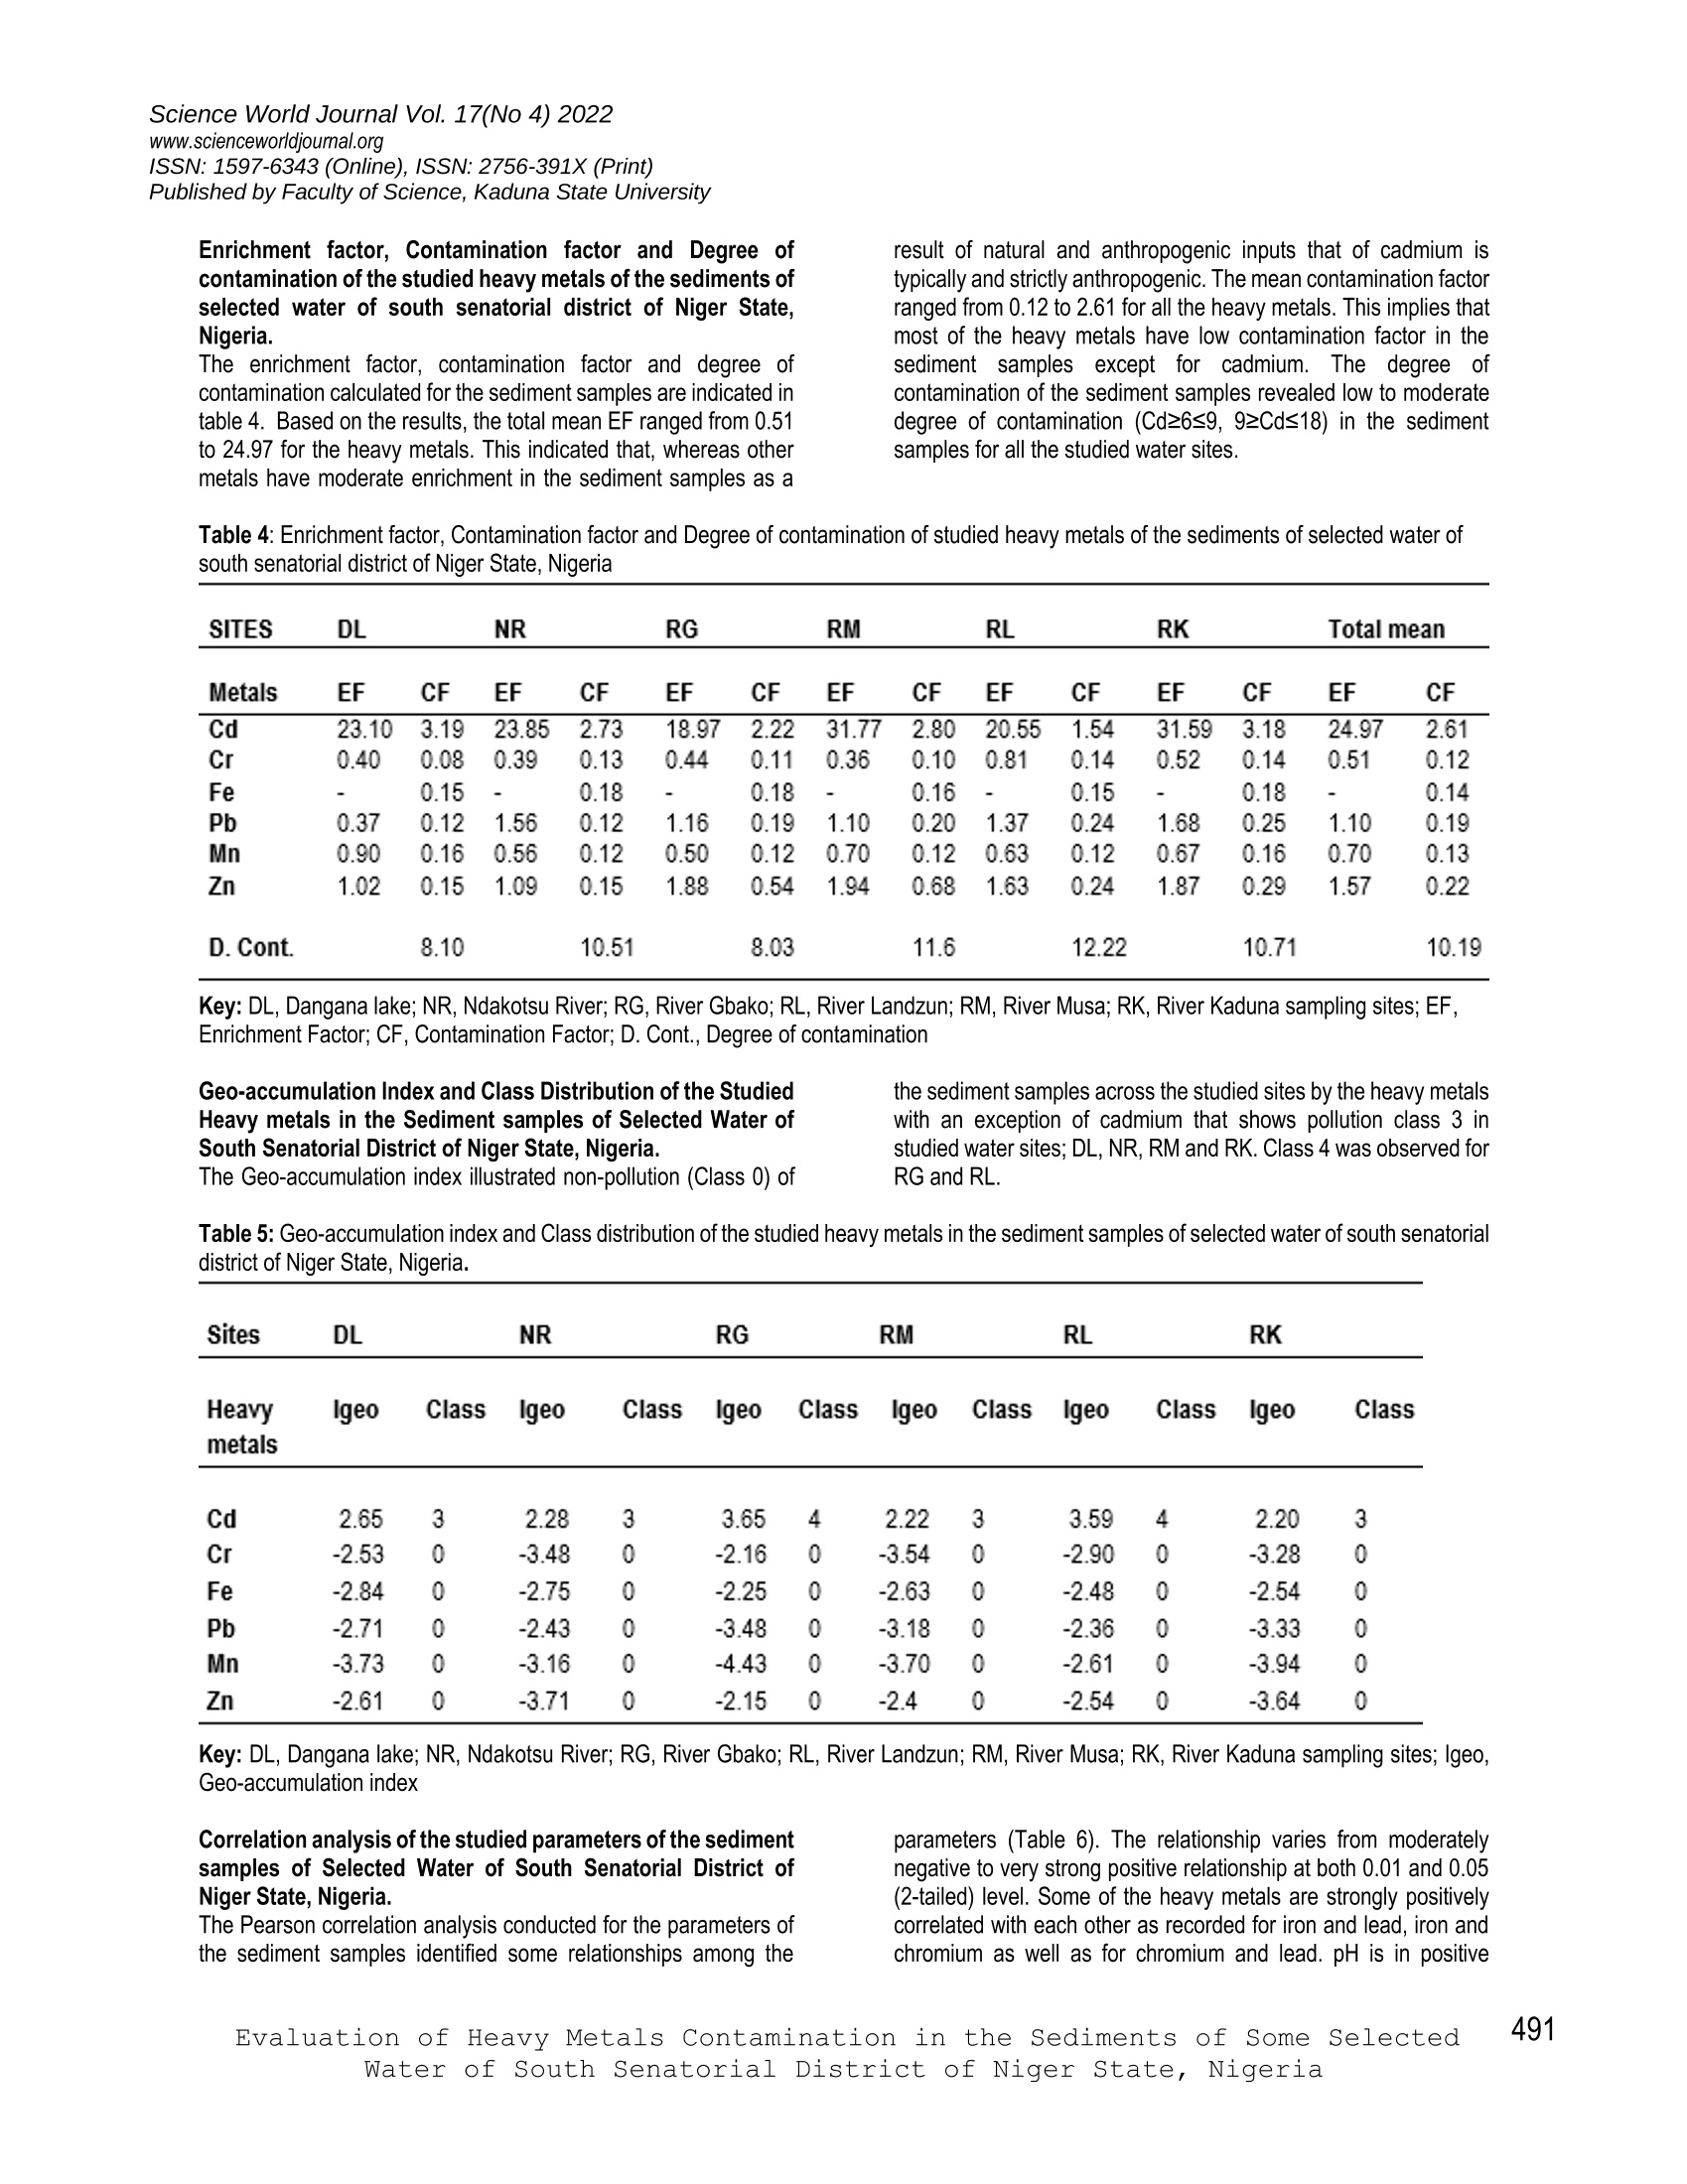
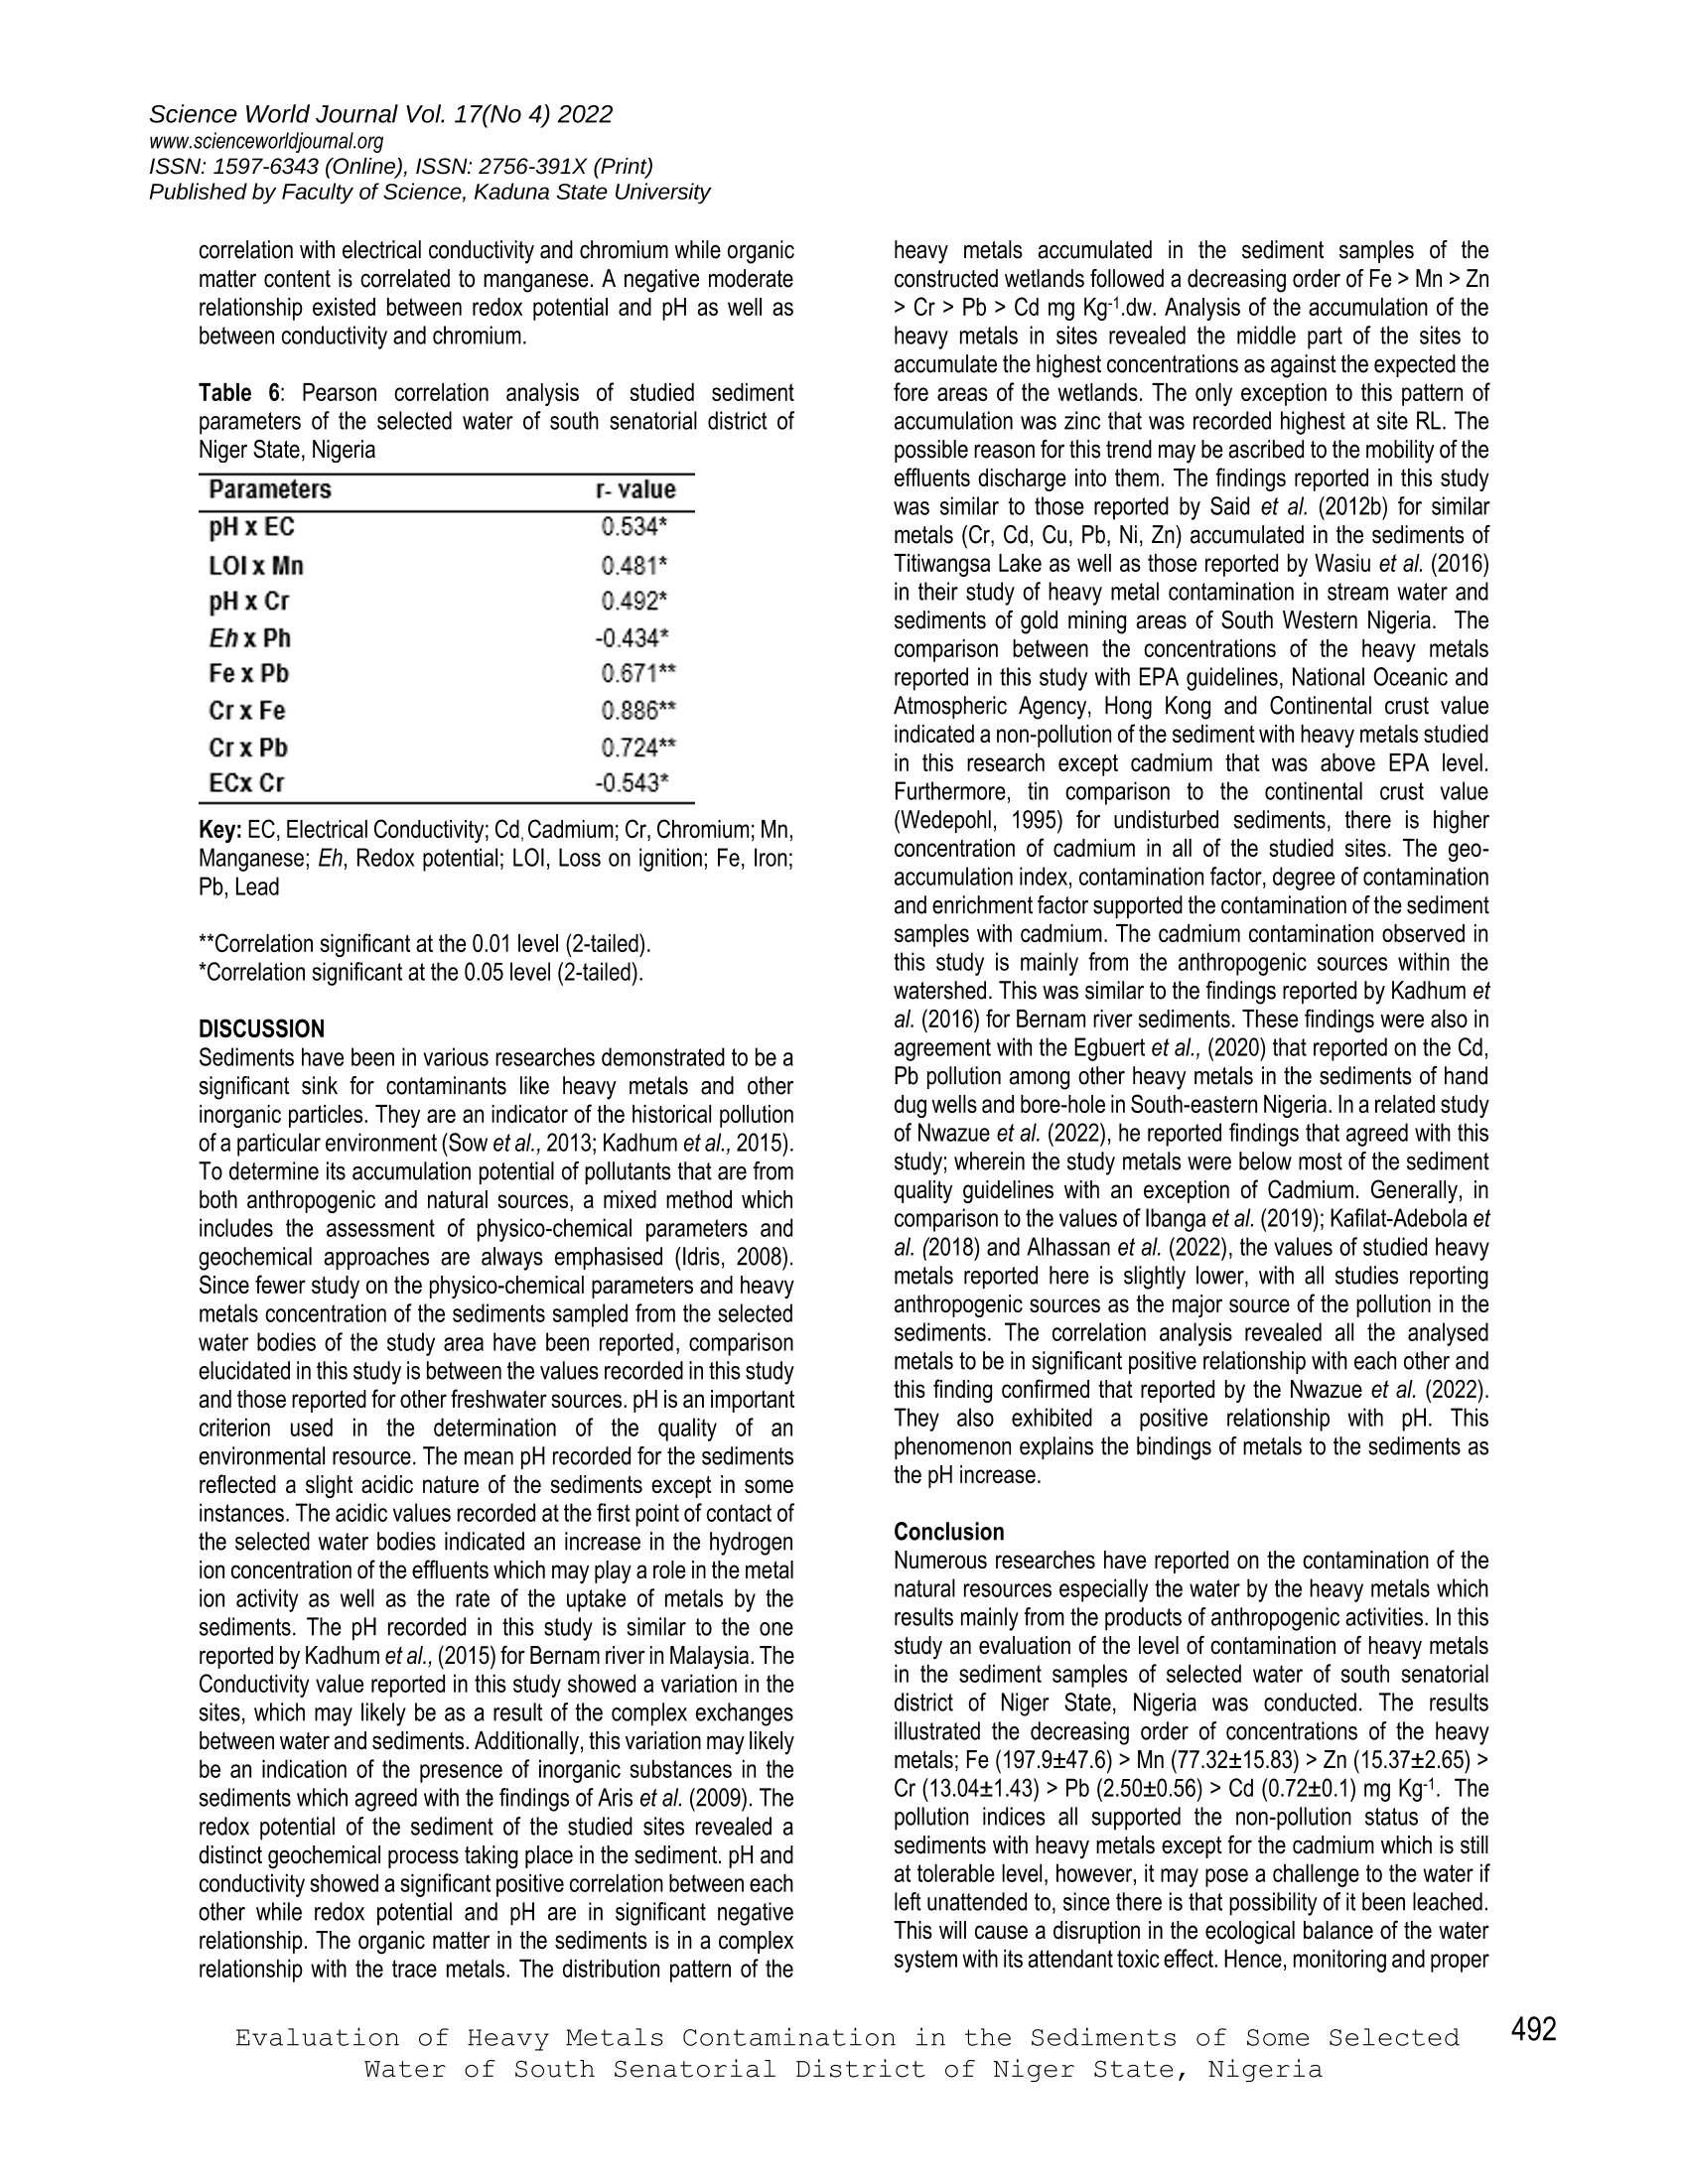
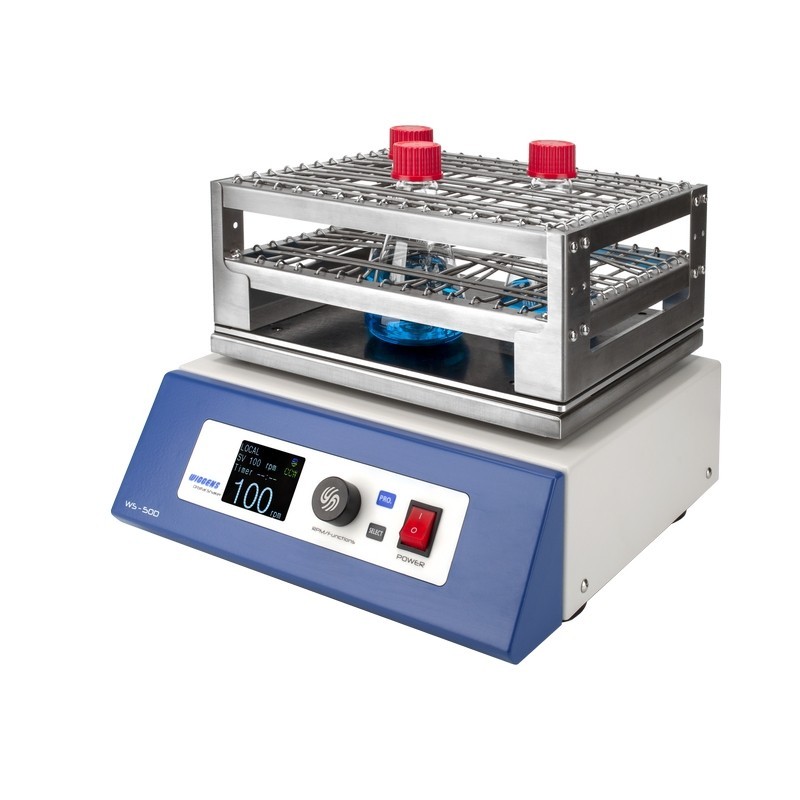
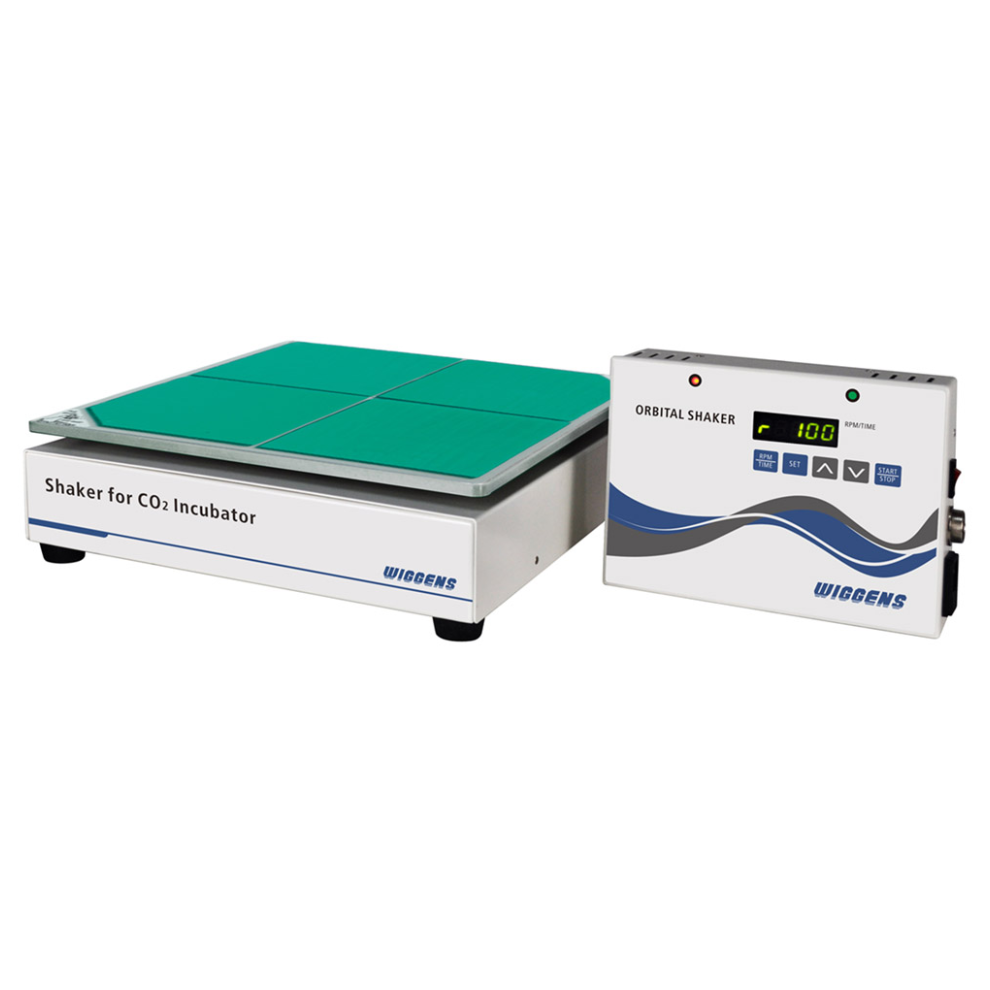
部分选定水体沉积物中重金属(镉、铬、铁、铅、锰、锌)污染的评价 Evaluation of heavy metals contamination in the sediments of some selected water of South Senatorial District of Niger State, NigeriaDigestion and preparation of sediments samples for Heavy metals analysis. An aqua - regia method of Ismail (1993) with slight modification was used to digest the samples. Briefly, about 1g of pulverized sediment samples and blank samples (without weighted sediments) were digested in solution ratio of 4:1 of 10 mL HNO3 (A.R grade, Bendosen Laboratory Chemicals 65%) and HClO4 (ACS reagent grade, Panreac 60%) into a pre-heated Kjeldatherm block digestion unit (Gerhardt, Königswinter, Germany) at low temperature of 400C for 1 hour. The temperature was then increased intermittently to 1400C for 3 hours. Distilled water was used with sediments samples in the ratio of 1:2.5. Briefly, 10 g of sediments samples were measured into a glass beaker and 25mL of distilled water was added to it. The beaker was covered and shaken with an orbital shaker for 4hours at 175rpm. 尼日利亚尼日尔州南部参议员区部分选定水体沉积物中重金属Science World Journal Vol. 17(No 4) 2022(镉、铬、铁、铅、锰、锌)污染的评价www.scienceworldjournal.org ISSN: 1597-6343 (Online), ISSN: 2756-391X (Print) Published by Faculty of Science, Kaduna State University Science World Journal Vol. 17(No 4) 2022www.scienceworldjournal.orgISSN: 1597-6343 (Online), ISSN: 2756-391X (Print) EVALUATION OF HEAVY METALS CONTAMINATION IN THE SEDIMENTS OF SOME SELECTED WATER OF SOUTH SENATORIAL DISTRICT OF NIGER STATE, NIGERIA Yunusa Audu*, Aliyu Danjuma Aliyu, Naomi John Dadi-Mamud 尼日利亚巴达马西巴班吉达大学自然科学学院生物科学系 Department of Biological Sciences, Faculty of Natural Sciences, Ibrahim Badamasi Babangida University, Lapai, Niger State, Nigeria *Corresponding Author Email Address: abduldaudu@yahoo.co.uk ABSTRACT The present study was conducted to evaluate the level of contamination of heavy metals in the sediment samples of some water of south senatorial district of Niger State, Nigeria. Composite surfacesedimentsamples(54)werecollectedfromthefore, middle, and rear parts of the six (6) selected water bodies; digested and analysed for heavy metal concentration following the standard methods. The results obtained illustrated the decreasing concentrations of the heavy metals in the order of Fe (197.9±47.6)> Mn (77.32±15.83) > Zn (15.37±2.65) > Cr (13.04±1.43) > Pb (2.50±0.56) > Cd (0.72±0.1) mg Kg-1. The overall concentrations of the studied metals were below the continental crust values as wellasthesedimentqualityguidelinesutilizedinthisstudy. Enrichment Factor (0.51 to 24.97) indicated a no to moderate enrichment for the heavy metals. The contamination factor ranged from 0.22 to 2.61 for the heavy metals. The degree of contamination of the sediment samples revealed a low degree of contamination in the sediment samples for all the sites. The geo-accumulation index illustrated none to moderate pollution (Class 0,3,4) of the sediment samples by the heavy metals. However, a negative moderate relationship existed between redox potential and pH; and between conductivity and chromium showing their dependence on each other. Thus, this study presents an indication of heavy metal contamination process in the selected water bodies and may serves a guide to other studies of metropolitan water bodies in order to determine for suitable remediation procedure. Keywords: Heavy metals, Continental crust value, Metropolis, sediment quality guidelines. INTRODUCTION The deleterious effects of the metals as contaminants/pollutants of aquaticenvironmenthavebeenreportedinnumerousstudies acrosstheworld(Nwazue etal.,2022;Egbuert etal.,2020; Hounkpe et al., 2017; Nasrabadi et al., 2010). The term ‘Heavy metal has been ascribed to a very wide range of elements with soil concentration that is less than 100 mg Kg-1or and densities of more than 5 g cm3 (Hooda, 2010). Their existence in nature occurs as metalspartoftheearthcrust.Thesemetalsconstitutemajor contaminants in the ground water, freshwater, industrial effluent, marine water, and even treated wastewater (Hogan, 2012). Thirteen of these heavy metals (Al, Sb, Cd, Ag, Se, Be, As, Fe, Mn, Ni, Cr, Zn, and Pb) have been identified as priority pollutants by the United State Environmental Protection Agency (USEPA) and placed in the most hazardous contaminants on the hazardous substance priority list (USEPA, 2012). The bio-magnification of these metals into the food chain through phytoplankton and aquatic organisms portend a health risk to humans (WHO, 2004; Alkharki et al., 2009a; Ubiogoro and Adeyemo, 2017). Industrialisation and vast economic advancement accounts for the considerable portion of heavy metals that got into the water bodies. Other source point and non-source point includes atmospheric particulates deposition, disposal of metal and metalloid enriched sewage sludges and sewage effluents, and by-product from metal mining processes and otherprocessingindustries,irrigationofagriculturalfieldsand application of pesticides and fertilizers (Hani and Pazira, 2011; Jackson et al., 2012). Sediments of aquatic bodies represent the significant sources of heavy metal contamination. This is as a result of changes in pH, redox potential within their primary sedimentary sinks (Aliyu et al., 2018). The occurrences of high concentrations of heavy metals in the sediments is an indication of anthropogenic activities rather than natural enrichment through geological weathering (Akan et al., 2010). The sediments played the role of a micro-pollutants trap that indicate the history of the pollution and contamination in water (Hounkpe et al., 2017). Furthermore, based on a literature search of the present research area, fewer work have been published on the contamination status of the sediments of water bodies of the south senatorial district of Niger state using different sediment pollution indices. Thus, this study evaluates the heavy metals contamination of the sediments/the pollution status in the selected water bodies of the south senatorial district of Niger state using different contamination/pollution analysis in order to identify the best remediation processes. MATERIALS AND METHODS Study Area The study areas are located in the south senatorial districts of Niger State otherwise known as Zone A. The senatorial district comprises of eight local governments (Agaie, Bida, Edati, Gbako, Katcha, Lapai, Lavun and Mokwa). The dominant ethnic group found within the region is Nupe. Their major occupation is farming and Fishing. The annual temperature range of the study area is between 22–34°C and the mean annual relative humidity of approximately 85%. The vegetation of the areas is dominated by the Gmeilana arborea , Parkia biglobosa , Azadirachta indica trees as well as grasses that are typical of a savannah zone. The climate presents two distinct seasons, a rainy season that occurs between April and October, and a dry season (November-March). The selected water bodies serve the surrounding towns and villages in irrigation farming, fishing and domestic purposes. The water bodies were; Dangana Lake designated as DL located in Dangana Village of Lapai local government, Ndakotsu River (NR) located along the boundary of Lapai and Agaie local government, River Gbako (RG) of Badeggi town in Katcha local government, River Musa (RM) along Lemu road in Gbako local government, River Landzun (RL) in Bida local Published by Faculty of Science, Kaduna State University government and River Kaduna (RK) located in Wuya town of Lavun local government respectively. Fig. 1: Geographical location of South Senatorial District of Niger State (Zone A) (Babalobi and Alhaji, 2018) Sediment sampling and sample preparation. Compositesediments (54)sampleswerecollectedfromthe sampling sites which was divided into front, middle and rear from the depth of 0.5 to 1cm with the aid of plastic scooper and placed into sterile plastic containers. The collected samples were then transported to the laboratory in an iced condition. The samples were further checked for the plant particles and removed accordingly. Oven drying (Memmert universal Oven, Schwabach, Germany) of the samples was achieved at 700C until a constant dry weightwasattained.Thesampleswerefurtherhomogenised through grinding with a ceramic mortar and pestle. The samples were subsequently sieved through a mesh screen having a diameter of 2 mm and 63µm and stored in a contamination free polythene container until further analysis. Digestion and preparation of sediments samples for Heavy metals analysis. An aqua - regia method of Ismail (1993) with slight modification was usedtodigestthesamples.Briefly,about1gofpulverized sediment samples and blank samples (without weighted sediments) were digested in solution ratio of 4:1 of 10 mL HNO3(A.R grade, Bendosen Laboratory Chemicals 65%) and HClO4(ACS reagent grade, Panreac 60%) into a pre-heated Kjeldatherm blockdigestionunit(Gerhardt,Königswinter,Germany)atlow temperatureof 400C for 1 hour. The temperature was then increased intermittently to 1400C for 3 hours. The samples were then left to cool and added up to 15 mL with double-distilled water. The samples were filtered through a Whatman No_ 1 filter paper into pre-sterilised volumetric flasks. Physico-chemical analysis of the Sediment Samples of Selected Water of South Senatorial District of Niger State, Nigeria. The physico-chemical assessments ofthe sediment samples collected from the Of Selected Water of South Senatorial District of Niger State, Nigeria. was the evaluation of the pH, EC, Eh , and LOI. The pH, EC and Eh concentration of the sediments were determined according to the methods of Radojević and Bashkin,(2007) with slight modification where necessary. Distilled water was used with sediments samples in the ratio of 1:2.5. Briefly, 10 g of sediments samples were measured into a glass beaker and 25mL of distilled water was added to it. The beaker was covered and shaken with an orbital shaker for 4hours at 175rpm. The solution was then read with multi-parameter analyser. The organic matter content of the sediment samples was determined according to the methods of Arain et al. (2008), Radojevic and Bashkin,(2007); expressed as loss on ignition of an oven dried samples at 550±250C until the constant weight is achieved. The method was based on calculating the differences between the dry weight of samples before and after undergoing ashing in a muffle furnace. The calculation of the total organic matter is reported in percentage following the equation below: LOI (%) = (W1−W2/WI) ∗ 100 (Eqn 1) Where, W1 is the initial sample weight before ignition, while W2 is the weight of the sediment samples after ignition at 5500C. 镉、铬、铁、铅、锰、锌 Evaluation of the Heavy Metals Concentrations in the SedimentSamplesofSelectedWaterofSouthSenatorial District of Niger State, Nigeria. Heavy metals (214.44Cd, 267.72Cr, 238.20Fe, 220.35Pb, 257.61Mn, 206.20Zn) concentrationsin sedimentsamplesweredetermined by the evaluation of the digested samples which was carried out by using the Atomic Absorption Spectrophotometer (AAS model: Accusys 211USA).Theaccuracyofthemethodusedwasassessed through the analysis of the appropriate Standard Reference Material the same way the samples were analysed. The data obtained from the analysis of the sediments samples were expressed in mg kg-1 of dry weight by converting the obtained results in mg L-1 using the equation stated below: Concentration of Heavy metals in mg Kg-1 = (A 2B)x V (Eqn 2). W Where ‘A’ is the concentration of the heavy metal in the sample (mg L-1) ‘B’ is the concentration of heavy metal in the blank prepared (mg L-1), ‘V’ is the volume of digest (15mL) and, ‘W’ is the weight of the sample (g) (Temminghoff and Houba, 2004). The metal recovery rate ranges between 92 to 111% and considered satisfactory. Standard Sediments Quality Guidelines Thesediment quality guidelines are effective and important numerical tools developed to evaluate the biological importance of the heavy metals (Mucha et al., 2003). They are used in making a comparison between the sediment contamination concentration with their corresponding guidelines. The SQGs utilized in this study include; Freshwater Sediment Screening Benchmark, Canadian Sediments Quality Guidelines for the protection of Aquatic Life and HongKongQualityGuideline.Forthepurposeofcalculating different Sediment pollution indices, the background values adopted in this study was Continental Crust values referenced after Wedepohl (1995) since there is no available background data for the study area. Geo- accumulation Index The heavy metal contamination level in sediment could be assessed by determining the Igeo. The Igeo has often been reportedly used in the evaluation of soil and sediment contamination (Santos-Bermejo et al., 2003). To characterize the level of contamination in the sediment, Igeo values were always calculated using the equation below. Where, ‘C’ is the concentration of the evaluated element ‘x’ in the sediment sample and Bn is the geochemical background value of the element ‘x’ of average shale, 1.5 is the background correction matrix as a result of lithogenic effects. There are seven classes of geo-accumulation index that shows the extent of sediment pollution as proposed by Muller (1981) Contamination Factors and Degree of contamination The CF is another sediments contamination tool used to assess the pollution of the environment by a given toxic substance. It is calculated and reported as the concentration of each metal in relation to the to the background value in sediment as determined by Turekian and Wedepohl (1961). The categorisation is as follow:CF<1, low degree; 1≤CF<3, moderate degree; 3≤CF<6, considerable degree; and CF≥6, very high degree. The degree of contamination is the summation of all contamination factors for a given basin. The categorisation of degree of contamination follows:Cd<9, lowdegree;9≤Cd<18, moderate degree;18≤Cd<36, considerable degree; and CF≥36, very high degree (Wan, 2013). CF= Cn/Cb (Eqn 4) Degree of contamination = ∑CFi (Eqn 4.1) Where, Cn = Concentration of each metal, Cb= Background value. Enrichment factor (EF) The Enrichment Factor (EF) is another effective tool that is been used to evaluate the magnitude of contaminants in the environment. The EF for each element was calculated to identify the influence of anthropogenic activities on the heavy metals in sediments using the formula of Selvaraj et al. (2004) as shown below: Where, (Cn/Fe) =sample and (Cn/Fe) = average shale values, respectively, of the metal concentrations’ (mg kg-1) dry weight. Statistical Analysis Datageneratedformthisstudyweresubjectedtostatistical analyses using IBM SPSS (Version 23.0, IBM Corp., Chicago, IL, USA). Basic descriptive statistic of mean reported as mean ±Standard deviation was performed. One-way ANOVA and a post-hoc Tukey pair-wise comparison were used to test for significant differenceoftheeachofthestudiedparametersamongthe sampling sites with confidence level set at 95% (alpha = 0.05). The relationships among the parameters were studied using Pearson correlation Coefficient. RESULTS Physico-chemicalparametersofthesedimentsamplesofthe selected water of south senatorial district of Niger State, Nigeria. Table 1 showed the concentration of physico-chemical parameters of the sediment samples of the selected water of south senatorial district of Niger State, Nigeria. The total mean pH of the sediment samples was 6.19±0.51 and ranged from 5.10±1.03 to 7.31±0.11. The highest pH was reported in sediment samples collected from thesiteRKandthelowestwascollectedfromDL.ThepH concentration showed a significant difference (p<0.05) among the studied sites. The Electrical conductivity of the sediment samples reported a range of 76.15±15.01 to130±21.6µs/cm, with mean value of 99.2±25.0µs/cm. The highest and the lowest EC concentration were detected in sediment samples of RM and RK respectively and are statistically significantdifferent(p<0.05) across the sites. The redox potential of the sediment samples averaged 39.10±3.9Mv for the studied sites. The variation in the concentrationrangedfrom31.01±2.03to51.80±4.09Mv.The highest and lowest Eh was recorded at sites RM and NR respectively. The sites indicated a significant difference (p<0.05) in their Eh concentration. The total mean organic matter content of the sediment samples of selected water of south senatorial district of Niger State was 13.66 with a range of 8.8±0.9 to18.4±1.4%. Sites RL and NR recorded the highest and lowest organic matter respectively. There was a significant difference (p<0.05) in the Organic matter content of the studied sites. Table 1: Concentration of analysed physico-chemical parameters in the sediment samples of selected water of south senatorial district of Niger State, Nigeria. (n=54). Parameters DL NR RG RM RL RK Total mean pH(1-14) 5.10±1.03a 5.43±0.2a 7.12±0.79b 5.17±0.71a 7.00±0.10b 7.31±0.11b 6.19±0.51 EC (ps/cm) 106±31.505 110±26.01b 91.7±19.18b 130±21.6c 82.31±35.28 76±15.01a 99.2±25.0 Eh (MV) 33.01±2.038 31.32+6.348 39.3±5.1a 51.80±4.09h 40.60±3.438 32.63±2.50= 39.10±3.9 Org. Matter (L0I%) 15.92±3.6C 8.8±0.8= 9.09±1.42= 16.43±1.81C 18.4±1.4C 13.32±2.85 13.66±2.0 Key: EC., Electrical conductivity; Eh , Redox potential; DL, Dangana lake; NR, Ndakotsu River; RG, River Gbako; RL, River Landzun; RM, River Musa; RK, River Kaduna sampling sites. Values are expressed as mean ± standard deviation; Values with the same superscript letter are not significantly different at p ˂ 0.05. Comparison is between the mean ± standard deviation across the row. Concentration of Heavy metals in the sediment samples of the selectedwaterofsouthsenatorialdistrictofNigerState, Nigeria. The illustration of the concentration of the heavy metals detected in the sediment samples of the selected water of south senatorial district of Niger State are expressed in Table 2. The total cadmium (Cd) mean concentration detected for the sediment samples was 0.72±0.1mg Kg-1, and this ranged from 0.33±0.11 to 1.05±0.12mg Kg-1 recorded at sites DL and RL. The sites showed a significant difference (p<0.05) in the cadmium content of the sediments of the studied sites. The chromium (Cr) concentration in the sediment samples was recorded highest at site RL (19.01±3.19mg Kg-1), while the lowest was recorded at DL (09.61±1.14mg Kg-1). The cumulative mean concentration for the sites was 13.04±1.43 mg Kg-1 and the significant differences (p<0.05) in the chromium level in sediment samples existed among the studied sites especially at sites RL and RK. The total iron (Fe) mean concentration recorded for the sediment samples were 197.9±47.6 mg Kg-1 ranging from 123.70±45.5to 275.10±74c mg Kg-1. RL andDL showed the highest and the lowest Iron concentrations. The concentration in the sites were however, significantly different at p<0.05 confidence level. DL to RK recorded a total mean lead (Pb) concentration of 2.50±0.56mg Kg-1, and the ranged concentration was from 2.13±0.38 to 3.39±0.56mg Kg-1 recorded at NR and RK respectively. The studied sites exhibited a significant difference (p<0.05) in the concentration of the lead in the sediment samples. The mean manganese (Mn) and zinc (Zn) detected in the sediment samples of the water bodies were 77.32±15.83 and 15.37±2.65 mg Kg-1 of the dry weight respectively. The ranged concentration for the manganese was from 55.00±16.94 to 92.31±10.06 mg Kg-1recordedatDLandRL,thatofzincconcentrationwasfrom 10.24±3.20 to 18.12±2.36mg Kg-1. The highest zinc concentration was detected at RK while RM recorded the lowest concentration of the zinc. Table 2: Concentrations of heavy metals (mg Kg-1) in the sediment samples of selected water of south senatorial district of Niger State, Nigeria. (n=54) Heavy metas DL NR RG RM RL RK lotal mean (mg Kg) Cd 0.33±0.11日 0.72±0.14b 0.42±0.118 0.81±0.04b 1.05±0.12 0.98±0.05 0.72±0.1 Cr 09.61±1.148 13.43±0.91b 14.30±1.28 10.02±0.898 19.01±3.19 11.85±1.163 13.04±1.43 Fe 275.10±74 189.31±55.20 164.3±31.00 248.27±23.41: 123.70±45.5 186.80±56.20301 197.9±47.6 Pb 2.34±0.51b 2.13±0.38 1.49±0.56= 3.16±0.16c 2.44±1.21b 3.39±0.56* 2.50±0.56 Mn 55.00±16.943 63.60±14.0430 75.12±17.800 89.15±16.60洒92.31±10.060 88.76±19.540 77.32±15.83 Zn 10.79±1.333 11.19±2.31= 16.10±2.93 18.12±2.36DC 17.83±3.79 10.24±3.203 15.37±2.65 Key: DL, Dangana lake; NR, Ndakotsu River; RG, River Gbako; RL, River Landzun; RM, River Musa; RK, River Kaduna sampling sites. Values are expressed as mean ± standard deviation; Values with the same superscript letter are not significantly different at p ˂ 0.05. Comparison is between the mean ± standard deviation across the row . Comparisons of Heavy metal concentrations (mgKg-1) with sediment quality guidelines and continental crust values. Table 3 depicts the concentration of the detected in comparison with the acceptable sediment quality guidelines and the continental crust values. Making such comparison with guidelines and crust values aids in knowing the potential toxic effects a particular metal or group of metals detected in the samples portend to the sediment and aquatic inhabitants. The overall concentrations of the studied metals were below all the continental crust values as well as the sediment quality guidelines utilized in this study except in the case of cadmium contamination that shows a concentration that is higher than the threshold stipulated by the Continental crust value and EPA as observed for site RL. Iron doesn’t have a stipulated value sinceitexistsfreelyintheatmosphere.Hence,thesediment samples are generally unpolluted with heavy metals. Enrichment factor, Contamination factor and Degree of contamination of the studied heavy metals of the sediments of selectedwaterofsouthsenatorialdistrictofNigerState, Nigeria. The enrichment factor, contamination factor and degree of contamination calculated for the sediment samples are indicated in table 4. Based on the results, the total mean EF ranged from 0.51to 24.97 for the heavy metals. This indicated that, whereas other metals have moderate enrichment in the sediment samples as a result of natural and anthropogenic inputs that of cadmium is typically and strictly anthropogenic. The mean contamination factor ranged from 0.12 to 2.61 for all the heavy metals. This implies that most of the heavy metals have low contamination factor in the sediment samples except for cadmium. The degree of contamination of the sediment samples revealed low to moderate degree of contamination (Cd≥6≤9, 9≥Cd≤18) in the sediment samples for all the studied water sites. Table 4: Enrichment factor, Contamination factor and Degree of contamination of studied heavy metals of the sediments of selected water of south senatorial district of Niger State, Nigeria SITES DL NR RG RM RL RK Total mean Metals EF CF EF CF EF CF EF CF EF CF EF CF EF CF Cd 23.10 3.19 23.85 2.73 18.97 2.22 31.77 2.80 20.5b 1.54 31.59 3.18 24.97 2.61 Cr 0.40 0.08 0.39 0.13 0.44 0.11 0.36 0.10 0.81 0.14 0.52 0.14 0.51 0.12 Fe 一 0.15 一 0.18 一 0.18 0.16 0.15 一 0.18 - 0.14 Pb 0.37 0.12 1.56 0.12 1.16 0.19 1.10 0.20 1.37 0.24 1.68 0.25 1.10 0.19 Mn 0.90 0.16 0.56 0.12 0.50 0.12 0.70 0.12 0.63 0.12 0.67 0.16 0.70 0.13 Zn 1.02 0.15 1.09 0.15 1.88 0.54 1.94 0.68 1.63 0.24 1.87 0.29 1.57 0.22 D. Cont. 8.10 10.51 8.03 11.6 12.22 10.71 10.19 Key: DL, Dangana lake; NR, Ndakotsu River; RG, River Gbako; RL, River Landzun; RM, River Musa; RK, River Kaduna sampling sites; EF, Enrichment Factor; CF, Contamination Factor; D. Cont., Degree of contamination Geo-accumulation Index and Class Distribution of the Studied Heavy metals in the Sediment samples of Selected Water of South Senatorial District of Niger State, Nigeria. The Geo-accumulation index illustrated non-pollution (Class 0) of the sediment samples across the studied sites by the heavy metals with an exception of cadmium that shows pollution class 3 in studied water sites; DL, NR, RM and RK. Class 4 was observed for RG and RL. Table 5: Geo-accumulation index and Class distribution of the studied heavy metals in the sediment samples of selected water of south senatorial district of Niger State, Nigeria . Sites DL NR RG RM RL RK Heavy Igeo Class Igeo Class Igeo Class Igeo Class Igeo Class Igeo Class metas Cd 2.55 3 2.28 3 3.65 4 2.22 3 3.59 4 2.20 3 Cr -2.53 0 -3.48 0 -2.16 0 -3.54 0 -2.90 0 -3.28 0 Fe -2.84 0 -2.75 0 -2.25 0 -2.63 0 -2.48 0 -254 0 Pb -2.71 0 -2.43 0 -3.48 0 -3.18 0 -2.36 0 -3.33 0 Mn -3.73 0 -3.16 0 -4.43 0 -3.70 0 -2.61 0 -3.94 0 Zn -261 0 -3.71 0 -2.15 0 -2.4 0 -2.54 0 -3.64 0 Key: DL, Dangana lake; NR, Ndakotsu River; RG, River Gbako; RL, River Landzun; RM, River Musa; RK, River Kaduna sampling sites; Igeo, Geo-accumulation index Correlation analysis of the studied parameters of the sediment samples of Selected Water of South Senatorial District of Niger State, Nigeria. The Pearson correlation analysis conducted for the parameters of the sediment samples identified some relationships among the parameters (Table 6). The relationship varies from moderately negative to very strong positive relationship at both 0.01 and 0.05(2-tailed) level. Some of the heavy metals are strongly positively correlated with each other as recorded for iron and lead, iron and chromium as well as for chromium and lead. pH is in positive correlation with electrical conductivity and chromium while organic matter content is correlated to manganese. A negative moderate relationship existed between redox potential and pH as well as between conductivity and chromium. Table 6: Pearson correlation analysis of studied sediment parameters of the selected water of south senatorial district of Niger State, Nigeria Parameters r-value pHx EC 0.534* LOIXMn 0.481* pHx Cr 0.492* Ehx Ph -0.434* Fe x Pb 0.671** CrxFe 0.886** Crx Pb 0.724** ECx Cr -0.543* Key: EC, Electrical Conductivity; Cd, Cadmium; Cr, Chromium; Mn, Manganese; Eh , Redox potential; LOI, Loss on ignition; Fe, Iron; Pb, Lead **Correlation significant at the 0.01 level (2-tailed).*Correlation significant at the 0.05 level (2-tailed). DISCUSSION Sediments have been in various researches demonstrated to be a significantsinkforcontaminantslikeheavymetalsandother inorganic particles. They are an indicator of the historical pollution of a particular environment (Sow et al., 2013; Kadhum et al., 2015). To determine its accumulation potential of pollutants that are from both anthropogenic and natural sources, a mixed method which includestheassessmentofphysico-chemicalparametersand geochemical approaches are always emphasised (Idris, 2008). Since fewer study on the physico-chemical parameters and heavy metals concentration of the sediments sampled from the selected water bodies of the study area have been reported, comparison elucidated in this study is between the values recorded in this study and those reported for other freshwater sources. pH is an important criterion used in the determination of the quality of an environmental resource. The mean pH recorded for the sediments reflected a slight acidic nature of the sediments except in some instances. The acidic values recorded at the first point of contact of the selected water bodies indicated an increase in the hydrogen ion concentration of the effluents which may play a role in the metal ion activity as well as the rate of the uptake of metals by the sediments. The pH recorded in this study is similar to the one reported by Kadhum et al., (2015) for Bernam river in Malaysia. The Conductivity value reported in this study showed a variation in the sites, which may likely be as a result of the complex exchanges between water and sediments. Additionally, this variation may likely be an indication of the presence of inorganic substances in the sediments which agreed with the findings of Aris et al. (2009). The redox potential of the sediment of the studied sites revealed a distinct geochemical process taking place in the sediment. pH and conductivity showed a significant positive correlation between each other while redox potential and pH are in significant negative relationship. The organic matter in the sediments is in a complex relationship with the trace metals. The distribution pattern of the heavy metals accumulated in the sediment samples of the constructed wetlands followed a decreasing order of Fe > Mn > Zn > Cr > Pb > Cd mg Kg-1.dw. Analysis of the accumulation of the heavy metals in sites revealed the middle part of the sites to accumulate the highest concentrations as against the expected the fore areas of the wetlands. The only exception to this pattern of accumulation was zinc that was recorded highest at site RL. The possible reason for this trend may be ascribed to the mobility of the effluents discharge into them. The findings reported in this study was similar to those reported by Said et al. (2012b) for similar metals (Cr, Cd, Cu, Pb, Ni, Zn) accumulated in the sediments of Titiwangsa Lake as well as those reported by Wasiu et al. (2016) in their study of heavy metal contamination in stream water and sediments of gold mining areas of South Western Nigeria. The comparisonbetweentheconcentrationsoftheheavymetals reported in this study with EPA guidelines, National Oceanic and AtmosphericAgency,HongKongandContinentalcrustvalue indicated a non-pollution of the sediment with heavy metals studied inthisresearchexceptcadmiumthatwasaboveEPAlevel. Furthermore, tin comparison to the continental crust value (Wedepohl,1995)forundisturbedsediments,thereishigher concentration of cadmium in all of the studied sites. The geo-accumulation index, contamination factor, degree of contamination and enrichment factor supported the contamination of the sediment samples with cadmium. The cadmium contamination observed in this study is mainly from the anthropogenic sources within the watershed. This was similar to the findings reported by Kadhum et al. (2016) for Bernam river sediments. These findings were also in agreement with the Egbuert et al., (2020) that reported on the Cd, Pb pollution among other heavy metals in the sediments of hand dug wells and bore-hole in South-eastern Nigeria. In a related study of Nwazue et al. (2022), he reported findings that agreed with this study; wherein the study metals were below most of the sediment quality guidelines with an exception of Cadmium. Generally, in comparison to the values of Ibanga et al. (2019); Kafilat-Adebola et al. (2018) and Alhassan et al. (2022), the values of studied heavy metals reported here is slightly lower, with all studies reporting anthropogenic sources as the major source of the pollution in the sediments.Thecorrelationanalysisrevealedalltheanalysed metals to be in significant positive relationship with each other and this finding confirmed that reported by the Nwazue et al. (2022). They also exhibited a positive relationship with pH. This phenomenon explains the bindings of metals to the sediments as the pH increase. Conclusion Numerous researches have reported on the contamination of the natural resources especially the water by the heavy metals which results mainly from the products of anthropogenic activities. In this study an evaluation of the level of contamination of heavy metals in the sediment samples of selected water of south senatorial district of Niger State, Nigeria was conducted. The results illustrated the decreasing order of concentrations of the heavy metals; Fe (197.9±47.6) > Mn (77.32±15.83) > Zn (15.37±2.65) >Cr (13.04±1.43) > Pb (2.50±0.56) > Cd (0.72±0.1) mg Kg-1. The pollutionindicesallsupportedthe non-pollutionstatusof the sediments with heavy metals except for the cadmium which is still at tolerable level, however, it may pose a challenge to the water if left unattended to, since there is that possibility of it been leached. This will cause a disruption in the ecological balance of the water system with its attendant toxic effect. Hence, monitoring and proper Published by Faculty of Science, Kaduna State University remediatingeffortsshouldbeadoptedtowardsminimisingthe cadmium contamination in the study area . Acknowledgement Theauthors’gratitudegoestoTertiaryEducationTrustFund (TetFund), Ibrahim Badamasi Babangida University, Lapai and the Department of Biological Sciences, IBBUL for their award, technical support and guidance in conducting this research. Conflicts of Interest There are no conflicts of interest concerning the publication of this paper. REFERENCES Akan, J. C., Abdulrahman, F. I., Sodipo, O. A., Ochanya, A. E., and Askira, Y. K. (2010). Heavy metals in sediments from river Ngada, Maiduguri Metropolis, Borno state, Nigeria. Journal of Environmental Chemistry and Ecotoxicology , 2(9):131-140. Alhassan, U.G., Salihu, I. M., Hamza, U. I., Yahaya, I., Muhammad, H. M., and Aliyu, D.A. (2022). Assessment of Some Heavy Metal Concentration in Fish, Water, And Sediment of River Ndakotsu, Lapai, Niger State. Global Sustainability Research , 1(1):24-31. Aliyu, A. D., Go, R., Omar, H., Syima, S., Sharifuddin, A. M., and Fazli, B. (2019). Water quality characteristic of the national hydraulicresearchinstituteof Malaysia (NAHRIM) lake undergoingremediationbytheconstructedwetlands:A baseline study. Pertanika Journal Science and Technology , 27(2), 565-587. Alkarkhi, A. F., Ahmad, A., and Easa, A. M. (2009). Assessment of surfacewaterqualityof selected estuaries ofMalaysia:multivariate statistical techniques. The Environmentalist , 29(3):255-262. Arain, B., Kazi, G., Jamali, K., Afridi, I., Jalbani, N., Sarfiraz, A., Baig, A., Kandhro, A., and Memon, A. (2008). Time saving modified BCR sequential extraction procedure for the fraction of Cd, Cr, Cu, Ni, Pb and Zn in sediment samples of polluted lake. Journal of Hazardous Material , 160:235–239. Aris, A. Z., Abdullah, M. H., Praveena, S. M., Yusoff, M. K., and Juahir, H. (2010). Extenuation of saline solutes in shallow aquifer of a small tropical island: a case study of Manukan Island, North Borneo. Environment Asia , 3:84-92. Egbueri, J. C., & Enyigwe, M. T. (2020). Pollution and Ecological Risk Assessment of Potentially Toxic Elements in Natural WatersfromtheAmekaMetallogenicDistrictinSouth-eastern Nigeria. Analytical Letters , 53:2812-2839. EPA,(2006).RegionIIIBTAGfreshwatersedimentscreening benchmarks. Environmental Protection Agency. Available at https://www.epa.gov/sites/production/files/201509/document s/r3_btag_f _sediment_benchmarks_8-06.pdf Hani, A. and Pazira, E., (2011). Heavy metals assessment and identification of their sources in Agricultural Soils of Southern Tehran,Iran.EnvironmentalMonitoringandAssessment ,176(1-4):677-691. Hogan, C. M. (2012). Heavy metal. In: Encyclopaedia of Earth . Eds. Cutler J. Cleveland (Washington, D.C.: Environmental Information Coalition, National Council for Science and the Environment). Hooda, P. S. (2010). Assessing bioavailability of soil trace elements. Trace elements in soils , 229-265. Hounkpè, J. B., Kélomè, N. C., Adèchina, R., and Lawani, R. N.(2017). Assessment of heavy metals contamination in sediments at the lake of Ahémé in southern of Benin (West Africa). Journal of Material and Environmental Science , 8:4369-4377. Ibanga, L. B., Nkwoji, J. A., Usese, A. I., Onyema, I. C., and Chukwu, L. O. (2019). Hydrochemistry and Heavy Metals Concentrations in Sediment of Woji Creek and Bonny Estuary, Niger Delta, Nigeria. Regional Studies in Marine Science, 25: 100436. Idris, A. M. (2008). Combining multivariate analysis and geochemical approaches for assessing heavy metal level in sedimentsfromSudanese harboursalongtheRedSea coast. Microchemical Journal , 90(2):159-163. Ismail, A. (1993). Heavy metal concentrations in sediments off Bintulu, Malaysia. Marine Pollution Bulletin , 26(12):706–707. Jackson, B. P., Taylor, V.F., Punshon, T., and Cottingham, K. L.(2012). Arsenic concentration and speciation in Infant formulas and first foods. Pure Applied Chem istry, 84(2):215-223. Kadhum, S. A., Ishak, M. Y., and Zulkifli, S. Z. (2016). Evaluation and assessment of baseline metal contamination in surface sediments from the Bernam River, Malaysia. Environmental Science and Pollution Research , 23(7):6312-6321. Kafilat-Adebola, B. A., Joseph Kayode, S., & Adebayo Akeem, O.(2018). Integrated Assessment of the Heavy Metal Pollution Status and Potential Ecological Risk in the Lagos Lagoon, South West, Nigeria. Human and Ecological Risk Assessment, An International Journal, 24 :377-397. Mucha, A. P., Vasconcelos, M. T. S., and Bordalo, A. A. (2003). Macrobenthic community in the Douro estuary: relations with trace metals and natural sediment characteristics. Environmental pollution , 121(2):169-180. Nasrabadi, T., Bidhendi, G. N., Karbassi, A., and Mehrdadi, N.(2010). Evaluating the efficiency of sediment metal pollution indices in interpreting the pollution of Haraz River sediments, southern Caspian Sea basin. Environmental Monitoring and Assessment , 171(1-4):395-410. National Ocenic and Atmospheric Agency, (1999). Screening quick reference tables. Nwazue, E. U., Omietimi, E. J., Mienye, E., Imarhiagbe, O. J., Adeosun, O. A.,andNnabo, P. N. (2022). Heavy Metal Dispersion in Stream Sediments in River Iyiudene, Abakaliki South- EasternNigeria: Source,Distribution Pattern, and Contamination Assessment. Journal of Geoscience and Environment Protection, 10, 48-69. Radojevic, M., and Bashkin, V. (2007). Practical environmental analysis . Royal society of chemistry. Said, K. S., Shuhaimi-Othman, M., and Ahmad, A. K. (2012b). The evaluationofwaterqualityandmetalconcentrationsof TitiwangsaLake,Selangor,PeninsularMalaysia. Pakistan journal of Biological Science , 15(10):459-468. Sow, Y., Ismail, A., and Zulkifli, Z. (2013). An assessment of heavy metalbioaccumulationinAsianswampeel,Monopterus albus , during plowing stages of a paddy cycle. Bulletin of Environmental Contamination and Toxicology , 1–7 Temminghoff, E. E. J. M., and Houba, V. J. G. (2004).Plant analyses procedures , (Kluwer Academic Publishers:Dodrecht, The Netherlands). Published by Faculty of Science, Kaduna State University Turekian, K., and Wedepohl, H. (1961). Distribution of the elements in some major units of the earth’s crust. Geological Society of America Bulletin , 72:175 Ubiogoro, O.E., and Adeyemo, O.K. (2017). Heavy metal pollution of aquatic systems in oil producing communities of delta state, Nigeria. Journal of Applied Biosciences , 120:11993-11998. Wan, L., Ahmad, A., and Mohamad, Z. (2013). Spatial variability of metals in surface water and sediment in the Langat River and geochemical factors that influence their water-sediment interactions. The Scientific World Journal, (1–4):652150. Wasiu,M.O.,Ayodele,O.E.,Ayodele,T.I.,Oluremi,O.I., Temitope, O. K., and Temitope, F. O. (2016). Heavy metal contamination in stream water and sediments of gold mining areas of South Western Nigeria. African Journal of Environmental Science and Technology , 10(5), 150-161. Wedepohl,K. H. (1995). The composition ofthe continental crust. Geochimica et cosmochimica Acta , 59(7), 1217-1232. WHO,(2004).ManganeseanditsCompounds:Environmental A sp ects . Geneva: World Health Organization.
确定
还剩6页未读,是否继续阅读?

产品配置单
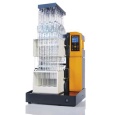


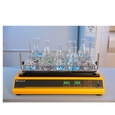
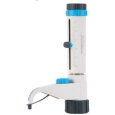
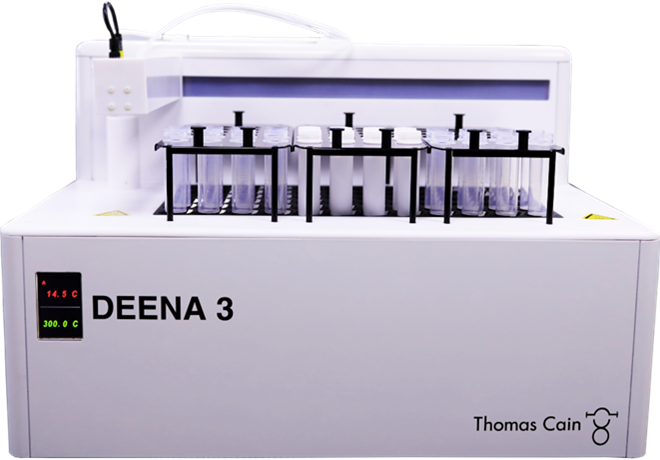
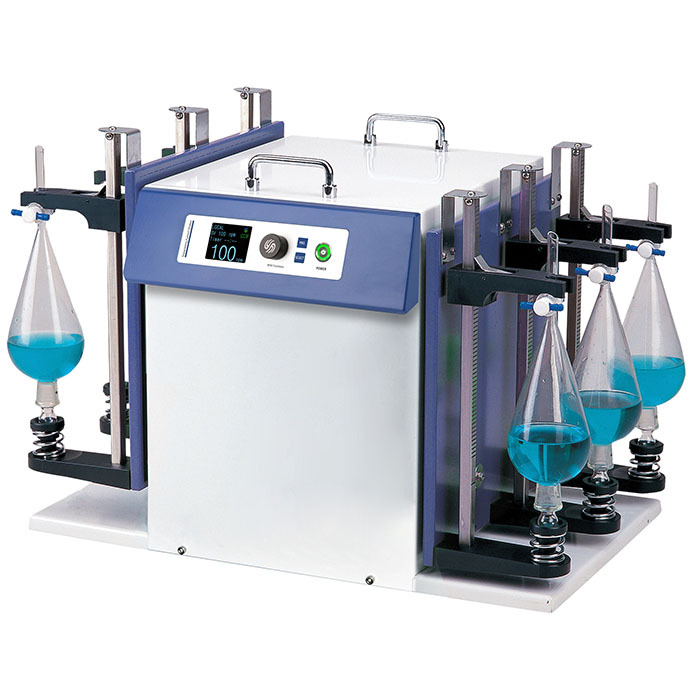
中国格哈特为您提供《水体沉积物中重金属(镉、铬、铁、铅、锰、锌)的检测》,该方案主要用于土壤中(类)金属及其化合物检测,参考标准--,《水体沉积物中重金属(镉、铬、铁、铅、锰、锌)的检测》用到的仪器有格哈特痕量金属消解仪SMA-L 20S、格哈特快速干燥仪STL56、格哈特自动升降40位消解仪KT-L 40s、格哈特强力高重现振荡器LS500/RO500、德国移液器MM
推荐专场

相关方案
更多
该厂商其他方案
更多