


方案详情
文
有机肥料和无机肥料联合应用对我国黄土高原地区苹果园全球变暖潜力和温室气体排放的影响Combined Application of Organic and Inorganic Fertilizers Effects on the Global Warming Potential and Greenhouse Gas Emission in Apple Orchard in Loess Plateau Region of China
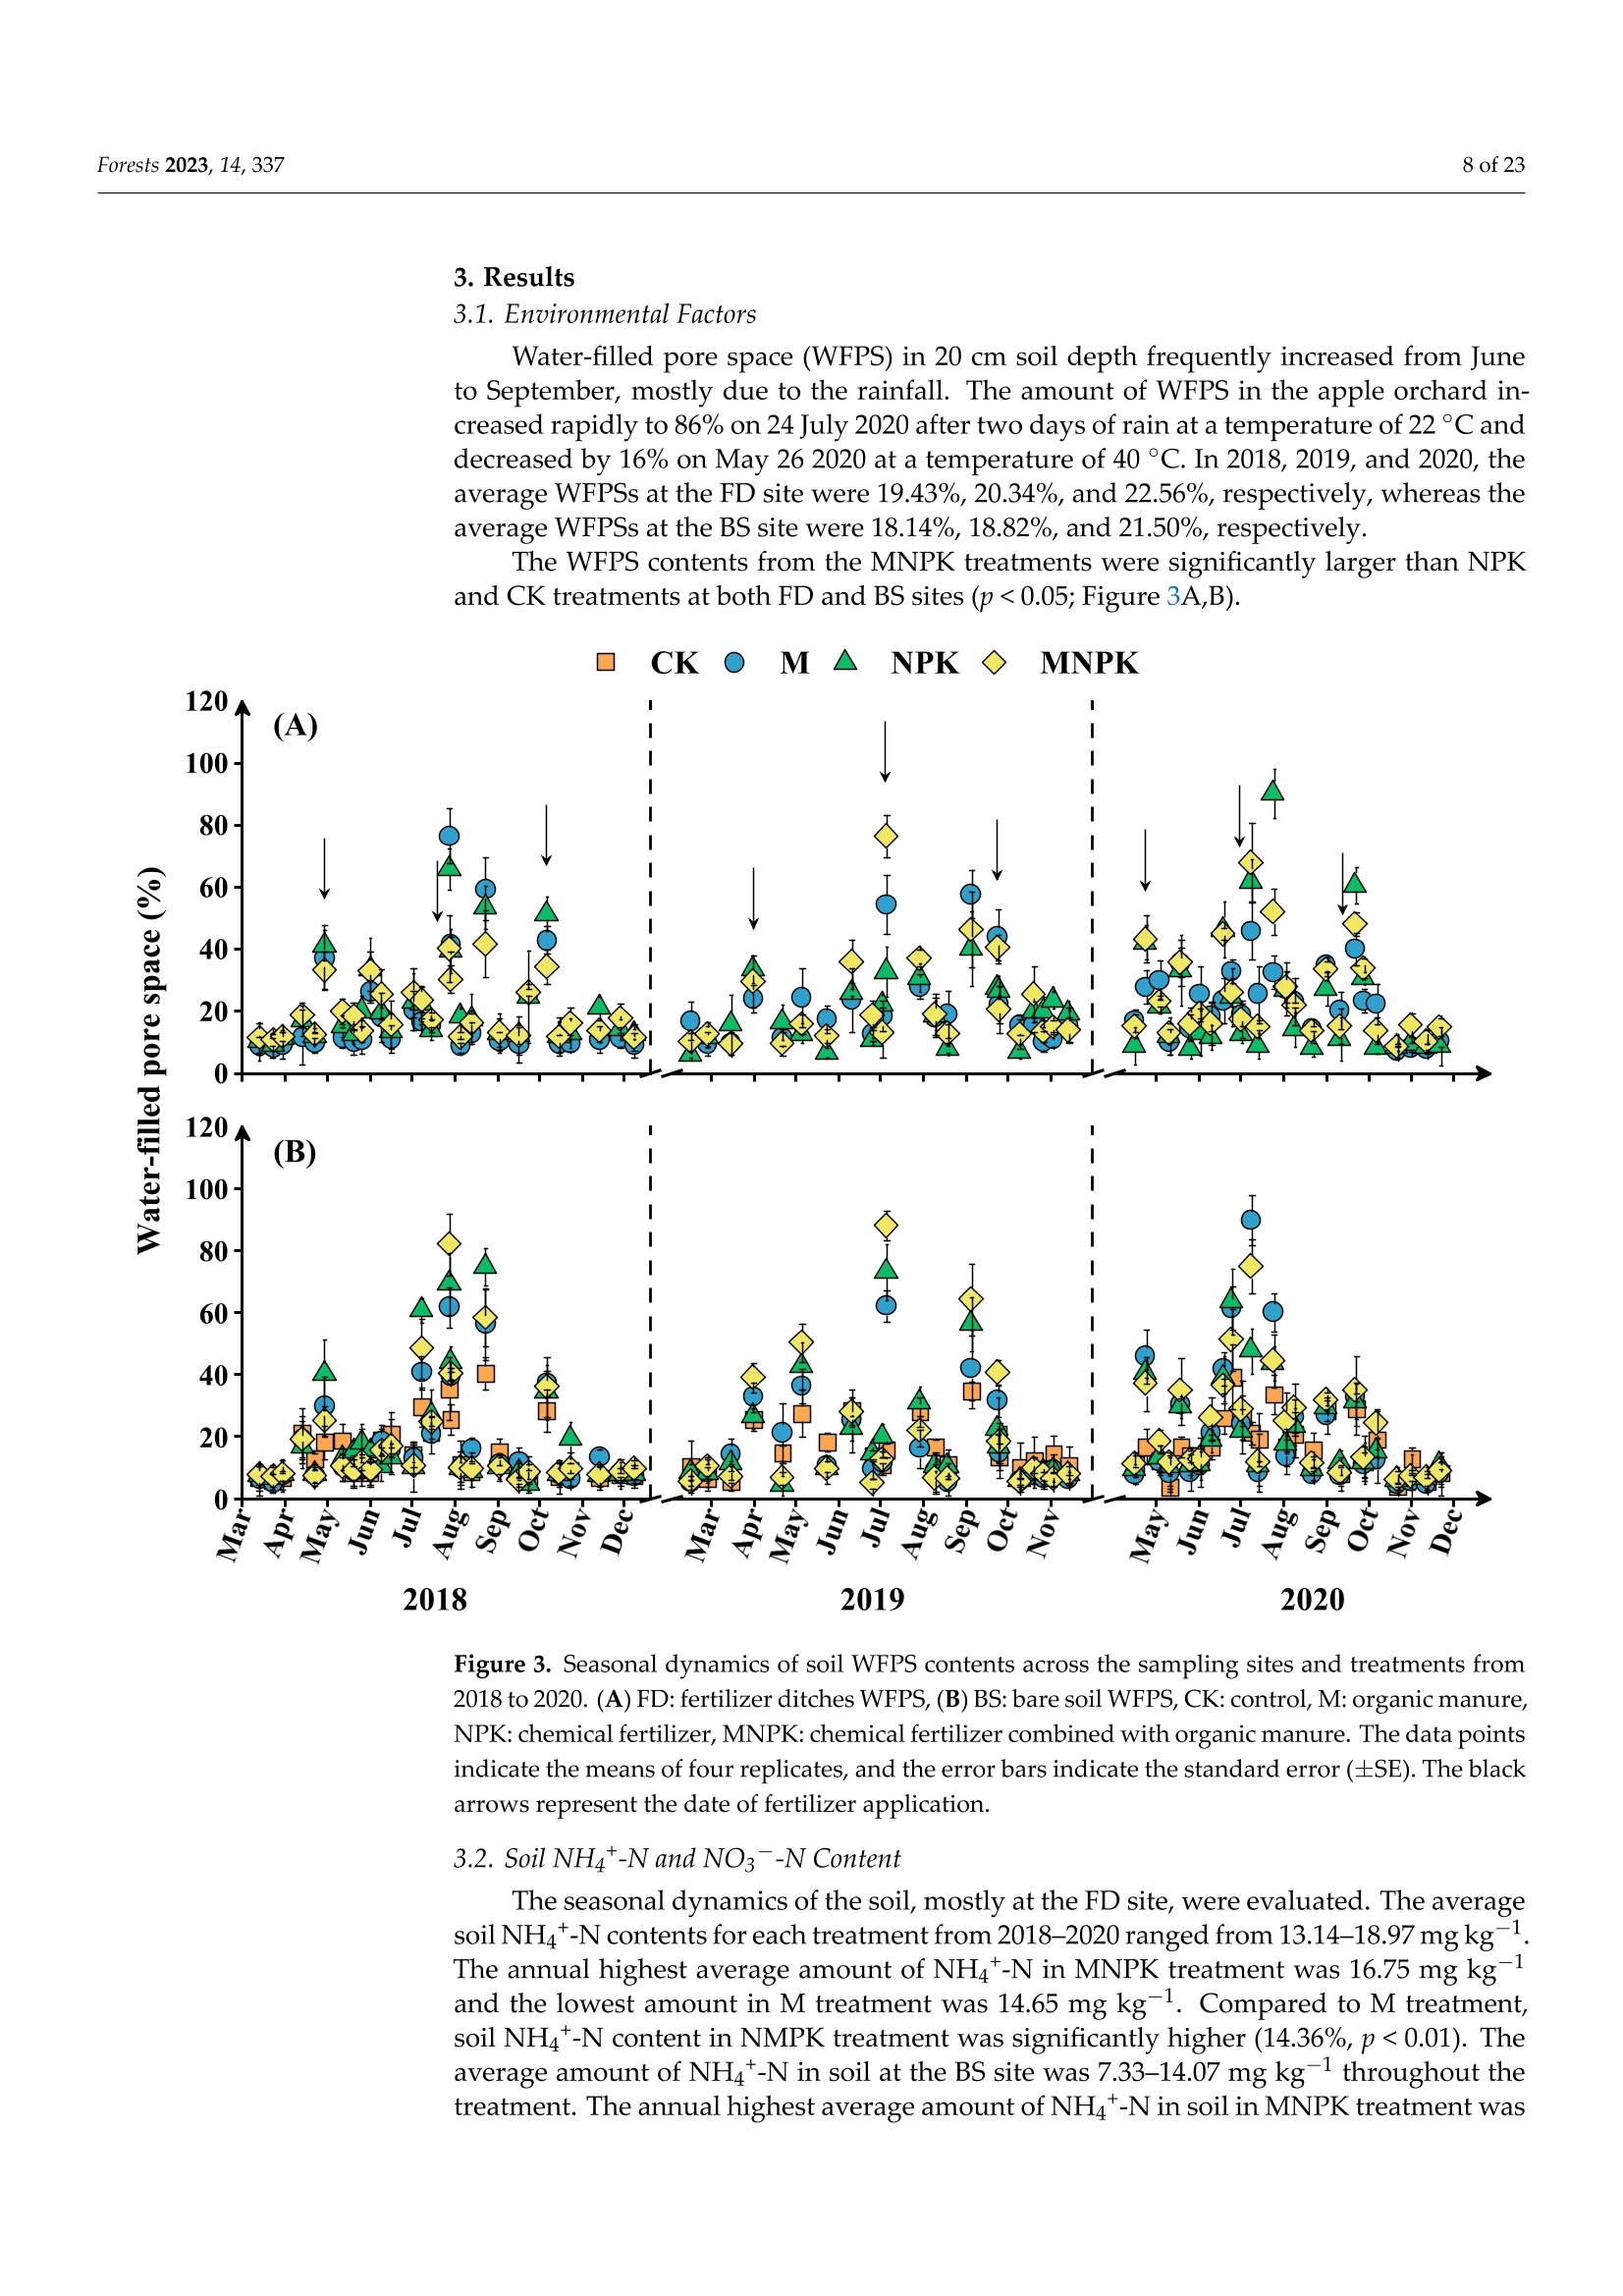
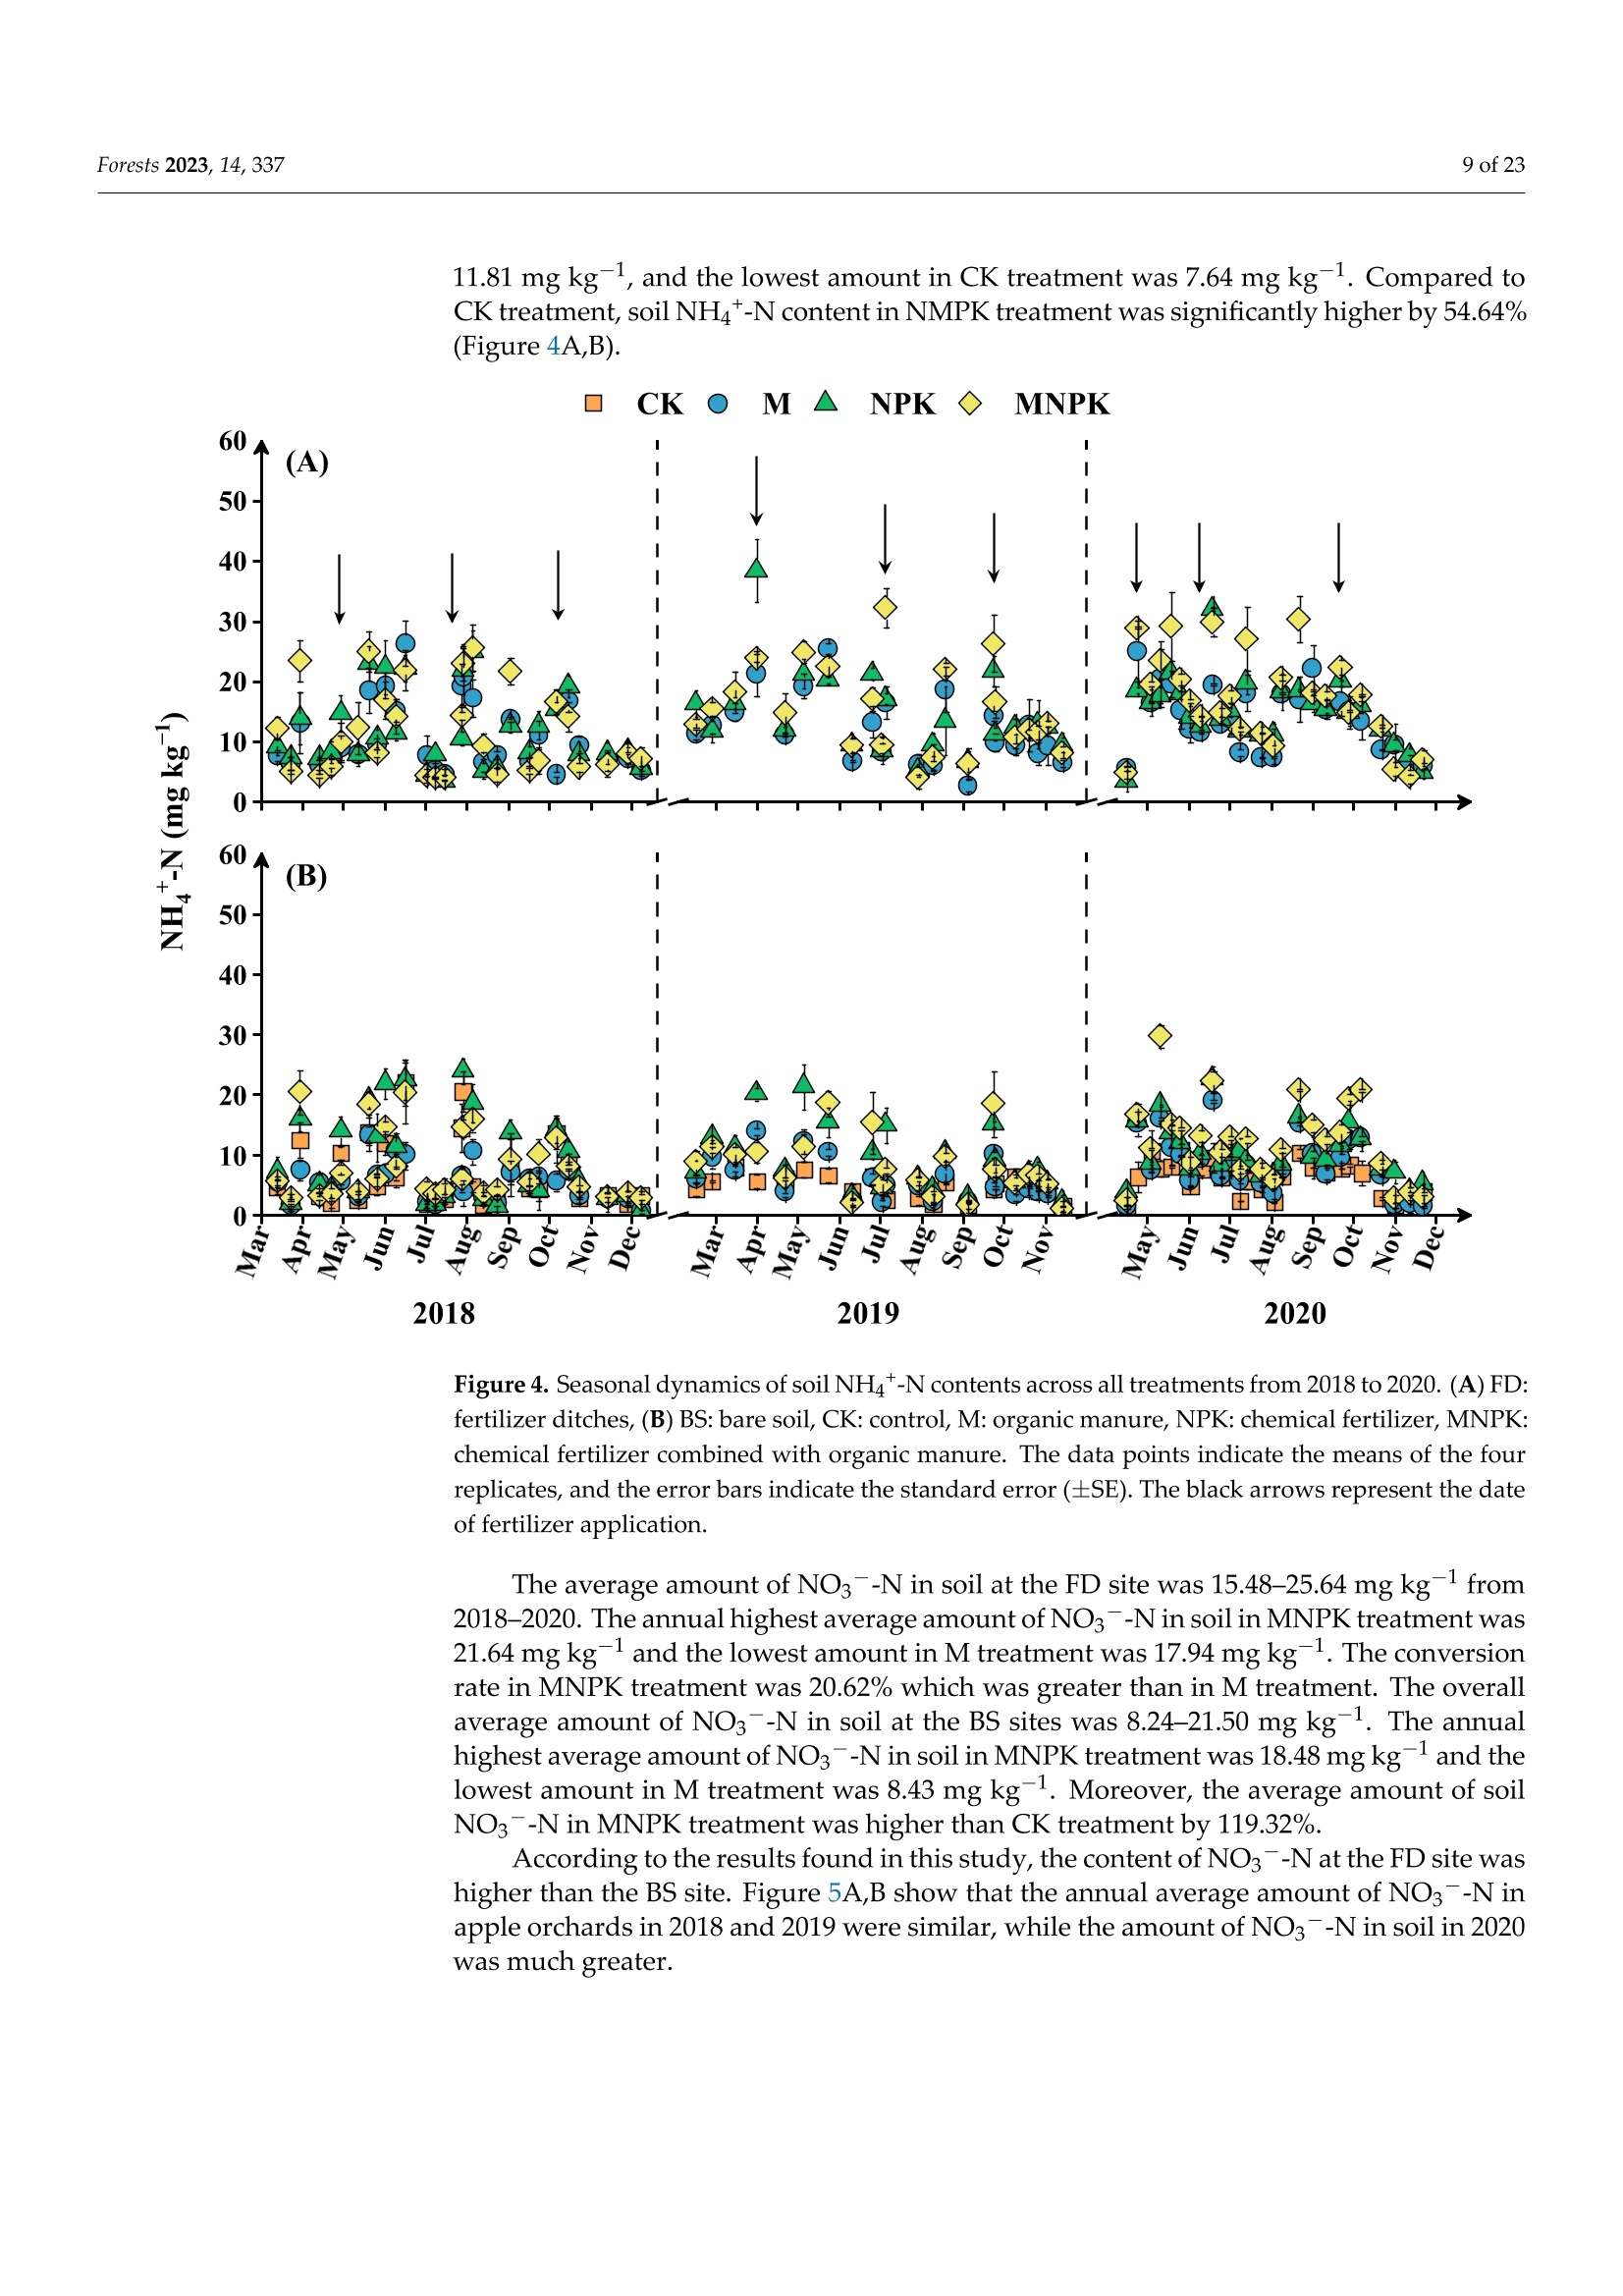
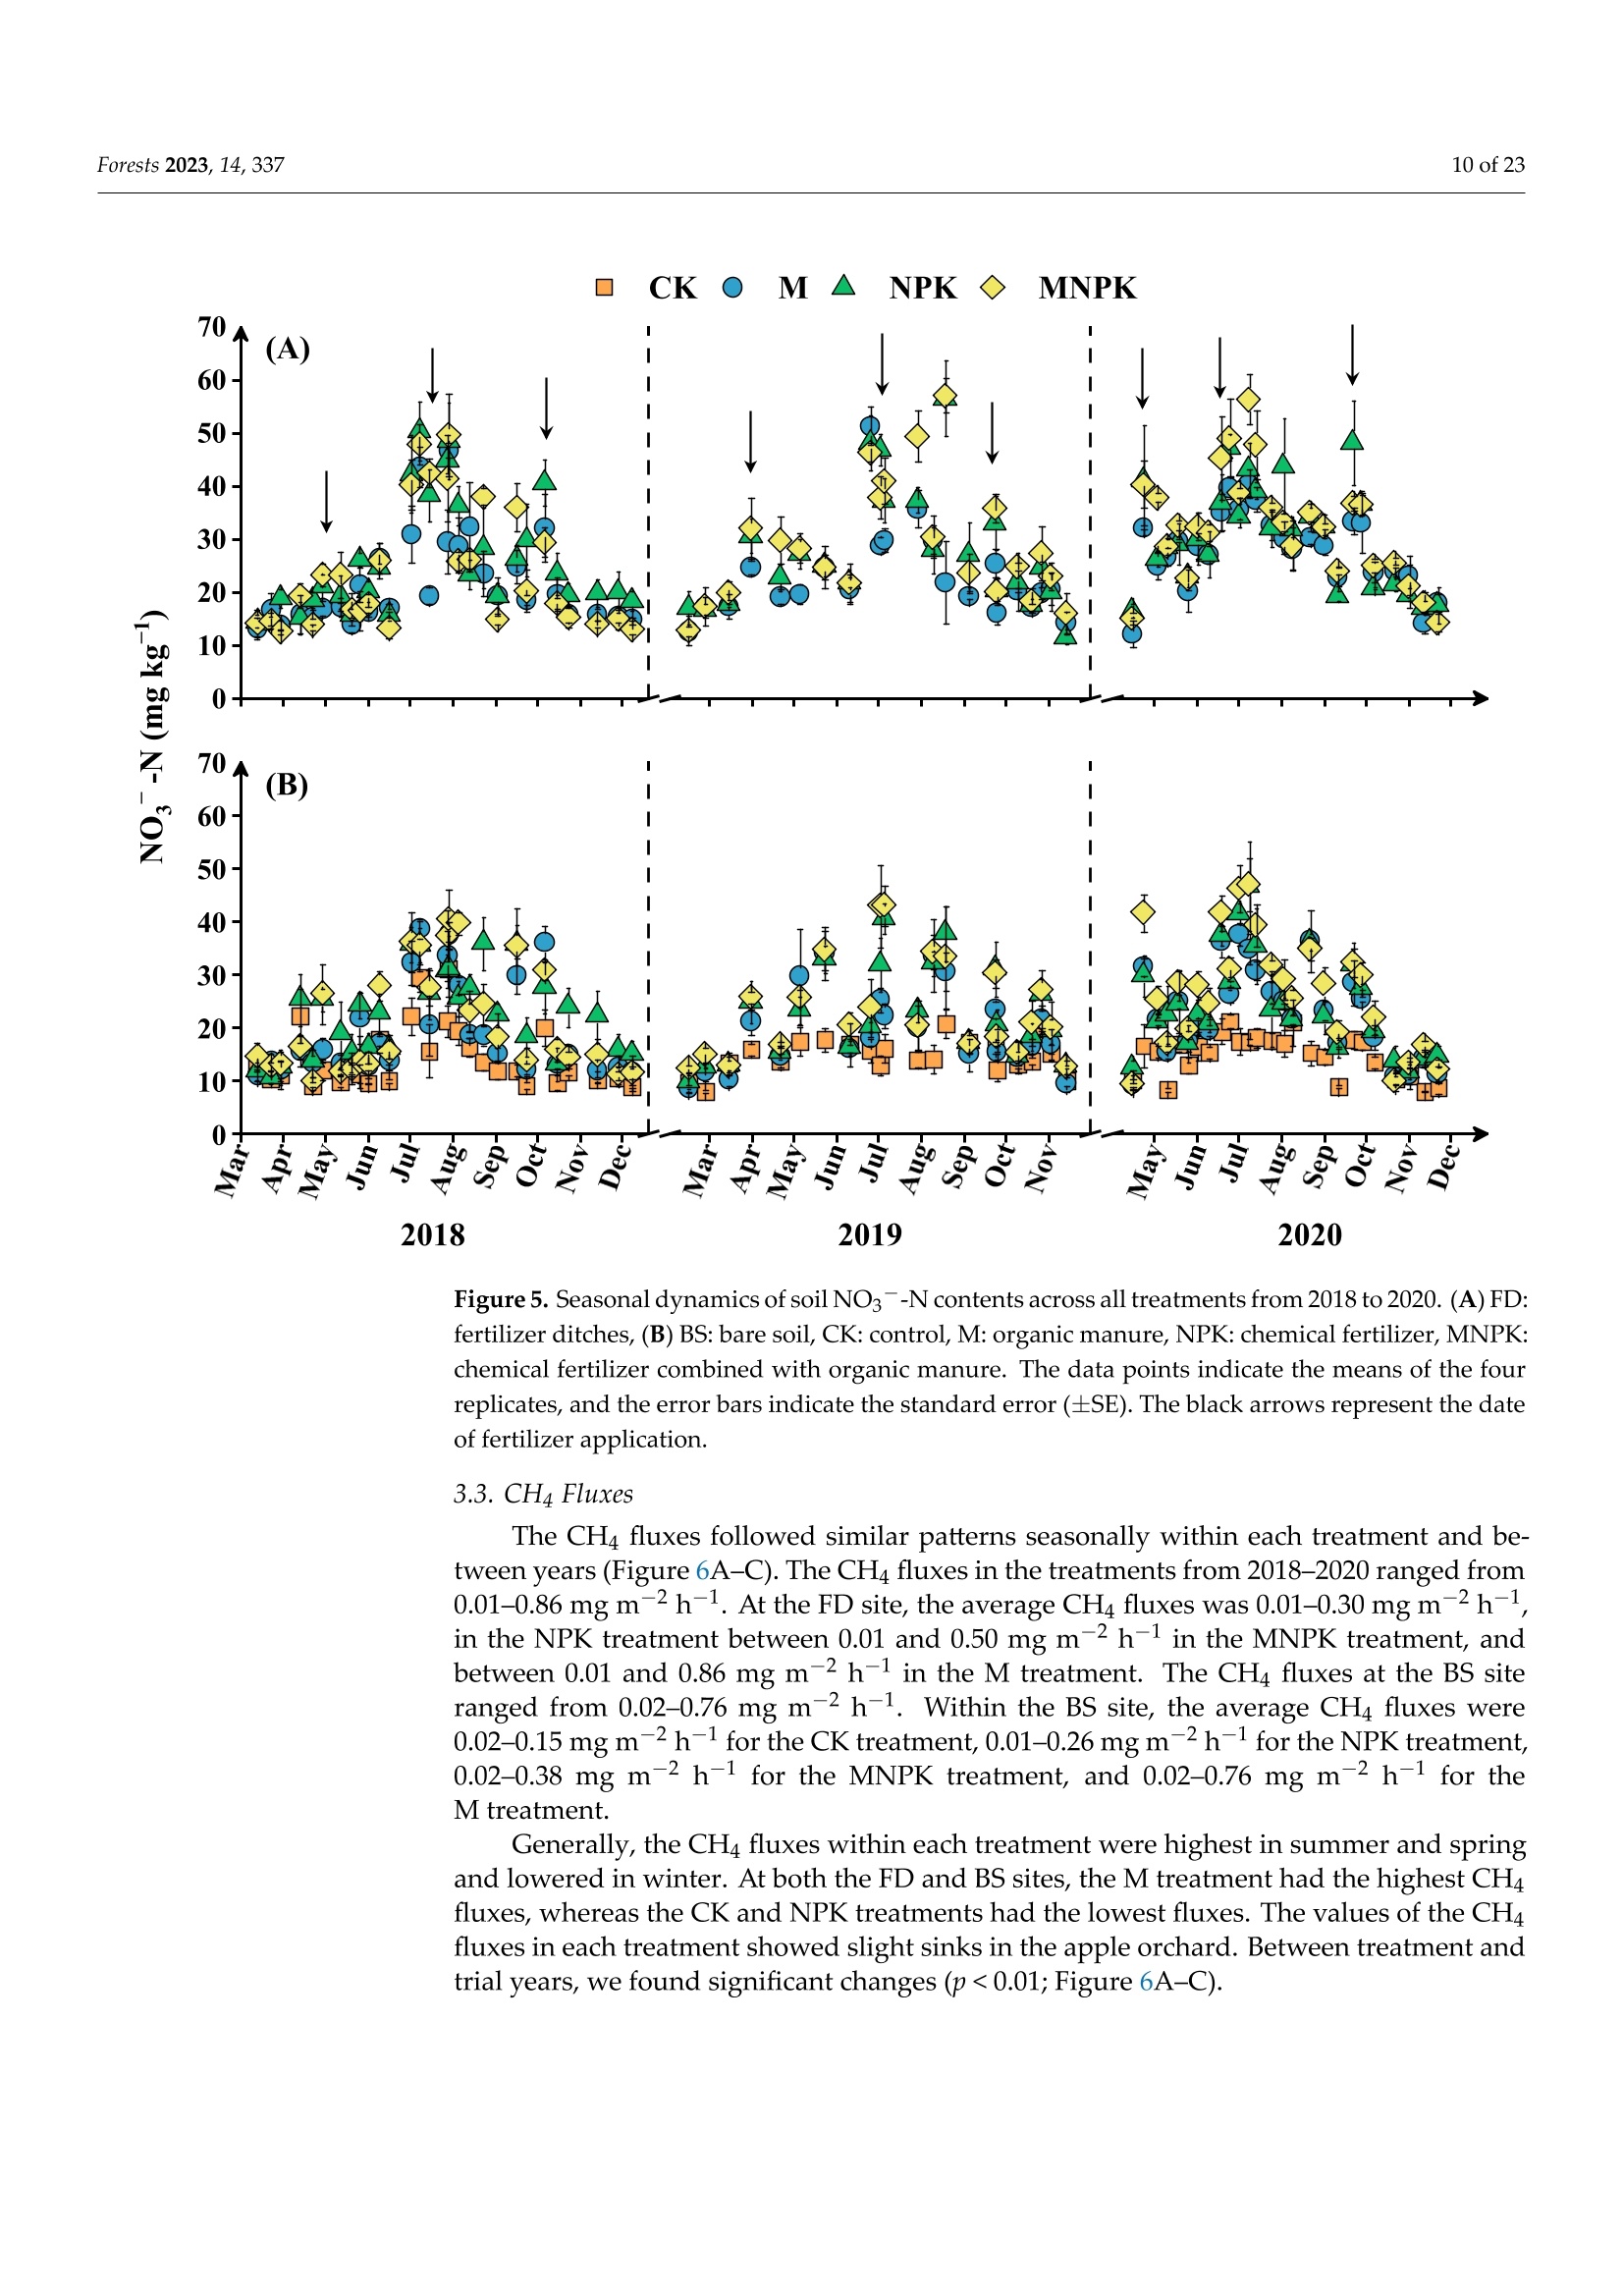
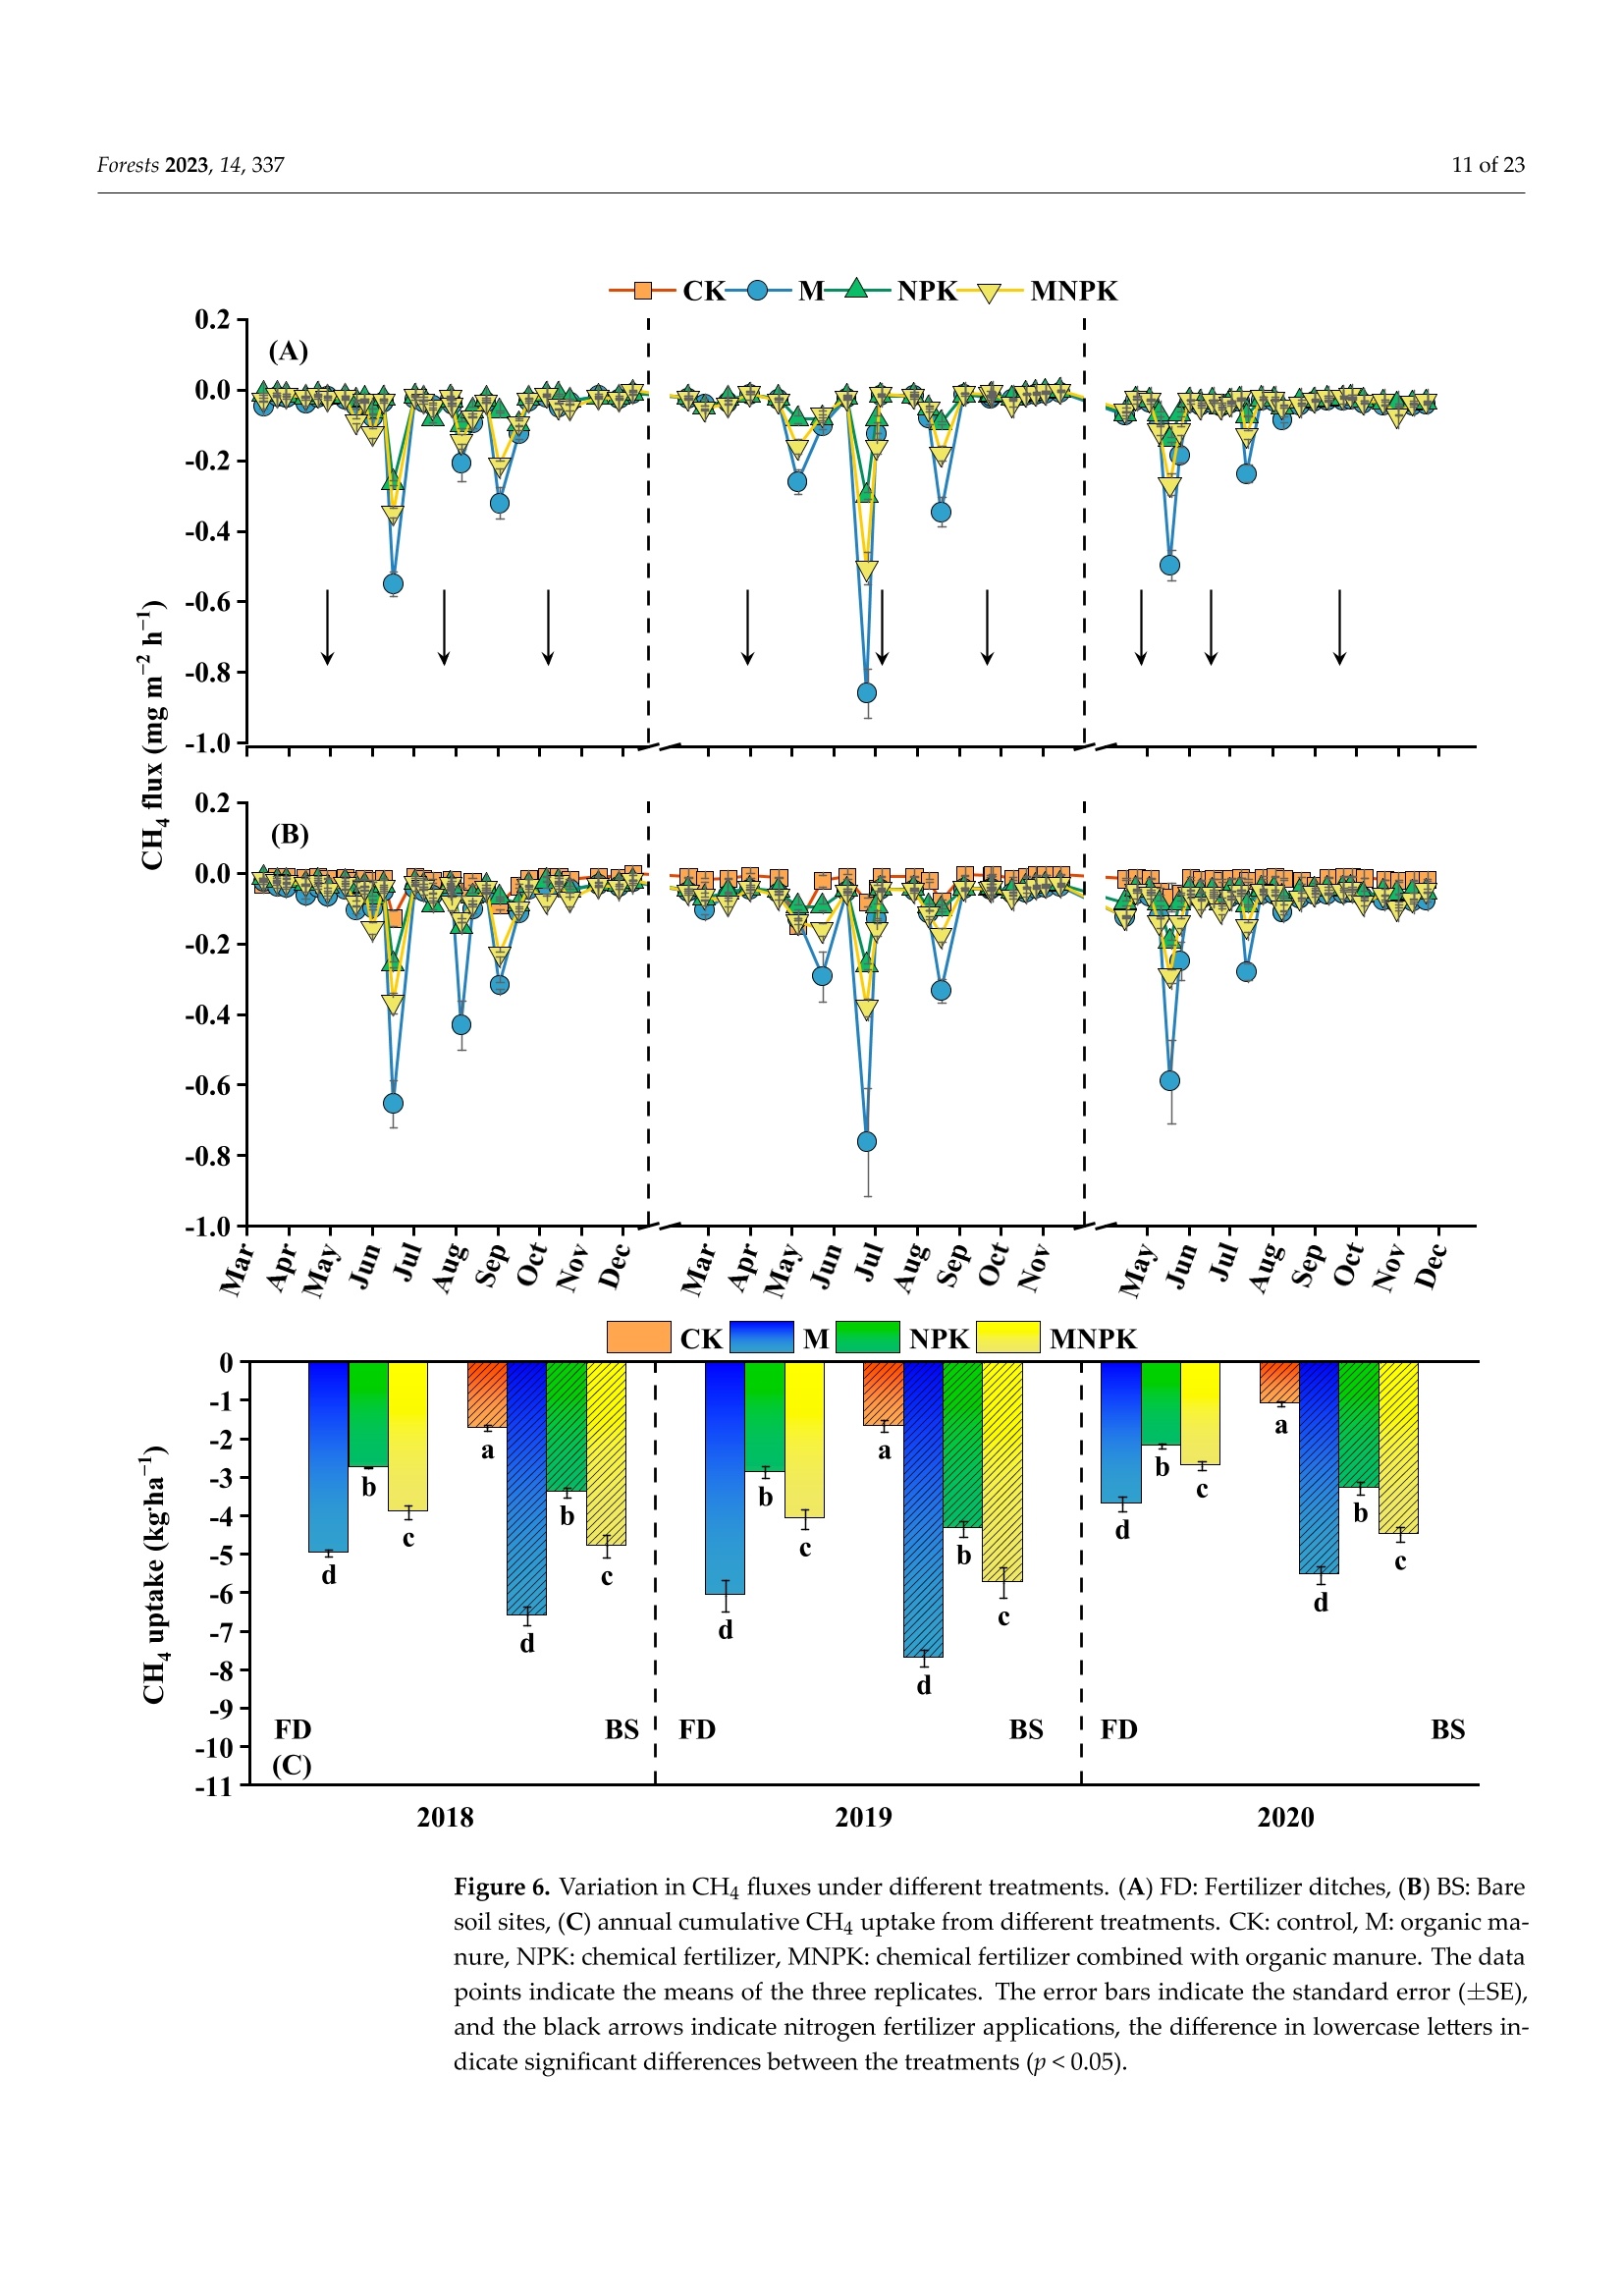
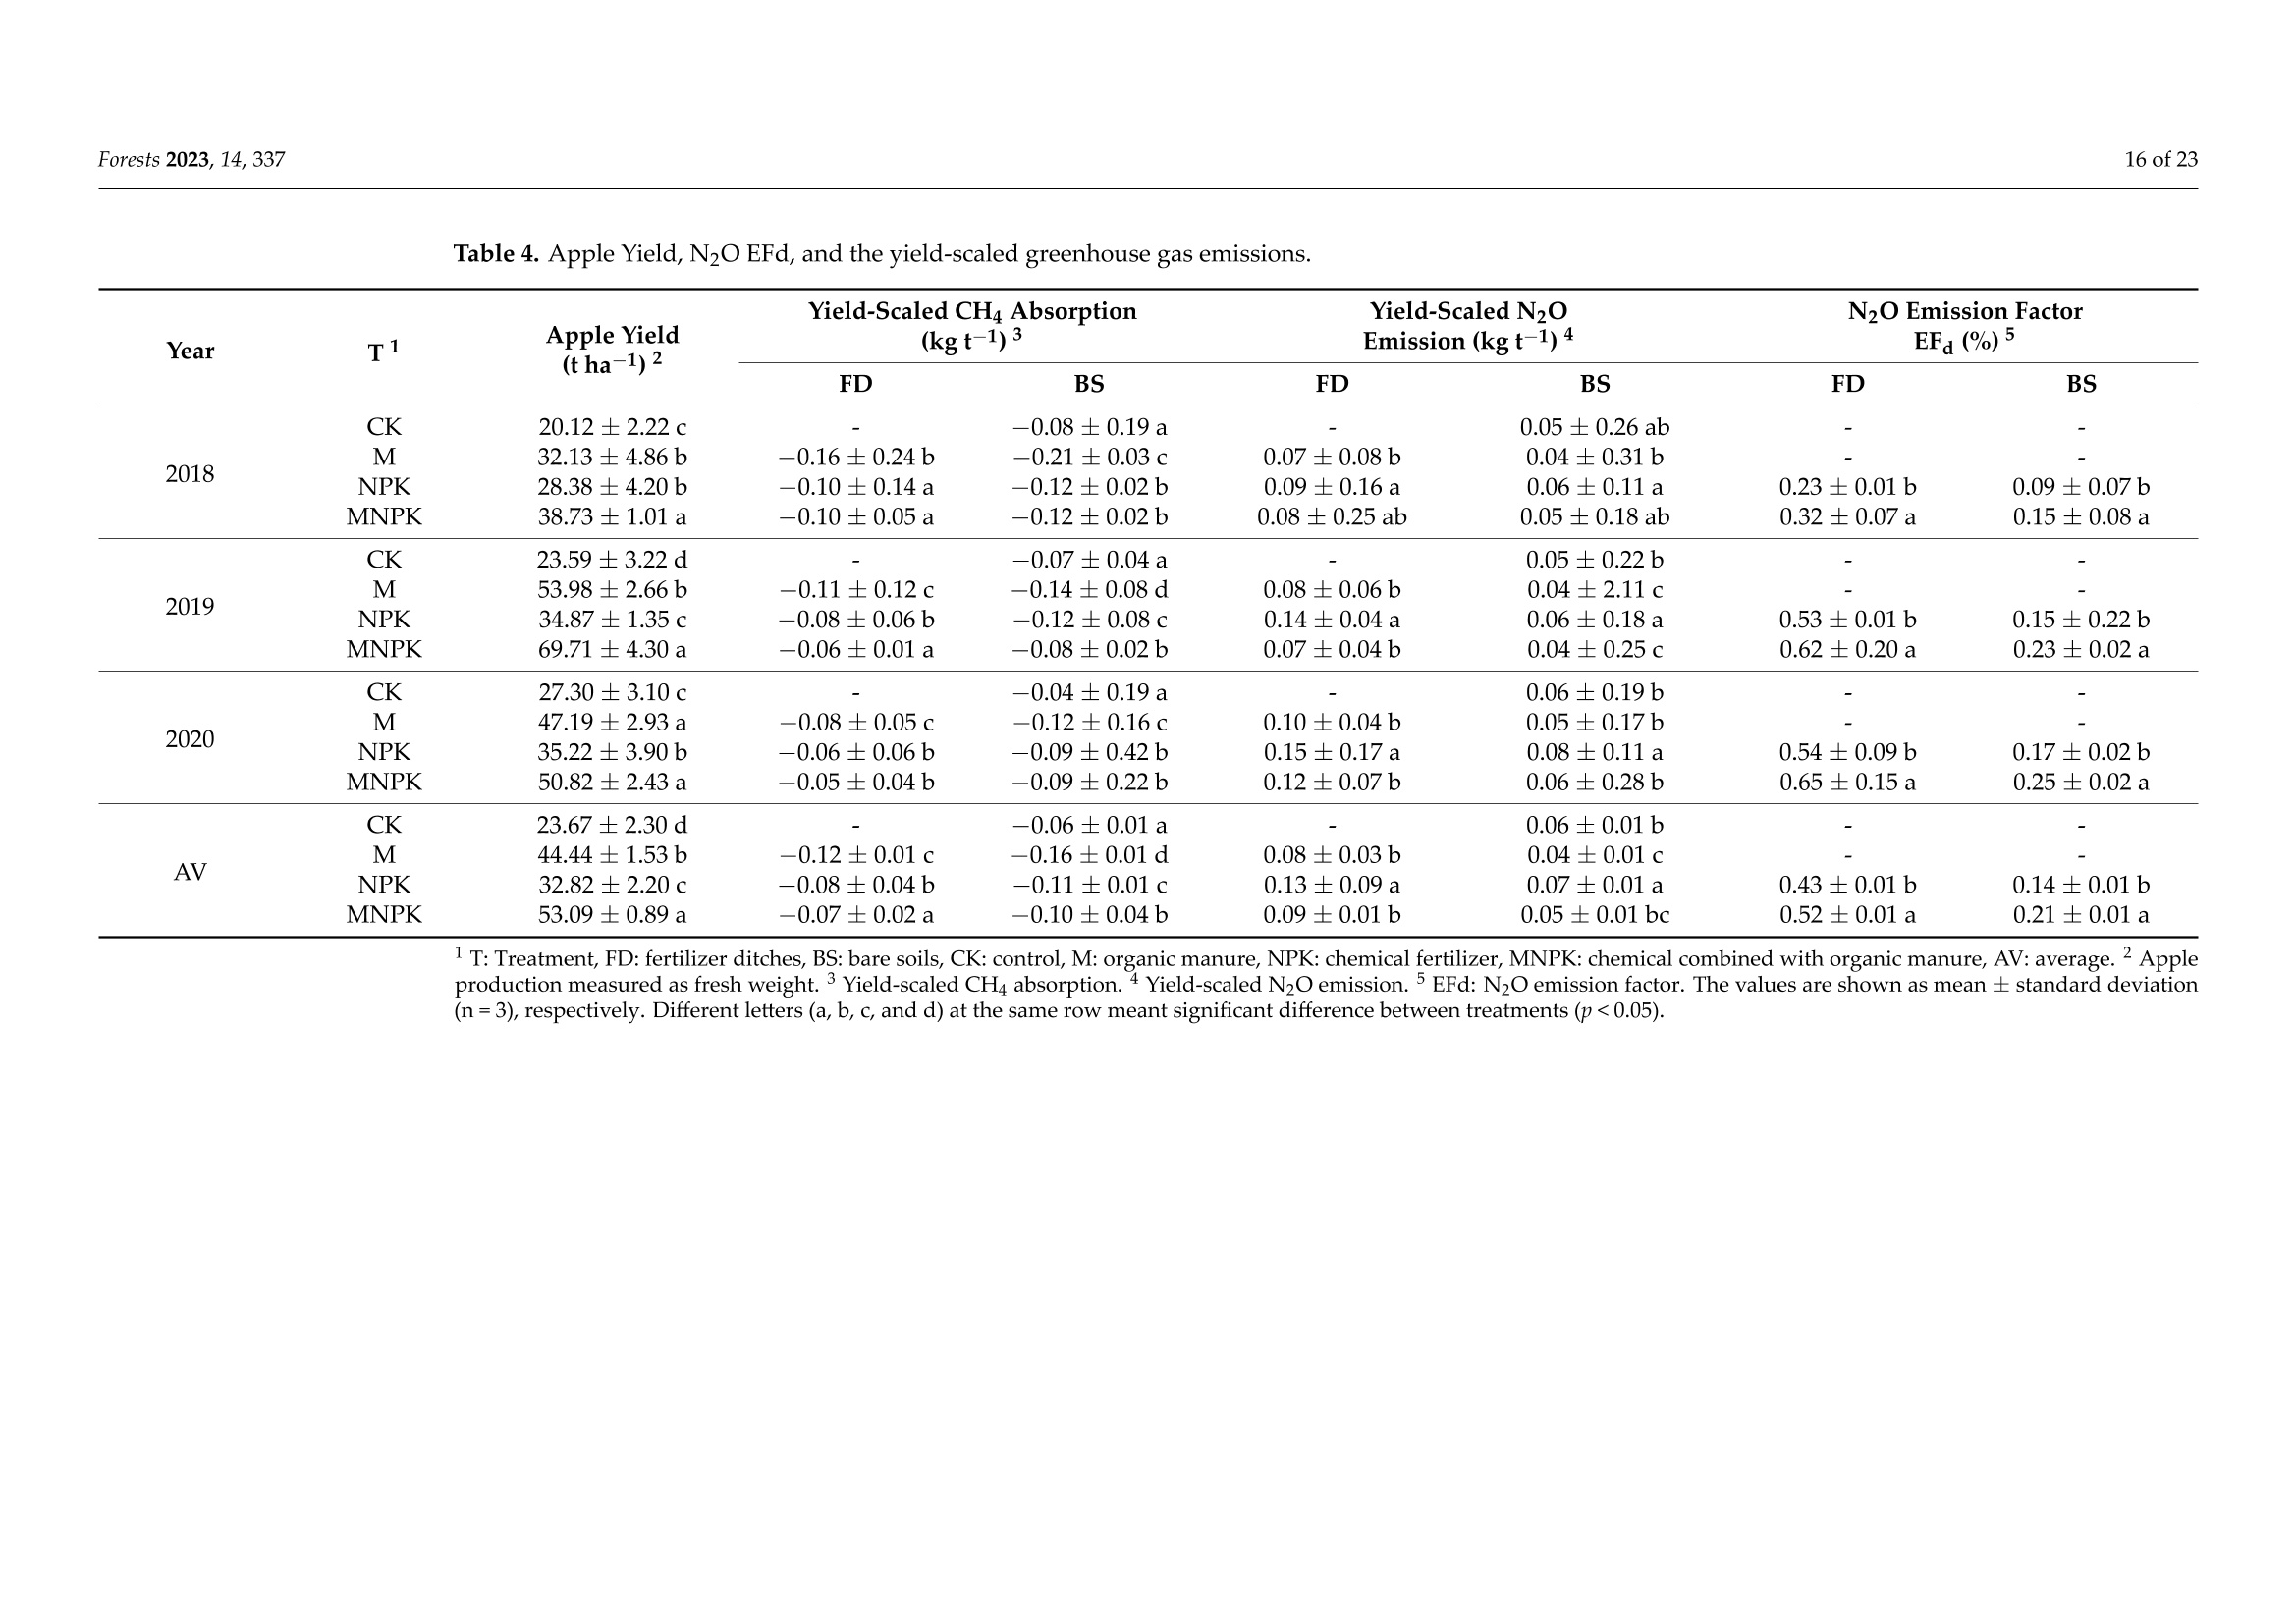
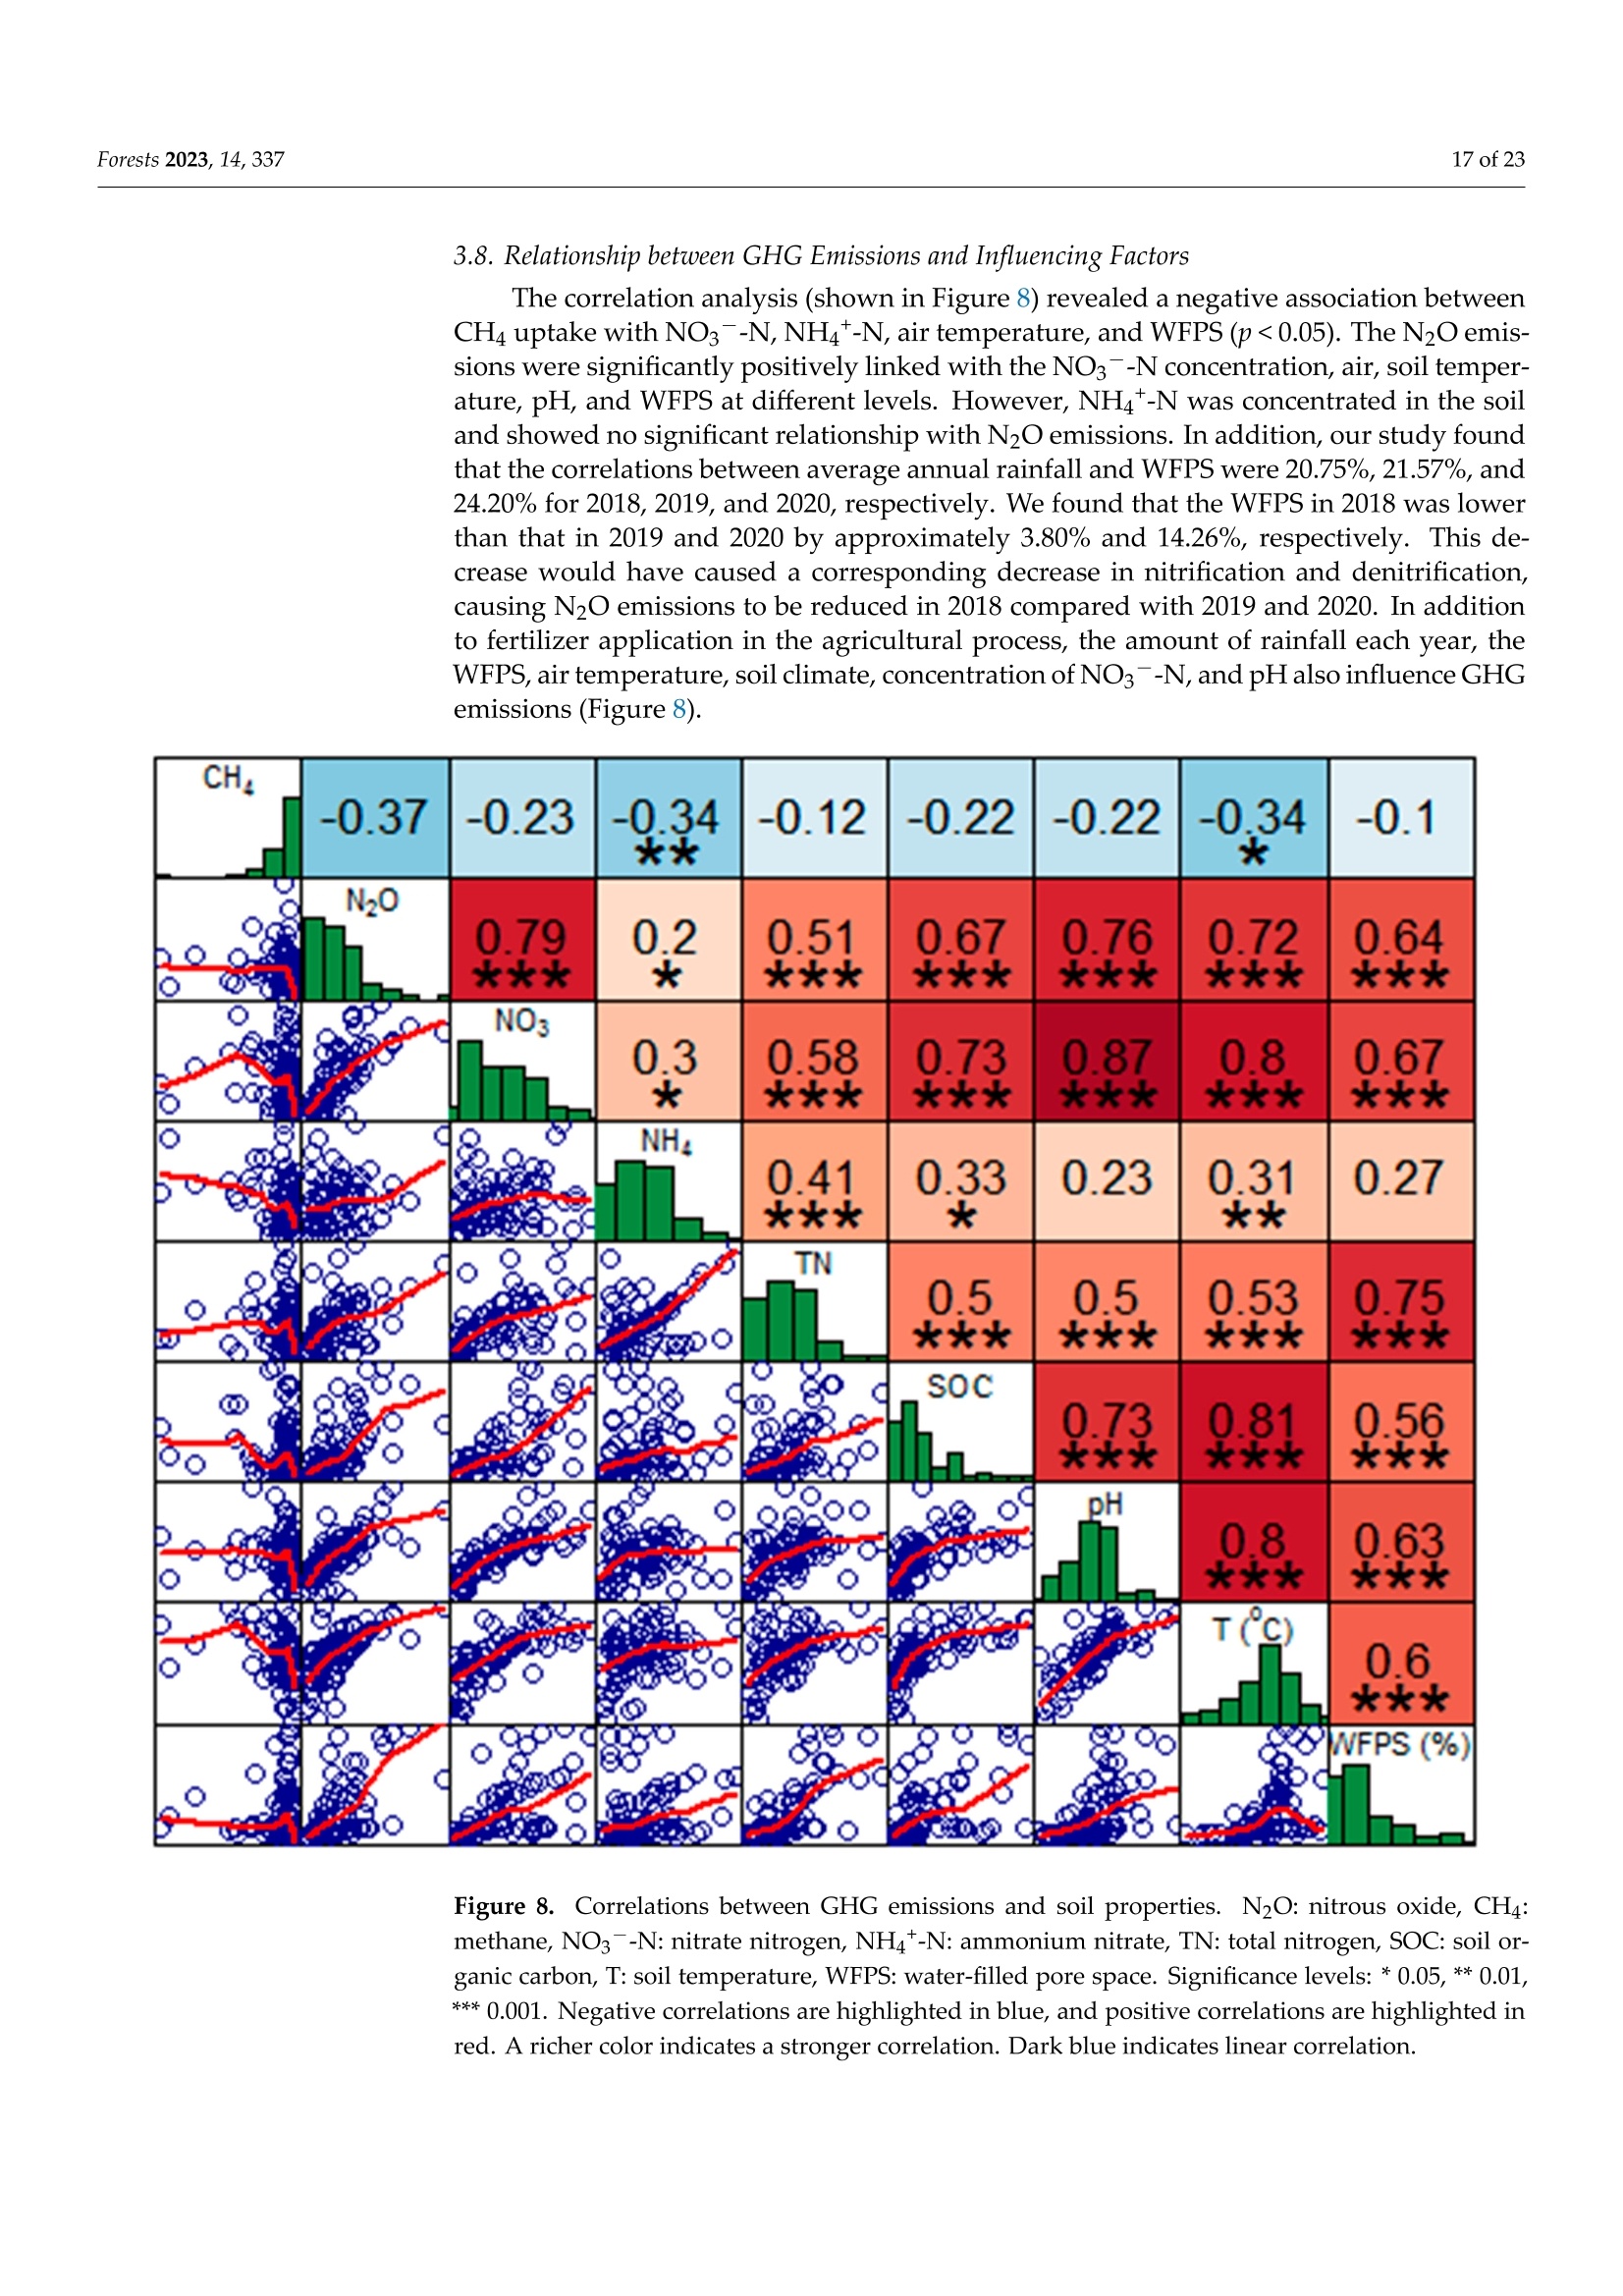
方案详情

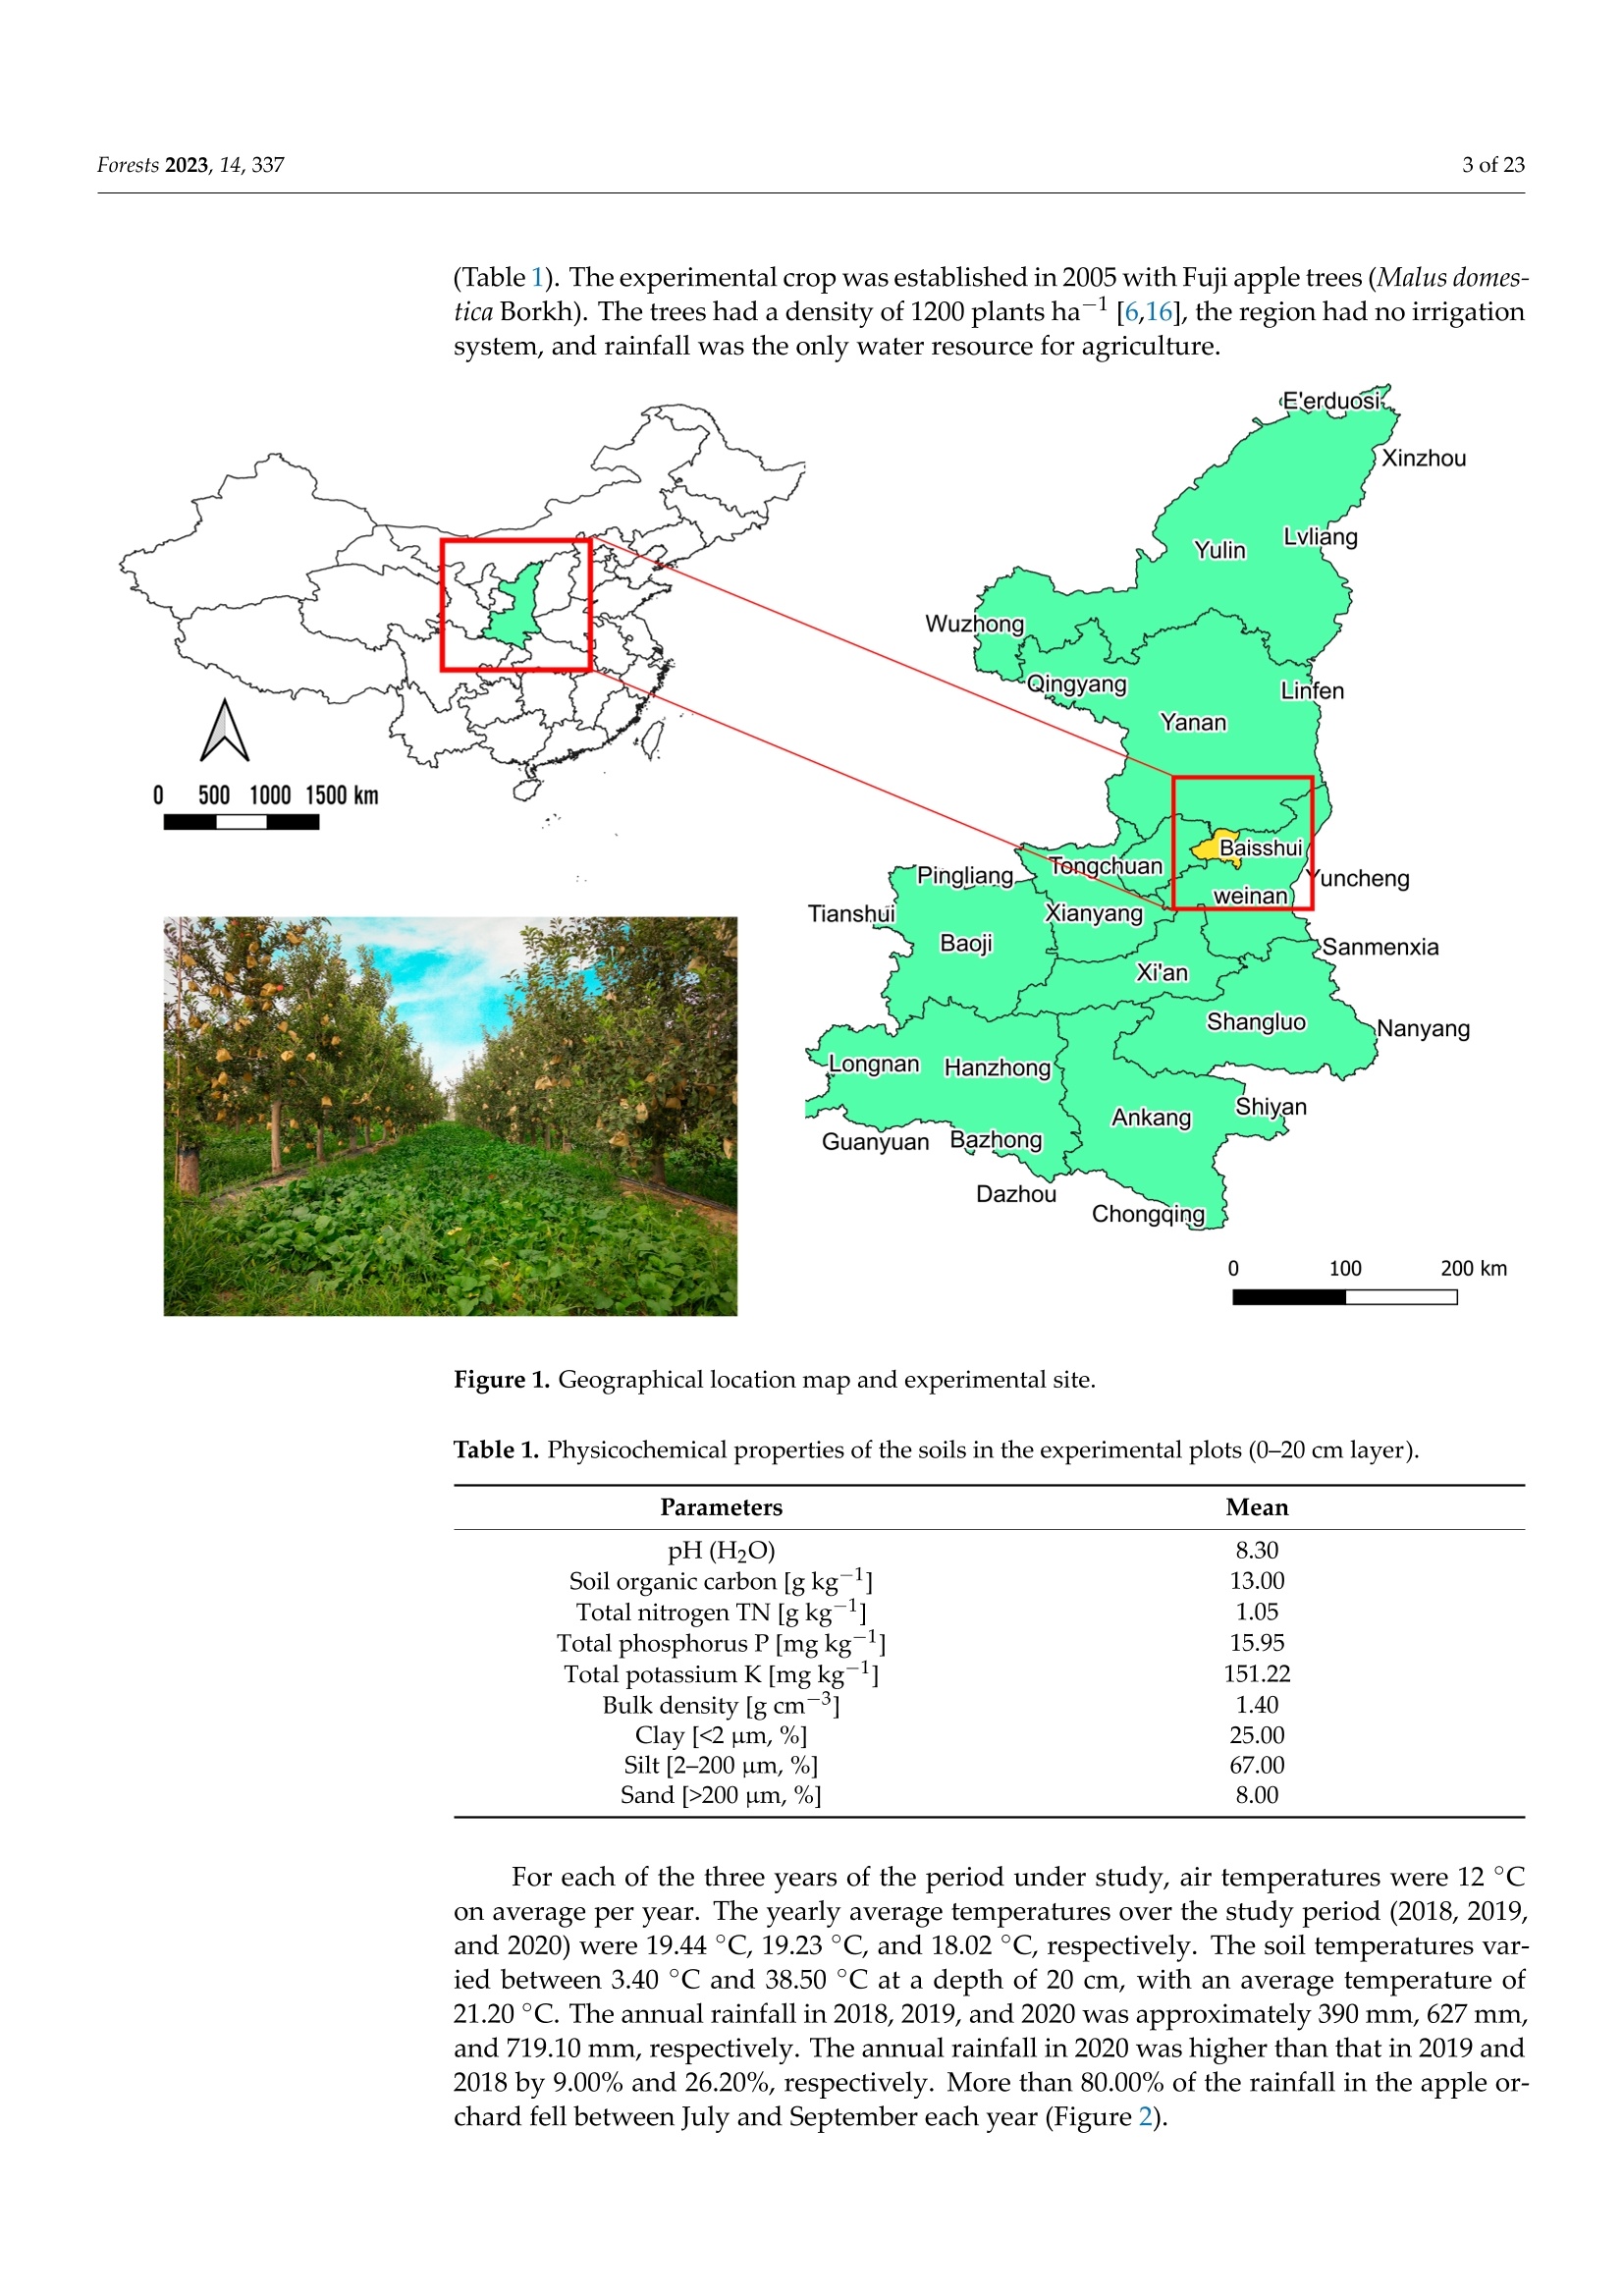
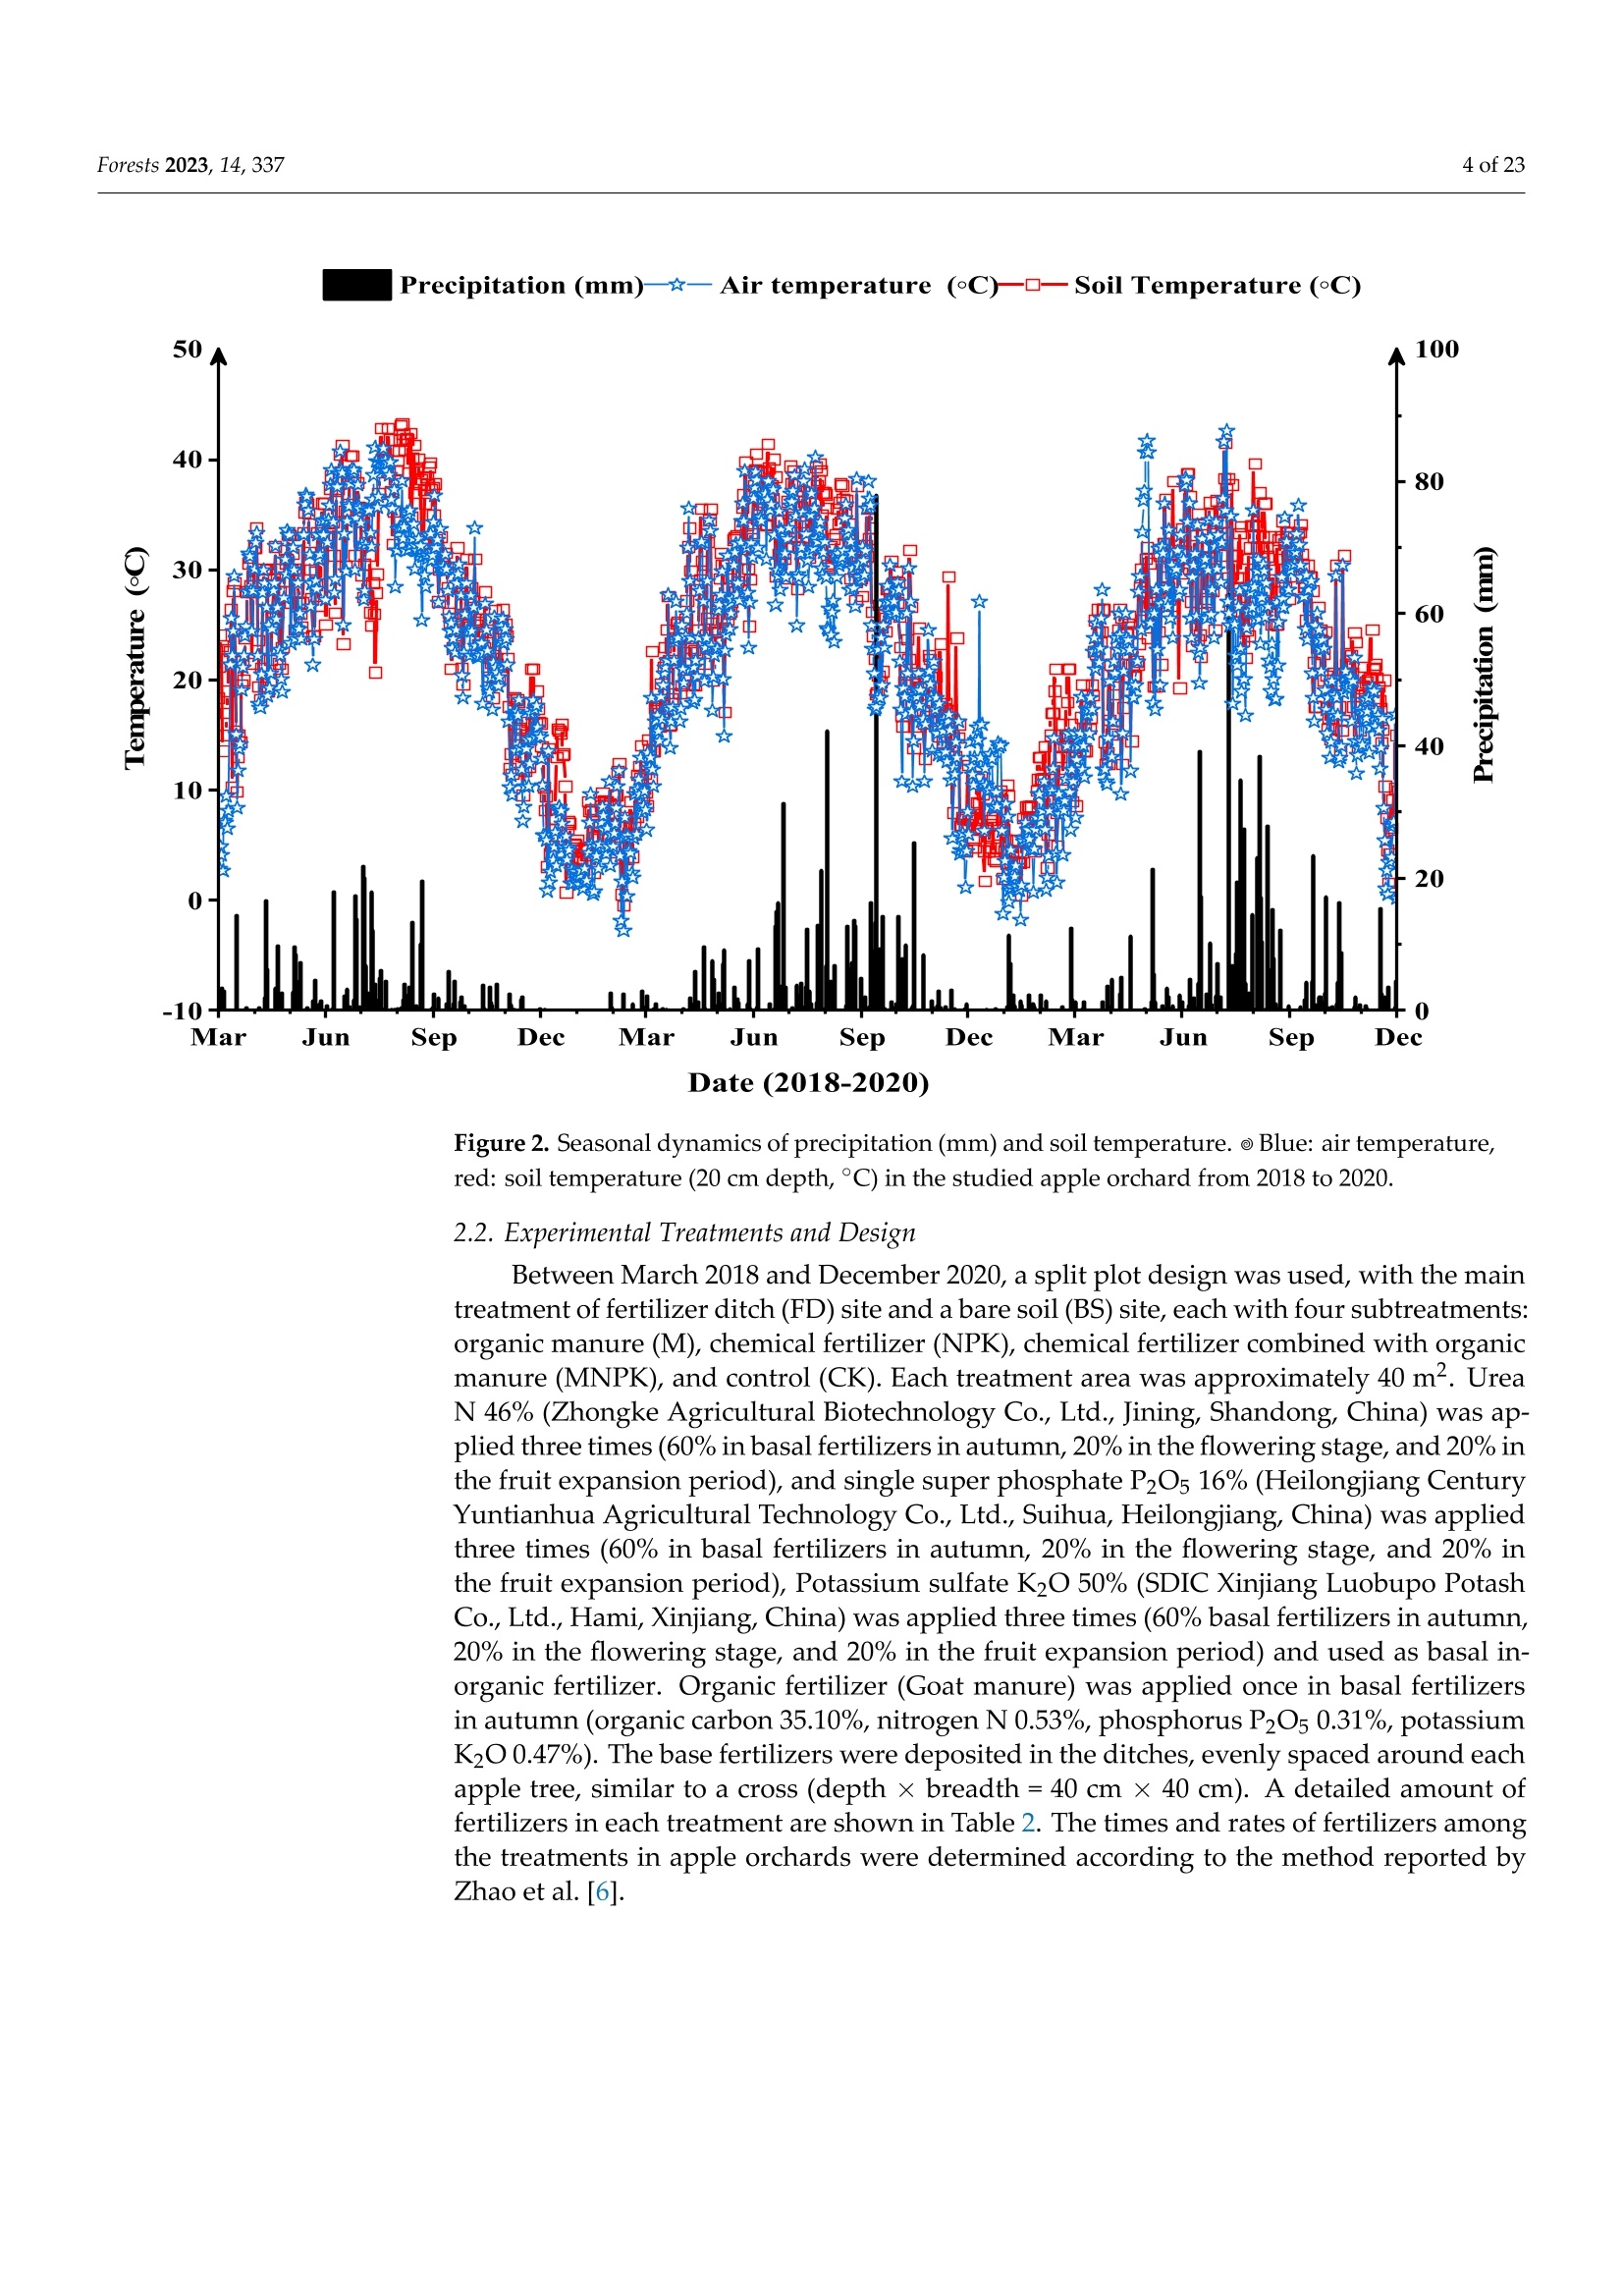
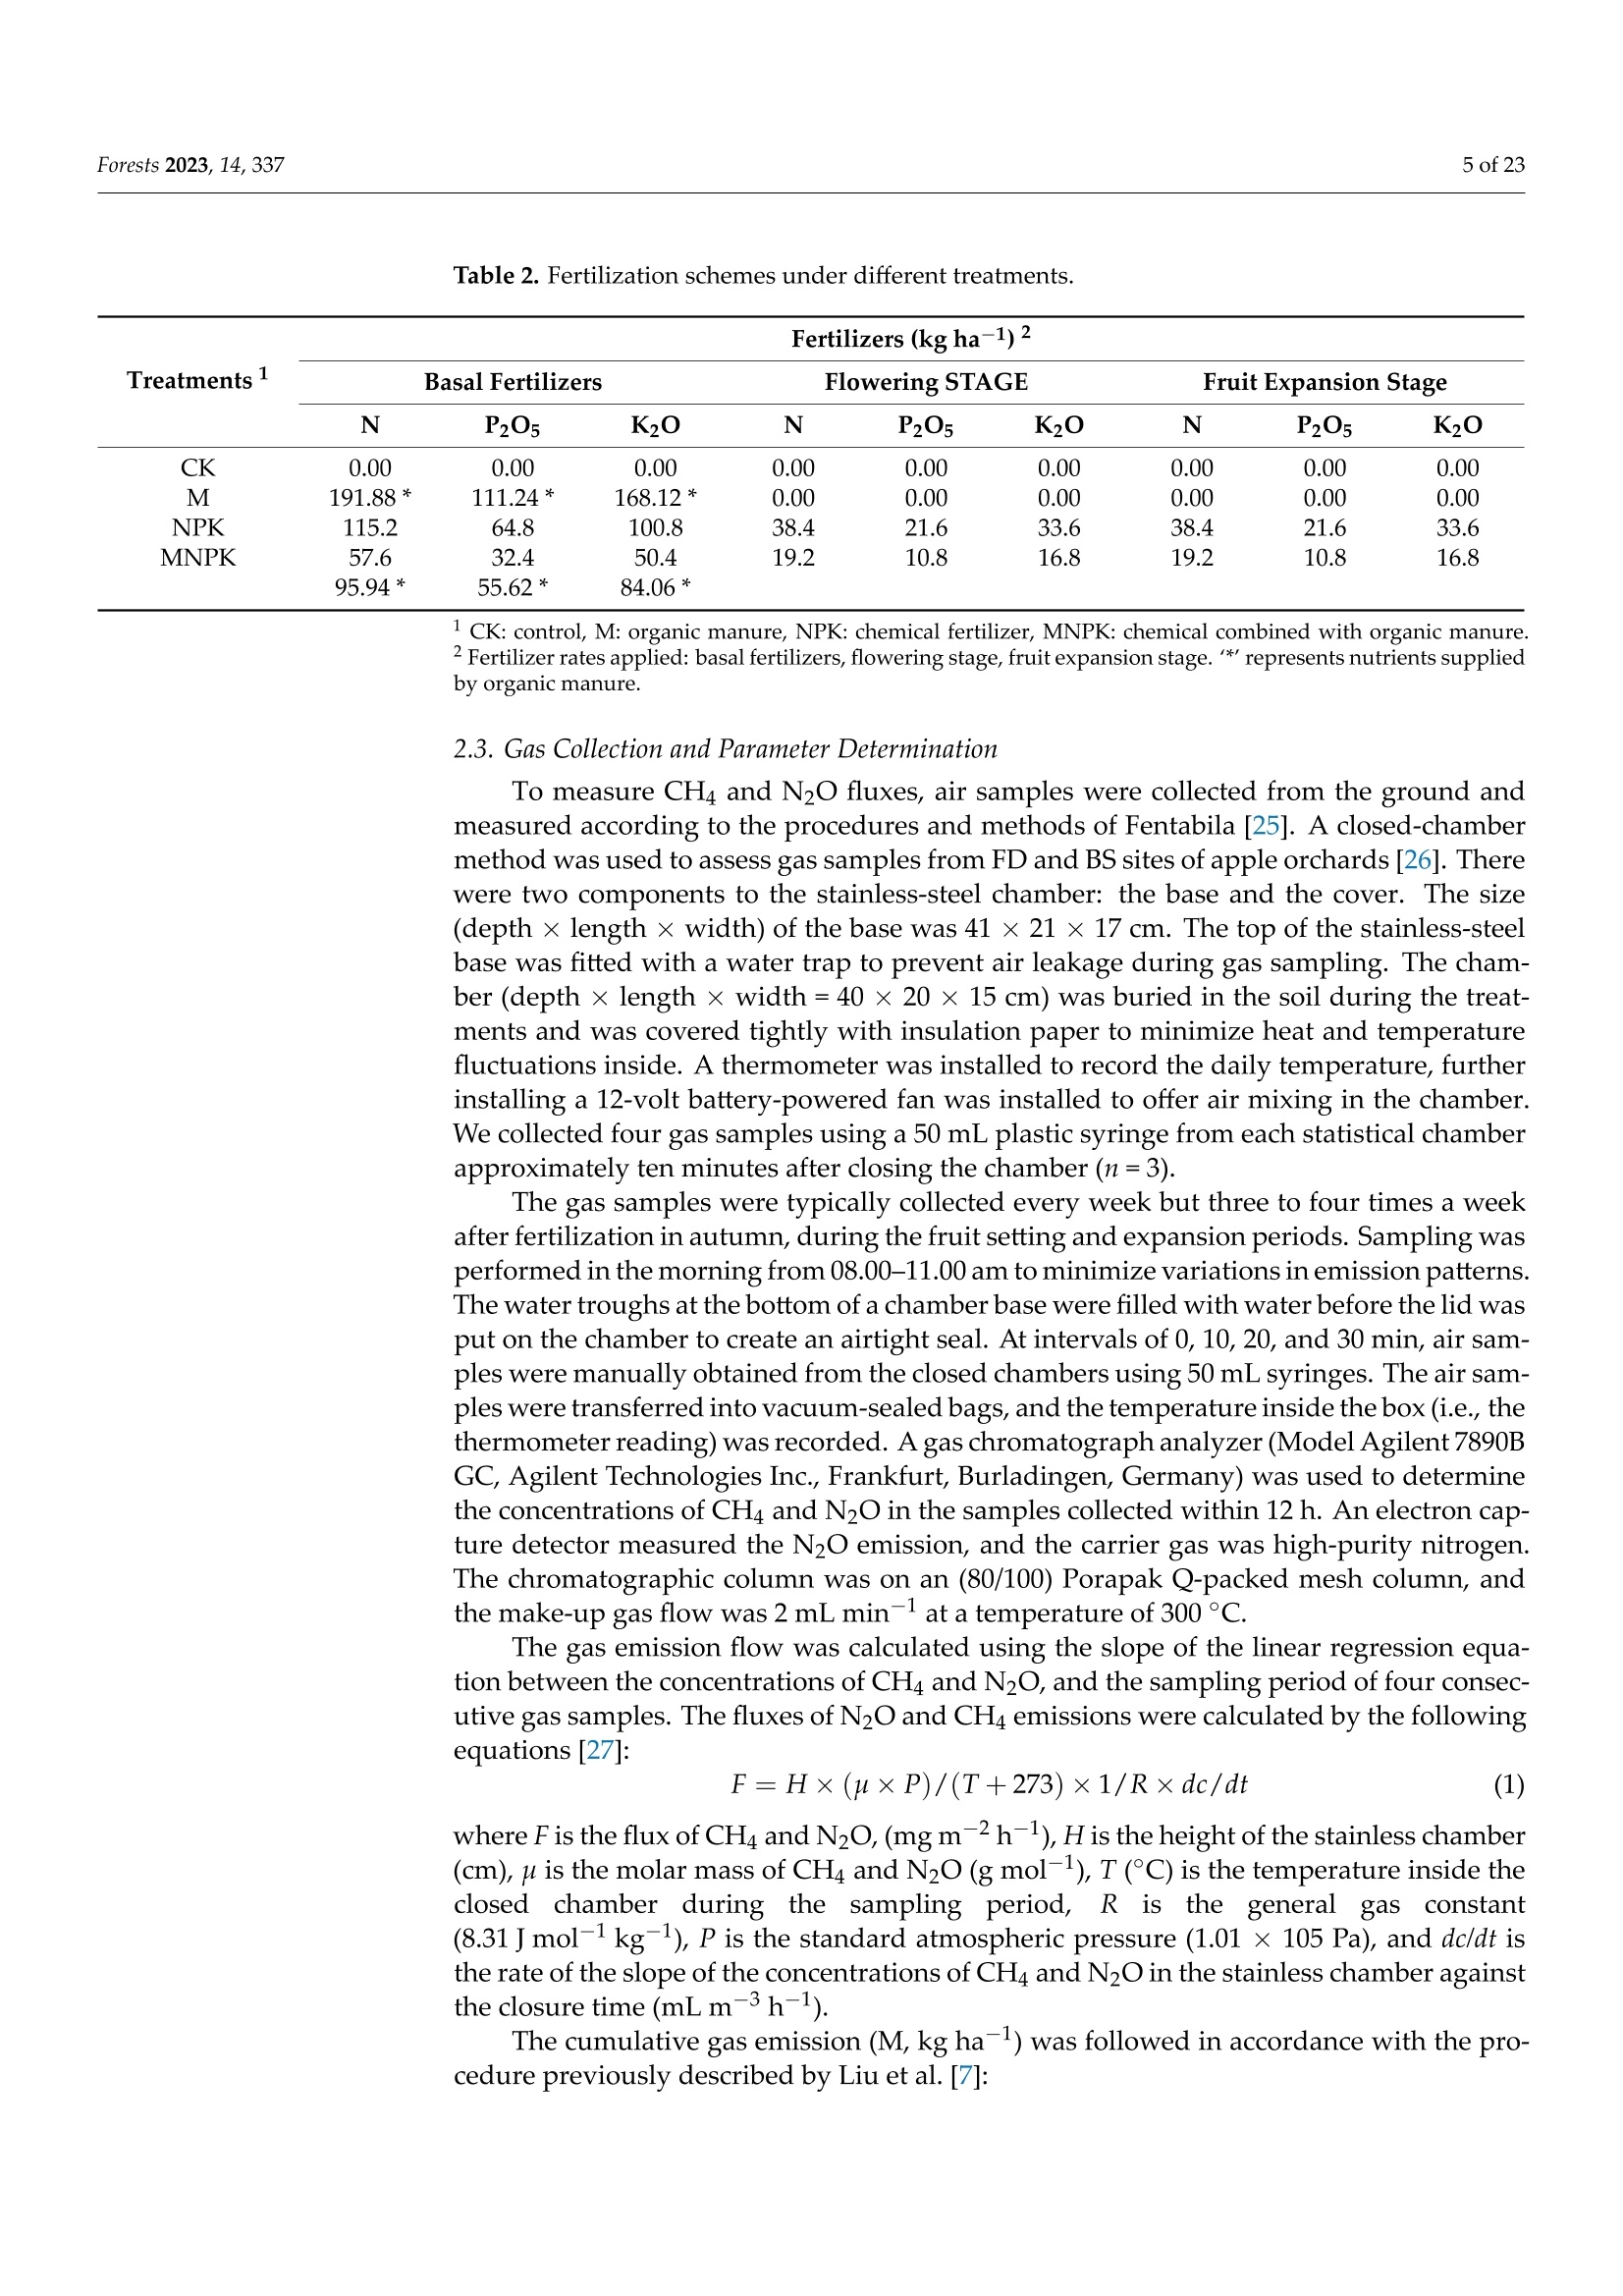
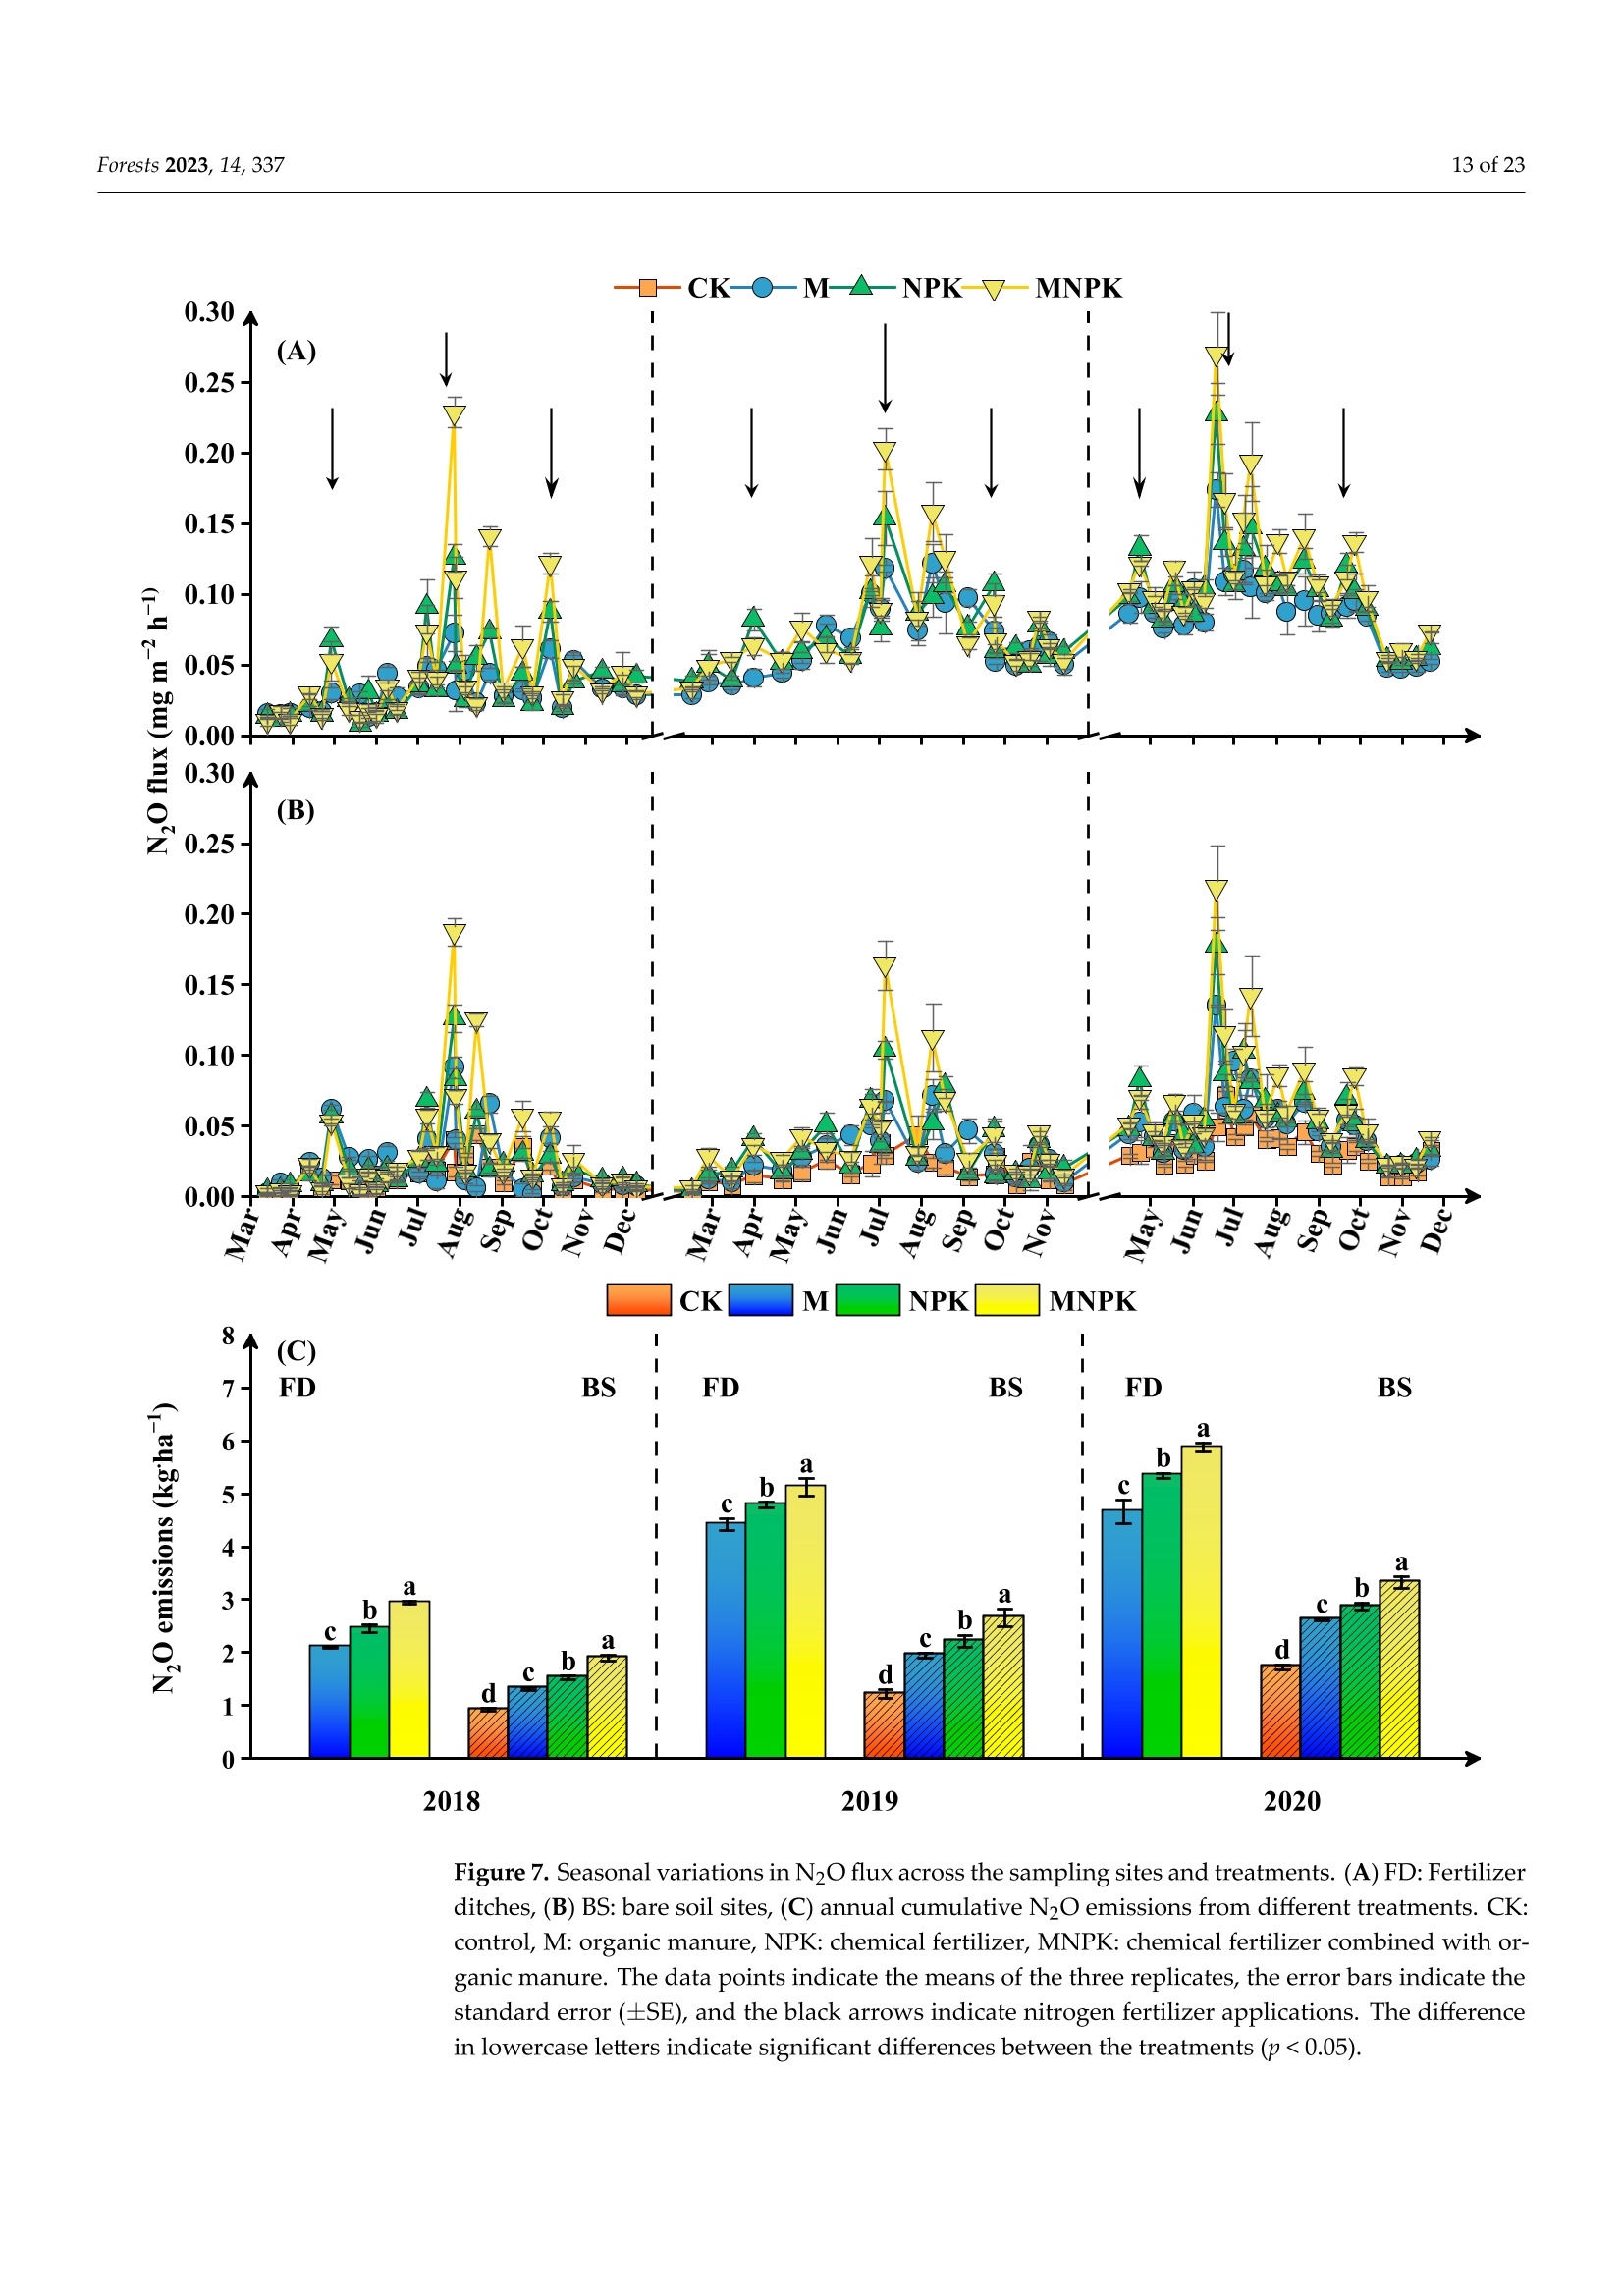
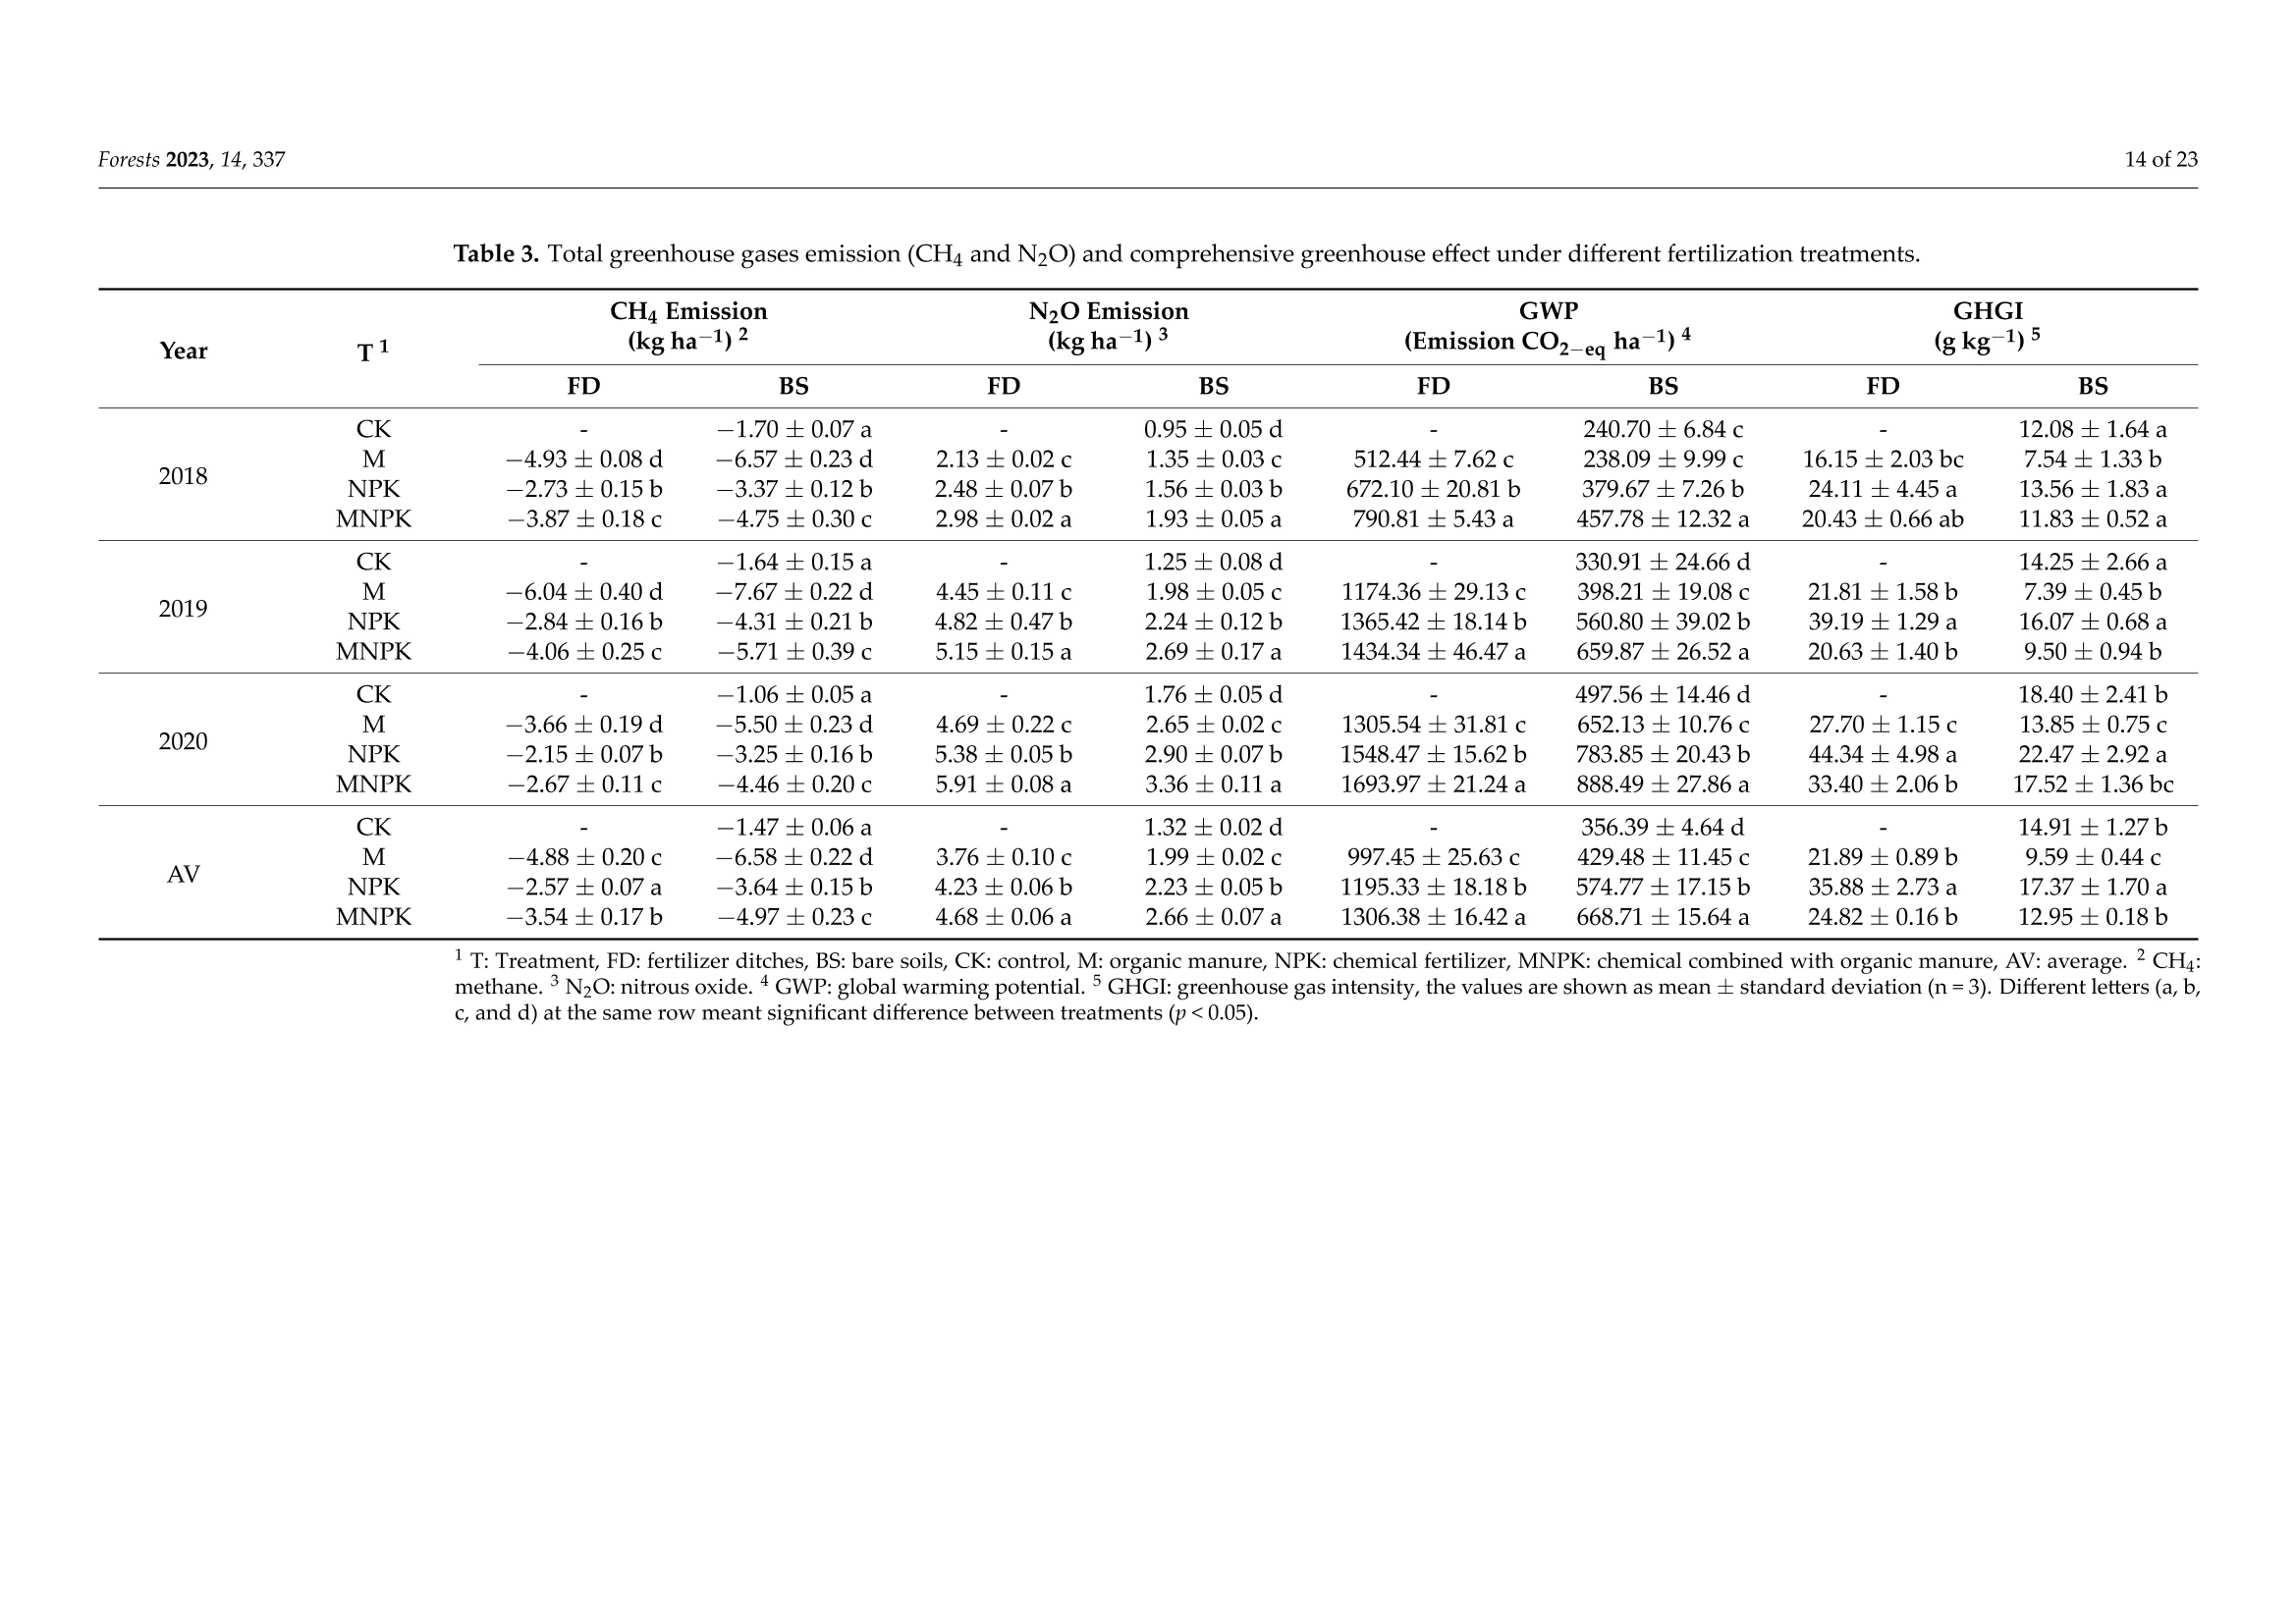
有机肥料和无机肥料联合应用对我国黄土高原地区苹果园全球变暖潜力和温室气体排放的影响Combined Application of Organic and Inorganic Fertilizers Effects on the Global Warming Potential and Greenhouse Gas Emission in Apple Orchard in Loess Plateau Region of China2of23Forests2023,14,337 Forests2023,14,3373of23 有机肥料和无机肥料联合应用对我国黄土高原地区苹果园全球变暖潜力和温室气体排放的影响 Article CombinedApplicationofOrganicandInorganicFertilizers EfefctsontheGlobalWarmingPotentialandGreenhouseGas EmissioninAppleOrchardinLoessPlateauRegionofChina ThongsoukSompouviset1,2 ,YantingMa1,2,ZhiyuanZhao1,2,ZhaoxiaZhen1,2,WeiZheng1,2,3,ZiyanLi1,2,3andBingnianZhai1,2,3,* 西北农林科技大学自然资源与环境学院 1 CollegeofNaturalResourcesandEnvironment,NorthwestA&FUniversity,Yangling712100,China 西北农林科技大学苹果实验站 农业部西北地区植物营养与农业环境重点实验室 2 AppleExperimentStation,NorthwestA&FUniversity,Baishui715600,China AcademicEditor:ChoonsigKim Received:24December2022 Revised:19January2023 Accepted:2February2023 Published:8February2023 Copyright: ©2023bytheauthors.Licensee MDPI, Basel, Switezrland.Thisarticleisanopenaccessarticle distributed under the terms and conditionsoftheCreativeCommons Atrtibution(CCBY)license(https://creativecommons.org/licenses/by/4.0/). 3 KeyLaboratoryofPlantNutritionandtheAgri‑EnvironmentinNorthwestChina,MinistryofAgriculture,Yangling712100,China * Correspondence:bingnianzhaitg@126.com;Tel.:+86‑158‑2926‑8554 Abstract:InorganicfertilizershavebeenwidelyusedtoachievehighappleyieldsthroughoutChina,especiallyinNorthwestChina.Thisapproachhasadverseefefctsonappleorchardsoilenvironments andgreenhousegas(GHG)emissions.Therefore,weinvestigatedtheefefctsofcombinedorganic andinorganicfertilizersonGHGemissions,soilproperties,andappleyieldtoassessthegreenhouse gasinventoryandtodeterminewhichfertilizationmannerisgoodforthesustainabledevelopment ofappleorchards.Asplitplotdesignwasused,withmaintreatmentoffertilizerditch(FD)site andabaresoil(BS)site,eachwithfoursubtreatments:organicfertilizer–goatmanure(M),chemi‑calfertilizer(NPK),chemicalfertilizercombinedwithorganicfertilizer–goatmanure(MNPK),and control(CK).ThecumulativeN2OemissionsattheFDsitewerehigherthanthoseattheBSsite(by 105.72%).TheN2Oemissionsrangedfromapproximately0.95–5.91kgha−1andwerehigherinthe MNPKtreatmentthanintheothertreatments.ThecumulativeCH4uptakefromeachtreatment wasgenerallynegative(1.06–7.67kgha−1).Comparedtotheothertreatments,theMNPKtreatment appliedattheFDsiteledtoanincreasedglobalwarmingpotential.AtboththeFDandBSsites,the MNPKtreatmentledtoalowergreenhousegasintensitythantheNPKtreatment.Nitratesnitrogen (NO3−‑N),water‑fliledporespace,andtemperatureallinfluencedGHGemissions.Theseresults showedthattheMNPKtreatmentwasmoreconducivethantheothertreatmentstothesustainable developmentofappleorchardsintheLoessPlateauregionofChina. Keywords: organicfertilizer;chemicalfertilizer;orchardplantation;globalwarmingpotential;greenhousegasemission 1.Introduction Climatewarminganditsimpactsarefocalissuesofcommonconcernintheinterna‑tionalcommunityandhavebeenextensivelyresearched.Globaltemperatureshaverisen inrecentyears[1]. Globalcarbondioxide(CO2)emissionsreboundedbyanincreaseof 4.80%in2021,reaching34.90GtCO2[2].Ifnofurtheremissionreductionefofrtsaremade,theconcentrationofanthropogenicgreenhousegases(GHG)willcontinuetorise. Car‑bondioxide(CO2),methane(CH4),nitrousoxide(N2O),andfluorinatedgases(HFC,PFC,SF6,andNF3)arethemainsourcesofGHGsthathavesignifciantimpactsonglobalclimate change.TheircontributionstotheGHGefefctreach11%,18%,4%,and2%,respectively[3].Approximately25%–30%ofallworldemissionsareatrtibutabletoagriculture[4].Green‑housegasemissionsinChinaarepartlyfromagriculturalactivities,whichaccountfor aboutapproximately7.80%oftotalGHGemissions[5]. NorthwestChinahasdrylandareasthataccountforalargeproportionofitsagricul‑turalareas. Therefore,thisregionisthemainsourceofagriculturalN2Oemissions. In theseareas,mostirrigationsystemsareunsustainableandvolatile.Rainfallisunevenall yearround[6].Thecontentofsoilorganicmatetr(SOM)isrelativelylowduetoimproper cultivationandsoilmanagement[7]. N2Oemissionsareenhanced,andthecapacityof drylandsoilstooxidizeCH4issignifciantlyimpactedbytheoveruseofinorganicfertiliz‑ersinagriculturalsoils,creatingatemporarydecreaseinsoilCH4uptaketopromotethe growthoforganicagriculture[8].Catltemanureandfarmyardmanurecanimprovesoil physically,chemically,andbiologically,andcanincreasesoilorganiccarbon(SOC)com‑position,soilcarbonsequestrationcapacity,N2Oemissions,andincreasecropyield[9,10]. PreviousresearchershavemainlyfocusedonCH4uptakeinricefeilds,butthere‑sultsofstudiesconductedindrylandshaverarelybeenreported.TheWeibeiDrylandin NorthwestChinaisnotonlyanimportantapple‑growingareabutiswidelyknownfor GHGemissions[6]. Appleorchardscoveranareaofapproximately4.69%ofthecultivatedareainthe LoessPlateau(approximately7.83×105ha−1)andaccountformorethan62%ofagricul‑turallandinthestudyarea[11].Accordingtopreviousdata,in2015,thetotalareaused forapplecultivationinShaanxiProvincewas628,550ha−1,representingthelargestareain China[12].Ingeneral,appletreesthrivewhenmacronutrientssuchasnitrogen(N),phos‑phorous(P),andpotassium(K)arepresent. Nitrogen,themostimportantessentialnu‑trient,helpsencouragevegetativegrowth(leavesandbranches).Phosphorusencourages rootandblossomdevelopment[13,14]. Recently,manyenvironmentalproblemsassoci‑atedwiththeproductionofapples,includingthelackofreasonablemanagementandthe useofinappropriatefertilizers,havearisen.Fertilizerrequirementsdifefrbytreespecies andamongfruittreesfordifefrentstagesofmaturity. Thesevariationsundoubtedlyin‑creasenitrogenfertilizerloss. InmostappleorchardgrowingareasoftheLoessPlateau region,chemicalfertilizer(NPK)applicationsintheSOMonlyrangesfrom1%–1.50%of organicinputs[15,16].ThisresultislowerthanthatforappleorchardsgrownintheUnited StatesofAmerica(>2%)[17].TheexcessiveuseofNPKfertilizersincreasesGHGemissions −andNemissions(NH3),nitrate‑N(NO3 ‑N)leaching,andPandKlossesinsoilwater[18]. 2.MaterialsandMethods 2.1.StudySite ThisexperimentwascarriedoutoverthreeyearsfromMarch2018toDecember2020intheappleorchardintheWeibeiDrylandExperimentalStationoftheNorthwestAgri‑◦◦cultureandForestryUniversityat(3521 N,10956 E;838mabovesealevel),Baishui County,ShaanxiProvince,China. Thisappleorchardhasbeenastudysitefor12years (Figure 1).AccordingtotheUSDA’ssoilclassifciationmethod,theexperimentalsoiltype,siltyloam,whichcontains67%silt,25%clay,and8%sand,wascategorizedashaplustalfs (Table 1).Theexperimentalcropwasestablishedin2005withFujiappletrees(Malusdomes‑ticaBorkh).Thetreeshadadensityof1200plantsha−1[6,16],theregionhadnoirrigation system,andrainfallwastheonlywaterresourceforagriculture. Figure1.Geographicallocationmapandexperimentalsite. Table1.Physicochemicalpropertiesofthesoilsintheexperimentalplots(0–20cmlayer). Parameters Mean pH(H2O) 8.30 Soilorganiccarbon[gkg−1] 13.00 TotalnitrogenTN[gkg−1] 1.05 TotalphosphorusP[mgkg−1] 15.95 TotalpotassiumK[mgkg−1] 151.22 Bulkdensity[gcm−3] 1.40 Clay[<2µm,%] 25.00 Silt[2–200µm,%] 67.00 Sand[>200µm,%] 8.00 ◦Foreachofthethreeyearsoftheperiodunderstudy,airtemperatureswere12C onaverageperyear.Theyearlyaveragetemperaturesoverthestudyperiod(2018,2019,◦◦◦and2020)were19.44C,19.23C,and18.02C,respectively.Thesoiltemperaturesvar‑◦◦iedbetween3.40Cand38.50Catadepthof20cm,withanaveragetemperatureof ◦21.20C.Theannualrainfallin2018,2019,and2020wasapproximately390mm,627mm,and719.10mm,respectively.Theannualrainfallin2020washigherthanthatin2019and 2018by9.00%and26.20%,respectively.Morethan80.00%oftherainfallintheappleor‑chardfellbetweenJulyandSeptembereachyear(Figure 2). Figure2.Seasonaldynamicsofprecipitation(mm)andsoiltemperature.?Blue:airtemperature,?red:soiltemperature(20cmdepth,◦C)inthestudiedappleorchardfrom2018to2020. 2.2.ExperimentalTreatmentsandDesign BetweenMarch2018andDecember2020,asplitplotdesignwasused,withthemain treatmentoffertilizerditch(FD)siteandabaresoil(BS)site,eachwithfoursubtreatments:organicmanure(M),chemicalfertilizer(NPK),chemicalfertilizercombinedwithorganic manure(MNPK),andcontrol(CK).Eachtreatmentareawasapproximately40m2.Urea N46%(ZhongkeAgriculturalBiotechnologyCo.,Ltd.,Jining,Shandong,China)wasap‑pliedthreetimes(60%inbasalfertilizersinautumn,20%inthefolweringstage,and20%in thefruitexpansionperiod),andsinglesuperphosphateP2O516%(HeilongjiangCentury YuntianhuaAgriculturalTechnologyCo.,Ltd.,Suihua,Heilongjiang,China)wasapplied threetimes(60%inbasalfertilizersinautumn,20%inthefolweringstage,and20%in thefruitexpansionperiod),PotassiumsulfateK2O50%(SDICXinjiangLuobupoPotash Co.,Ltd.,Hami,Xinjiang,China)wasappliedthreetimes(60%basalfertilizersinautumn,20%inthefolweringstage,and20%inthefruitexpansionperiod)andusedasbasalin‑organicfertilizer. Organicfertilizer(Goatmanure)wasappliedonceinbasalfertilizers inautumn(organiccarbon35.10%,nitrogenN0.53%,phosphorusP2O50.31%,potassium K2O0.47%).Thebasefertilizersweredepositedintheditches,evenlyspacedaroundeach appletree,similartoacross(depth×breadth=40cm×40cm). Adetailedamountof fertilizersineachtreatmentareshowninTable 2.Thetimesandratesoffertilizersamong thetreatmentsinappleorchardsweredeterminedaccordingtothemethodreportedby Zhaoetal.[6]. Table2.Fertilizationschemesunderdifefrenttreatments. Treatments1 BasalFertilizers FloweringSTAGE FruitExpansionStage N P2O5 K2O N P2O5 K2O N P2O5 K2O CK 0.00 0.00 0.00 0.00 0.00 0.00 0.00 0.00 0.00 M 191.88* 111.24* 168.12* 0.00 0.00 0.00 0.00 0.00 0.00 NPK 115.2 64.8 100.8 38.4 21.6 33.6 38.4 21.6 33.6 MNPK 57.6 32.4 50.4 19.2 10.8 16.8 19.2 10.8 16.8 95.94* 55.62* 84.06* 1CK:control,M:organicmanure,NPK:chemicalfertilizer,MNPK:chemicalcombinedwithorganicmanure.2Fertilizerratesapplied:basalfertilizers,folweringstage,fruitexpansionstage.‘*’representsnutrientssupplied byorganicmanure. 2.3.GasCollectionandParameterDetermination TomeasureCH4andN2Ofluxes,airsampleswerecollectedfromthegroundand measuredaccordingtotheproceduresandmethodsofFentabila[25].Aclosed‑chamber methodwasusedtoassessgassamplesfromFDandBSsitesofappleorchards[26].There weretwocomponentstothestainless‑steelchamber: thebaseandthecover. Thesize (depth×length×width)ofthebasewas41×21×17cm.Thetopofthestainless‑steel basewasfitetdwithawatertraptopreventairleakageduringgassampling. Thecham‑ber(depth×length×width=40×20×15cm)wasburiedinthesoilduringthetreat‑mentsandwascoveredtightlywithinsulationpapertominimizeheatandtemperature fluctuationsinside.Athermometerwasinstalledtorecordthedailytemperature,further installinga12‑voltbatetry‑poweredfanwasinstalledtoofefrairmixinginthechamber.Wecollectedfourgassamplesusinga50mLplasticsyringefromeachstatisticalchamber approximatelytenminutesafterclosingthechamber(n=3). Thegassamplesweretypicallycollectedeveryweekbutthreetofourtimesaweek afterfertilizationinautumn,duringthefruitsetitngandexpansionperiods.Samplingwas performedinthemorningfrom08.00–11.00amtominimizevariationsinemissionpatetrns.Thewatertroughsatthebototmofachamberbasewerefliledwithwaterbeforethelidwas putonthechambertocreateanairtightseal.Atintervalsof0,10,20,and30min,airsam‑plesweremanuallyobtainedfromtheclosedchambersusing50mLsyringes.Theairsam‑plesweretransferredintovacuum‑sealedbags,andthetemperatureinsidethebox(i.e.,the thermometerreading)wasrecorded.Agaschromatographanalyzer(ModelAgilent7890B GC,AgilentTechnologiesInc.,Frankfurt,Burladingen,Germany)wasusedtodetermine theconcentrationsofCH4andN2Ointhesamplescollectedwithin12h.Anelectroncap‑turedetectormeasuredtheN2Oemission,andthecarriergaswashigh‑puritynitrogen.Thechromatographiccolumnwasonan(80/100)PorapakQ‑packedmeshcolumn,and themake‑upgasfolwwas2mLmin−1atatemperatureof300◦C. Thegasemissionfolwwascalculatedusingtheslopeofthelinearregressionequa‑tionbetweentheconcentrationsofCH4andN2O,andthesamplingperiodoffourconsec‑utivegassamples.ThefluxesofN2OandCH4emissionswerecalculatedbythefollowing equations[27]: whereFisthefluxofCH4andN2O,(mgm−2h−1),Histheheightofthestainlesschamber (cm),µisthemolarmassofCH4andN2O(gmol−1),T(◦C)isthetemperatureinsidethe closed chamber during the sampling period, R is the general gas constant (8.31Jmol−1kg−1),Pisthestandardatmosphericpressure(1.01×10⁵Pa),anddc/dtis therateoftheslopeoftheconcentrationsofCH4andN2Ointhestainlesschamberagainst theclosuretime(mLm−3h−1). Thecumulativegasemission(M,kgha−1)wasfollowedinaccordancewiththepro‑cedurepreviouslydescribedbyLiuetal.[7]: whereMisthetotalcumulativefluxofCH4andN2O(kgha−1),FisthefluxesofCH4−2h andN2O(mgm−1),iisthethgassampling,(ti+1−ti)representstheintervalbetween twoadjacentmeasurementdates(d),nisthetotalnumberofmeasurementsduringthe cumulativeemissionobservationtime,and24isusedforunitconversion. AccordingtoannualcumulativeGHGemissions(CH4andN2O),thecarbondioxide equivalent(CO2)basedontheintegratedglobalwarmingpotential(GWP)ofCH4and N2Oemissionswascalculated[28]: −1),and25and298GWPisthetotalCO2equivalentofCH4,andN2O(kgCO2–eqha refertotherespectiveGWPmultiplesforCH4,andN2Ofluxemissionsoveraspecifeid timehorizon,generally100years. TheGHGIwasdeterminedaccordingtothemethodofLiu[7]: whereGWPisthecombinedwarmingpotentialofCH4,N2Oandyieldistheaveragefruit yield(tha−1). The direct N2O emission factor (EFd) was determined via a standard method ofIPCC[1]: −1),whereFNandFCKaretheannualemissionsofN2Owithandwithoutfertilization(kgha respectively,andNistheamountofNfertilizer(kgha−1). TheN2Oemissioncoefcfieintperunitoutwasdeterminedusingthemethodof Aliyuetal.[29]: CumulativeN2OisthecumulativeemissionofN2O(kgha−1),andyieldistheyieldofapples(kgha−1). TheemissionfactorcalculationforCH4perproductionunitisthe sameasthatforN2Oemissions. 2.4.SoilSampleCollectionandAnalysis 苹果树为主的果园中,分别从施肥沟(FD)和裸土(BS)进行GHG采样后采集土壤样品。 SoilsampleswerecollectedafterGHGsamplingeventfrombothfertilizerditch(FD)andabaresoil(BS)intheorcharddominatedbyappletrees.Dugbyanopen‑facedbucket probe,DIK‑1640boringstick(DaikiRikaKogyo,Co.,Ltd.,Saitama,Japan),thesoilsamples wereselectedneartheclosed‑chambertoadepthof20cmandreplicatedthreetimesin eachtreatment.Thecollectedsoilsamplesweremixedintooneuntilthoroughlycombined,packedinawell‑labeledzip‑lockbag,andkeptinanicecoolerboxwhichcankeepthe ◦temperatureat4Cinordertomovetothelaboratorywithin12h. Thecollectedsoil samplesweredividedintotwosub‑samples.Onesub‑samplewasfreshsoil,extractedto −analyzesoilbulkdensity,WFPS,NH4+‑N,andNO3‑N.Theothersub‑sampleswereair ◦driedandstoredintheroomat25Cforsevendaysbeforetheyweregroundbyusing aballmilltopassthroughthe(<2mm)sievetoremoveresidue. Afterthat,thesamples werepackedinziplockbagstoanalyzepH,TN,TP,TK,andSOC. Thesoilbulkdensitywasdeterminedbyputitngsampledsoilinacoreringtoadepth of5cm(EijkelkampAgrisearchEquipment,Co.,Ltd.,Giesbeek,TheNetherlands),andthe ◦subsequentsampleswereplacedinaconventionaloventodryfor24hat105C.Using theformulabelow,water‑fliledporespace(WFPS)indicatesthemoistureconditionofthe soilbeingtreated[30]: wherewiiswater‑fliledporespace(%),Wiisthesoilwaterstoragecapacity(mm),∆Siis thesoilmoisturedefciit(mm),Miisthemassofwetsoil(g),miisthesoilmassafterdrying (g),γiisthesoilbulkdensity(gcm−3),histhedepthofthesoillayer(cm),andWo,iand Worepresentthestablewaterstoragecapacityofthei‑thlayersoilandtheactualsoilwater storagecapacity(mm),respectively. −Soilammonium(NH4+)andnitrate(NO3)concentrationsweredeterminedusing 2MKCIwithasoiltosolutionratioof1:5.Theextractswereshakenbyanorbitalshakerat 100shakesperminuteforonehour(HeidolphUnimax1010,HeidolphInstrumentsGmbH &CO.,KG,Schwabach,Germany).Followingthat,theextractsandsoilsampleswerefli‑teredon0.45mWhatmanfliterpaperandanalyzedbyAA3,SEAL,Co.,Ltd.,Norderst‑edt,Germany.SoilpHwasmeasuredusingapHmeterconnectedwithaglasselectrode withasoiltowaterratioof1:2.5mixtureusingapHmeterconnectedwithaglasselec‑trode(ShanghaiInsmarkInstrumentTechnologyCo.,Ltd.,Shanghai,China).TheK2CrO7‑H2SO4oxidationmethodwasusedtomeasuresoilorganiccarbon[31].Tomeasuretotal nitrogen(TN),phosphorus(P),andpotassium(K)contents,soilwasdigestedwithH2SO4andH2O2inaKjeldathermdigestionunit(C.GerhardtGmbH&Co.,KGKönigswinter,Germany)[32].Precipitationandtemperaturedataarebasedonthemetrologicalstation directedbyWeibeiDrylandExperimentalStationofNorthwestAgricultureandForestry University,whichisabout50mawayfromanexperimentalarea. Soiltemperaturewas measuredatadepthof20cmbyusingProcheck(DecagonDevicesInc.,Pullman,WA,USA).Themeasuredareawasselectedneartheclosed‑chamberduringtheprocessof randomsampling. 2.5.FruitYield Wecollectedapplefruitsfromthetreesineachtreatment.Approximatelyninetrees wererandomlyselectedasameasureofappleyield,appleweight,andreplicateyield.The yieldfromeachreplicaapple(tha−1)wascalculatedbyapple,thenumberofapplestree−1,andthenumberoftreesha−1[16]. 2.6.StatisticalAnalysis Inthisstudy,SPSSversion22(SPSSInc.,Chicago,IL,USA)wasusedtoanalyzedata andtheKolmorov–Smirnovtestwasusedtotestthenormalityofthedata.Levenetestwas testedandlogx+1wastransformedtoanalyzethehomogeneityofvariance. One‑way analysisofvariance(ANOVA)wasusedtoevaluatethedifefrencesofseasonalandannual cumulativeCH4uptake,N2Oemissions,GWP,GHGI,andyieldbetweenthetreatments.Tukey’smultiplerangetestswereusedtodeterminewhethersignifciantdifefrencesoc‑curredbetweenthetreatmentsatasignifciancelevelof0.05. Atwo‑wayANOVAwas usedtoanalyzetheefefctsoftreatmentsandtheirinteractionsonCH4uptake,N2Oemis‑sions,GWP,GHGIandyieldthroughouttheexperimentalperiod. Excel2019software (MicrosoftCorporation,2019)wasusedtovisualizethedata. Thecorrelationbetween GHGEmissionsandsoilpropertieswasdeterminedusingRversion4.2.0software(Rcore Team202,Vienna,Austria),andgraphswereconstructedusingOriginPro2021(OriginPro,OriginLabCorporation,Northampton,MA,USA). 3.Results 3.1.EnvironmentalFactors Water‑fliledporespace(WFPS)in20cmsoildepthfrequentlyincreasedfromJune toSeptember,mostlyduetotherainfall. TheamountofWFPSintheappleorchardin‑◦creasedrapidlyto86%on24July2020aftertwodaysofrainatatemperatureof22Cand ◦decreasedby16%onMay262020atatemperatureof40C.In2018,2019,and2020,the averageWFPSsattheFDsitewere19.43%,20.34%,and22.56%,respectively,whereasthe averageWFPSsattheBSsitewere18.14%,18.82%,and21.50%,respectively. TheWFPScontentsfromtheMNPKtreatmentsweresignifciantlylargerthanNPK andCKtreatmentsatbothFDandBSsites(p<0.05;Figure 3A,B). Figure3.SeasonaldynamicsofsoilWFPScontentsacrossthesamplingsitesandtreatmentsfrom 2018to2020.(A)FD:fertilizerditchesWFPS,(B)BS:baresoilWFPS,CK:control,M:organicmanure,NPK:chemicalfertilizer,MNPK:chemicalfertilizercombinedwithorganicmanure.Thedatapoints indicatethemeansoffourreplicates,andtheerrorbarsindicatethestandarderror(±SE).Theblack arrowsrepresentthedateoffertilizerapplication. 3.2.SoilNH4+‑NandNO3−‑NContent Theseasonaldynamicsofthesoil,mostlyattheFDsite,wereevaluated.Theaverage soilNH4+‑Ncontentsforeachtreatmentfrom2018–2020rangedfrom13.14–18.97mgkg−1.TheannualhighestaverageamountofNH4+‑NinMNPKtreatmentwas16.75mgkg−1andthelowestamountinMtreatmentwas14.65mgkg−1. ComparedtoMtreatment,soilNH4+‑NcontentinNMPKtreatmentwassignifciantlyhigher(14.36%,p<0.01).The averageamountofNH4+‑NinsoilattheBSsitewas7.33–14.07mgkg−1throughoutthe treatment.TheannualhighestaverageamountofNH4+‑NinsoilinMNPKtreatmentwas 11.81mgkg−1,andthelowestamountinCKtreatmentwas7.64mgkg−1.ComparedtoCKtreatment,soilNH4+‑NcontentinNMPKtreatmentwassignifciantlyhigherby54.64%(Figure 4A,B). Figure4.SeasonaldynamicsofsoilNH4+‑Ncontentsacrossalltreatmentsfrom2018to2020.(A)FD:fertilizerditches,(B)BS:baresoil,CK:control,M:organicmanure,NPK:chemicalfertilizer,MNPK:chemicalfertilizercombinedwithorganicmanure.Thedatapointsindicatethemeansofthefour replicates,andtheerrorbarsindicatethestandarderror(±SE).Theblackarrowsrepresentthedate offertilizerapplication. −TheaverageamountofNO3 ‑NinsoilattheFDsitewas15.48–25.64mgkg−1from −2018–2020.TheannualhighestaverageamountofNO3 ‑NinsoilinMNPKtreatmentwas 21.64mgkg−1andthelowestamountinMtreatmentwas17.94mgkg−1.Theconversion rateinMNPKtreatmentwas20.62%whichwasgreaterthaninMtreatment.Theoverall−averageamountofNO3 ‑NinsoilattheBSsiteswas8.24–21.50mgkg−1. Theannual−highestaverageamountofNO3 ‑NinsoilinMNPKtreatmentwas18.48mgkg−1andthe lowestamountinMtreatmentwas8.43mgkg−1. Moreover,theaverageamountofsoil−NO3 ‑NinMNPKtreatmentwashigherthanCKtreatmentby119.32%. −Accordingtotheresultsfoundinthisstudy,thecontentofNO3 ‑NattheFDsitewas −higherthantheBSsite.Figure 5A,BshowthattheannualaverageamountofNO3 ‑Nin −appleorchardsin2018and2019weresimilar,whiletheamountofNO3 ‑Ninsoilin2020wasmuchgreater. Figure5.SeasonaldynamicsofsoilNO3−‑Ncontentsacrossalltreatmentsfrom2018to2020.(A)FD:fertilizerditches,(B)BS:baresoil,CK:control,M:organicmanure,NPK:chemicalfertilizer,MNPK:chemicalfertilizercombinedwithorganicmanure.Thedatapointsindicatethemeansofthefour replicates,andtheerrorbarsindicatethestandarderror(±SE).Theblackarrowsrepresentthedate offertilizerapplication. 3.3.CH4Fluxes TheCH4fluxesfollowedsimilarpatetrnsseasonallywithineachtreatmentandbe‑tweenyears(Figure 6A–C).TheCH4fluxesinthetreatmentsfrom2018–2020rangedfrom0.01–0.86mgm−2h−1.AttheFDsite,theaverageCH4fluxeswas0.01–0.30mgm−2h−1,intheNPKtreatmentbetween0.01and0.50mgm−2h−1intheMNPKtreatment,and between0.01and0.86mgm−2h−1intheMtreatment. TheCH4fluxesattheBSsite rangedfrom0.02–0.76mgm−2h−1. WithintheBSsite,theaverageCH4fluxeswere 0.02–0.15mgm−2h−1fortheCKtreatment,0.01–0.26mgm−2h−1fortheNPKtreatment,0.02–0.38 mg m−2 h−1 for the MNPK treatment, and 0.02–0.76 mg m−2 h−1 for the Mtreatment. Generally,theCH4fluxeswithineachtreatmentwerehighestinsummerandspring andloweredinwinter.AtboththeFDandBSsites,theMtreatmenthadthehighestCH4fluxes,whereastheCKandNPKtreatmentshadthelowestfluxes.ThevaluesoftheCH4fluxesineachtreatmentshowedslightsinksintheappleorchard.Betweentreatmentand trialyears,wefoundsignifciantchanges(p<0.01;Figure 6A–C). Figure6.VariationinCH4fluxesunderdifefrenttreatments.(A)FD:Fertilizerditches,(B)BS:Bare soilsites,(C)annualcumulativeCH4uptakefromdifefrenttreatments.CK:control,M:organicma‑nure,NPK:chemicalfertilizer,MNPK:chemicalfertilizercombinedwithorganicmanure.Thedata pointsindicatethemeansofthethreereplicates.Theerrorbarsindicatethestandarderror(±SE),andtheblackarrowsindicatenitrogenfertilizerapplications,thedifefrenceinlowercaseletetrsin‑dicatesignifciantdifefrencesbetweenthetreatments(p<0.05). 3.4.N2OFluxes TheN2OfluxesattheFDsitewereintherangeof0.01to0.27mgm−2h−1. The NPKfluxeswereat0.01and0.23mgm−2h−1,andtheMtreatmentwasbetween0.01and0.17mgm−2h−1.TheN2Oemissions,mostlyinappleorchards,peakedinJuneand SeptemberanddecreasedbetweenlateOctoberandApril. TheN2OfluxesincreasedwithhighersoiltemperaturesandanincreaseinWFPS.LargeN2OfluxeswerefoundinsoilsintheMNPKtreatmentattheFDsite.On7July2020,−2h−1werefoundduringthesecondannualfertilization N2Ofluxesashighas0.27mgm event,duringtheseasonwhenappleseedsgrowwell.On1August2020,theWFPSwas −2h−145.02%.Afterthepreviousthreeconsecutivedaysofrain,theN2Ofluxof0.19mgm intheMNPKwassignifciantlyincreasedcomparedtotheothertreatments(p<0.05).The N2Ofluxeswerehigherafterfertilizationineachapplegrowingseasonandafterrainfall.TheseasonalN2Ofluxesinthisstudyduringtheappleproductionperiodoverthethree yearsattheFDandBSsitesweresimilar. TheN2OfluxesattheBSsiteswerebetween 0.01–0.18mgm−2h−1.TheoverallN2OfluxesintheMNPK,M,NPK,andCKtreatments rangedfrom0.01–0.22,0.01–0.18,0.01–0.14,and0.01–0.07mgm−2h−1,respectively,over thethreeyearsofthestudy’sduration(Figure 7A–C). 3.5.AnnualCH4andN2OEmissions TheCH4uptakeofthetreatmentsrangedfrom1.25to6.04kgha−1.AttheFDsite,the averageannualsoilCH4uptakevaluesfor2018,2019,and2020intheMtreatmentwere 4.93,6.04,and3.66kgha−1,respectively;thoseintheNPKtreatmentwere2.73,2.84,and 2.15kgha−1,respectively;thoseintheMNPKtreatmentwere3.87,4.06,and2.67kgha−1,respectively. TheCH4uptakeattheBSsitewas1.06–7.67kgha−1. AttheBSsites,the annualaverageCH4uptakevaluesfor2018,2019,and2020intheCKtreatmentwere 1.70,1.64,and1.06kgha−1,respectively;thoseintheMtreatmentwere6.57,7.67,and 5.50kgha−1,respectively;thoseintheNPKtreatmentwere3.37,4.31,and3.25kgha−1,andMNPKtreatmentwas4.75,5.71,and4.46kgha−1(p<0.05),respectively. TheN2OemissionsattheFDsiterangedfrom2.13–5.91kgha−1.Theannualaverage N2Oemissionsfor2018,2019,and2020attheFDsitewere2.13,4.45,and4.69kgha−1for theMtreatment,respectively;2.48,4.82,and5.38kgha−1fortheNPKtreatment,respec‑tively;and2.98,5.15,and5.91kgha−1fortheMNPKtreatment,respectively(p<0.05).In thecurrentstudy,theMNPKtreatmentsproducedmoreN2OemissionsthantheNPKand Mtreatments(by10.73%and24.60%,respectively). TheN2OemissionsattheBSsiterangedfrom0.95–3.36kgha−1.TheN2Oemissions intheCK,M,NPK,andMNPKtreatmentsfor2018,2019,and,2020were0.95,1.25,and 1.76kgha−1fortheCKtreatment,respectively;1.35,1.98,and2.65kgha−1fortheMtreat‑ments,respectively;1.56,2.24,and2.90kgha−1fortheNPKtreatment,respectively;and 1.94,2.69,3.36kgha−1fortheCKtreatment,respectively.ComparedtoNPKandCK,the MNPKtreatmentincreasedN2Oemissionsby19.11%and101.77%,respectively. Signif‑i cantlydifefrentN2Oemissionswereobservedduringsoilandwaterincubationtempera‑tures(p<0.05). TrendsinN2Oemissionswereobserved,withsimilaremissionsatboth theFDandBSsites.AccordingtoTable 3,theFDsitehadhigherN2Oemissionsthanthe BSsiteby105.72%(p<0.05). AtboththeFDandBSsites,thecumulativeamountofN2Oemissionsin2020was higherthanthatin2019and2018. TheMNPKandNPKtreatmentshadmoresignif‑i cantN2OemissionsthantheMandCKtreatments,andthetreatmentsandyearsdifefred substantially(p<0.01). Figure7.SeasonalvariationsinN2Ofluxacrossthesamplingsitesandtreatments.(A)FD:Fertilizer ditches,(B)BS:baresoilsites,(C)annualcumulativeN2Oemissionsfromdifefrenttreatments.CK:control,M:organicmanure,NPK:chemicalfertilizer,MNPK:chemicalfertilizercombinedwithor‑ganicmanure.Thedatapointsindicatethemeansofthethreereplicates,theerrorbarsindicatethe standarderror(±SE),andtheblackarrowsindicatenitrogenfertilizerapplications.Thedifefrence inlowercaseletetrsindicatesignifciantdifefrencesbetweenthetreatments(p<0.05). Table3.Totalgreenhousegasesemission(CH4andN2O)andcomprehensivegreenhouseefefctunderdifefrentfertilizationtreatments. Year T1 CH4Emission N2OEmission GWP GHGI (kgha−1)2 (kgha−1)3 (EmissionCO2−eqha−1)4 (gkg−1)5 FD BS FD BS FD BS FD BS 2018 CK ‑ −1.70±0.07a ‑ 0.95±0.05d ‑ 240.70±6.84c ‑ 12.08±1.64a M −4.93±0.08d −6.57±0.23d 2.13±0.02c 1.35±0.03c 512.44±7.62c 238.09±9.99c 16.15±2.03bc 7.54±1.33b NPK −2.73±0.15b −3.37±0.12b 2.48±0.07b 1.56±0.03b 672.10±20.81b 379.67±7.26b 24.11±4.45a 13.56±1.83a MNPK −3.87±0.18c −4.75±0.30c 2.98±0.02a 1.93±0.05a 790.81±5.43a 457.78±12.32a 20.43±0.66ab 11.83±0.52a 2019 CK ‑ −1.64±0.15a ‑ 1.25±0.08d ‑ 330.91±24.66d ‑ 14.25±2.66a M −6.04±0.40d −7.67±0.22d 4.45±0.11c 1.98±0.05c 1174.36±29.13c 398.21±19.08c 21.81±1.58b 7.39±0.45b NPK −2.84±0.16b −4.31±0.21b 4.82±0.47b 2.24±0.12b 1365.42±18.14b 560.80±39.02b 39.19±1.29a 16.07±0.68a MNPK −4.06±0.25c −5.71±0.39c 5.15±0.15a 2.69±0.17a 1434.34±46.47a 659.87±26.52a 20.63±1.40b 9.50±0.94b 2020 CK ‑ −1.06±0.05a ‑ 1.76±0.05d ‑ 497.56±14.46d ‑ 18.40±2.41b M −3.66±0.19d −5.50±0.23d 4.69±0.22c 2.65±0.02c 1305.54±31.81c 652.13±10.76c 27.70±1.15c 13.85±0.75c NPK −2.15±0.07b −3.25±0.16b 5.38±0.05b 2.90±0.07b 1548.47±15.62b 783.85±20.43b 44.34±4.98a 22.47±2.92a MNPK −2.67±0.11c −4.46±0.20c 5.91±0.08a 3.36±0.11a 1693.97±21.24a 888.49±27.86a 33.40±2.06b 17.52±1.36bc AV CK ‑ −1.47±0.06a ‑ 1.32±0.02d ‑ 356.39±4.64d ‑ 14.91±1.27b M −4.88±0.20c −6.58±0.22d 3.76±0.10c 1.99±0.02c 997.45±25.63c 429.48±11.45c 21.89±0.89b 9.59±0.44c NPK −2.57±0.07a −3.64±0.15b 4.23±0.06b 2.23±0.05b 1195.33±18.18b 574.77±17.15b 35.88±2.73a 17.37±1.70a MNPK −3.54±0.17b −4.97±0.23c 4.68±0.06a 2.66±0.07a 1306.38±16.42a 668.71±15.64a 24.82±0.16b 12.95±0.18b 1T:Treatment,FD:fertilizerditches,BS:baresoils,CK:control,M:organicmanure,NPK:chemicalfertilizer,MNPK:chemicalcombinedwithorganicmanure,AV:average.2CH4:methane.3N2O:nitrousoxide.4GWP:globalwarmingpotential.5GHGI:greenhousegasintensity,thevaluesareshownasmean±standarddeviation(n=3).Difefrentletetrs(a,b,c,andd)atthesamerowmeantsignifciantdifefrencebetweentreatments(p<0.05). 3.6.TheGWP,GHGI,andN2OEFd AttheFDsite,theGWPsintheNPK,M,andMNPKtreatmentsfor2018,2019,and 2020were672.10,1365.42,and1548.47kgCO2–eqha−1fortheNPKtreatment,respec‑tively;512.44,1174.36,and1305.54kgCO2–eqha−1fortheMtreatment,respectively;and−1fortheMNPKtreatment,respectively.Com‑790.81,1434.34,and1693.97kgCO2–eqha paredtotheNPKandMtreatments,theGWPfortheMNPKtreatmentswashigher,by 9.29%and30.97%,respectively. Inthepresentstudy,attheBSsites,theGWPequiva‑lentsofCO2intheCK,M,NPK,andMNPKtreatmentsin2018,2019,and2020were asfollows:240.70,330.91,and497.56kgCO2–eqha−1fortheCKtreatment,respectively;238.09,398.21,and652.13kgCO2–eqha−1fortheMtreatment,respectively;379.67,560.80,−1fortheNPKtreatment,respectively;and457.78,659.87,and and783.85kgCO2–eqha 88.49kgCO2–eqha−1fortheMNPKtreatment,respectively.TheGWPequivalentofCO2washigherfortheMNPKtreatmentthanfortheMandCKtreatments. Withintheappleorchard,attheFDandBSsites,cumulativeGHGIchangeswere foundamongtheyearsstudied(Table 3).AttheFDsite,theGHGIintheNPKtreatment wasgreaterthanthatintheMNPKtreatments(p<0.01).ThroughouttheBSsite,theval‑uesoftheGHGIin2018,2019,and2020intheCKwere12.08,14.25,and18.40gkg−1,respectively;thoseintheMwere7.54,7.39,and13.85gkg−1,respectively;thoseinthe NPKwere13.56,16.07,and22.47gkg−1,respectively;thoseintheMNPKwere11.83,9.50,and17.52gkg−1,respectively. AttheBSsite,theGHGIintheNPKtreatmentwas 16.49%and34.12%higherthanthatintheCKandMNPKtreatments,respectively(Table 3).BothmaintreatmentsfoundthatMNPKdidnotafefctGHGIcomparedtoNPK,although MNPKfromGWPwashigherthantheothertreatments.Nevertheless,theappleyieldof MNPKishigh,sotheGHGIofMNPKislowcomparedtothatofNPK. ThedirectEFdfellfrom0.23%–0.65%attheFDsite. Overall,thedirectEFdofthe MNPKtreatment(21.72%)increasedsignifciantlycomparedwiththatoftheNPKtreat‑ment.Onaverage,thedirectEFdin2020washigherthanthatin2018and2019by117.63%and3.93%,respectively. AttheBSsite,theaveragevaluesofthedirectEFdintheNPK andMNPKtreatmentswere0.09%–0.25%. Onaverage,comparedtotheNPKtreatment,theMNPKtreatment’sdirectEFdvaluewassignifciantlyincreased.Table 4showsthatthe directEFdvalueof2020comparedto2018and2019washigherthanthevaluesof71.95%and12.28%,respectively. 3.7.AppleYield Table 4showsthattheyieldofapplesvariedsignifciantlybyyear(p<0.05).Theaver‑ageappleyieldsofallthetreatmentsandyearswere20.12and69.71tha−1,respectively.Theaverageappleyieldsin2018,2019,and2020intheCK,M,NPK,andMNPKtreatments were23.67,44.44,32.82,and53.09tha−1,respectively.TheMNPKtreatment’saverageap‑pleyieldsweregreateroverallthanthoseoftheM,NPK,andCKtreatmentsby19.47%,61.73%,and124.27%,respectively. Table4.AppleYield,N2OEFd,andtheyield‑scaledgreenhousegasemissions. Year T1 AppleYield (tha−1)2 Yield‑ScaledCH4Absorption (kgt−1)3 Yield‑ScaledN2O Emission(kgt−1)4 N2OEmissionFactor EFd(%)5 FD BS FD BS FD BS 2018 CK 20.12±2.22c ‑ −0.08±0.19a ‑ 0.05±0.26ab ‑ ‑ M 32.13±4.86b −0.16±0.24b −0.21±0.03c 0.07±0.08b 0.04±0.31b ‑ ‑ NPK 28.38±4.20b −0.10±0.14a −0.12±0.02b 0.09±0.16a 0.06±0.11a 0.23±0.01b 0.09±0.07b MNPK 38.73±1.01a −0.10±0.05a −0.12±0.02b 0.08±0.25ab 0.05±0.18ab 0.32±0.07a 0.15±0.08a 2019 CK 23.59±3.22d ‑ −0.07±0.04a ‑ 0.05±0.22b ‑ ‑ M 53.98±2.66b −0.11±0.12c −0.14±0.08d 0.08±0.06b 0.04±2.11c ‑ ‑ NPK 34.87±1.35c −0.08±0.06b −0.12±0.08c 0.14±0.04a 0.06±0.18a 0.53±0.01b 0.15±0.22b MNPK 69.71±4.30a −0.06±0.01a −0.08±0.02b 0.07±0.04b 0.04±0.25c 0.62±0.20a 0.23±0.02a 2020 CK 27.30±3.10c ‑ −0.04±0.19a ‑ 0.06±0.19b ‑ ‑ M 47.19±2.93a −0.08±0.05c −0.12±0.16c 0.10±0.04b 0.05±0.17b ‑ ‑ NPK 35.22±3.90b −0.06±0.06b −0.09±0.42b 0.15±0.17a 0.08±0.11a 0.54±0.09b 0.17±0.02b MNPK 50.82±2.43a −0.05±0.04b −0.09±0.22b 0.12±0.07b 0.06±0.28b 0.65±0.15a 0.25±0.02a AV CK 23.67±2.30d ‑ −0.06±0.01a ‑ 0.06±0.01b ‑ ‑ M 44.44±1.53b −0.12±0.01c −0.16±0.01d 0.08±0.03b 0.04±0.01c ‑ ‑ NPK 32.82±2.20c −0.08±0.04b −0.11±0.01c 0.13±0.09a 0.07±0.01a 0.43±0.01b 0.14±0.01b MNPK 53.09±0.89a −0.07±0.02a −0.10±0.04b 0.09±0.01b 0.05±0.01bc 0.52±0.01a 0.21±0.01a 1T:Treatment,FD:fertilizerditches,BS:baresoils,CK:control,M:organicmanure,NPK:chemicalfertilizer,MNPK:chemicalcombinedwithorganicmanure,AV:average.2Apple productionmeasuredasfreshweight.3Yield‑scaledCH4absorption.4Yield‑scaledN2Oemission.5EFd:N2Oemissionfactor.Thevaluesareshownasmean±standarddeviation (n=3),respectively.Difefrentletetrs(a,b,c,andd)atthesamerowmeantsignifciantdifefrencebetweentreatments(p<0.05). 3.8.RelationshipbetweenGHGEmissionsandInfluencingFactors Thecorrelationanalysis(showninFigure 8)revealedanegativeassociationbetween −CH4uptakewithNO3 ‑N,NH4+‑N,airtemperature,andWFPS(p<0.05).TheN2Oemis‑−sionsweresignifciantlypositivelylinkedwiththeNO3 ‑Nconcentration,air,soiltemper‑ature,pH,andWFPSatdifefrentlevels. However,NH4+‑Nwasconcentratedinthesoil andshowednosignifciantrelationshipwithN2Oemissions.Inaddition,ourstudyfound thatthecorrelationsbetweenaverageannualrainfallandWFPSwere20.75%,21.57%,and 24.20%for2018,2019,and2020,respectively.WefoundthattheWFPSin2018waslower thanthatin2019and2020byapproximately3.80%and14.26%,respectively. Thisde‑creasewouldhavecausedacorrespondingdecreaseinnitrifciationanddenitrifciation,causingN2Oemissionstobereducedin2018comparedwith2019and2020.Inaddition tofertilizerapplicationintheagriculturalprocess,theamountofrainfalleachyear,the −WFPS,airtemperature,soilclimate,concentrationofNO3 ‑N,andpHalsoinfluenceGHG emissions(Figure 8). Figure8. CorrelationsbetweenGHGemissionsandsoilproperties. N2O:nitrousoxide,CH4:methane,NO3−‑N:nitratenitrogen,NH4+‑N:ammoniumnitrate,TN:totalnitrogen,SOC:soilor‑ganiccarbon,T:soiltemperature,WFPS:water‑fliledporespace.Signifciancelevels:*0.05,**0.01,***0.001.Negativecorrelationsarehighlightedinblue,andpositivecorrelationsarehighlightedin red.Arichercolorindicatesastrongercorrelation.Darkblueindicateslinearcorrelation. 4.Discussion 4.1.TheEfefctofCH4EmissionsfromSoilsintheFDandBSSitesunderDifefrent FertilizerApplications Nevertheless,afewstudieshaveshownthataconsistentapplicationofnitrogenand manuredecreasedtheamountofCH4thatsoilsabsorbed[20].Theresultsofourstudyare consistentwiththoseofearlierresearch. Fanetal.[35]observedthattheuptakeofCH4followingfermentedcatltemanurewashigherthanthatfollowingNPKfertilizeralone.It ispossiblethatusinganorganicfertilizercanleadtotheavailabilityofmorecarbon(C)for methanotrophsthanothertreatments[20].Animalmanuresandfarmyardmanureapplied overalongperiodmayincreasesoilporosityandimprovesoilpermeability,structure,and increasedCH4uptake[36–39]. PreviousstudieshavesuggestedthatNH4+‑Nmightbeusedasamethanotrophsub‑stratetopreventCH4fluxes,sinceitsmolecularcompositioniscomparabletoCH4up‑take[40].TheamountofNH4+‑NinthesoilisnegativelyrelatedtoCH4uptake(Figure 8).Inourstudy,NH4+‑NlevelsinthesoilandCH4oxidationlevelswerenotcorrelated.When thesoilNH4+‑Ncontentdecreases,theamountofCH4absorptionincreases.Thissituation occursbecauseofcompetitionbetweenthebacteriathatoxidizeCH4andthehighconcen‑trationofNH4+‑Nthatremainsafterfertilization.Thiscompetitionofthedevelopmentand activitiesofCH4‑oxidizingbacteriareducesCH4oxidativeabsorption,whichthenraises CH4andlowersitsoxidativecapability[38]. AtboththeFDandBSsites,theNPKandMNPKtreatmentsincreasedthesoilcontents −ofNO3 ‑NinthesoilanddecreasedthefluxesofCH4intheMtreatment(Figure 5A,B).−However,severalstudieshaveshownthattheamountofNO3 ‑Ninthesoilcaninhibit −CH4fluxes[41]. CH4productiondecreaseswhenNO3 ‑Ndecreases,creatingamore competitiveenvironmentforcommonsubstratesthanmethanogens,whicharemoreabun‑dant[42].CH4uptakeisnegativelycorrelatedwithWFPSandsoiltemperatures[33,35,43],asshownin(Figure 8).IncreasesintheWFPSofsoilsresultintheoxygencontentandgas diffusioncoefcfieintinthesoildecreasingwithincreasesinwatercontent[44].Mfertilizer utilizationandWFPShadimportantefefctsonsoilCH4. Thisstudyshowedthatapply‑ingMfertilizerscanreducecumulativeCH4emission. AtboththeFDandBSsites,all treatmentsefefctivelyreducedCH4emission.However,appleorchardshadnohighCH4emissionontheLoessPlateau. 4.2.TheEfefctofN2OEmissionsfromSoilsatFDandBSSitesunderDifefrent FertilizerApplications N2Oemissionsmainlyproducenitrifciationanddenitrifciationbymicroorganismsin agriculturalsoil[45–47].TheconcentrationofCandNsubstratessignifciantlyimpactsthe amountofN2Oemissionsproducedinthesoil. Whenthecarbonsubstrateissufcfieint,nitrousoxideemissionsaremainlyrestrictedbythelevelofnitrogensupply[48].There‑sultsofthisstudydemonstratedthatMNPKfertilizerhadthehighestperformance.This approachreducedtheuseofNPKfertilizersandstimulatedandpromotedtheuseofor‑ganicwastefromintegratedagriculture.Appleorchardresiduesemergedasapromising sourcefordiversevalue‑addedproductsderivedfromcellulose‑richmaterials(branches andleaves,applepomace,fruitwaste)thatcanbeconvertedintobiofertilizers,biochar,biomethane, bioethanol, biofuels, and biochemicals, such as organic, acids, and enzymes[49].Accordingtothisstudy,theN2OemissionsfromtheFDsiteincreasedby 105.72%comparedtothosefromtheBSsite.TheaccumulatedN2OintheMNPKtreatment wassignifciantlymoresignifciantthanthatintheNPK,M,andCKtreatments(p<0.01). Fengetal.[50]reportedthatundersimilarconditions,i.e.,whenNwasappliedinequal amounts,thetreatmentsusingsolelyMorNPKfertilizershadlowerN2OthantheMNPK treatment. ThisresultmayhaveoccurredbecausetheapplicationofonlyNPKfertiliz‑ersprovidesenoughsubstratenitrogenforsoilmicroorganisms,andN2Ofluxesarecon‑strainedbythelevelofcarbonsupply[51].ApplyingMNPKfertilizerprovidessufcfieint carbonsourcesformicroorganismsinvolvedinthenitrogencycle,whichincreasestheac‑tivityofsoilmicroorganisms,therebypromotingsoilN2O[52,53].Compostapplicationto soilproducesahighamountoforganiccarbon,whichleadstoN2Oemissions[54].Com‑paredtousingonlyNPKfertilizers,catltemanureincreasedN2Oemissionsby32.70%[55]. 4.3.CombinedApplicationofOrganicandInorganicFertilizersonAppleYield,GWP,andGHGI TheMNPKtreatmentproducedthemaximumyield,whereastheNPKandMtreat‑mentsdidnotsignifciantlydifefrinappleyield,asshowninTable 4.Thisisbecauseplants receivenutrientsfrombothtypesoffertilizers,whichincludevariousminerals;NPKfertil‑izersarerichinminerals,whilethenutrientsfromMfertilizerscanbeabsorbedandused directly[66]. Therefore,theappleyieldwassimilarregardlessofwhetheronlyMfertil‑izerwasappliedorNPKfertilizerwasappliedoverlongperiods.Wefoundnosignifciant difefrencebetweenthetreatmenttypes. However,long‑termapplicationofMandNPK fertilizers(i.e.,theMNPKtreatment)canboostsoilNretention,nitrogenuseefcfieincy,andcropyields[67].Accordingtopreviousstudiesinrelatedfeilds,theexperimentusing MNPKhadahigherefefctivenessintheincreaseofappleyieldcomparedtotheonethat onlyusesNPK,asMNPKincreasedtheamountofWFPS,SOC,andTNinsoil[16,17]. Additionally,usingMfertilizerscanreduceagriculturalwaste. Theaveragedirect EFdfromtheFDsitewashigherthanthatfromtheBSsite,andcomparedtoNPK,the MNPKtreatmentwashigher(Table 4). Intheappleorchardecosystem,numerousfac‑torsafefctN2Oemissions,includingstimulationbyfertilization,nitrogenevaporation,and runoffleaching(Figure 8). Afurthercrucialmethodofloweringagriculturalproductioncostswasthedeploy‑mentofMNPK.Thefindingsofnumerouspaststudieshaveindicatedthatusingorganic fertilizersmayboostproductionandimprovesoilquality,loweringchemicalfertilizer usage[16,21,68,69]. TheGWPofthecropproductionareaisbasedonthestandardscal‑culatedaccordingtotheGWPofCH4andN2O[70]. N2Oemissions,whicharereleased cumulatively,compriseasignifciantportionoftheaverageGWPriseofapproximately 70%comparedtothecontributionofCH430%[71]. Thestudyresultsparallelthoseof previousstudies,whichhaveindicatedthatCH4fluxesarenotsignifcianttotheincrease inGWP;rather,themainfactoristheamountofCinthesoilandN2Ofluxes.Inaddition,Zhangetal.andXuetal.[72,73]explainedhowyearlyincreasesinNfertilizersresultin abuildupofN2OemissionsandariseinGWP(Table 3).TheGWPoftheFDexperiment increasedmorethanthatoftheBSsite,andGWPofMNPKincreasedmorethanthatofM andCKby53.25%and84.06%,respectively. TheGHGIisacomprehensiveindicatorformeasuringthegreenhouseefefctandeco‑nomicbeneftisofagriculturalsoil[74].Inthisstudy,thecomparisonbetweentheFDand BSsitesshowedthattheGHGIinFDwashigherthanthatinBSsites;wealsofoundthat NPKtreatmentswerehigherthanMNPKby44.57%and34.12%,respectively.Thisresult occurredbecausetheincreasedappleyieldhadapositiveefefctonGHGI[75,76].Incom‑parisontoNPK,wediscoveredthatMNPKtreatmentconsiderablyenhancedapplepro‑ductionby61.73%(Table 4).However,theMNPKtreatmentalsoincreasedN2Oemissions andtheGWP.Nevertheless,MNPKcanincreasetheappleyieldandreducetheGHGIin appleorchards. Therefore,theMNPKapplicationofefrsthebestmethodtoreduceagri‑culturalgreenhousegasemissions,increaseproductivity,andachievebalancedeconomic andecologicalbeneftiswhilereducingchemicalfertilizers. 5.Conclusions ThisstudyprovidesevidencethatMNPKfertilizerafefctsontheincreaseofGHG emissionsandyieldintheappleorchardintheLoessPlateauregion. TheCH4uptake wassignifciantlynegativelycorrelatedwiththeWFPS.ComparedtotheBSsite,theFD sitehadmoresignifciantN2Oemissions(58.70%). OurstudyfoundthatattheFDand BSsites,comparedtotheothertreatments,theMNPKtreatmentresultedingreaterN2O−emissions.Inaddition,N2OfluxesstronglycorrelatedwithsoilNO3 ‑N,WFPS,pH,and temperature. TheaverageGWPoftheFDwashigherthanthatoftheBSsite(47.36%),andthecomparisonsbetweenthetreatmentsshowedthattheMNPKhadagreaterGWP thantheNPKandMtreatments(9.29%and30.97%,respectively).Asaresult,theGHGI intheMNPKtreatmentwaslowerthanthatintheNPKtreatment,withvaluesof30.83%and24.40%intheFDandBSsites,respectively. Therefore,ourstudyrecommendsthe MNPKtreatment,whichcombinesorganicandinorganicfertilizerstoincreaseappleyields andreducetheGHGI.Thisapproachdemonstrateshowagroforestrycanhelpsustainably intensifyappleorchardsintheLoessPlateauregionsofChina. AuthorContributions: Theconceptualization,T.S.,Z.L.andB.Z.;Methodology,T.S.,Z.L.and B.Z.;FormalAnalysis,T.S.;Investigation,T.S.andY.M.;Writing—originaldraftpreparation,T.S.;Writing—reviewandediting,T.S.,Z.Z.(ZhiyuanZhao),Z.Z.(ZhaoxiaZhen),W.Z.,Z.L.andB.Z.;Visualization,Z.L.andB.Z.;Supervision,Z.L.andB.Z.;Projectadministration,B.Z.;Fundingacqui‑sition,B.Z.andZ.L.Allauthorshavereadandagreedtothepublishedversionofthemanuscript. Funding:ThisstudywassupportedbyChinaAgricultureResearchSystemofMOFandMARA (CARS‑27),theEarmarkedFundfortheMajorProjectofScienceandTechnologyofShaanxi (2020zdzx03‑02‑01,2022ZDLNY02,NationalKeyR&DProgram(2021YFD9700),NationalNatural ScienceFoundationofChina(42007093,42177342),theChinaPostdoctoralScienceFoundation FundedProject(2020M638585). InstitutionalReviewBoardStatement:Notapplicable. InformedConsentStatement:Notapplicable. DataAvailabilityStatement: Alldatageneratedoranalyzedduringthisstudyareincludedin thismanuscript. ConfilctsofInterest:Theauthorsdeclarenoconfilctofinterest. References 1. IPCC.ClimateChange2014:MitigationofClimateChange.ContributionofWorkingGroupIIItotheFifthAssessmentReportofthe IntergovernmentalPanelonClimateChange;CambridgeUniversityPress:Cambridge,UK;NewYork,NY,USA,2014. 2. Liu,Z.;Deng,Z.;Davis,S.J.;Giron,C.;Ciais,P.Monitoringglobalcarbonemissionsin2021.Nat.Rev.EarthEnviron.2022,3,217–219.[CrossRef ][PubMed ] 3. IPCC.ClimateChange2022:MitigationofClimateChange.WorkingGroupIIIContributiontotheSixthAssessmentReportoftheInter‑governmentalPanelonClimateChange;CambridgeUniversityPress:Cambridge,UK;NewYork,NY,USA,2022. 4. Bazyli,C.;Lukasz,K.Impactofdifefrentmodelsofagricultureongreenhousegases(GHG)emissions:Asectoralapproach.OutlookAgric.2018,47,1–9. 5. Liang,D.;Lu,X.;Zhuang,M.;Shi,G.;Hu,C.;Wang,S.;Hao,J.China’sgreenhousegasemissionsforcroppingsystemsfrom 1978–2016.Sci.Data2021,8,171.[CrossRef ][PubMed ] 6. Zhao,Z.;Zheng,W.;Ma,Y.;Wang,X.;Li,Z.;Zhai,B.Responsesofsoilwater,nitrateandyieldofappleorchardtointegrated soilmanagementinLoessPlateau,China.Agric.WaterManag.2020,240,106325.[CrossRef ] 7. Liu,D.;Sun,H.;Liao,X.;Luo,J.;Lindsey,S.;Yuan,J.;He,T.;Zaman,M.;Ding,W.N2OandNOEmissionsasafefcted bythecontinuouscombinedapplicationoforganicandmineralNfertilizertosoilontheNorthChinaPlain.J.Agron.2020,10,1965.[CrossRef ] 8. Pilecco,G.E.;Chantigny,M.H.;Weiler,D.A.;Aita,C.;Thivierge,M.N.;Schmat,zR.;Chaves,B.;Giacomini,S.J.Greenhousegas emissionsandglobalwarmingpotentialfrombiofuelcroppingsystemsfertilizedwithmineralandorganicnitrogensources.Sci.TotalEnviron.2020,729,138767.[CrossRef ] 10. Xia,F.;Mei,K.;Xu,Y.;Zhang,C.;Dahlgren,R.A.;Zhang,M.ResponseofN2Oemissiontomanureapplicationinfeildtrialsof agriculturalsoilsacrosstheglobe.Sci.TotalEnviron.2020,733,139390.[CrossRef ] 11. Pang,J.;Wang,X.;Mu,Y.;Ouyang,Z.;Liu,W.NitrousoxideemissionsfromanappleorchardsoilinthesemiaridLoessPlateau ofChina.Biol.Fertil.Soils2009,46,37–44.[CrossRef ] 12. Zhang,C.;Chang,Q.;Shao,L.;Huo,X.TheModerateoperationscalesofapplesbasedonoutput,profti,andunitproduction costsintheShaanxiProvinceofChina.Land2020,9,25.[CrossRef ] 13. Cheng,L.;Raba,R.AccumulationofMacro‑andMicronutrientsandNitrogenDemand‑supplyRelationshipof‘Gala’/‘Malling 26’AppleTreesGrowninSandCulture.J.Am.Soc.Hortic.Sci.2009,1,3–13.[CrossRef ] 14. Palmer,J.W.;Dryden,G.FruitmineralremovalratesfromNewZealandapple(Malusdomestica)OrchardsintheNelsonRegion.N.Z.J.CropHortic.Sci.2006,1,27–32.[CrossRef ] 15. Chen,Y.;Wen,X.;Sun,Y.;Zhang,J.;Wu,W.;Liao,Y.Mulchingpracticesalteredsoilbacterialcommunitystructureandimproved orchardproductivityandapplequalityafterfivegrowingseasons.Sci.Hortic.2014,172,248–257.[CrossRef ] 16. Wei,Z.;Li,Y.;Gong,Q.;Zhang,H.;Zhao,Z.;Zheng,Z.;Zhai,B.;Wang,Z.Improvingyieldandwateruseefcfieincyofappletrees throughintercrop‑mulchofcrownvetch(CoronillavariaL.)combinedwithdifefrentfertilizertreatmentsintheLoessPlateau.Span.J.Agric.Res.2017,14,e1207. 17. Zhao,Z.P.;Yan,S.;Liu,F.;Ji,P.H.;Wang,X.Y.;Tong,Y.A.EfefctsofchemicalfertilizercombinedwithmanureonFujiapple quality,yieldandsoilfertilityinappleorchardontheLoessPlateauofChina.Int.J.Agric.Biol.2014,7,45–55. 18. UNEP(UnitedNationsEnvironmentProgramme). Agri‑FoodandtheEnvironment. Agri‑FoodLife‑Cycle2001;UNEP(United NationsEnvironmentProgramme):NewYork,NY,USA,2002. 19. Yang,Y.;Liu,H.;Lv,J.ResponseofN2Oemissionanddenitrifciationgenestodifefrentinorganicandorganicamendments.Sci.Rep.2022,12,3940.[CrossRef ] 20. Lin,S.;Zhang,S.;Shen,G.;Shaaban,M.;Ju,W.;Cui,Y.;Duan,C.;Fang,L.EfefctsofinorganicandorganicfertilizersonCO2andCH4fluxesfromteaplantationsoil.Anthropocene2021,9,90.[CrossRef ] 21. Bu,R.Y.;Li,M.;Han,S.;Cheng,W.L.;Wang,H.;Sun,Z.X.;Tang,S.;Wu,J.Comprehensiveefefctsofcombinedapplicationof organicandinorganicfertilizeronyield,greenhousegasemissions,andsoilnutrientindouble‑croppingricesystems.Chin.J.Appl.Ecol.2021,32,145–153. 22. Meng,L.;Cai,Z.;Ding,W.Efefctsoflong‑termfertilizationonNdistributionandN2Oemissioninfluvo‑aqucisoilinNorth China.ActaEcol.Sin.2008,28,6197–6203. 23. Jin,T.;Shimizu,M.;Marutani,S.;Desyatkin,A.R.;Iizuka,N.;Hata,H.;Hatano,R.Efefctofchemicalfertilizerandmanure applicationonN2OemissionfromreedcanarygrasslandinHokkaido,Japan.J.Soil.Sci.PlantNutr.2010,56,53–65.[CrossRef ] 24. Hou,M.M.;Lü,F.L.;Zhang,H.T.;Zhou,Y.T.;Lu,G.Y.;Ayaz,M.;Li,Q.H.;Yang,X.Y.;Zhang,S.L.Efefctoforganicmanuresub‑stitutionofsyntheticnitrogenoncropyieldandN2OEmissioninthewinterwheat‑summermaizerotationsystem.Environ.Sci.2018,39,321–330. 26. Gaihre,Y.K.;Padre,A.;Wassmann,R.;Aquino,E.;Pangga,G.V.;Cruz,P.S.spatialandtemporalvariationsinMethanefluxes fromirrigatedlowlandricefeilds.Philipp.Agric.Sci.2011,94,335–342. 27. Wang,K.;Li,F.;Dong,Y.Methaneemissionrelatedtoenzymeactivitiesandorganiccarbonfractionsinpaddysoilofsouth chinaunderdifefrentirrigationandnitrogenmanagement.J.PlantNutr.SoilSci.2020,20,1397–1410.[CrossRef ] 28. Guo,C.;Ren,T.;Li,P.;Wang,B.;Zou,J.;Hussain,S.;Cong,R.;Wu,L.;Lu,J.;Li,X.Producingmoregrainyieldofricewithless ammoniavolatilizationandgreenhousegasesemissionusingslow/controlled‑releaseurea.Environ.Sci.Pollut.Res.2019,26,2569–2579.[CrossRef ] 29. Aliyu, G.; Luo, J.F.; Di, H.J.; Liu, D.Y.; Yuan, J.J.; Chen, Z.M.; He, T.H.; Ding, W.X.Yield‑scalednitrousoxide emissionsfromnitrogen‑fertilizedcroplandsinChina:Ameta‑analysisofcontrastingmitigationscenarios.Pedosphere2021,31,231–242.[CrossRef ] 30. Li,W.J.EfefctsofCoverCroponWater,CarbonandNitrogenDistributioninDeepSoilofAppleOrchardinLoessPlateau.Master’sThesis,LanzhouUniversity,Lanzhou,China,May2022. 31. Nelson,D.W.;Sommers,L.E.Totalcarbon,organiccarbon,andorganicmatetr.PartII.ChemicalandMicrobiologicalProperties.InMethodsofSoilAnalysis,2nded.;Page,A.L.,Miller,R.H.,Keeney,D.R.,Eds.;AmericanSocietyofAgronomy:Madison,WI,USA,1982;pp.539–579. 32. Carter,M.R.;Gregorich,E.G.SoilSamplingandMethodsofAnalysis,2nded.;CRCPress:BocaRaton,FL,USA,2008. 33. Abubakar,S.A.;Hamani,A.K.M.;Chen,J.;Sun,W.;Wang,G.;Gao,Y.;Duan,A.OptimizingN‑fertigationscheduling maintainsyieldandmitigatesglobalwarmingpotentialofwinterwheatfeildinNorthChinaPlain.J.Clean.Prod.2022,357,131906.[CrossRef ] 34. Li,N.;Kumar,P.;Lai,L.;Abagandura,G.O.;Kumar,S.;Nleya,T.;Sieverding,H.L.;Stone,J.J.;Gibbons,W.Responseofsoilgreen‑housegasfluxesandsoilpropertiestonitrogenfertilizerratesundercamelinaandcarinatanonfoodoilseedcrops.BioenergyRes.2019,12,524–535.[CrossRef ] 35. Fan,Y.;Hao,X.;Carswell,A.;Misselbrook,T.;Ding,R.;Li,S.;Kang,S.Z.InorganicnitrogenfertilizerandhighNapplicationrate promoteN2OemissionandsuppressCH4uptakeinarotationalvegetablesystem.SoilTillageRes.2021,206,104848.[CrossRef ] 36. Diacono,M.;Montemurro,F.Long‑termefefctsoforganicamendmentsonsoilfertility.Areview.Agron.Sustain.Dev.2010,30,401–422.[CrossRef ] 37. Li,H.;Feng,W.T.;He,X.H.;Zhu,P.;Gao,H.J.;Sun,N.;Xu,M.G.Chemicalfertilizerscouldbecompletelyreplacedbymanureto maintainhighmaizeyieldandsoilorganiccarbon(SOC)whenSOCreachesathresholdintheNortheastChinaPlain.J.Integr.Agric.2017,16,937–946.[CrossRef ] 38. Yang,W.;Feng,G.;Miles,D.;Gao,L.;Jia,Y.;Li,C.;Qu,Z.Impactofbiocharongreenhousegasemissionsandsoilcarbon sequestrationincorngrownunderdripirrigationwithmulching.Sci.TotalEnviron.2020,729,138752.[CrossRef ] 39. Meng,C.;Wang,F.;Yang,K.;Clinton,C.S.;Bernard,A.E.;Zhang,Y.;Tao,L.;Gu,X.Smallwetetdproportionofdripirrigation 41. Lu,Y.;Wassmann,R.;Neue,H.U.;Huang,C.Dissolvedorganiccarbonandmethaneemissionsfromaricepaddyfertilizedwith ammoniumandnitrate.J.Environ.Qual.2000,29,1733–1740.[CrossRef ] 44. Sakabe,A.;Kosugi,Y.;Takahashi,k.;Itoh,M.;Kanazawa,A.;Makita,N.;Ataka,M.Oneyearofcontinuousmeasurementsof soilCH4andCO2fluxesinaJapanesecypressforest:TemporalandspatialvariationsassociatedwithAsianmonsoonrainfall.J.Geophys.Res.Biogeosci.2015,120,585–599.[CrossRef ] 45. Wrage,N.;Horn,M.A.;Well,R.;Müller,C.;Velthof,G.;Oenema,O.Theroleofnitrifeirdenitrifciationintheproductionof nitrousoxiderevisited.SoilBiol.Biochem.2018,123,3–16.[CrossRef ] 46. He,T.;Yuan,J.;Luo,J.;Wang,W.;Fan,J.;Liu,D.;Ding,W.OrganicfertilizershavedivergentefefctsonsoilN2Oemissions.Biol.Fertil.Soils2019,55,685–699.[CrossRef ] 47. Qin,H.L.;Xing,X.;Tang,Y.;Zhu,B.L.;Wei,X.M.;Chen,X.B.;Liu,Y.Soilmoistureandactivityofnitrite‑andnitrousoxidere‑ducingmicrobesenhancednitrousoxideemissionsinfallowpaddysoils.Biol.Fert.Soil.2020,56,53–67.[CrossRef ] 48. Lazcano,C.;Barker,X.Z.;Decock,C.EfefctsoforganicfertilizersonthesoilmicroorganismsresponsibleforN2OEmissions:AReview.Microorganisms2021,9,983.[CrossRef ][PubMed ] 49. Duan,Y.;Mehariya,S.;Kumar,A.;Singh,E.;Yang,J.;Kumar,S.;Li,H.;Awasthi,M.K.Appleorchardwasterecyclingand valorizationofvaluableproduct‑Areview.Bioengineered2021,12,476–495.[CrossRef ][PubMed ] 51. Zhang,Y.;Liu,J.;Mu,Y.;Xu,Z.;Pei,S.;Lun,X.;Zhang,Y.Nitrousoxideemissionsfromamaizefeildduringtwoconsecutive growingseasonsintheNorthChinaPlain.Res.J.Environ.Sci.2012,24,160–168.[CrossRef ] 52. Jassal,R.S.;Black,T.A.;Roy,R.;Ethier,G.EfefctofnitrogenfertilizationonsoilCH4andN2Ofluxes,andsoilandBolerespiration.Geoderma2011,162,182–186.[CrossRef ] 53. Montes,F.;Meinen,R.;Dell,C.;Rot,zA.;Hristov,A.N.;Oh,J.;Waghorn,G.;Gerber,P.J.;Henderson,B.;Makkar,H.P.S.;etal. Mitigationofmethaneandnitrousoxideemissionsfromanimaloperations:II.Areviewofmanuremanagementmitigation options.J.Anim.Sci.2013,91,5070–5094.[CrossRef ] 54. Senbayram,M.;Chen,R.;Budai,A.;Bakken,L.;Ditetrt,K.N2OemissionandtheN2O/(N2O+N2)productratioofdenitrifciation ascontrolledbyavailablecarbonsubstratesandnitrateconcentrations.Agric.Ecosyst.Environ.2012,147,4–12.[CrossRef ] 55. Zhou,M.;Zhu,B.;Wang,S.;Zhu,X.;Vereecken,H.;Brüggemann,N.StimulationofN2Oemissionbymanureapplicationto agriculturalsoilsmaylargelyofsfetcarbonbeneftis:Aglobalmeta‑analysis.Glob.Chang.Biol.2017,23,4068–4083.[CrossRef ]56. Meng,L.;Ding,W.;Cai,Z.Long‑termapplicationoforganicmanureandnitrogenfertilizeronN2Oemissions,soilqualityand cropproductioninasandyloamsoil.SoilBiol.Biochem.2005,37,2037–2045.[CrossRef ] 58. Gu,J.;Nie,H.;Guo,H.;Xu,H.;Gunnathorn,T.Nitrousoxideemissionsfromfruitorchards:Areview.Atmos.Environ.2019,201,166–172.[CrossRef ] 59. Tao,R.;Wakelin,S.A.;Liang,Y.;Hu,B.;Chu,G.Nitrousoxideemissionanddenitrifeircommunitiesindrip‑irrigatedcalcareous soilasafefctedbychemicalandorganicfertilizers.Sci.TotalEnviron.2018,612,739–749.[CrossRef ] 60. Fan,D.;Cao,C.;Li,C.Integratedorganic‑inorganicnitrogenfertilizationmitigatesnitrousoxideemissionsbyregulating ammonia‑oxidizingbacteriainpurplecaitaifeilds.Agriculture2022,12,723.[CrossRef ] 61. Liang,Z.;Jin,X.;Zhai,P.;Zhao,Y.;Cai,J.;Li,S.;Yang,S.;Li,C.;Li,C.J.Combinationoforganicfertilizerandslow‑release fertilizerincreasespineappleyields,agronomicefcfieincyandreducesgreenhousegasemissionsunderreducedfertilization conditionsintropicalareas.J.Clean.Prod.2022,343,131054.[CrossRef ] 62. Hou,M.;Ohkama‑Ohtsu,N.;Suzuki,S.;Tanaka,H.;Schmidhalter,U.;Bellingrath‑Kimura,S.D.Nitrousoxideemissionfrom teasoilunderdifefrentfertilizermanagementsinJapan.Catena2015,135,304–312.[CrossRef ] 63. Ding,W.;Luo,J.;Li,J.;Yu,H.;Fan,J.;Liu,D.Efefctoflong‑termcompostandinorganicfertilizerapplicationonbackground N2Oandfertilizer‑inducedN2Oemissionsfromanintensivelycultivatedsoil.Sci.TotalEnviron.2013,465,115–124.[CrossRef ] 64. Chen,Z.;Ding,W.;Luo,Y.;Yu,H.;Xu,Y.;Müller,C.;Xu,X.;Zhu,T.Nitrousoxideemissionsfromcultivatedblacksoil:Acase studyinNortheastChinaandglobalestimatesusingempiricalmodel.Glob.Biogeochem.Cycles.2014,28,1311–1326.[CrossRef ] 65. Deng,M.;Hou,M.;Ohkama‑Ohtsu,N.;Yokoyama,T.;Tanaka,H.;Nakajima,K.;Omata,R.;Bellingrath‑Kimura,S.D.Nitrous oxideemissionfromorganicfertilizerandcontrolledreleasefertilizerinTeafeilds.Agriculture2017,7,29.[CrossRef ] 66. Zhang,A.;Liu,A.;Pan,Y.;Hussain,G.;Li,Q.;Zheng,L.;Zhang,X.Efefctofbiocharamendmentonmaizeyieldandgreen‑housegasemissionsfromasoilorganiccarbonpoorcalcareousloamysoilfromcentralChinaPlain. PlantSoil. 2012,351,263–275.[CrossRef ] 68. Cen,Y.;Guo,L.;Liu,M.;Gu,X.;Li,C.;Jiang,G.Usingorganicfertilizerstoincreasecropyield,economicgrowth,andsoil qualityinatemperatefarmland.PeerJ2020,8,e9668.[CrossRef ][PubMed ] 69. Liu,J.;Shu,A.;Song,W.;Shi,W.;Li,M.;Zhang,W.;Li,Z.;Liu,G.;Yuan,F.;Zhang,S.;etal.Long‑termorganicfertilizer substitutionincreasesriceyieldbyimprovingsoilpropertiesandregulatingsoilbacteria.Geoderma2021,404,115287.[CrossRef ] 70. Ma,D.;Chen,L.;Qu,H.;Wang,Y.;Missel,T.;Jiang,R.Impactsofplasticflimmulchingoncropyields,soilwater,nitrate,and organiccarboninNorthwesternChina:Ameta‑analysis.Agric.WaterManag.2018,202,166–173.[CrossRef ][PubMed ] 71. Lee,J.G.;Cho,S.R.;Jeong,S.T.;Hwang,H.Y.;Kima,P.J.Difefrentresponseofplasticflimmulchingongreenhousegasintensity (GHGI)betweenchemicalandorganicfertilizationinmaizeuplandsoil.Sci.TotalEnviron.2019,696,133827.[CrossRef ] 72. Zhang,M.;Li,B.;Xiong,Z.Q.Efefctsoforganicfertilizeronnetglobalwarmingpotentialunderanintensivelymanagedveg‑etablefeildinsoutheasternChina:Athreeyearfeildstudy.Atmos.Environ.2016,145,92–103.[CrossRef ] 73. Xu,P.;Han,Z.;Wu,J.;Li,Z.;Wang,J.;Zou,J.Emissionsofgreenhousegasesandnofromricefeildsandapeachorchardas afefctedbyNinputandland‑useconversion.Agronomy2022,12,1850.[CrossRef ] 74. Zhuang,M.;Zhang,J.;Lam,S.K.;Li,H.;Wang,L.Managementpracticestoimproveeconomicbeneftianddecreasegreenhouse gasintensityinagreenonion‑winterwheatrelayintercroppingsystemintheNorthChinaPlain. J.Clean. Prod. 2019,208,709–715.[CrossRef ] 75. Ameloot,N.;Maenhout,P.;De,N.S.;Sleutel,S.Biochar‑inducedN2Oemissionreductionsafterfeildincorporationinaloam soil.Geoderma2016,267,10–16.[CrossRef ] 76. Kuppusamy,S.;Thavamani,P.;Megharaj,M.;Venkateswarlu,K.;Naidu,R.Agronomicandremedialbeneftisandrisksof applyingbiochartosoil:Currentknowledgeandfutureresearchdirections.Environ.Int.2016,87,1–12.[CrossRef ] Disclaimer/Publisher’sNote:Thestatements,opinionsanddatacontainedinallpublicationsaresolelythoseoftheindividualau‑thor(s)andcontributor(s)andnotofMDPIand/ortheeditor(s).MDPIand/ortheeditor(s)disclaimresponsibilityforanyinjuryto peopleorpropertyresultingfromanyideas,methods,instructionsorproductsreferredtointhecontent.
确定

还剩21页未读,是否继续阅读?

产品配置单


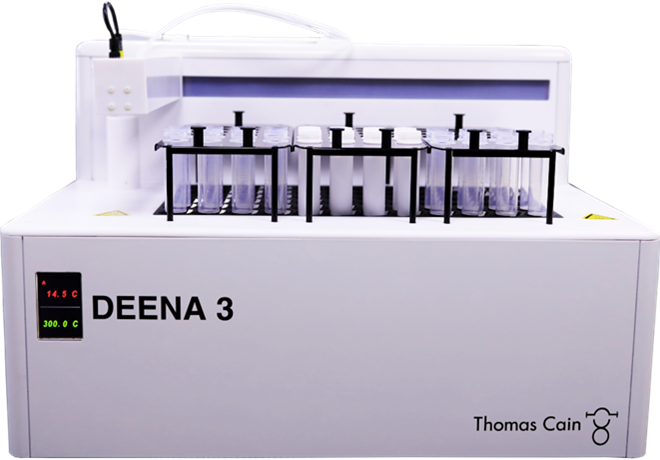
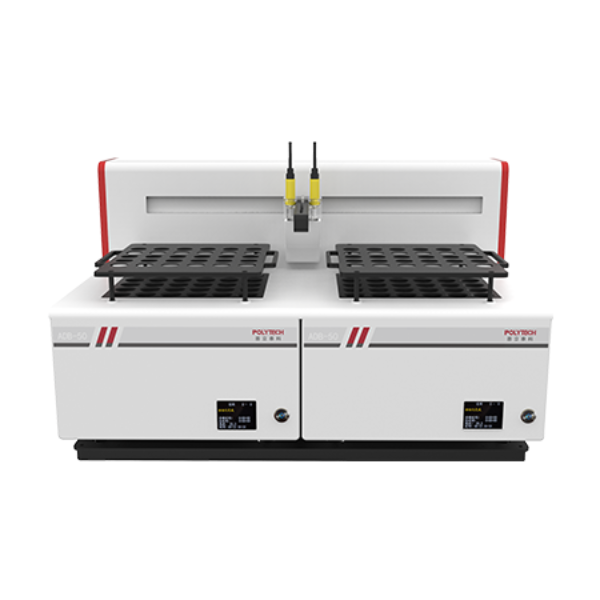
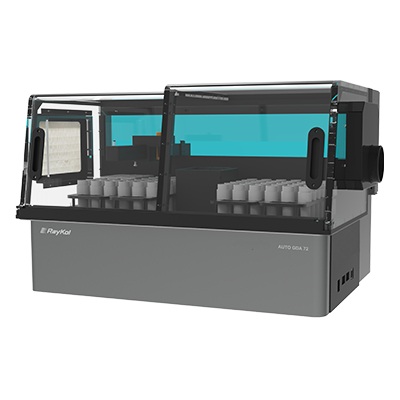
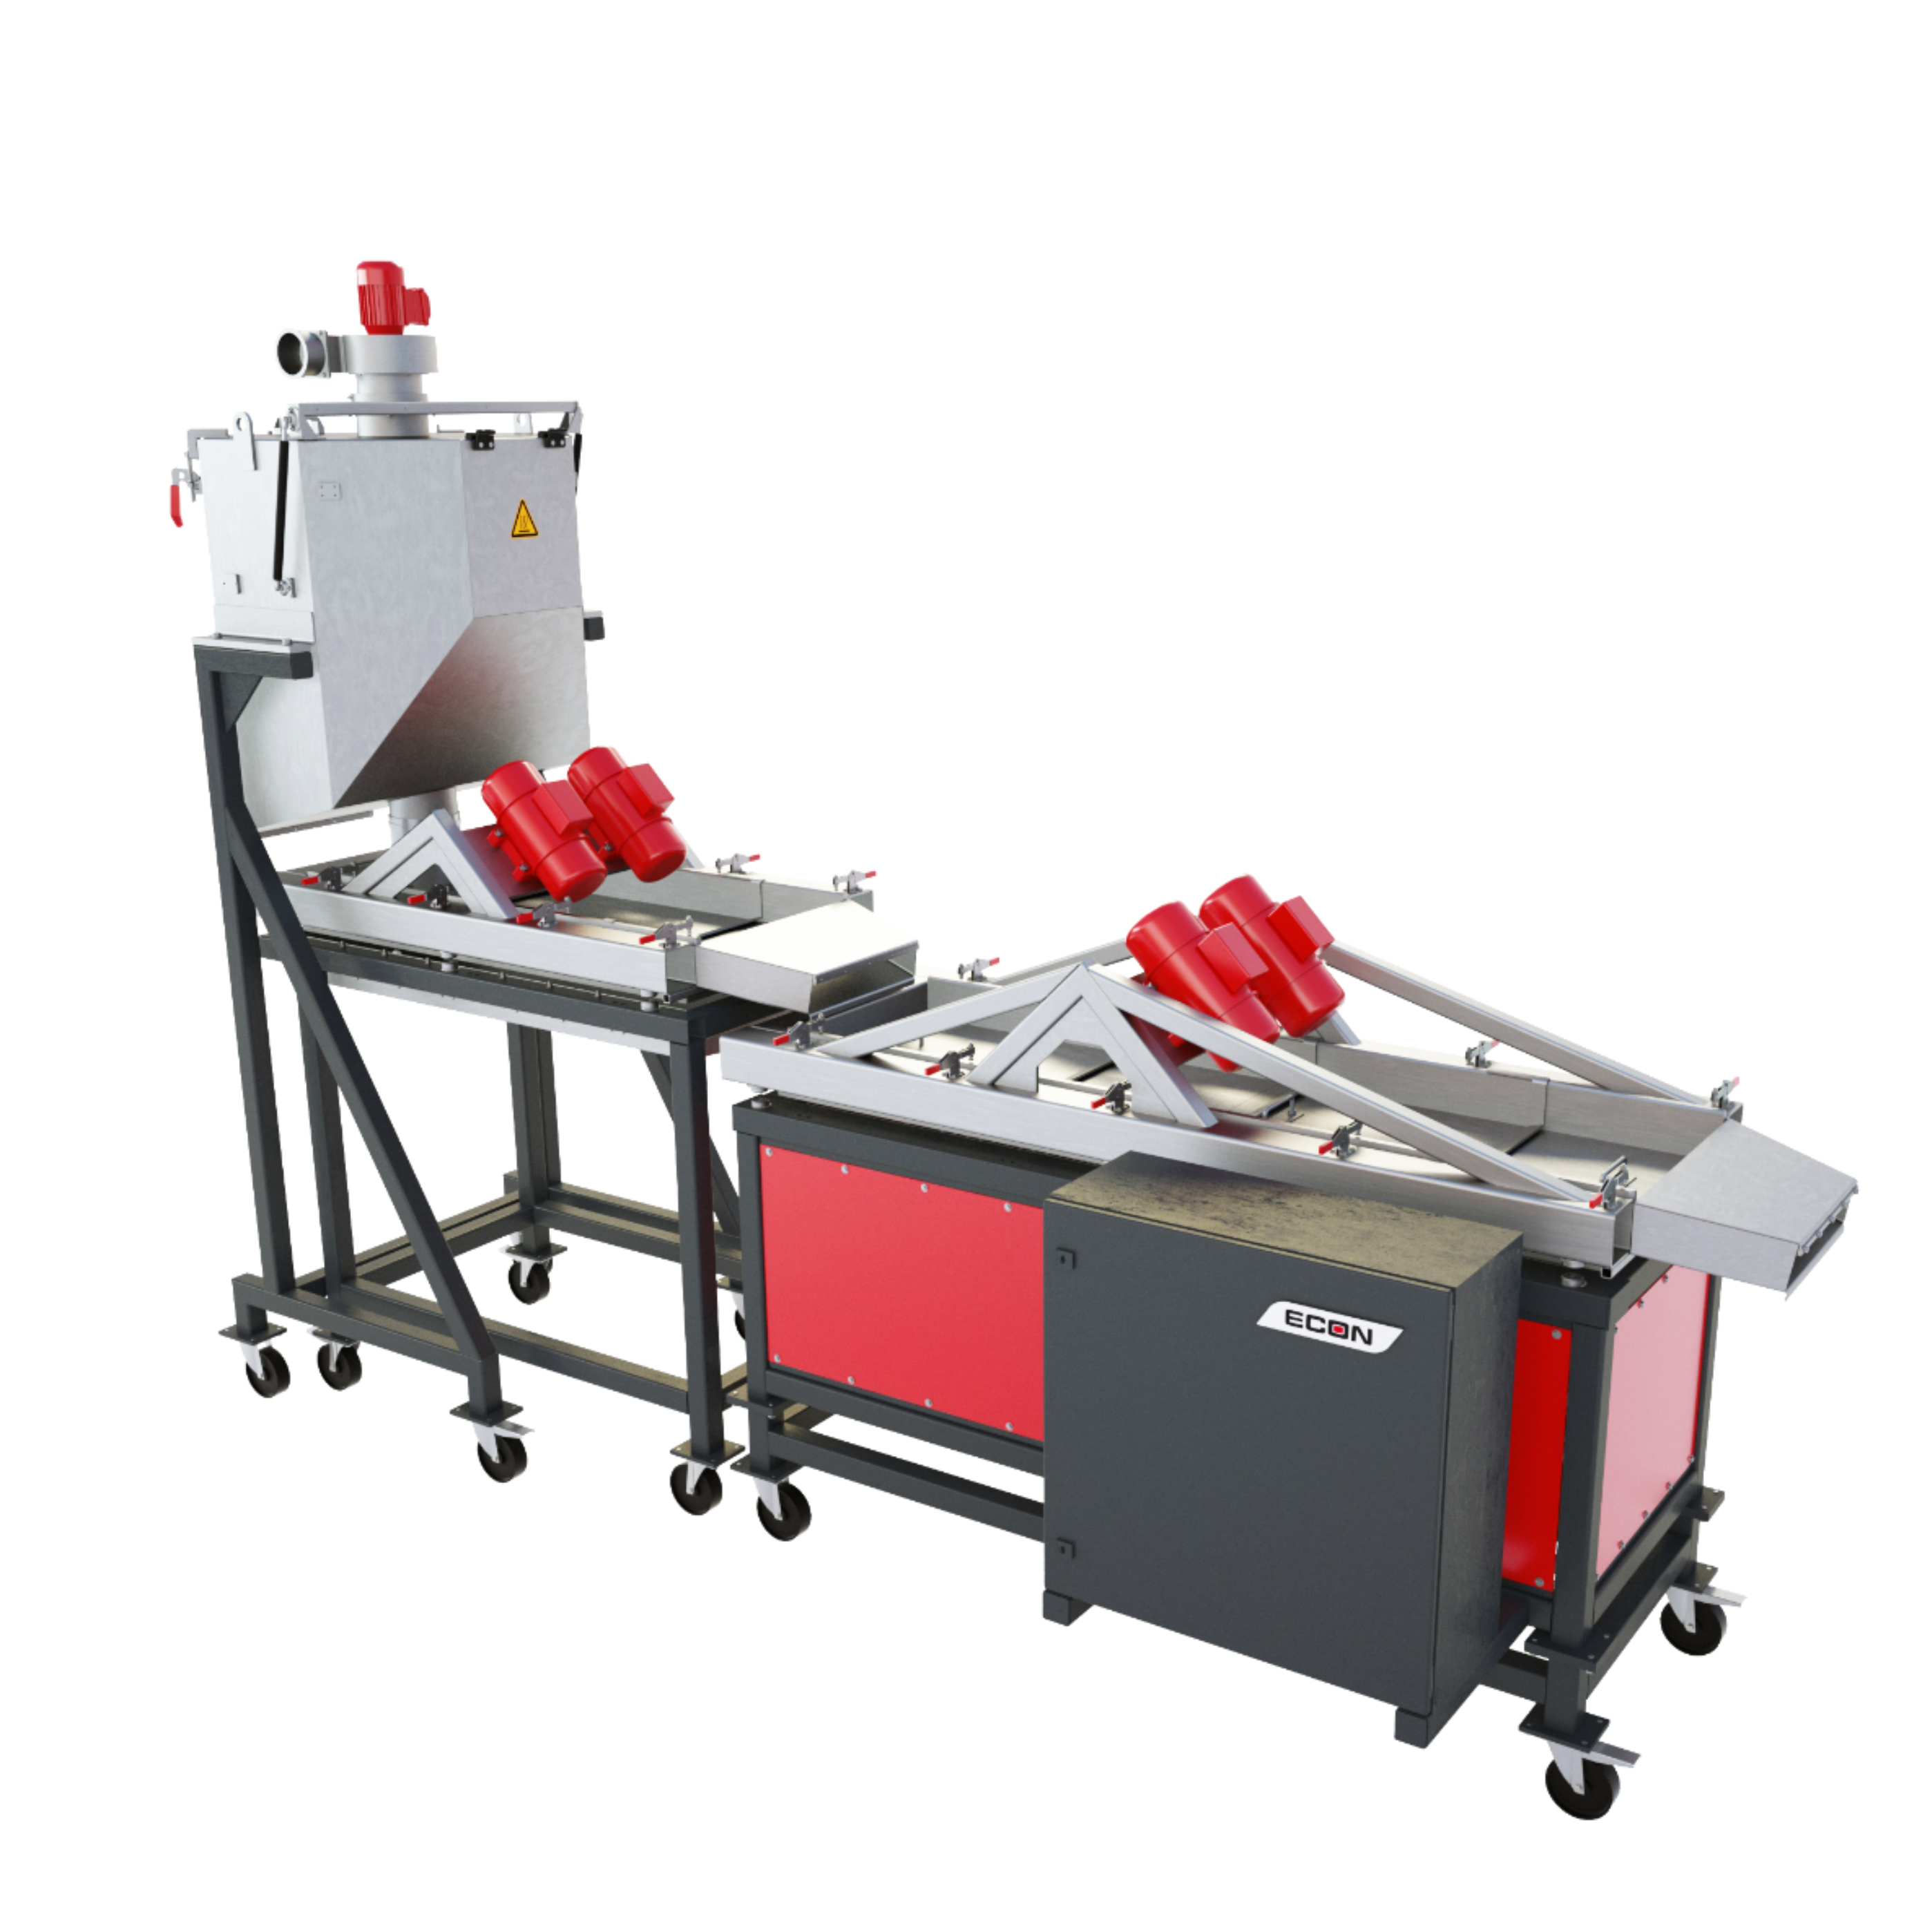
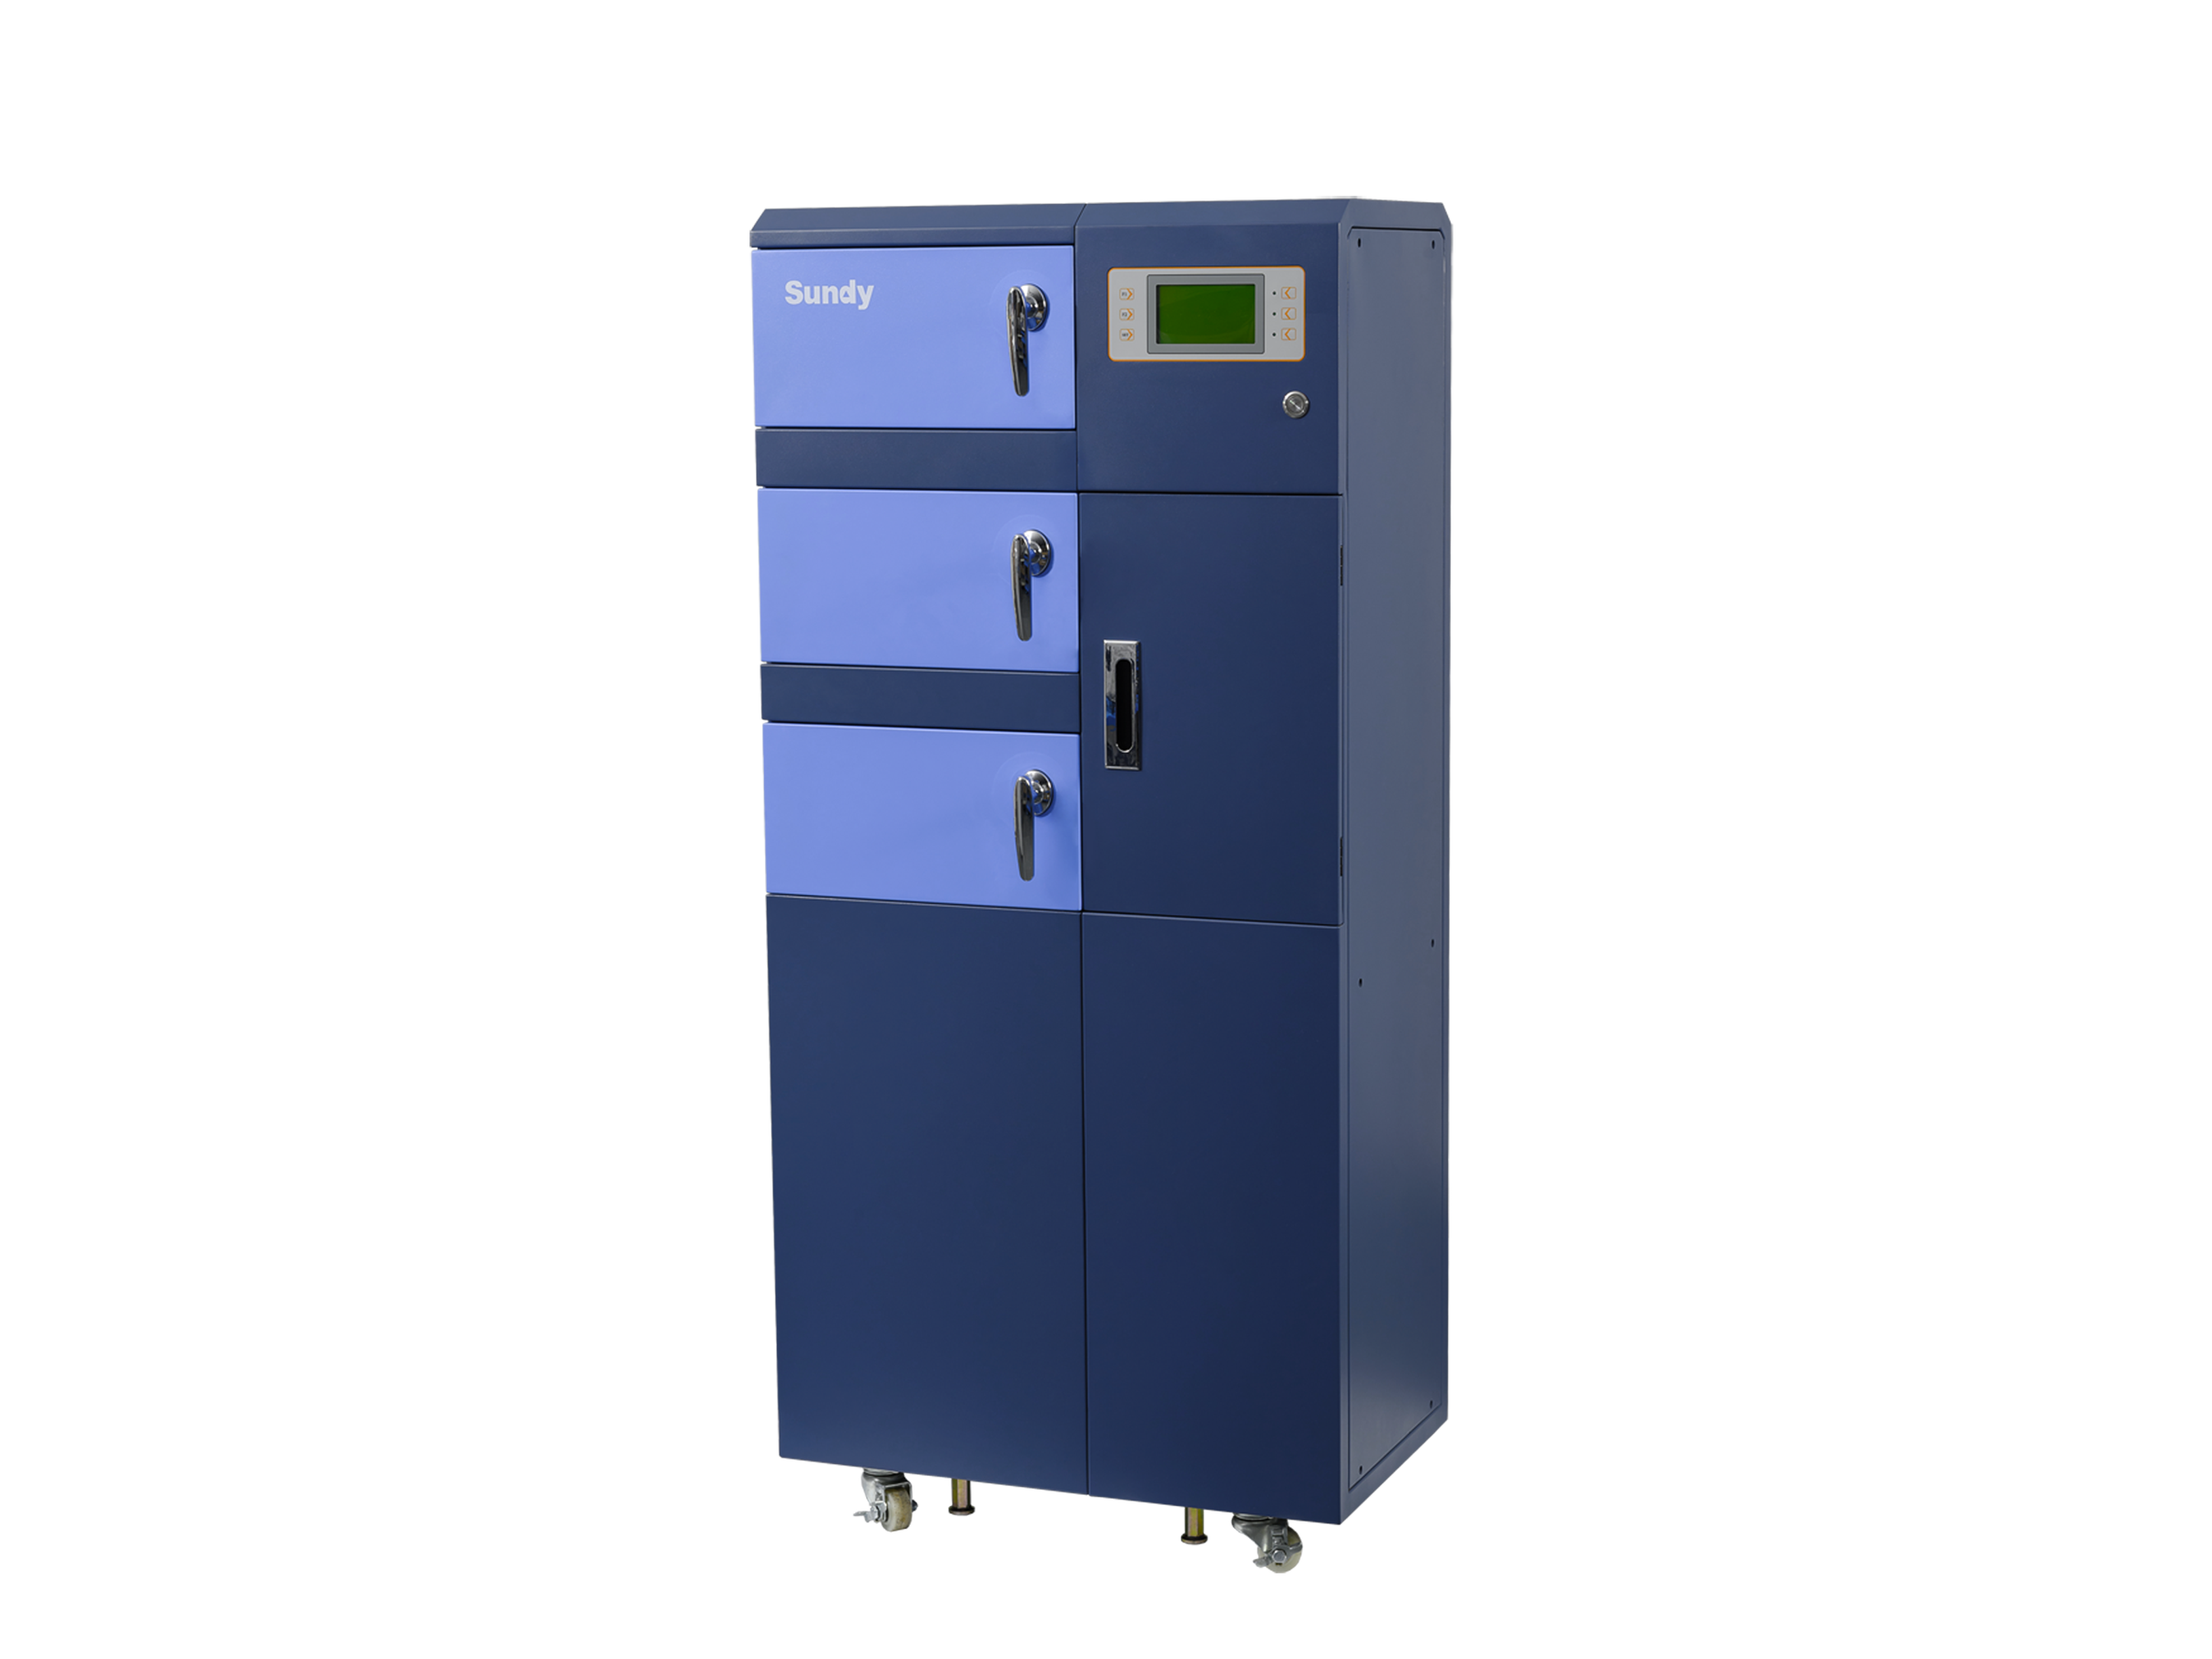
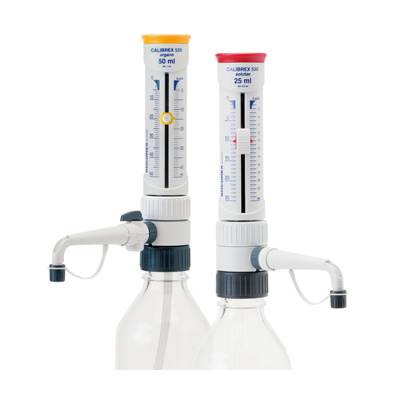
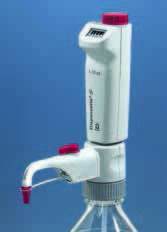
中国格哈特为您提供《苹果园施肥沟土和裸土中总氮、总磷、总钾的检测》,该方案主要用于其他中营养成分检测,参考标准--,《苹果园施肥沟土和裸土中总氮、总磷、总钾的检测》用到的仪器有格哈特自动升降40位消解仪KT-L 40s、格哈特快速干燥仪STL56、德国加液器MM、凯氏定氮催化剂5.0g K2SO4+0.5g CuSO4 x 5H2O
推荐专场


相关方案
更多
该厂商其他方案
更多