


方案详情
文
利用红外光谱,通过在光路中放置偏振器测量样品的偏振特性来评估取向。已经开发了一种偏振ATR配件,可以基于ATR效应测量样品偏振,并可以分析1-2µm范围内样品表面的分子取向。该技术允许分析样品表面的分子取向,而不考虑样品厚度或材料。
方案详情

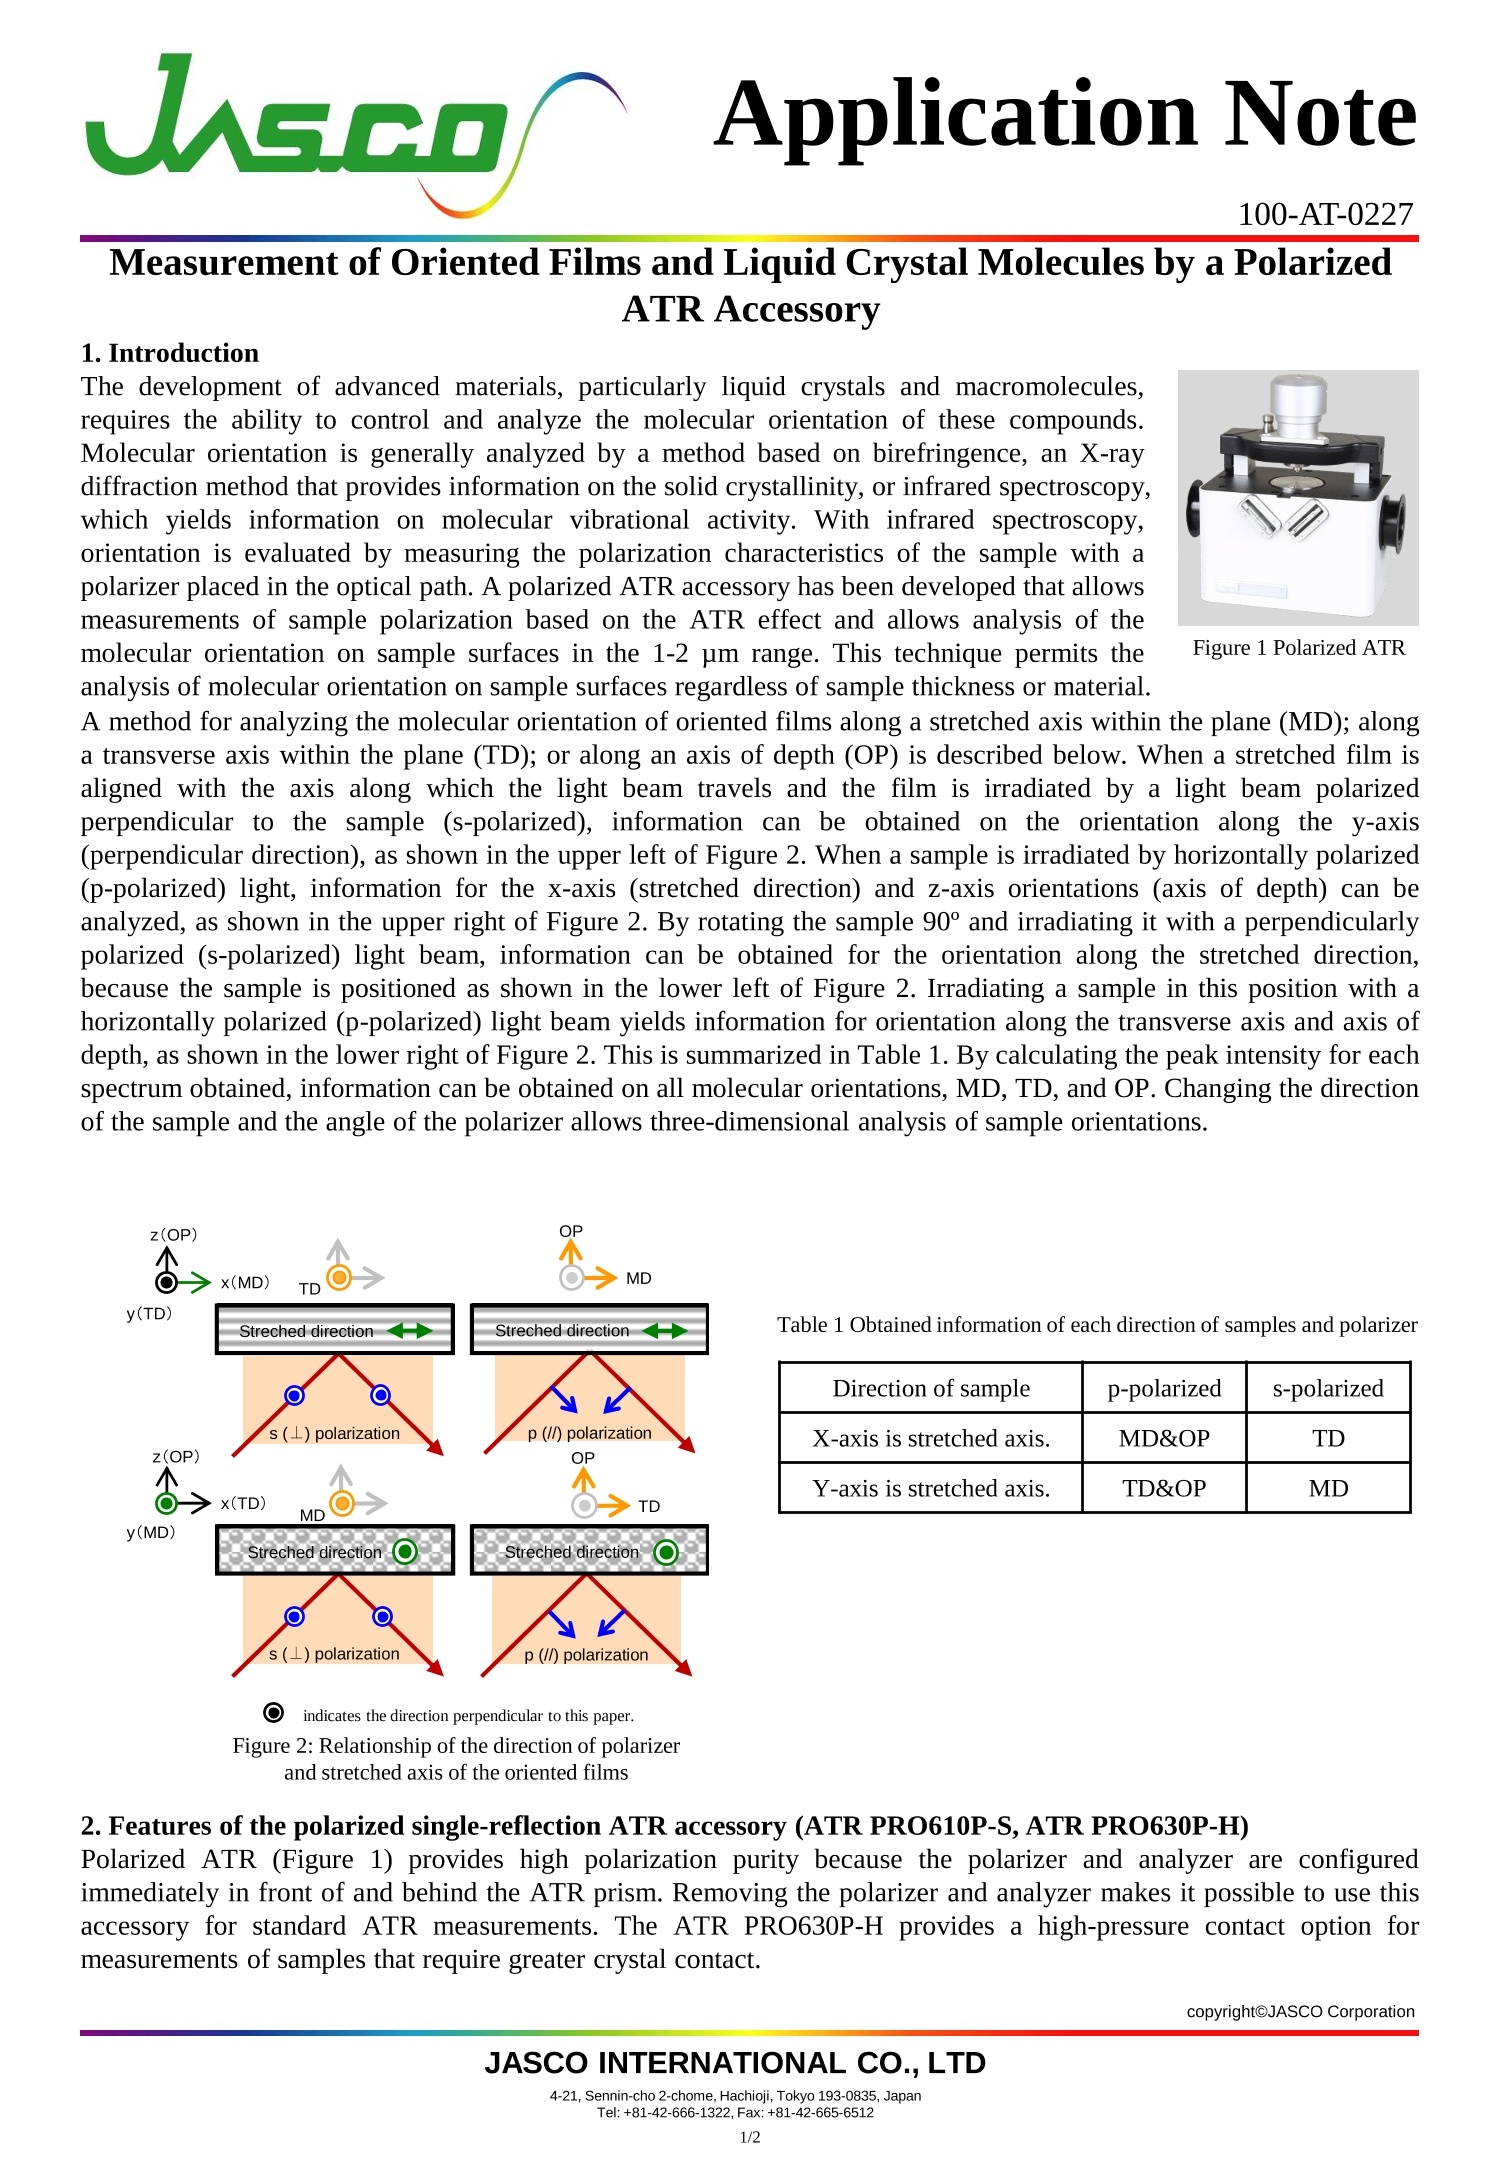
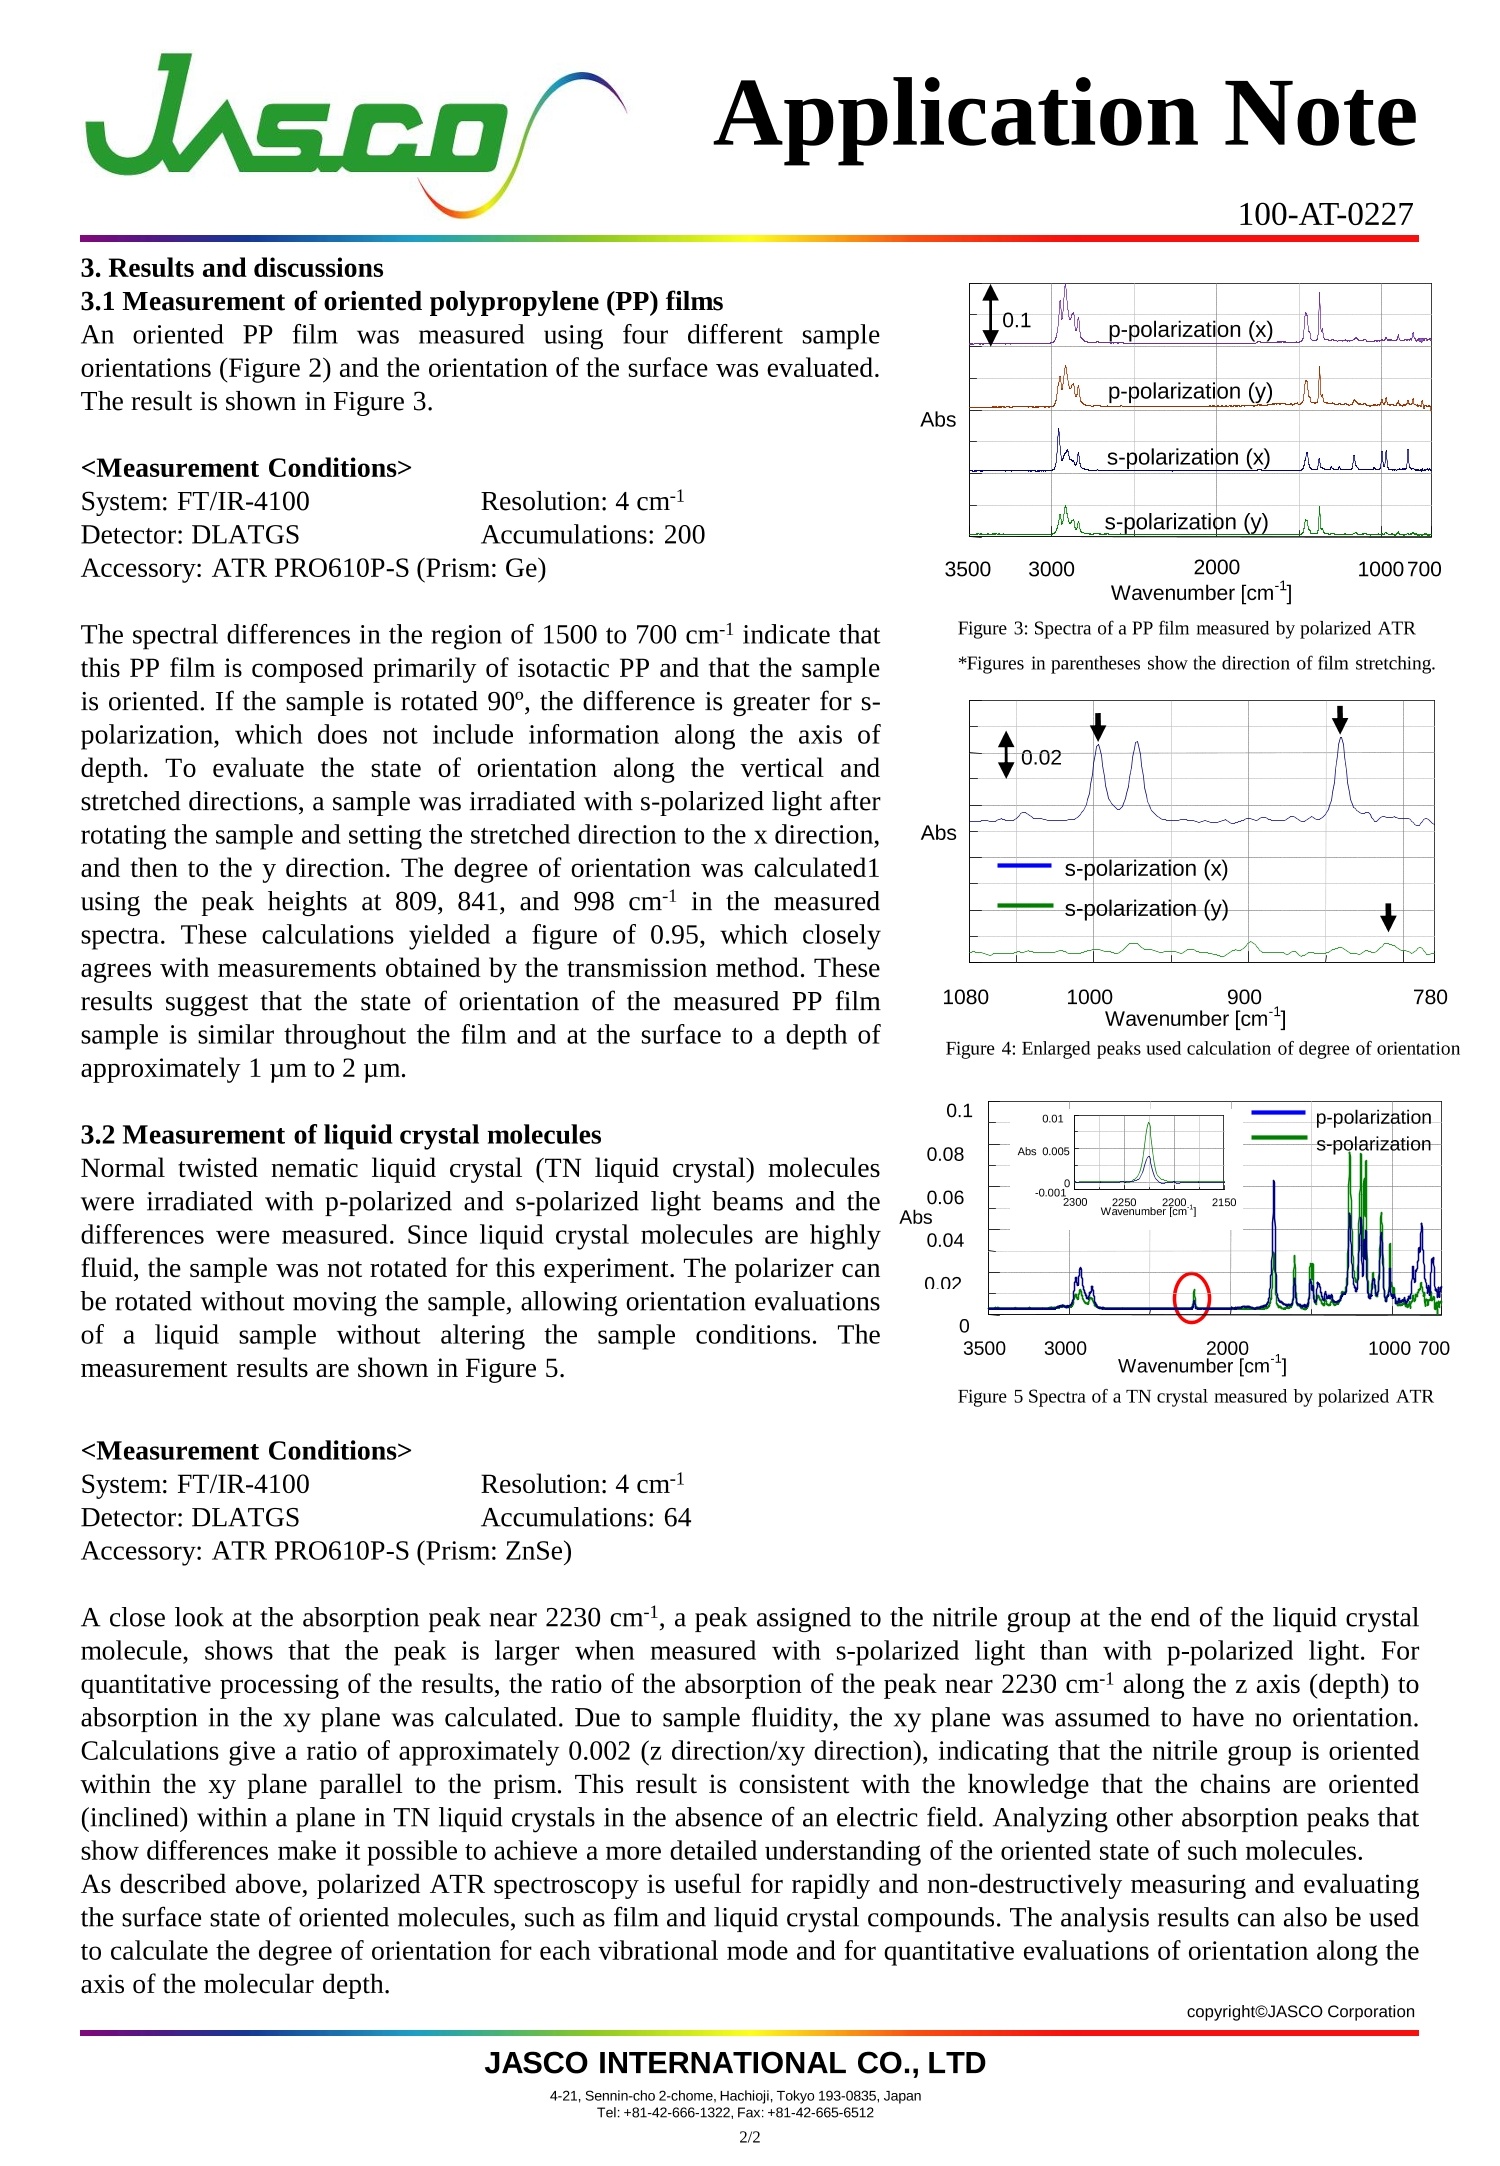
1:利用红外光谱,通过在光路中放置偏振器测量样品的偏振特性来评估取向。已经开发了一种偏振ATR配件,可以基于ATR效应测量样品偏振,并可以分析1-2µm范围内样品表面的分子取向。该技术允许分析样品表面的分子取向,而不考虑样品厚度或材料。例如:2.偏振单反射ATR附件(ATR PRO610P-S,ATR PRO630P-H)的特点: 偏振ATR(图1)提供了高偏振纯度,因为偏振器和分析仪立即配置在ATR棱镜的前面和后面。拆卸偏振器和分析仪,可以使用此附件进行标准ATR测量。ATR PRO630P-H为需要更大的晶体接触的样品的测量提供了一个高压接触选项。3:3.1定向聚丙烯(PP)薄膜的测量 3.2液晶分子的测量Application Note JS.CO 100-AT-0227 Measurement of Oriented Films and Liquid Crystal Molecules by a Polarized ATR Accessory 1.Introduction The development of advanced materials, particularly liquid crystals and macromolecules,requires the abi l ity to control and analyze the molecular orientation of these compounds.Molecular orientation is generally analyzed by a method based on birefringence, an X-ray diffraction method that provides information on the solid crystallinity, or infrared spectroscopy,which yields information on molecular vibrational activity. With infrared spectroscopy,orientation is evaluated by measuring the polarization characteristics of the sample with a polarizer placed i n the optical path. A polarized ATR accessory has been developed that allows measurements of sample polarization based on the ATR effect and allows analysis of the molecular orientation on sample surfaces in the 1-2 um range. This technique permits the analysis of molecular orientation on sample surfaces regardless of sample thickness or material. Figure 1 Polarized ATR A method for analyzing t he molecular orientation of oriented f ilms along a stretched axis within the plane (MD); along a transverse axis within the plane (TD); or along an axis of depth (OP) is described below. When a stretched film is aligned with the axis along which the light beam travels and the film is irradiated by a light beam polarized perpendicular to the sample (s-polarized), information can be obtained on the orientation along the y-axis (perpendicular direction), as shown i n the upper left of Figure 2. When a sample is i rradiated by horizontally polarized (p-polarized) light, information for the x-axis (stretched direction) and z-axis orientations (axis of depth) can be analyzed, as shown in the upper right of Figure 2. By rotating t he sample 90° and irradiating it with a perpendicularly polarized (s-polarized) light beam, information can be obtained for the orientation along the stretched direction,because t he sample is positioned as shown in the lower left of Figure 2. Irradiating a sample in this position with a horizontally polarized (p-polarized) light beam yields information for orientation along the transverse axis and axis of depth, as shown i n the lower right of Figure 2. This is summarized in Table 1. By calculating the peak intensity for each spectrum obtained, information can be obtained on all molecular orientations, MD, TD, and OP. Changing the direction o f the sample and the angle of the polarizer allows three-dimensional analysis of sample orientations. Table 1 Obtained i nformation of each direction of samples and polarizer Direction of sample p-polarized s-polarized X-axis is stretched axis. MD&OP TD Y-axis is stretched axis. TD&OP MD ◎i ndicates the direction perpendic u lar to this paper. Figure 2: Relat i onship of the direction of pola ri zer and stretched axis of the oriented films 2. Features of the polarized single-reflection ATR accessory (ATR PRO610P-S, ATR PRO630P-H) Polarized ATR (Figure 1) provides high polarization purity because the polarizer and analyzer are configured immediately in front of and behind t he ATR prism. Removing the polarizer and analyzer makes i t possible to use this accessory for standard ATR measurements. The ATR PRO630P-H provides a high-pressure contact option for measurements of samples t hat require greater crystal contact. T el :+81-42-666-1322.Fax:+81-42-665-6512 JS.GO Application Note 3. Results and discussions 3.1 Measurement of oriented polypropylene (PP) films An oriented PP film was measured using four different sample orientations (Figure 2) and the orientation of the surface was evaluated.The result is shown in Figure 3. System: FT/IR-4100 Resolution: 4 cml Detector: DLATGS Accumulations: 200Accessory: ATR PRO610P-S (Prism: Ge) The spectral differences in the region of 1500 to 700 cm indicate that this PP fi l m is composed primarily of isotactic PP and that the sample is or i ented. If the sample is rotated 90°, the difference is greater for s-polarization, which does not include information along the axis of depth. To evaluate the state of orientation along the vertical and stretched directions, a sample was i rradiated with s-polarized l ight after rotating t he sample and sett i ng the stretched direction to the x direction,and then to the y direction. The degree of orientation was calculated1using the peak heights at 809, 841, and 998 cm in the measured spectra. These calculations yielded a figure of 0.95, which closely agrees with measurements obtained by the t ransmission method. These results suggest that the state of orientation of the measured PP film sample is similar throughout the film and at the surface to a depth of approximately 1 um to 2 um. 3.2 Measurement of liquid crystal molecules Normal twisted nematic liquid crystal (TN liquid crystal) molecules were irradiated with p-polarized and s-polarized light beams and the differences were measured. Since liquid crystal molecules are highly fluid, the sample was not rotated for this experiment. The polarizer can be rotated without moving the sample, allowing orientation evaluations of fa liquid sample without altering the sample conditions. The measurement results are shown in Figure 5. System: FT/IR-4100 Resolution: 4cm-l Detector: DLATGS Accumulations: 64 Figure 3: Spectra of a PP f il m measured by polarized ATR *Figures i n parentheses show the direction of f ilm stretching. Figure 4: Enlarged peaks used calculation of degree of orientation Figure 5 Spectra of a TN crystal measured by polarized ATR A close look at the absorption peak near 2230 cm, a peak assigned to t he nitrile group at the end of the l iquid crystal molecule, shows that the peak is larger when measured with s-polarized light than with p-polarized light. For quantitative processing of the results, the ratio of the absorption of t he peak near 2230 cm along the z axis (depth) to absorption in t he xy plane was calculated. Due to sample fluidity, t he xy plane was assumed to have no orientation.Calculations give a ratio of approximately 0.002 (z direction/xy direction), i ndicating that the nitrile group i s oriented wi t hin the xy plane parallel to the prism. This result is consistent with the knowledge that the chains are oriented (inclined) within a plane in TN liquid crystals in the absence of an electric f ield. Analyzing other absorption peaks that show differences make it possible to achieve a more detailed understanding of the oriented state of such molecules. As described above, polarized ATR spectroscopy is useful for rapidly and non-destructively measuring and evaluating the surface state of oriented molecules, such as film and l iquid crysta l compounds. The analysis results can also be used to calculate the degree of orientation for each vibrational mode and for quantitative evaluations of orientation along the axis of the molecular depth.
确定
还剩1页未读,是否继续阅读?

产品配置单

佳士科商贸有限公司为您提供《通过偏振ATR附件测量取向膜和液晶分子》,该方案主要用于其他中薄膜测量、液晶分子测量、偏振ATR检测,参考标准--,《通过偏振ATR附件测量取向膜和液晶分子》用到的仪器有JASCO傅立叶变换红外光谱仪FT/IR-6000
推荐专场
相关方案
更多
该厂商其他方案
更多