


方案详情
文
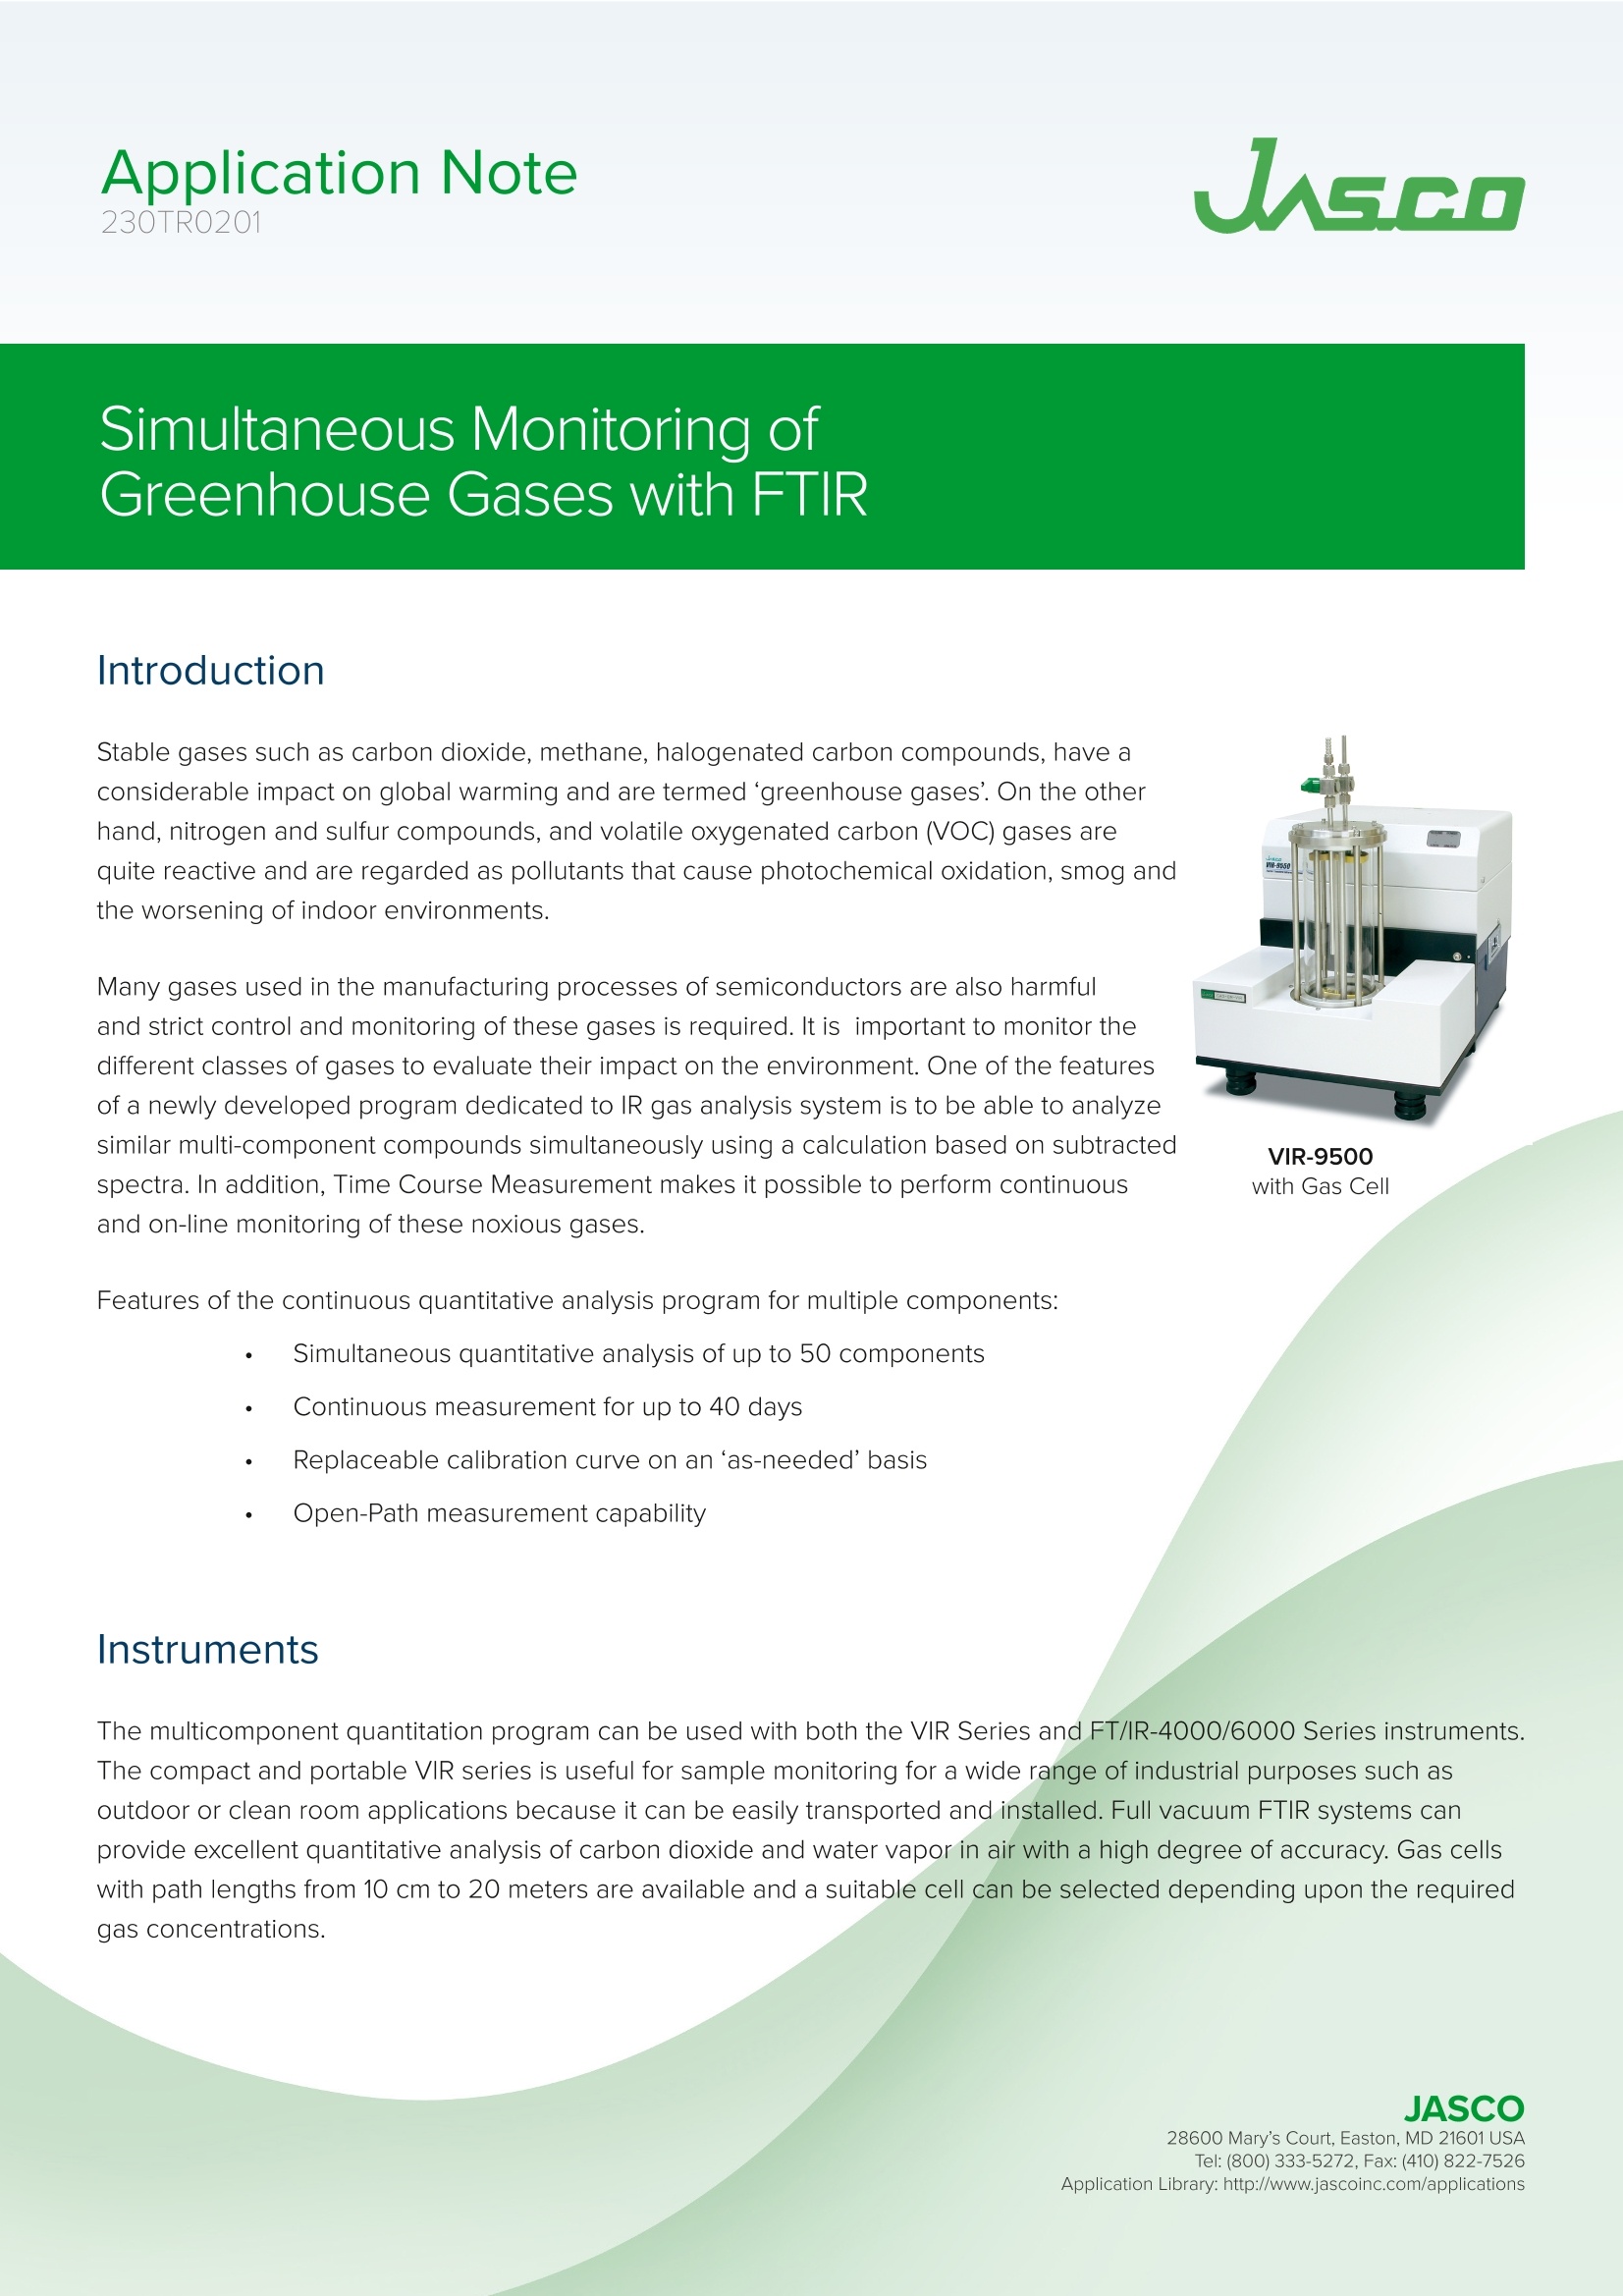
本说明说明了使用FTIR评估同时检测温室气体。
方案详情

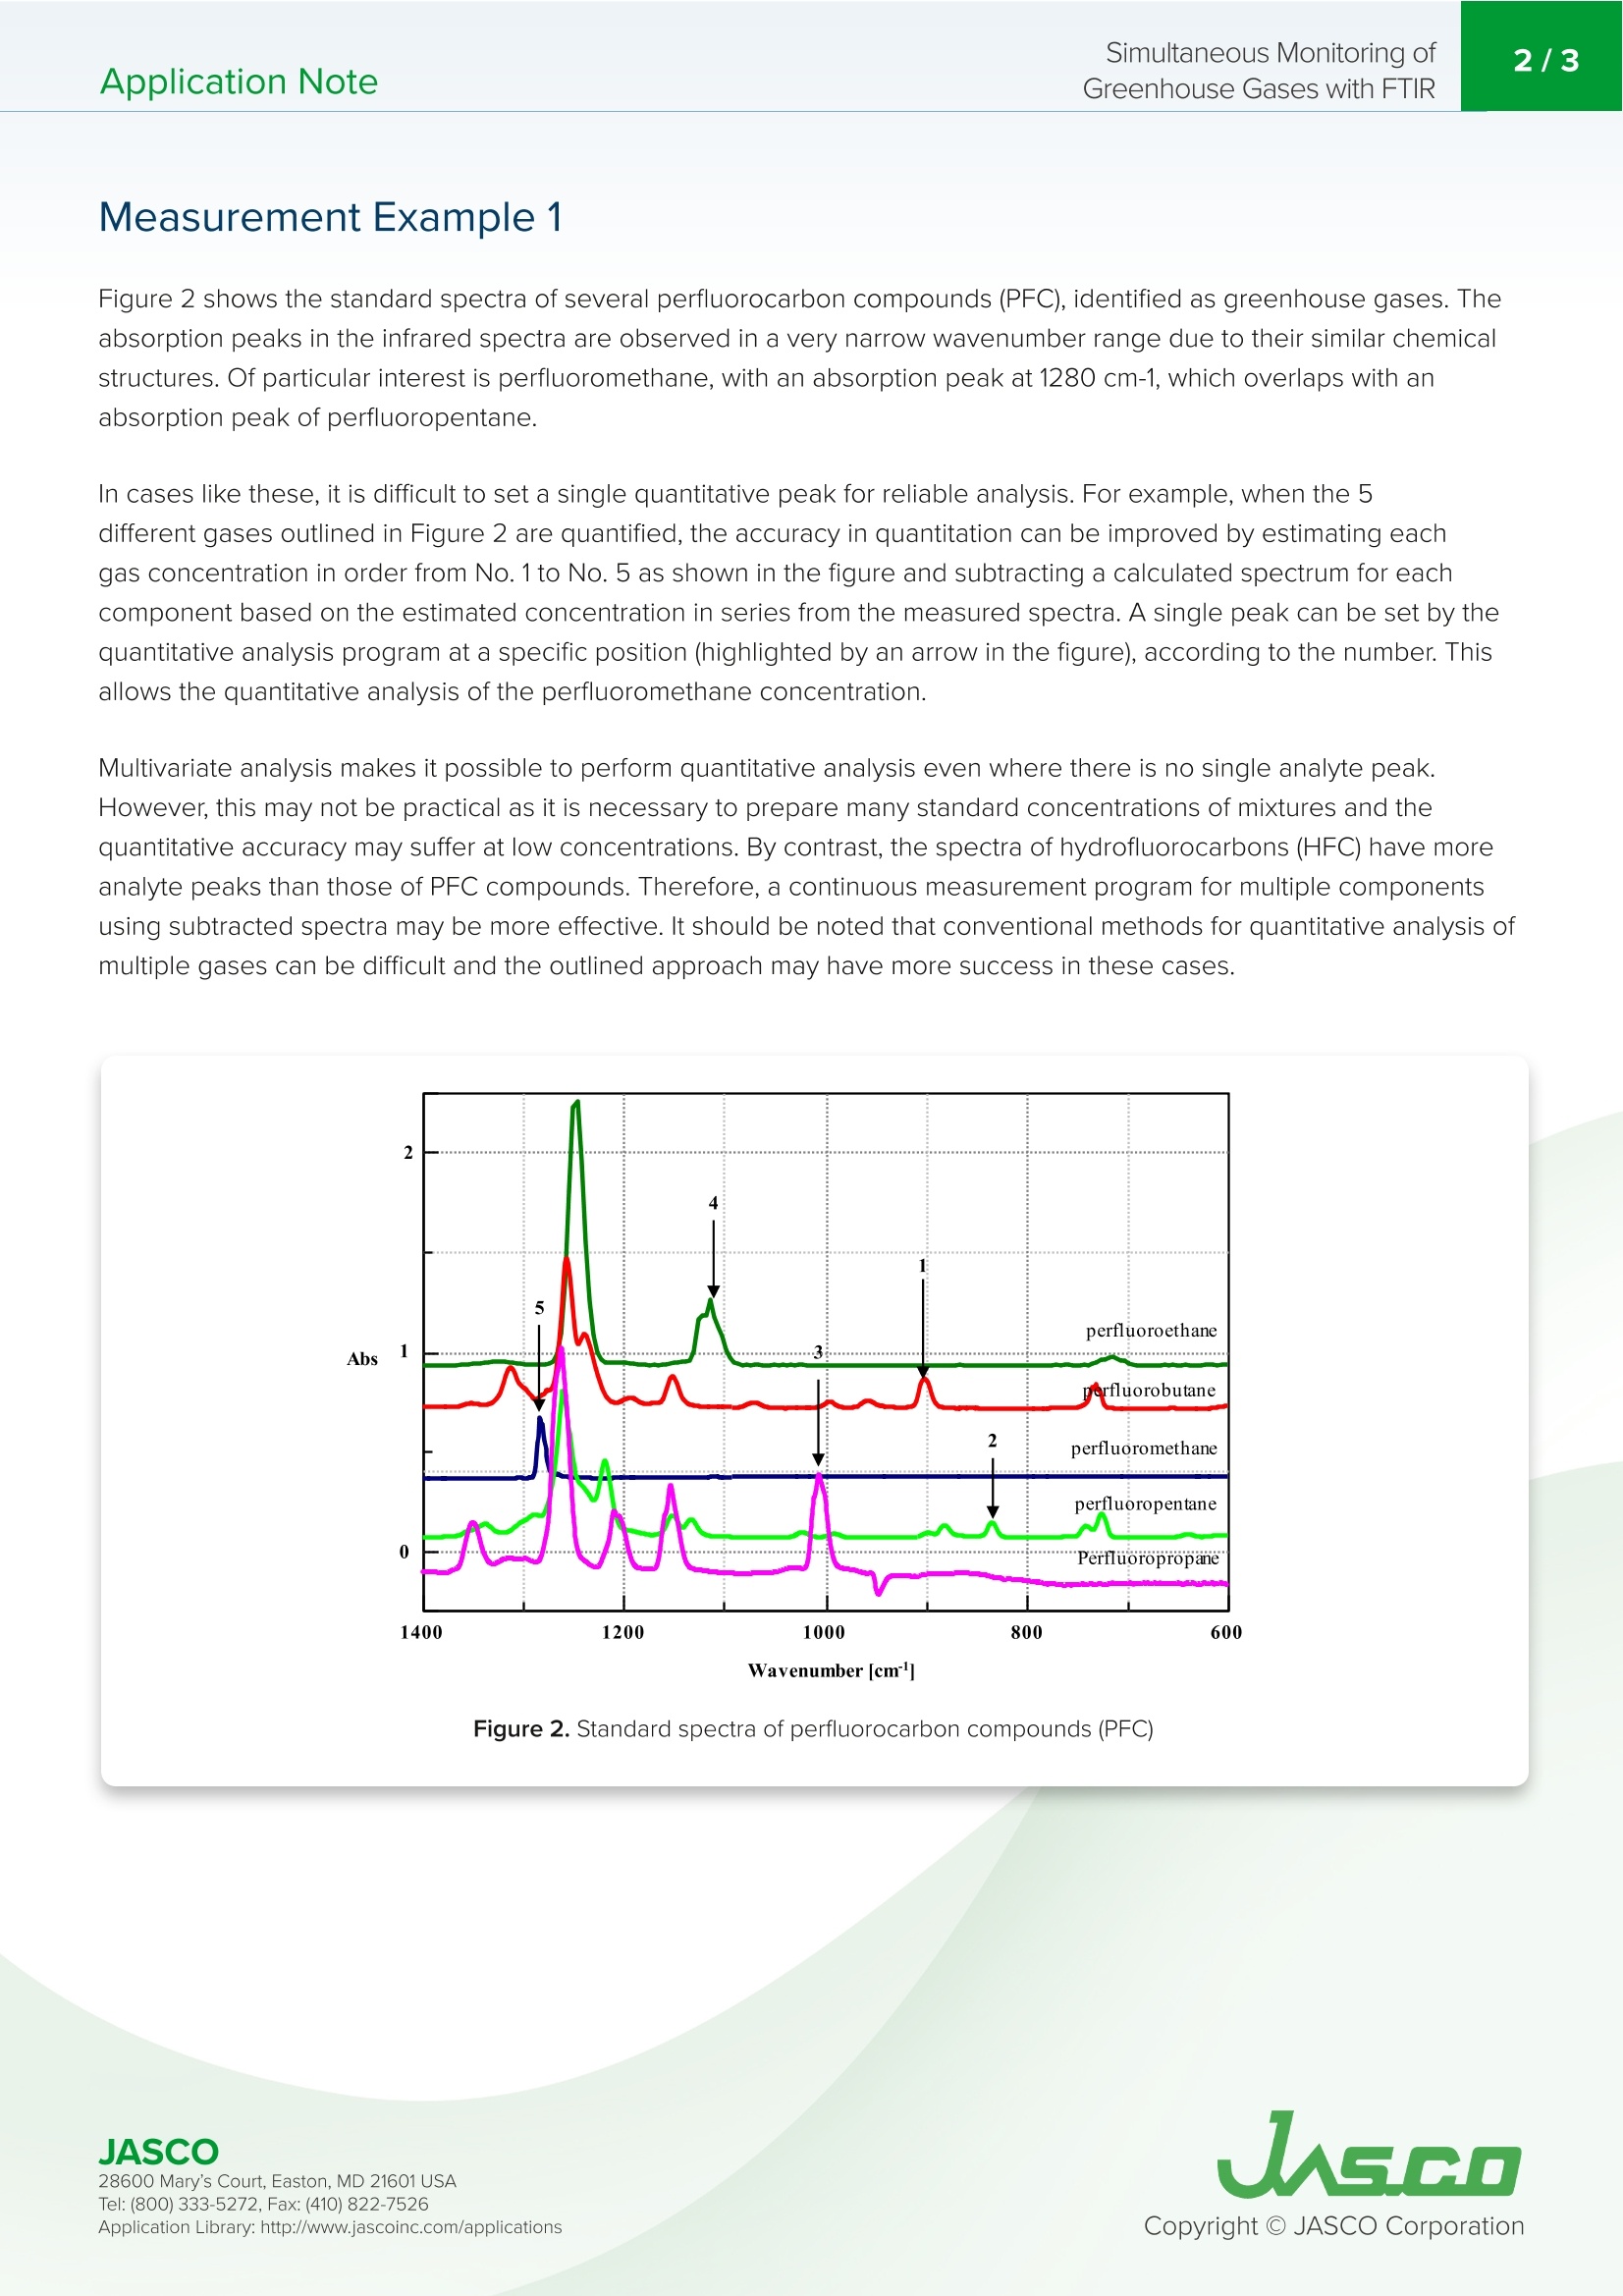
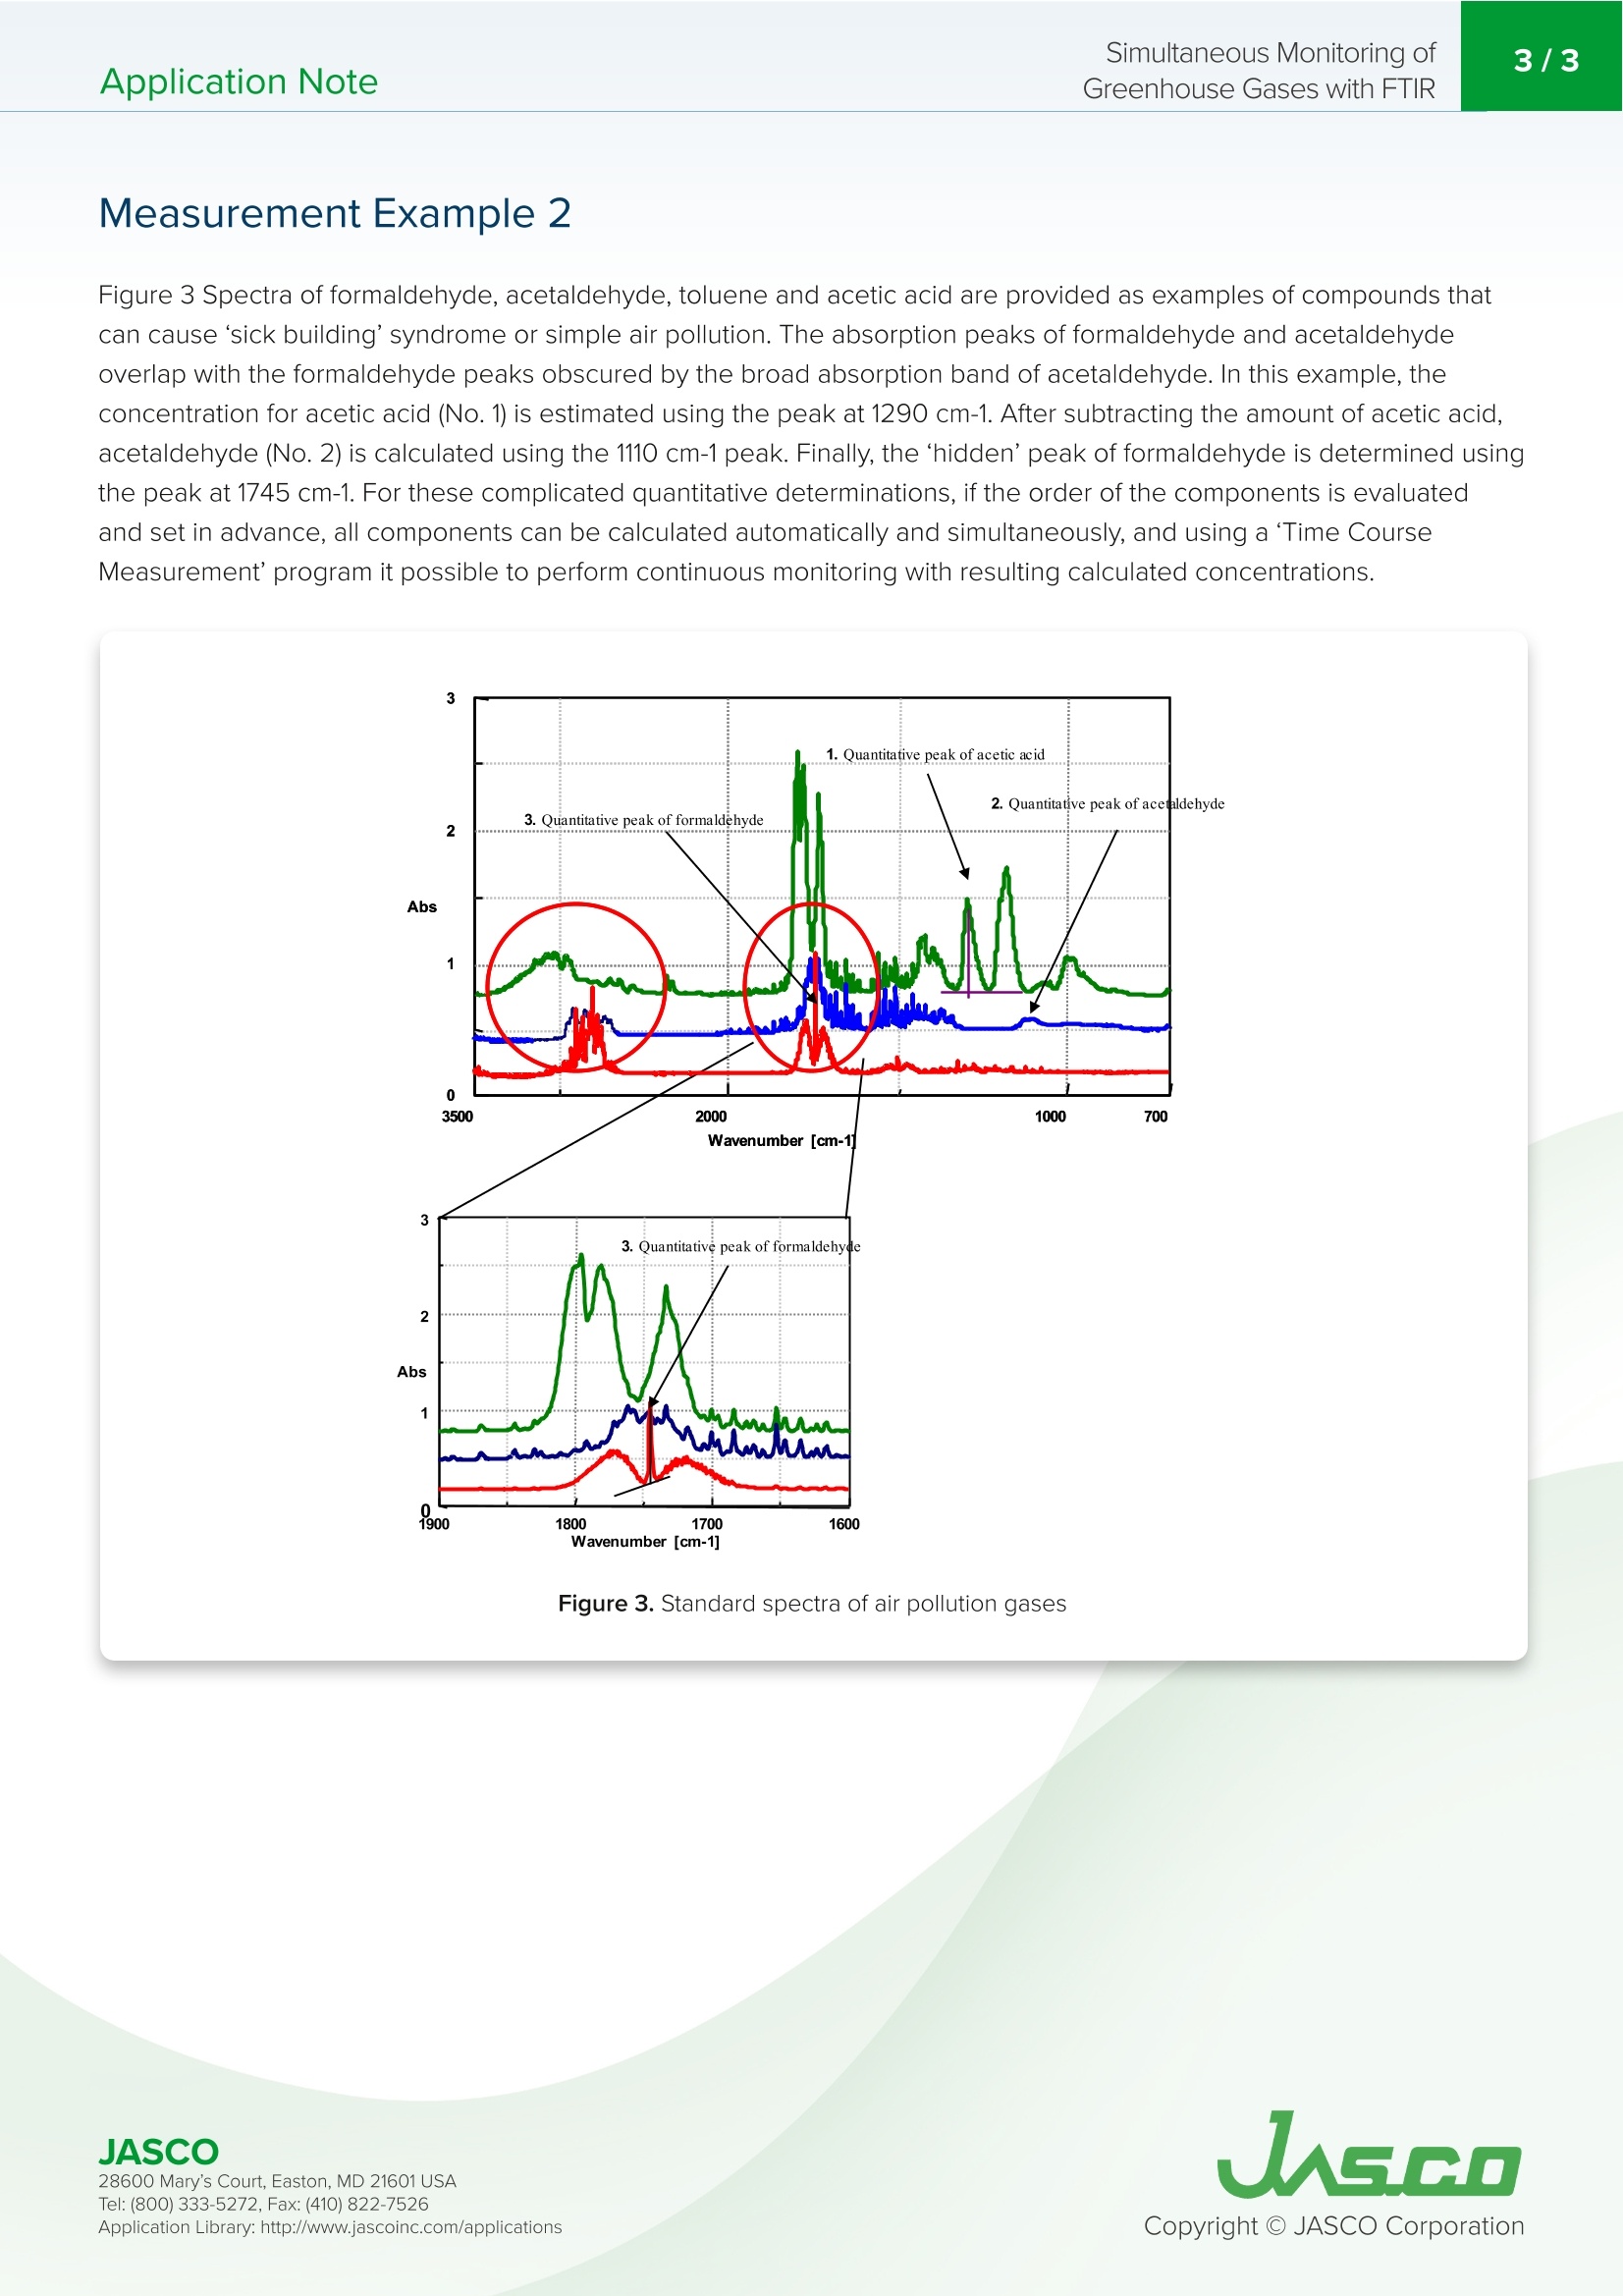
二氧化碳、甲烷、卤代碳化合物等稳定气体对全球变暖有相当大的影响,被称为“温室气体”。另一方面,氮和硫化合物以及挥发性含氧碳(VOC)气体具有很强的反应性,被认为是导致光化学氧化、烟雾和室内环境恶化的污染物。半导体制造过程中使用的许多气体也是有害的,需要对这些气体进行严格的控制和监测。监测不同类别的气体以评估其对环境的影响是很重要的。新开发的IR气体分析系统专用程序的特点之一是能够使用基于相减光谱的计算同时分析类似的多组分化合物。此外,时间过程测量使对这些有害气体进行连续在线监测成为可能。多组分连续定量分析程序的特点: •最多50种成分的同时定量分析 •连续测量长达40天 •可根据需要更换校准曲线 •开放路径测量能力多组分定量程序可用于VIR系列和FT/IR-4000/6000系列仪器。紧凑便携的VIR系列可用于多种工业用途的样品监测,如户外或洁净室应用,因为它可以方便地运输和安装。全真空FTIR系统可以高精度地对空气中的二氧化碳和水蒸气进行极好的定量分析。路径长度从10厘米到20米的气体电池是可用的,并且可以根据所需的气体浓度来选择合适的电池。本应用中展示了2中测量示例,如需要请点击......Application Note230TRO201 Simultaneous Monitoring ofGreenhouse Gases with FTIR2/3Application Note Simultaneous Monitoring o f Greenhouse Gases with FTIR Introdu c tio n Stable g a ses such as ca r bon dioxide, methane, halogenated ca r bon compounds, have a considerable impact on global war mi ng and a r e termed ‘greenhouse gases . On the othe r h and, nitrogen a n d su l f u r compounds, and volatile oxyge n ated carbon (VOC) gases are q u ite react i ve and are regarded as pollutants t h at cause photochem i ca l oxidat i on, smog a n c the worsening of indoor environments Many gases used i n the manufactur i ng processes of semiconductors are also h armful and strict con tr ol and monitoring of these gases is required. It i s important to monitor the d i ffere n t classes of gases to evaluate their impact on t he environment. One of the features of a n ewly deve l oped prog r am dedicated to IR gas analysis system is to be able to a n alyze similar m u lti-component compounds simu l ta n eously using a calculation based on su b t r acted spect r a. In addition, Time Course Measurement makes i t possible to perform contin u ous and on-l in e monitoring of these nox i o u s gases. VIR-9500wi t h Gas Ce l l Features of the continuous quan t itative analysis prog r am for multiple components: Simultaneous qu a nt i t ative a n alysis of up to 50 com p onents Conti n uous measurement for up to 40 days Replaceable cali b ration curve o n an ‘as-needed'bas i s Op e n -Pa t h measu r eme n t capabi l i ty I n s t rum e nts T h e multicomponent quant i tat i on program can be us e d with bot h th e VIR S e r ie s and FT/IR-4000/6000 Series instruments .T h e compact and por t a b le VIR se ri es is us ef ul for sample mon i to r ing for a wide range of i ndustrial pu r poses such as outdoor or c l ea n room appl i ca t ions because it can b e easily transpor t ed and installed. Full vacuum F T IR systems can provide excelle n t qua n titative analysis of carbon dioxide a n d water vapor in air with a high degree of accuracy. Gas cells with pat h l engths from 10 cm to 20 meters a r e available and a suitable cell can be selected depending upo n the requ i red gas concentrat i ons. Mea s ur e m e n t E xamp le 1 Figur e 2 shows t h e standard spec t ra o f several per fl uorocarbon com p o u nd s (PFC), identif i ed a s gr e e n house gas e s. The absor p t i on p e aks in t h e i nfrar e d s p ec t ra are obs e rved in a very nar r ow wav e numb e r rang e du e to the i r similar ch e mical st r uctur e s. Of particular inter e st i s p erfluorometha n e, with an absorption peak at 1280 cm -1, which ov e rlaps with an absor p t i o n peak of perflu o rope n tane. In ca s e s like the s e, it is di f f i cult to set a s in gle quanti t at i ve peak f or re l iabl e analysis. For example, wh e n t he 5diff ere n t ga se s ou tli ned in F i gur e 2 ar e qu a nt i fi e d, t h e accu r acy in q u ant it a ti o n can b e i m prov e d b y e stimating e ach gas conc e n t ration i n order from No. 1 to No. 5 as s h own in t h e f i gure an d subtrac t i ng a ca l culat e d s p ect r u m for e ac h compone n t based on t h e estimated conce n t r a ti o n in s e r i e s f rom th e measured spectra. A si n gle p eak can be set by the qu a n tit ative ana l ysis program at a s p ec i f i c position (hig h l i g h ted by an arrow in the figure ), a c cording to t h e n umber . This al l ows t h e qua n t it a t i ve analys i s of th e per f luorome t han e co n c e ntra ti on. Mu l t i v a riate an a lysis makes i t poss i ble t o perfor m q uanti t ative ana l ys i s eve n where t h ere is no si n gle analyte p eak .However , t h is may not be pract i ca l a s i t i s n e cess a ry to p re p a r e many stan da rd concentratio n s of m i xt u res and th e qu a n t it at i ve accura c y may suffer at low concentrat i ons. By contras t , th e s p ec t ra of hydrof l uoroc a rbons (HFC) h ave more analyte peaks th an t h ose of PFC com p o u nds. The r efore, a co n tin u ous m e asurement program for mu ltiple compo n ents usi n g su b t r ac te d s p ectra may b e mor e eff e c t iv e. I t sho u ld b e not e d th a t co n ve n tional methods for qu a nt i tativ e a n alysis of multiple gas e s can b e difficult an d the outli n e d a p proach may have mor e s u cc e ss i n thes e cas e s. Figure 2. Stan d ard spect r a of p e r f l uorocarbo n compo u nds (P F C) M ea s urem e nt E xam pl e 2 Figu r e 3 Spec tr a of f ormald e hyde, ace t aldehyd e , tolu e ne a n d acet i c acid are p rovid e d as e xamp l es of compounds that can ca u se ‘sick bui l ding ' sy n drom e or s i m p l e air poll u t i on . The abso r ption peaks of fo r malde h yde a n d ac e t a lde h yde ove r la p with the formald eh yde p eaks obscu r ed by t h e b road absorpt i on b and of ac e ta l dehyde . I n th is e xampl e, t h e conc e n tration for ac et ic acid (No. 1) is e s t imat e d using th e p eak at 1290 c m-1. Aft e r subtrac tin g th e amou n t of ac e tic acid ,acetaldehyde (No. 2) i s calculat e d using th e 1110 cm-1 p ea k . F i nally, the ‘hidden' peak of f ormaldehyd e is d e ter min ed u s i ng the peak a t 1745 cm-1. For these comp l icated quan tit a ti ve determ in ations, if t h e order o f the compone n ts is eva l uated and set i n advance , all compon e nts can b e calculat e d automat i cally and s i mu lt aneous l y, and usi n g a ‘T i me Course Measu r eme n t ' program it possible to perform conti n uous moni t ori n g with re sul t ing ca l culat e d conc en tra ti ons. Figure 3. Sta n dard spec t ra of a ir p ollu ti o n g a ses 28600 Mary's Co u rt , E as t o n , MD 21601 US A
确定
还剩1页未读,是否继续阅读?

产品配置单

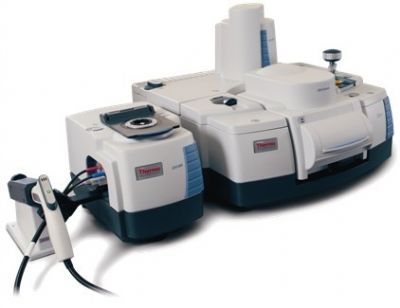
佳士科商贸有限公司为您提供《利用FTIR同时监测温室气体》,该方案主要用于室内空气中温室气体检测,参考标准--,《利用FTIR同时监测温室气体》用到的仪器有JASCO FTIR-4000傅立叶变换红外光谱仪、JASCO多用途FTIR VIR-100/200/300
推荐专场
相关方案
更多
该厂商其他方案
更多