


方案详情
文
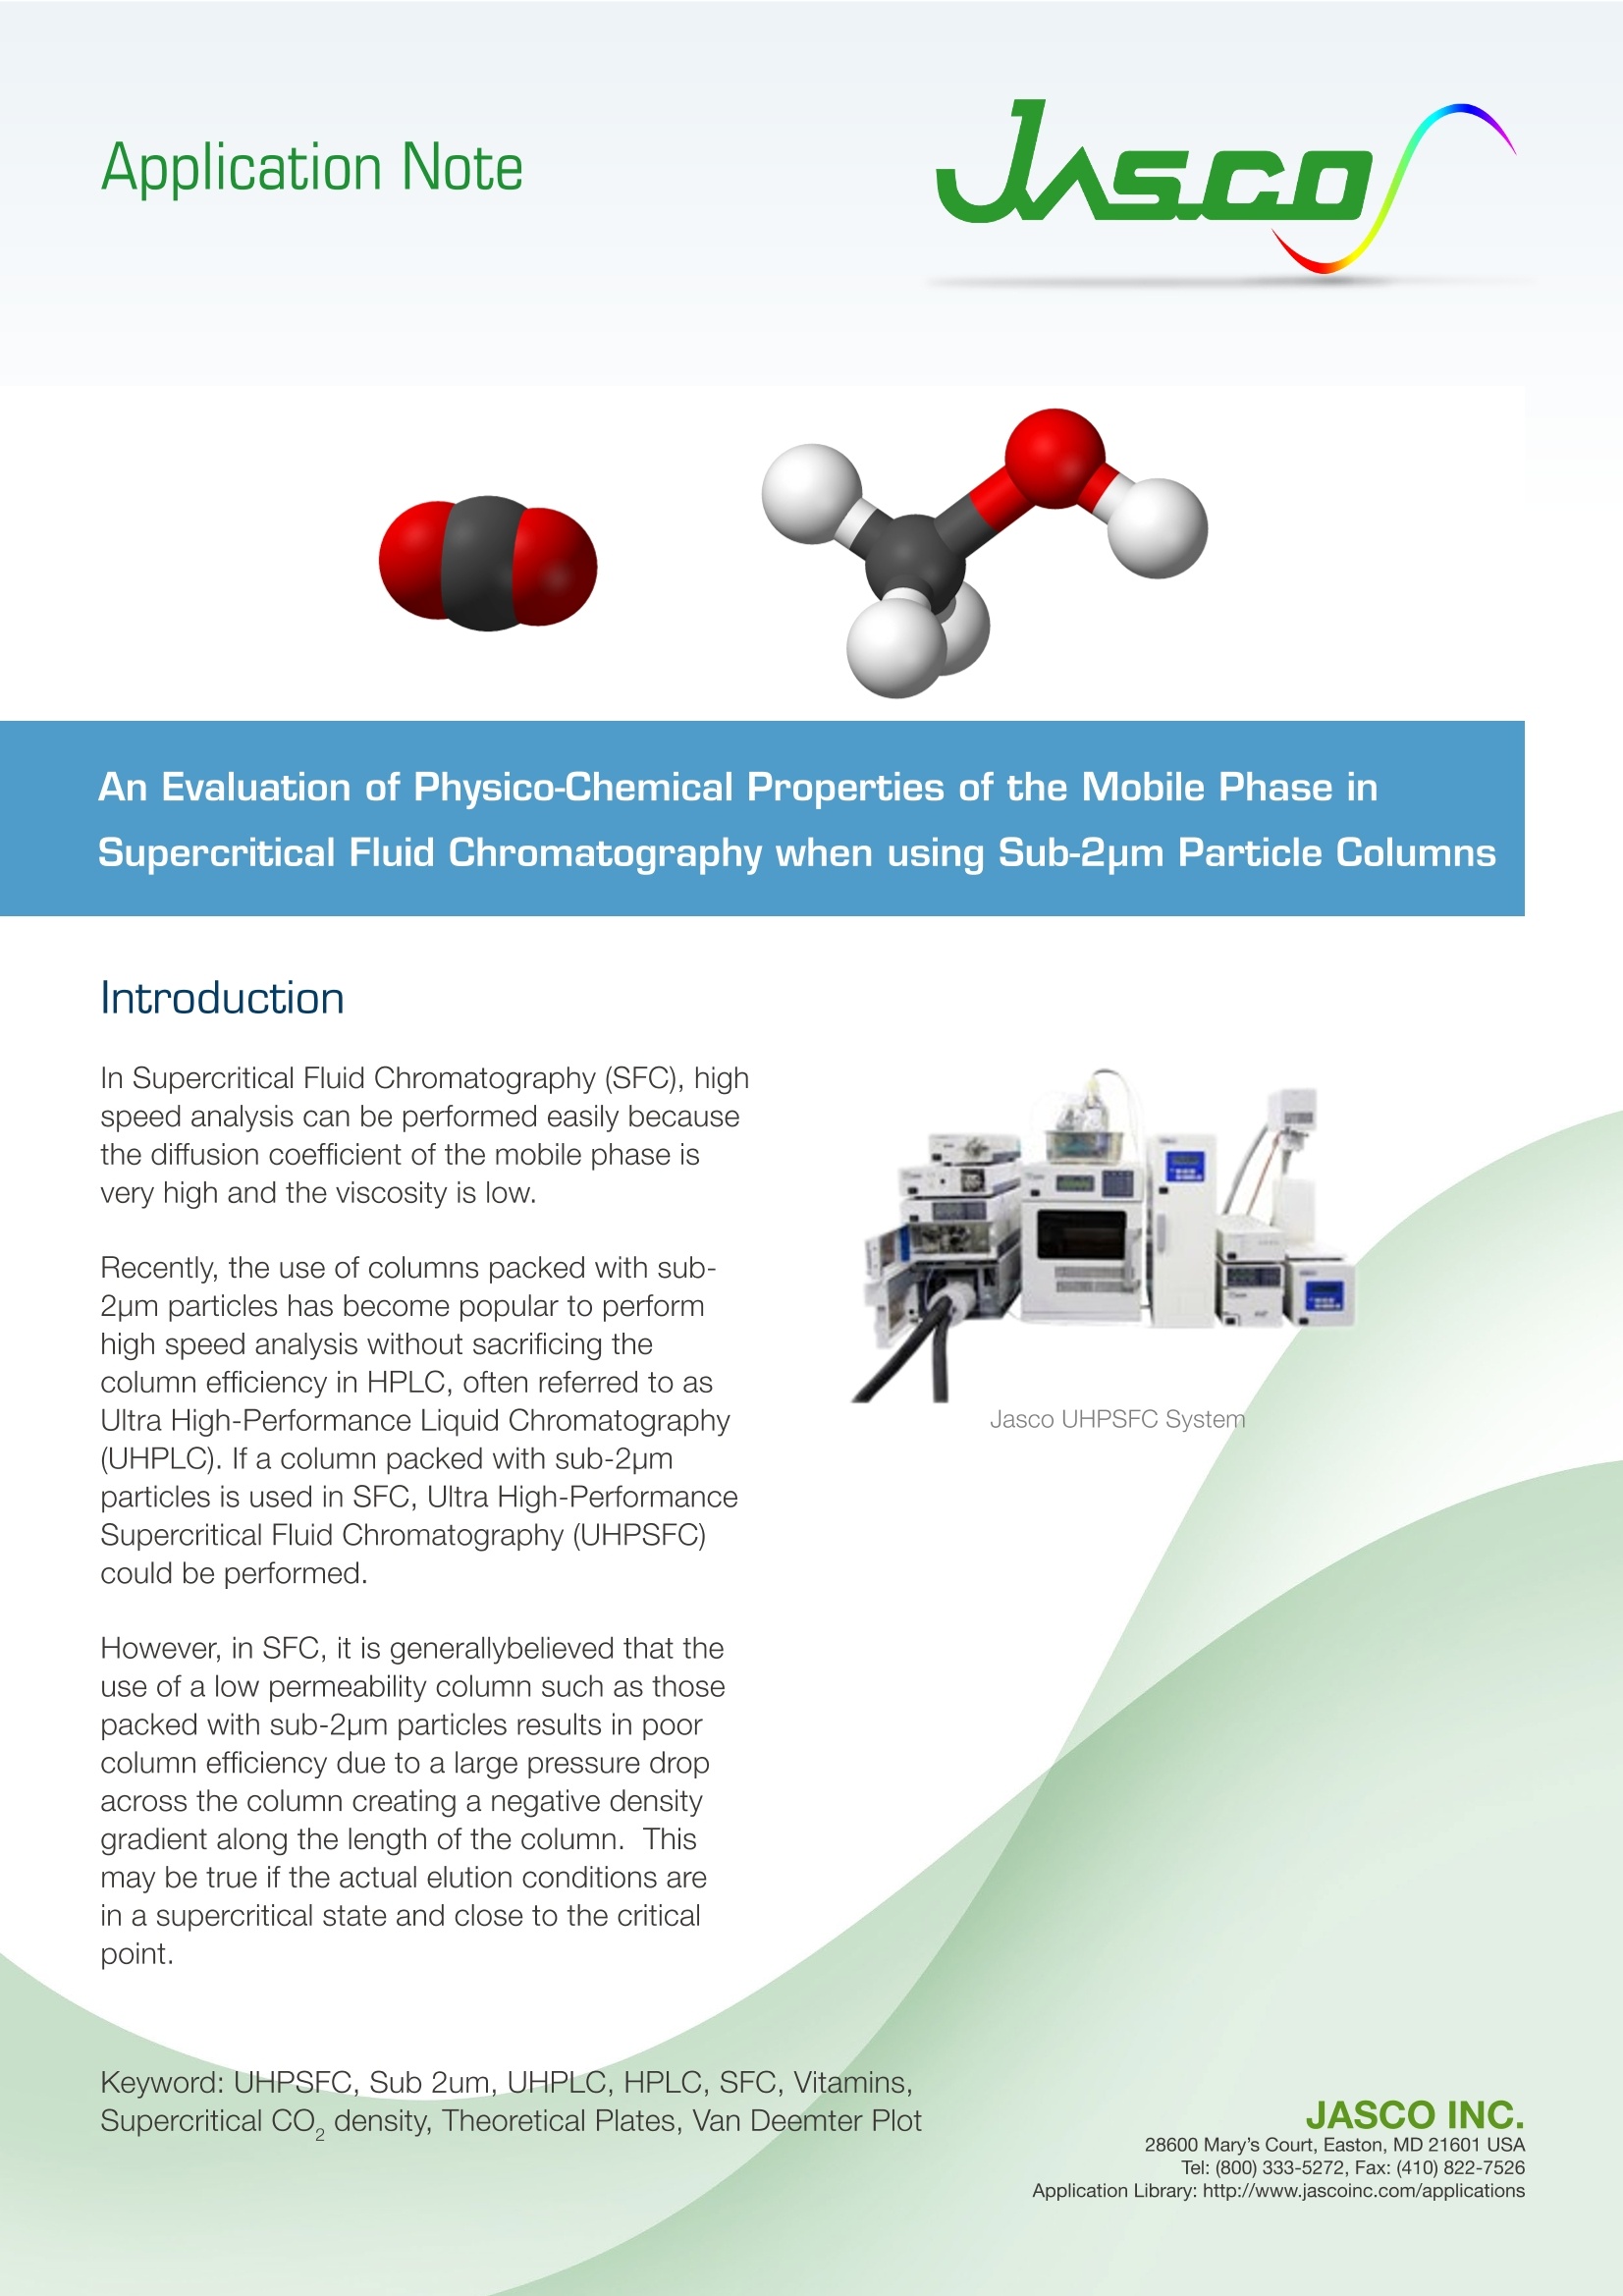
关键词: UHPSFC,Sub 2um,UHPLC,HPLC,SFC,维生素,超临界二氧化碳密度,理论板,Van Deemter Plot
方案详情

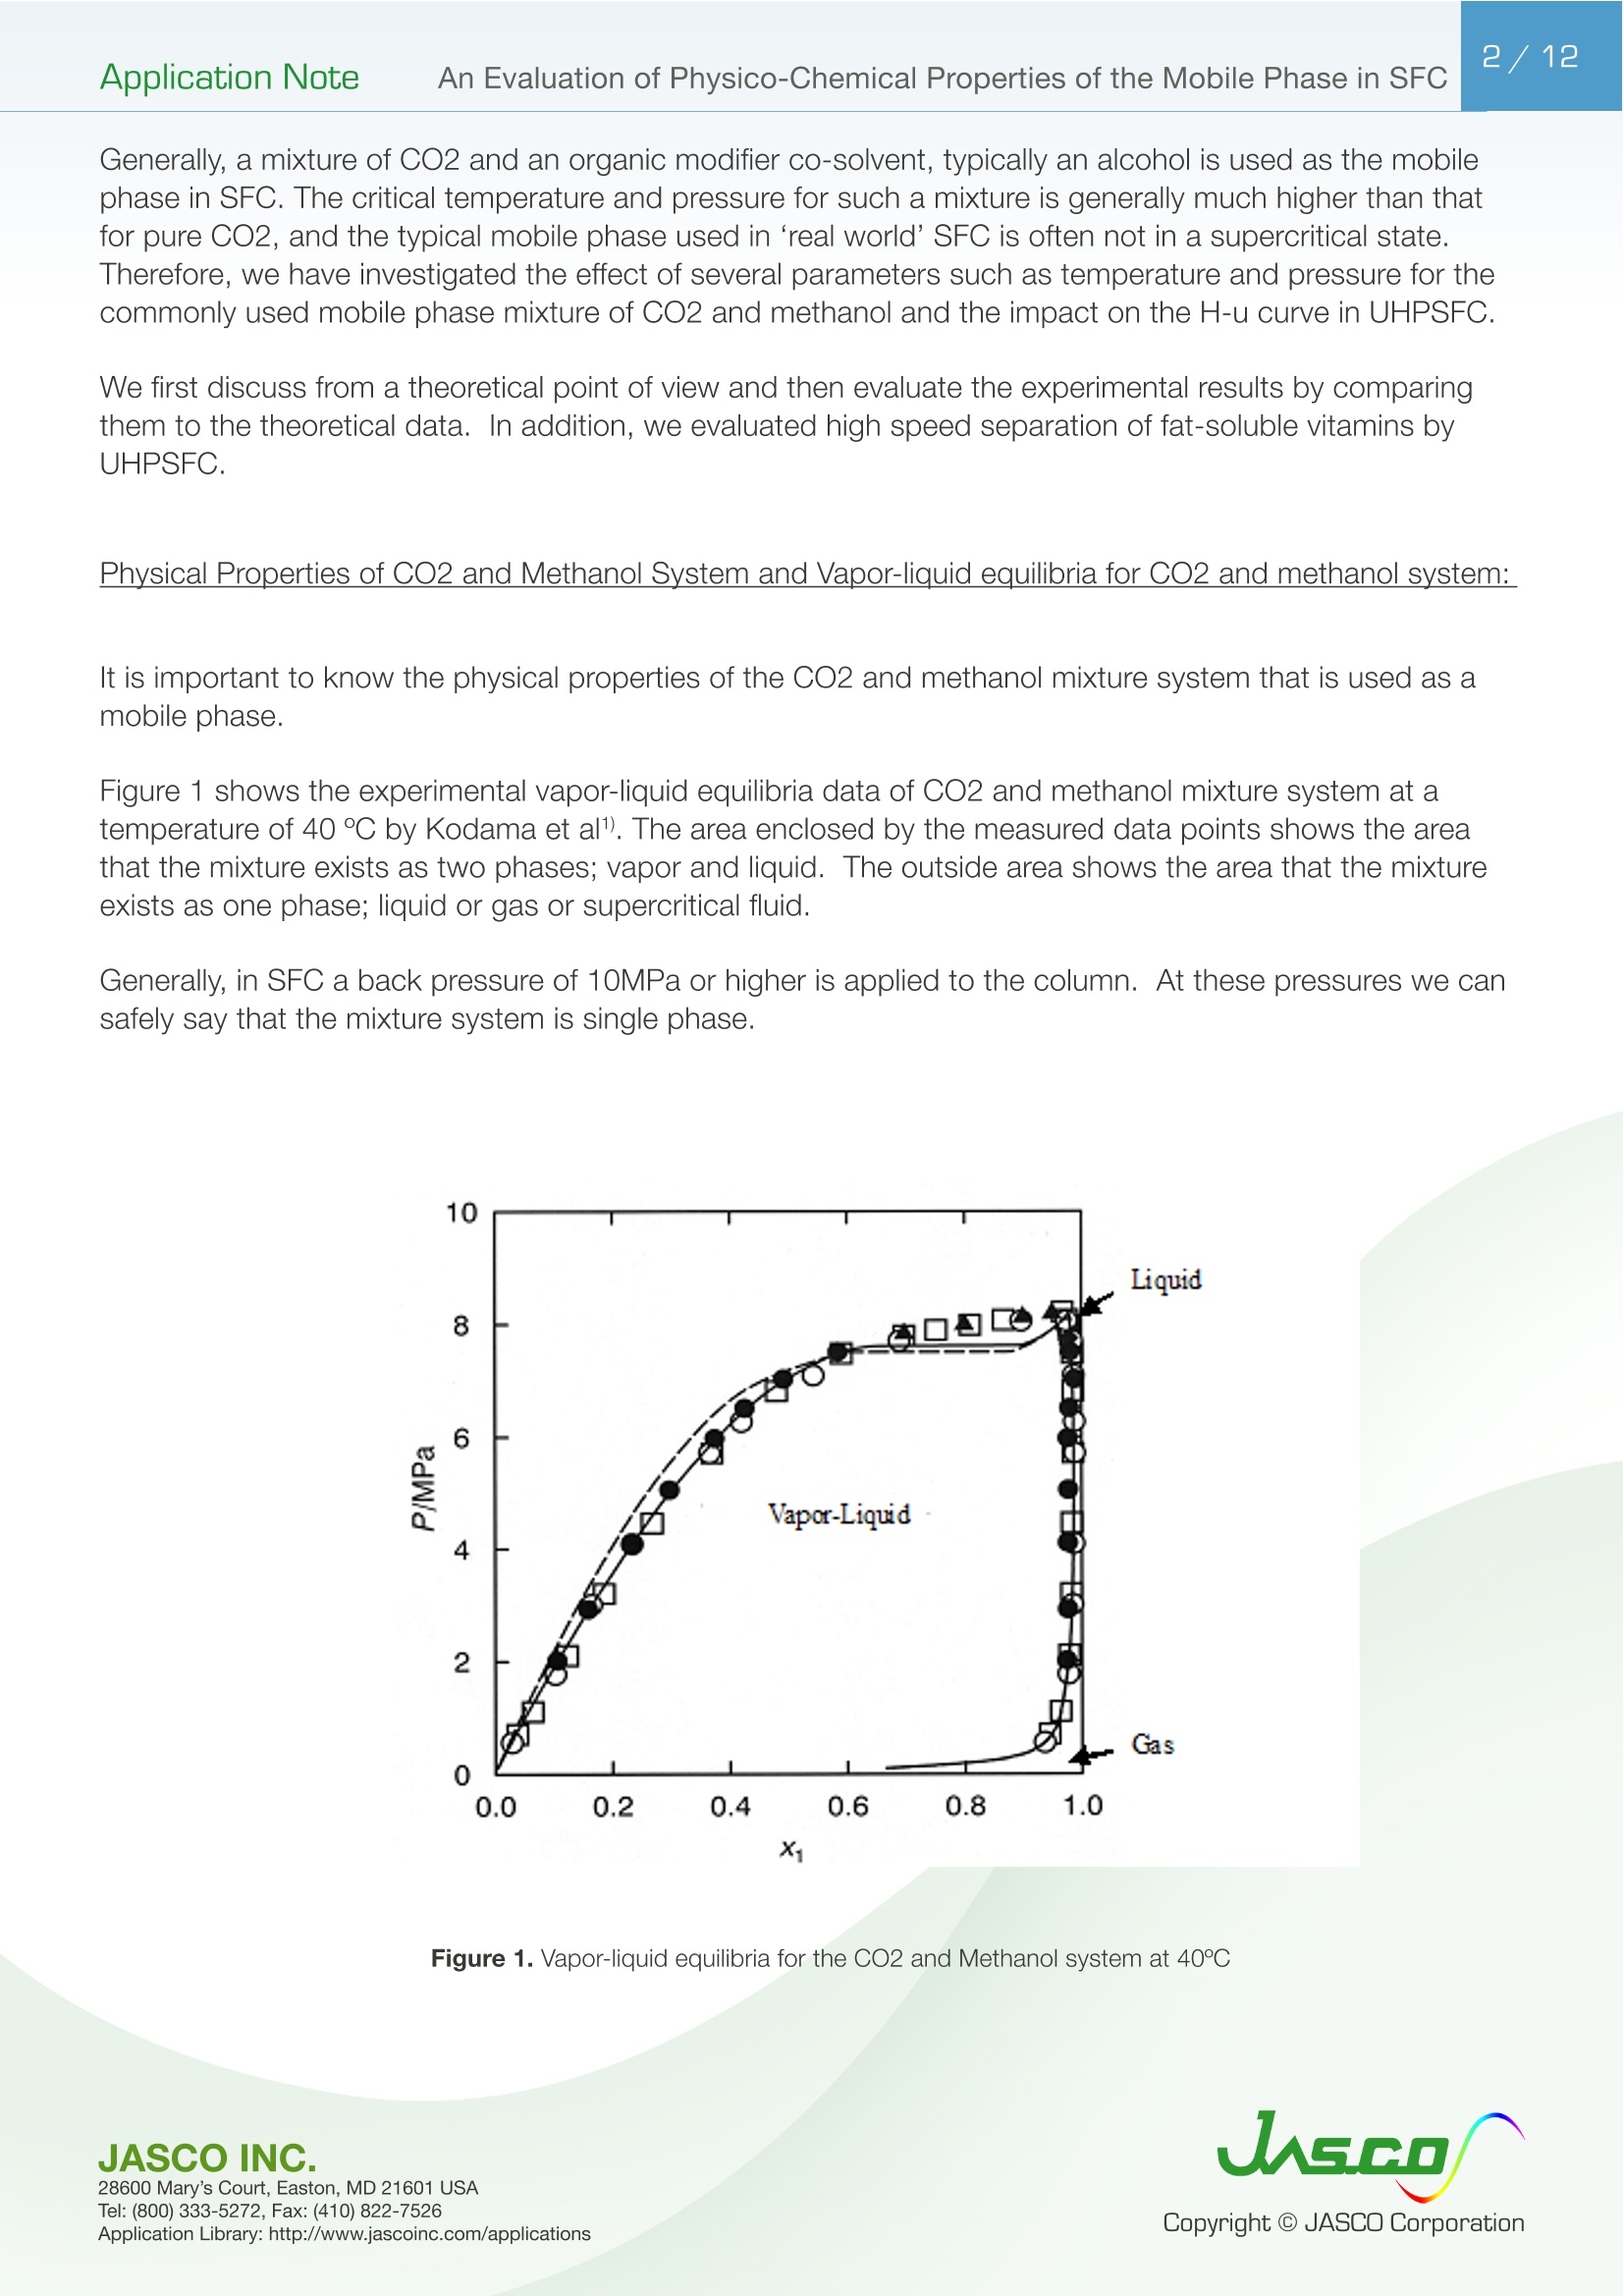
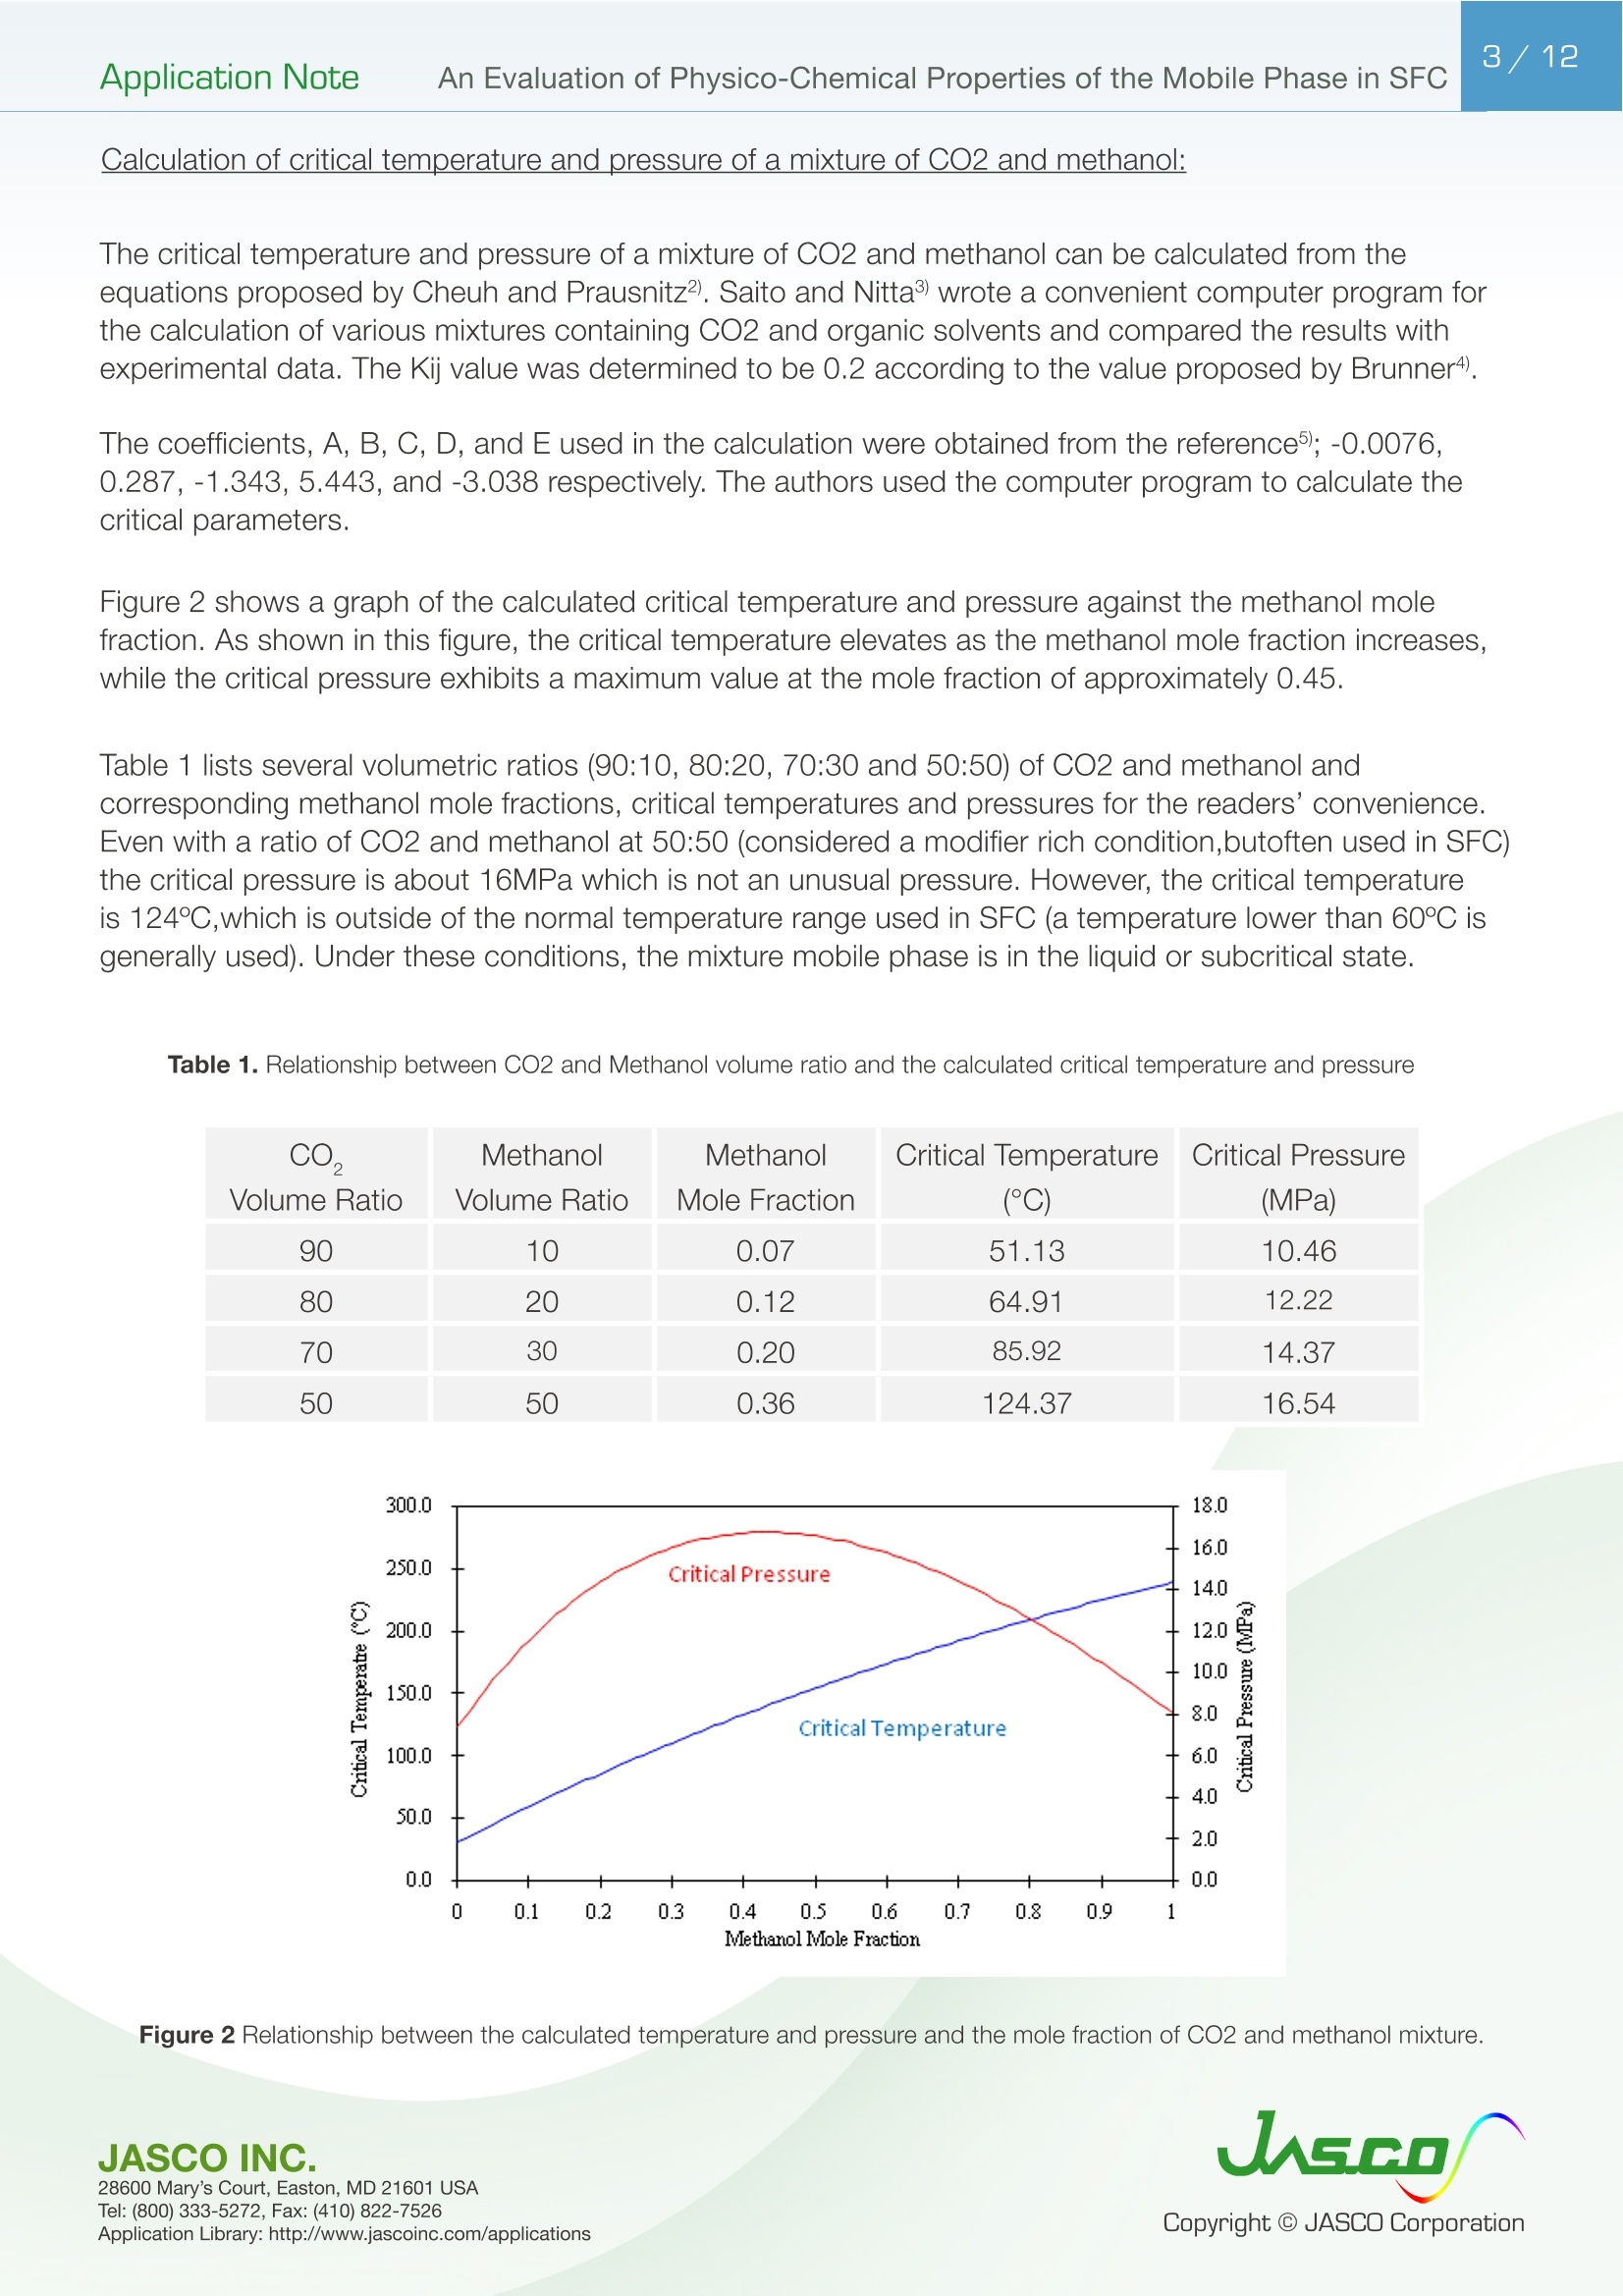
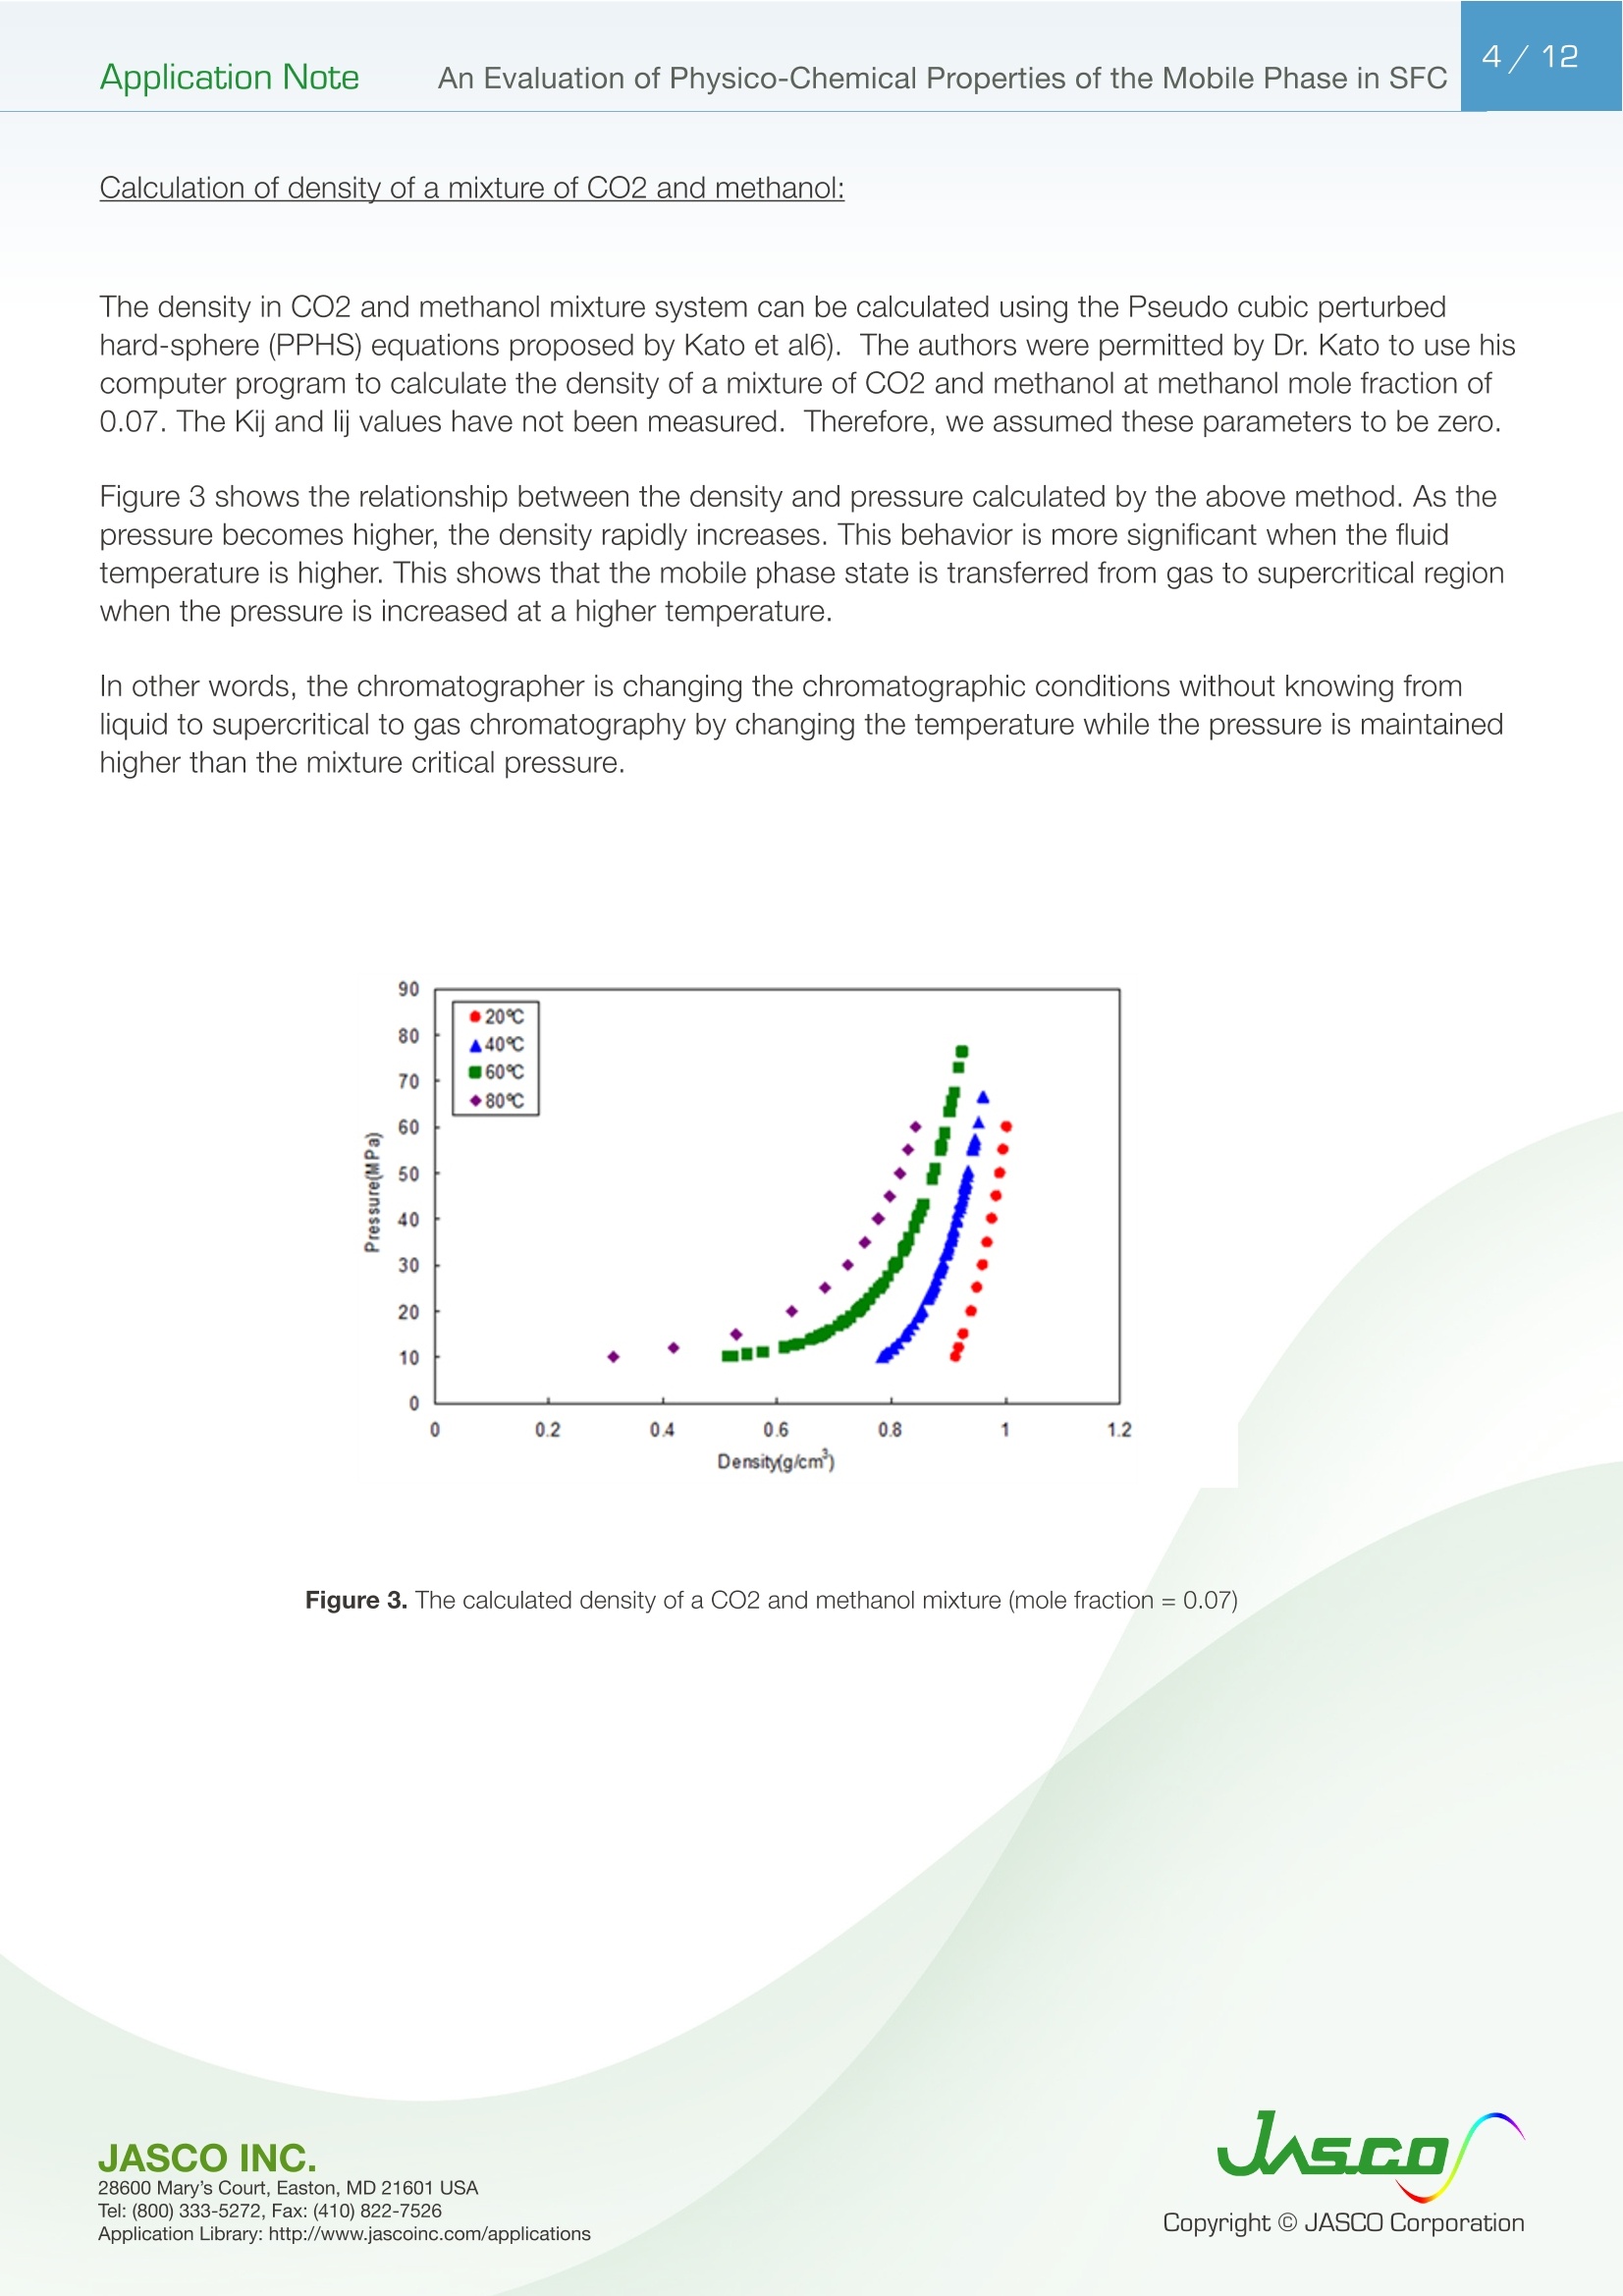
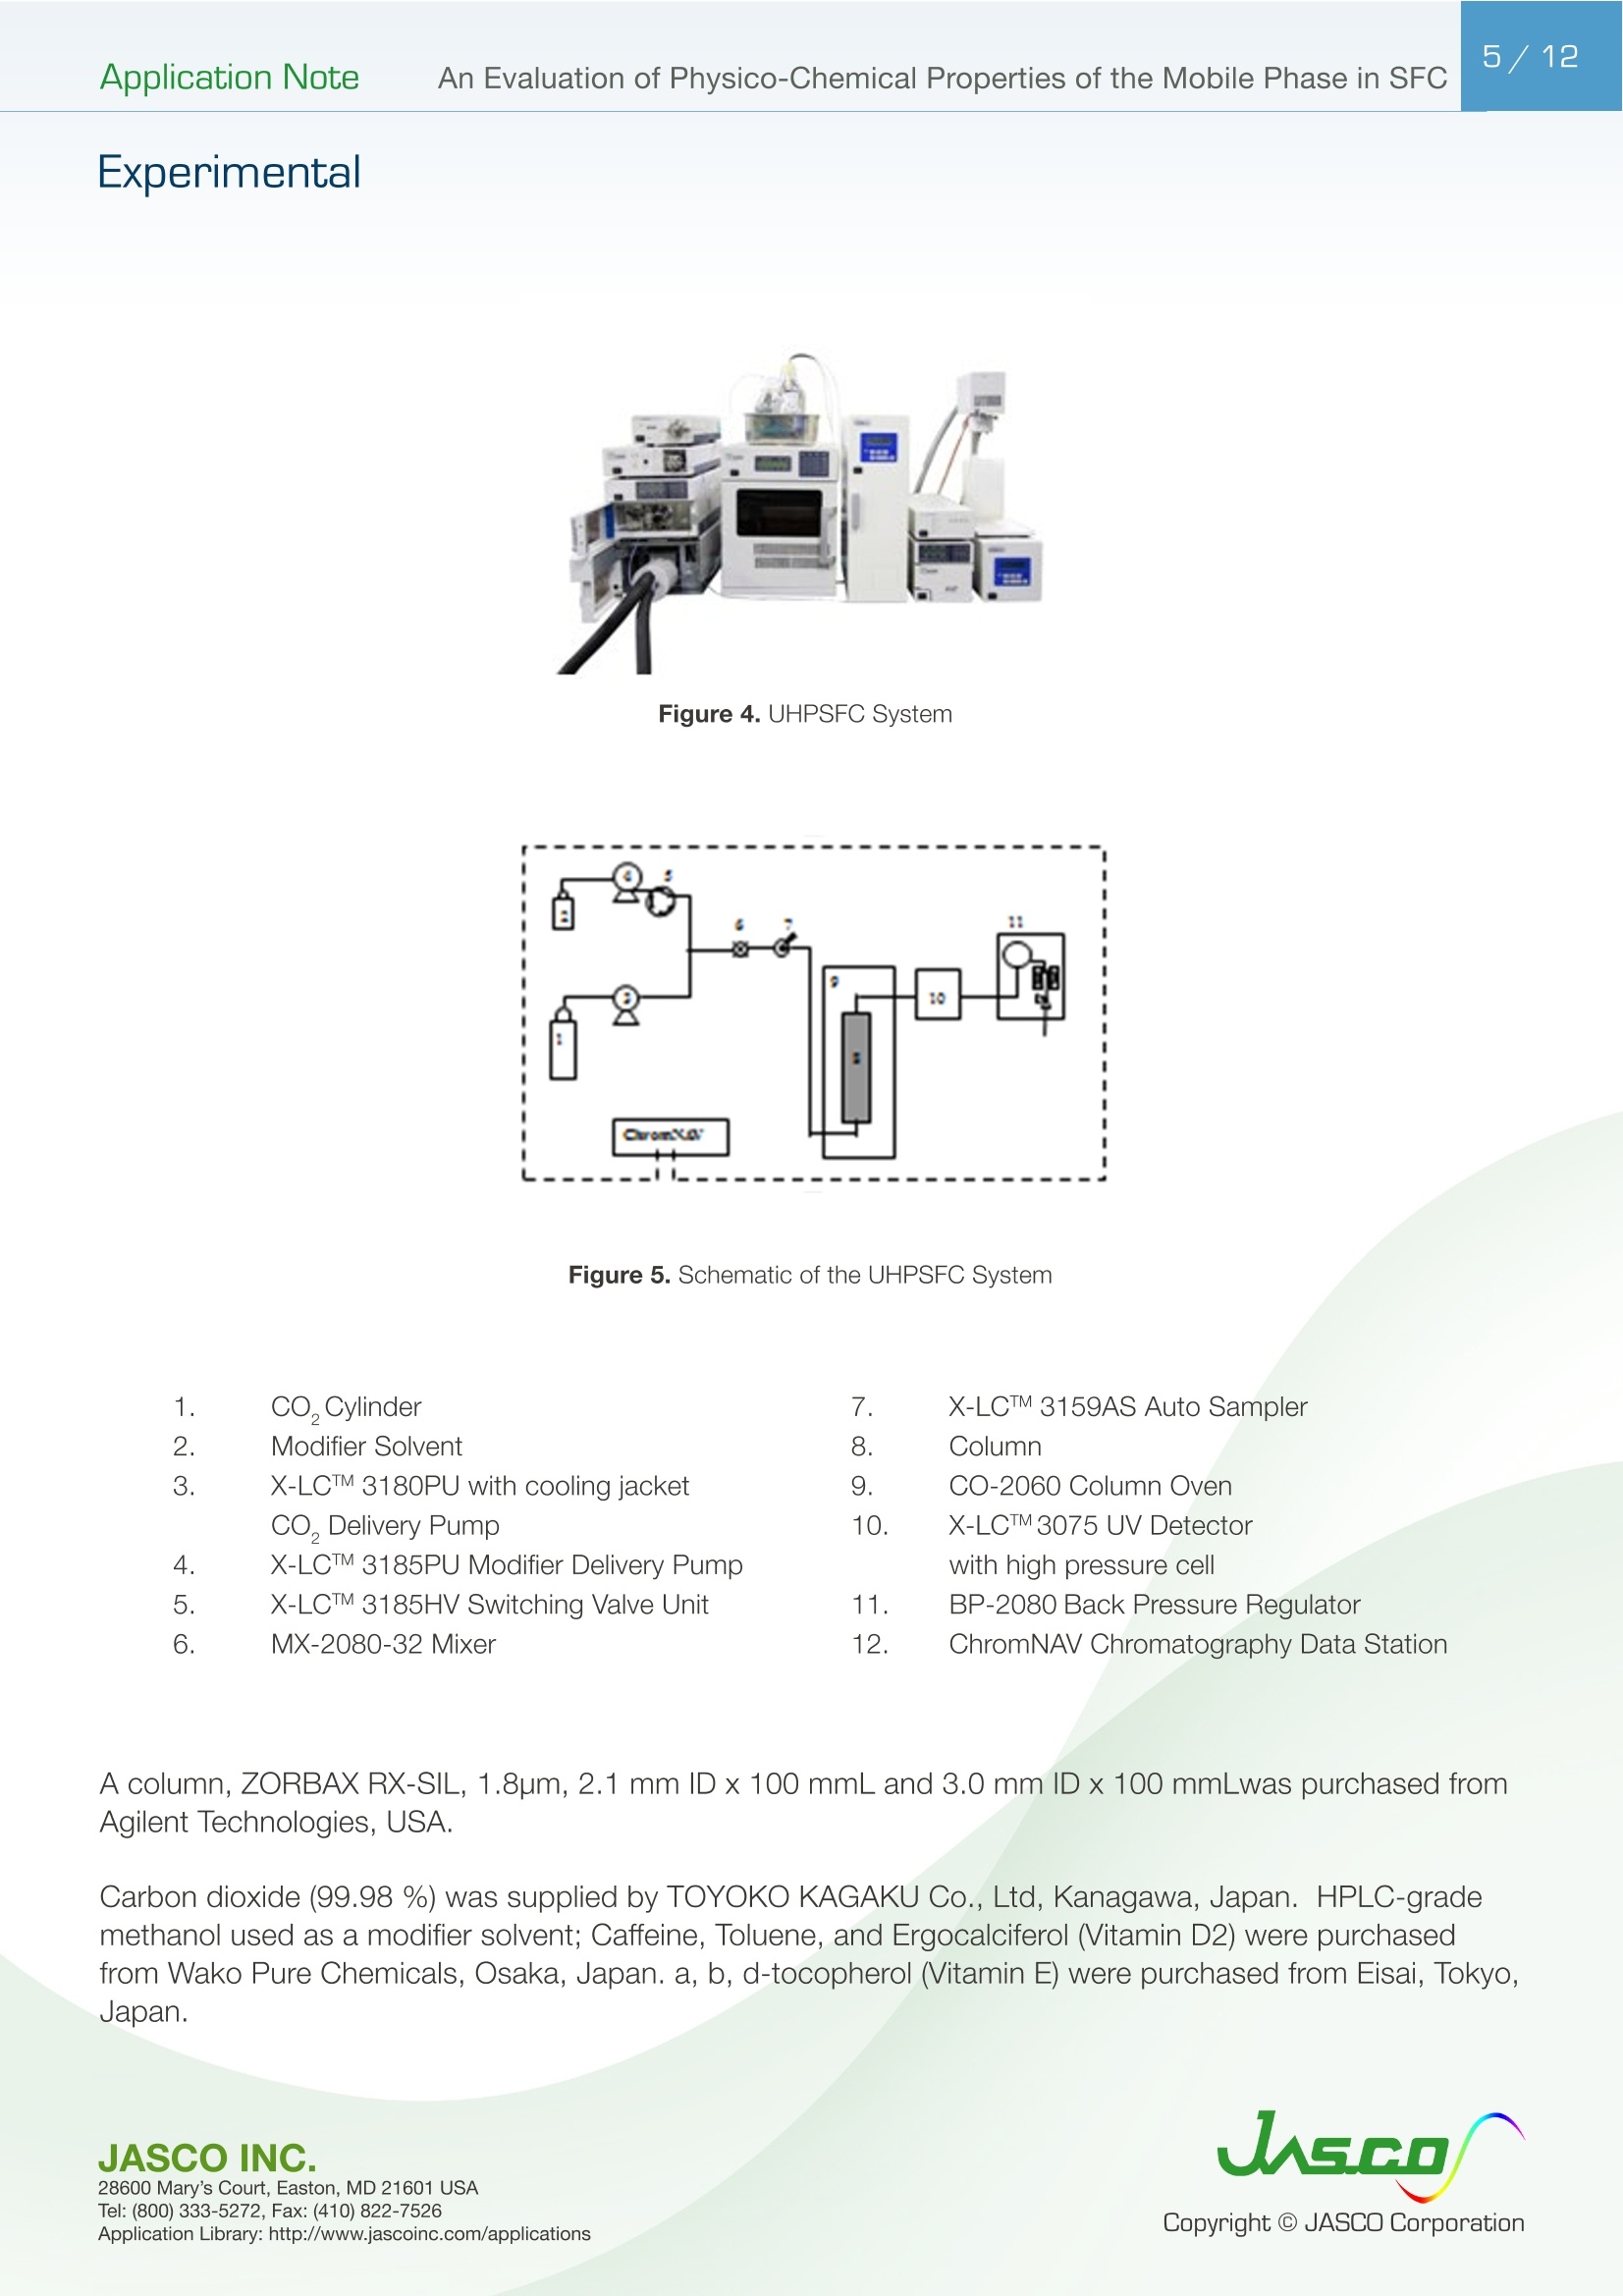
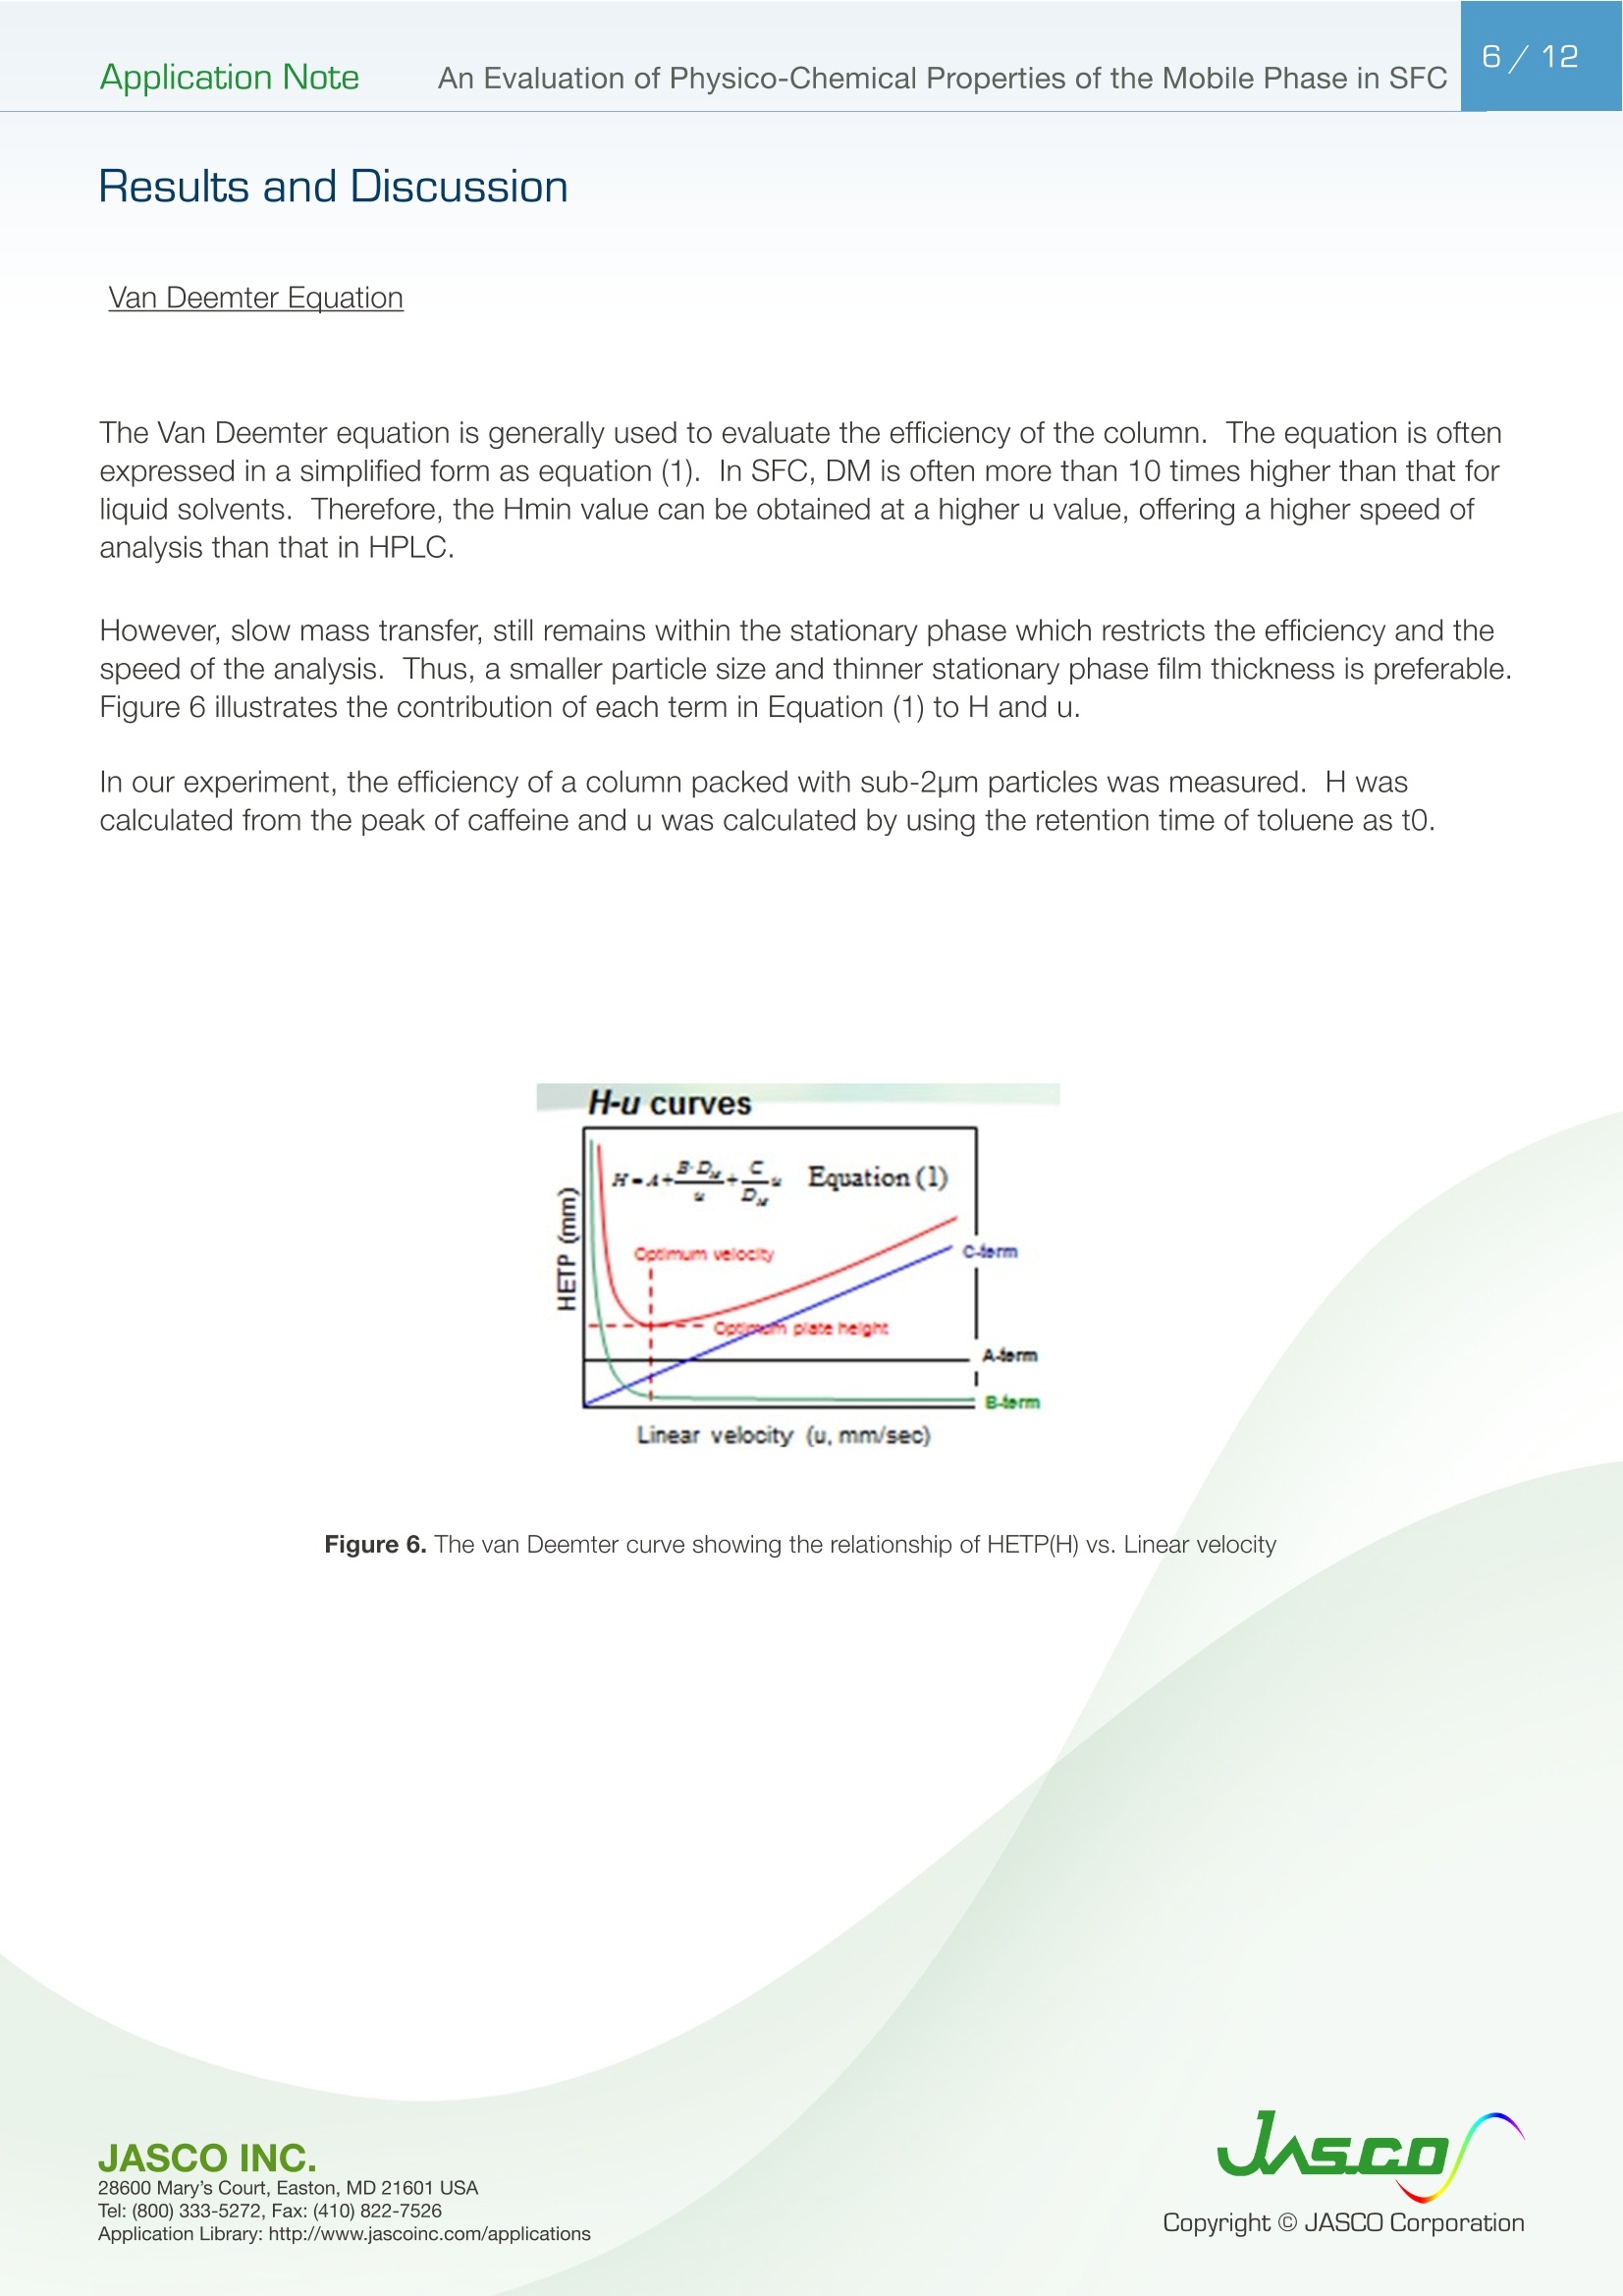
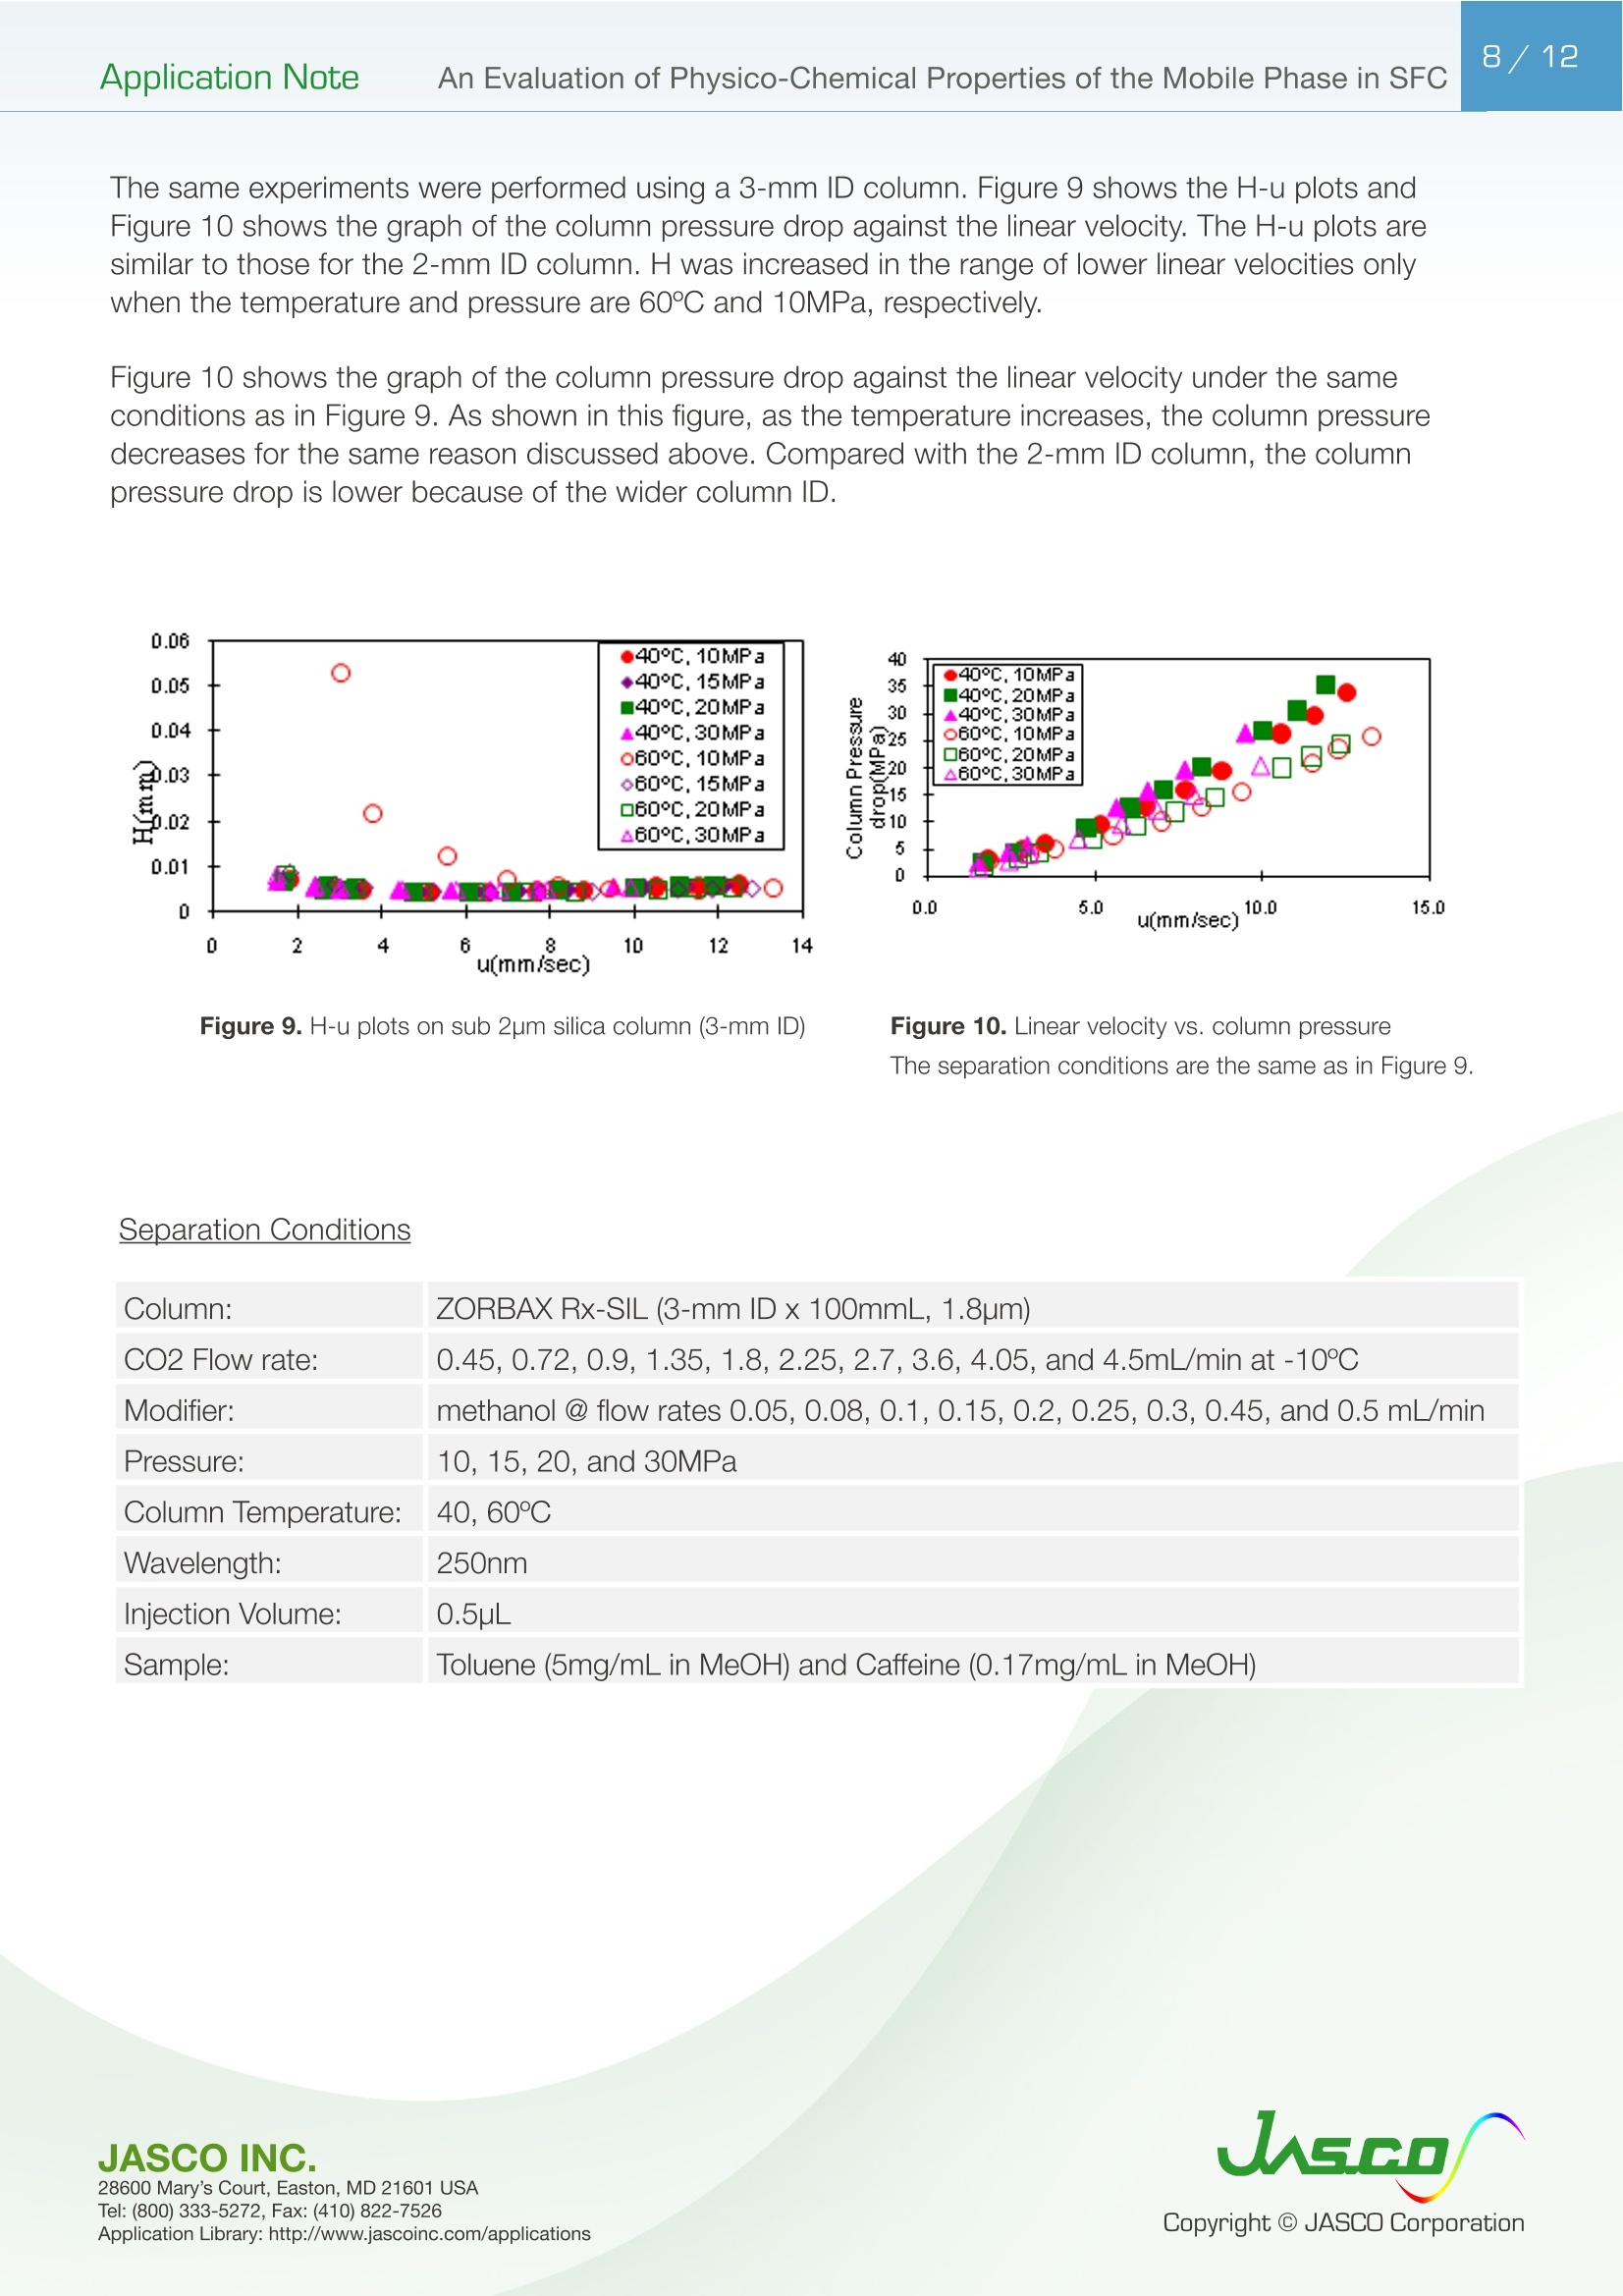
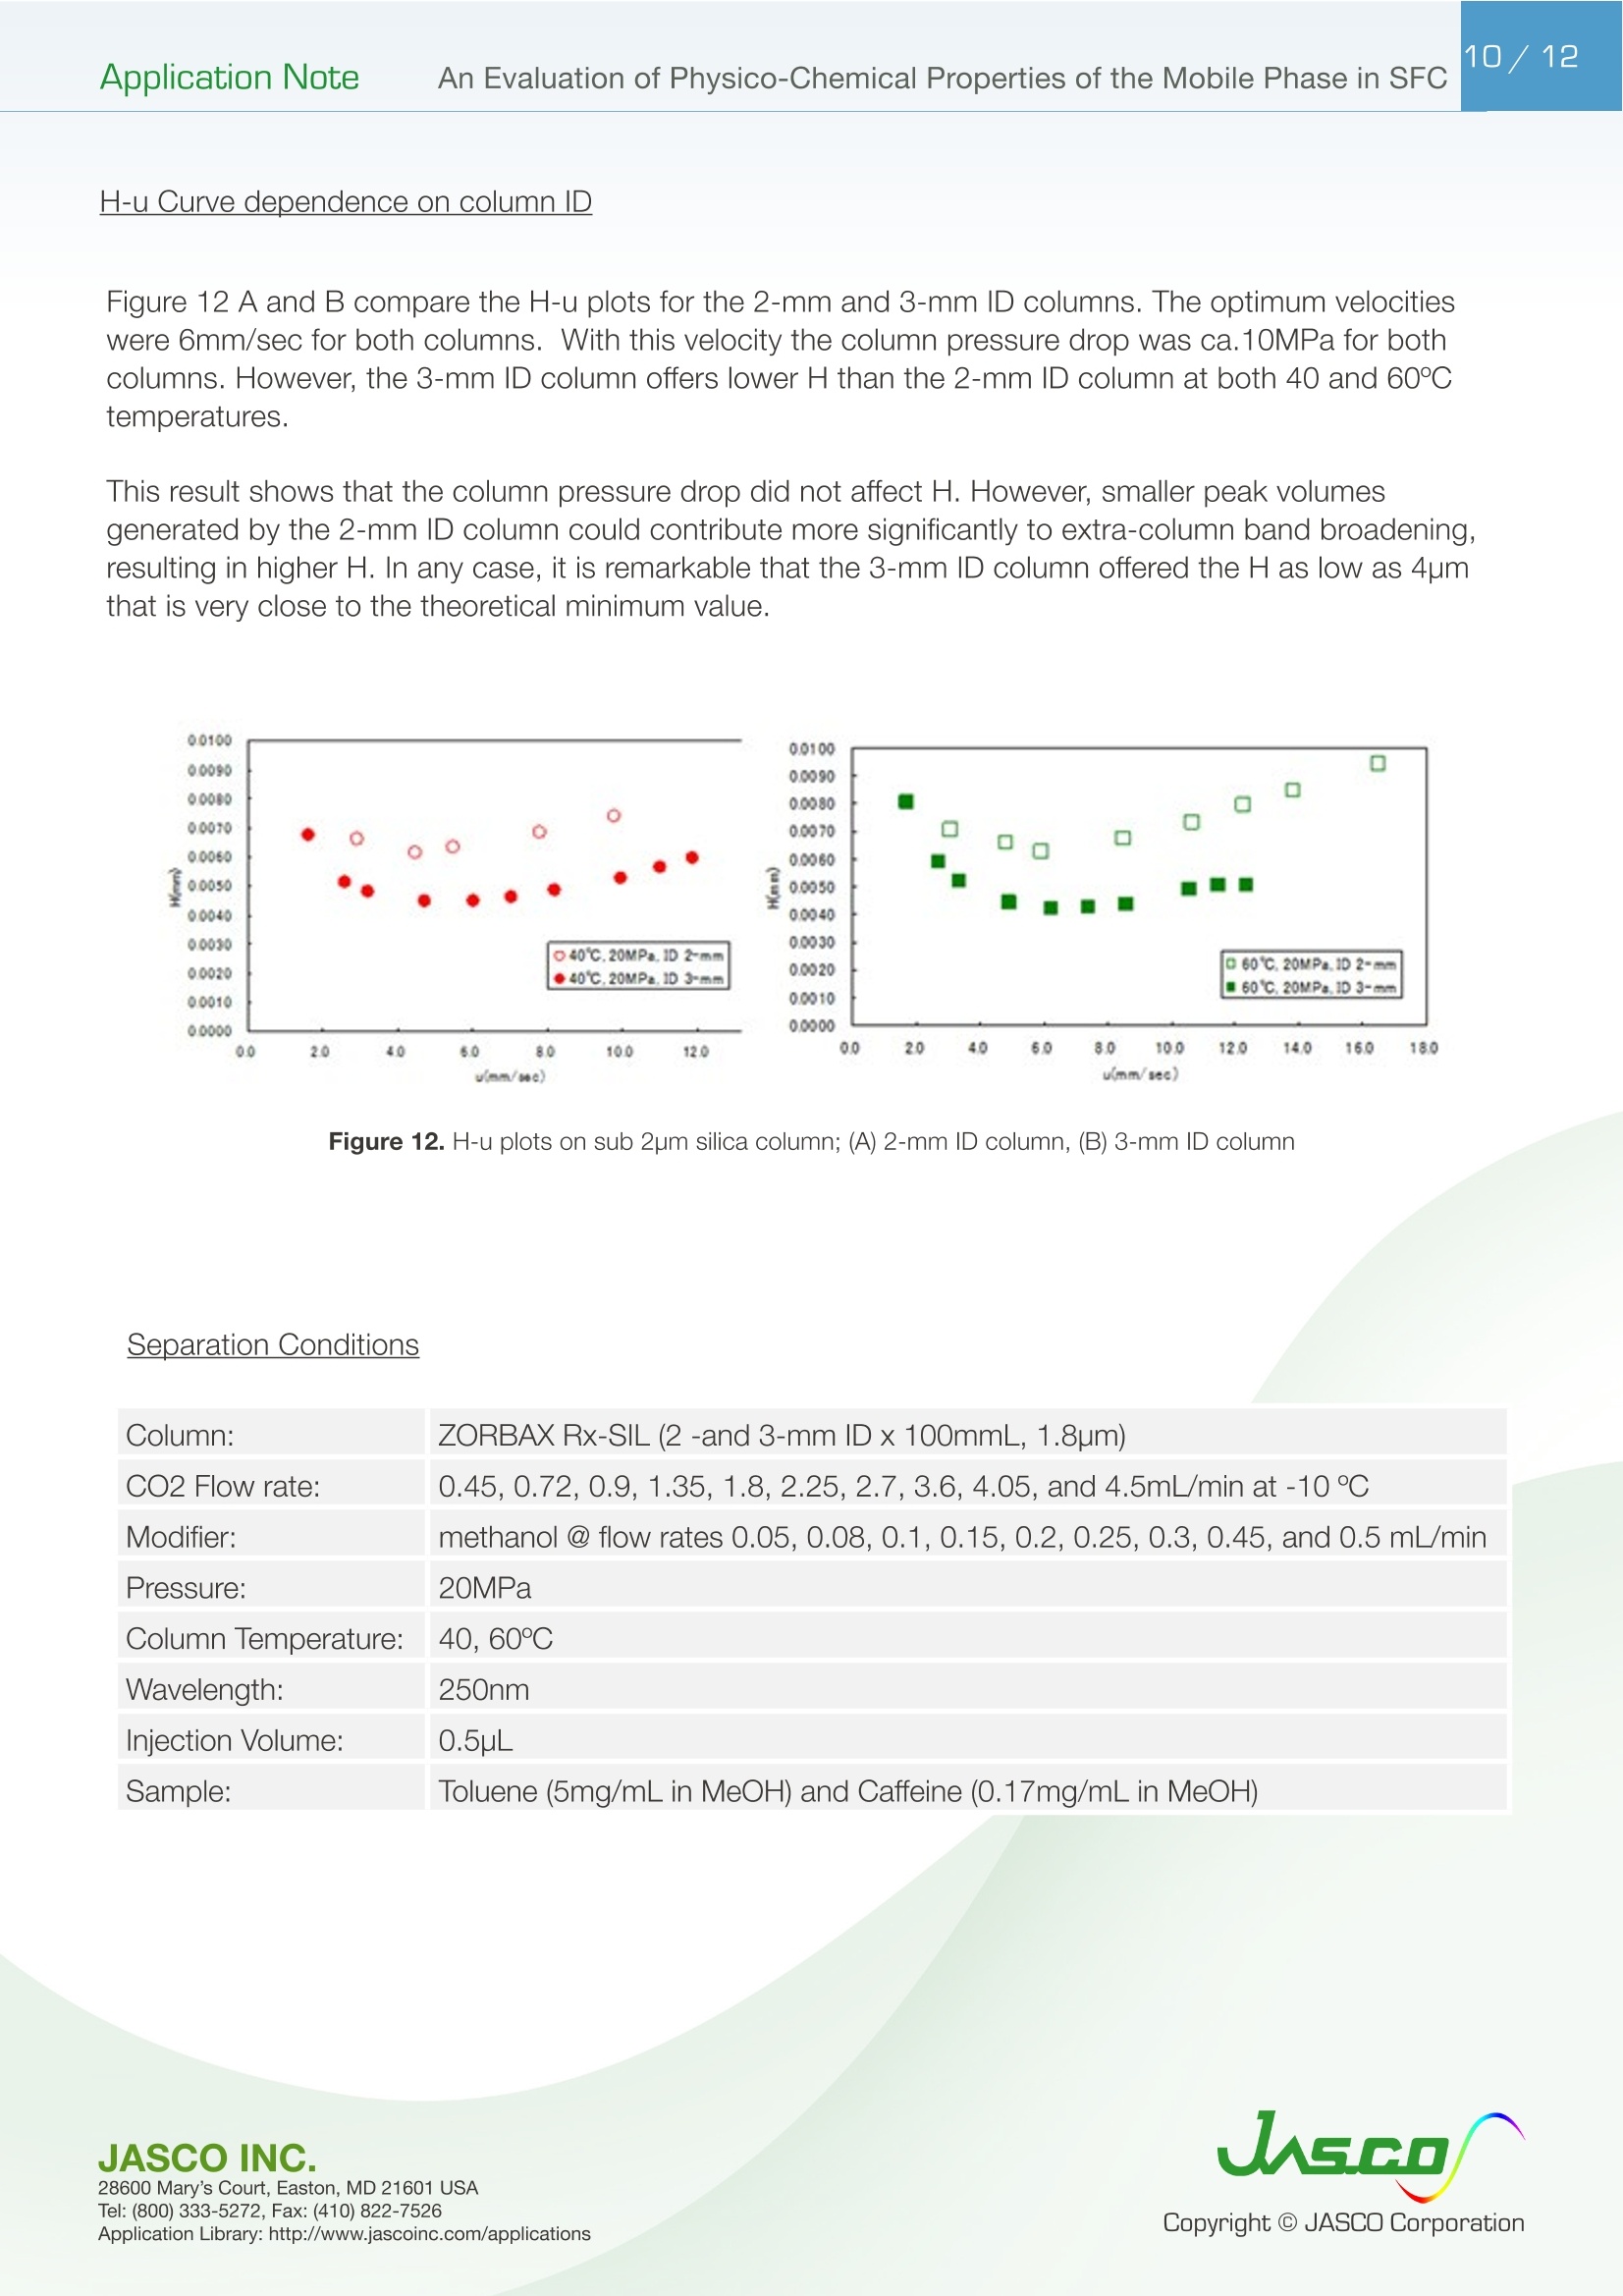
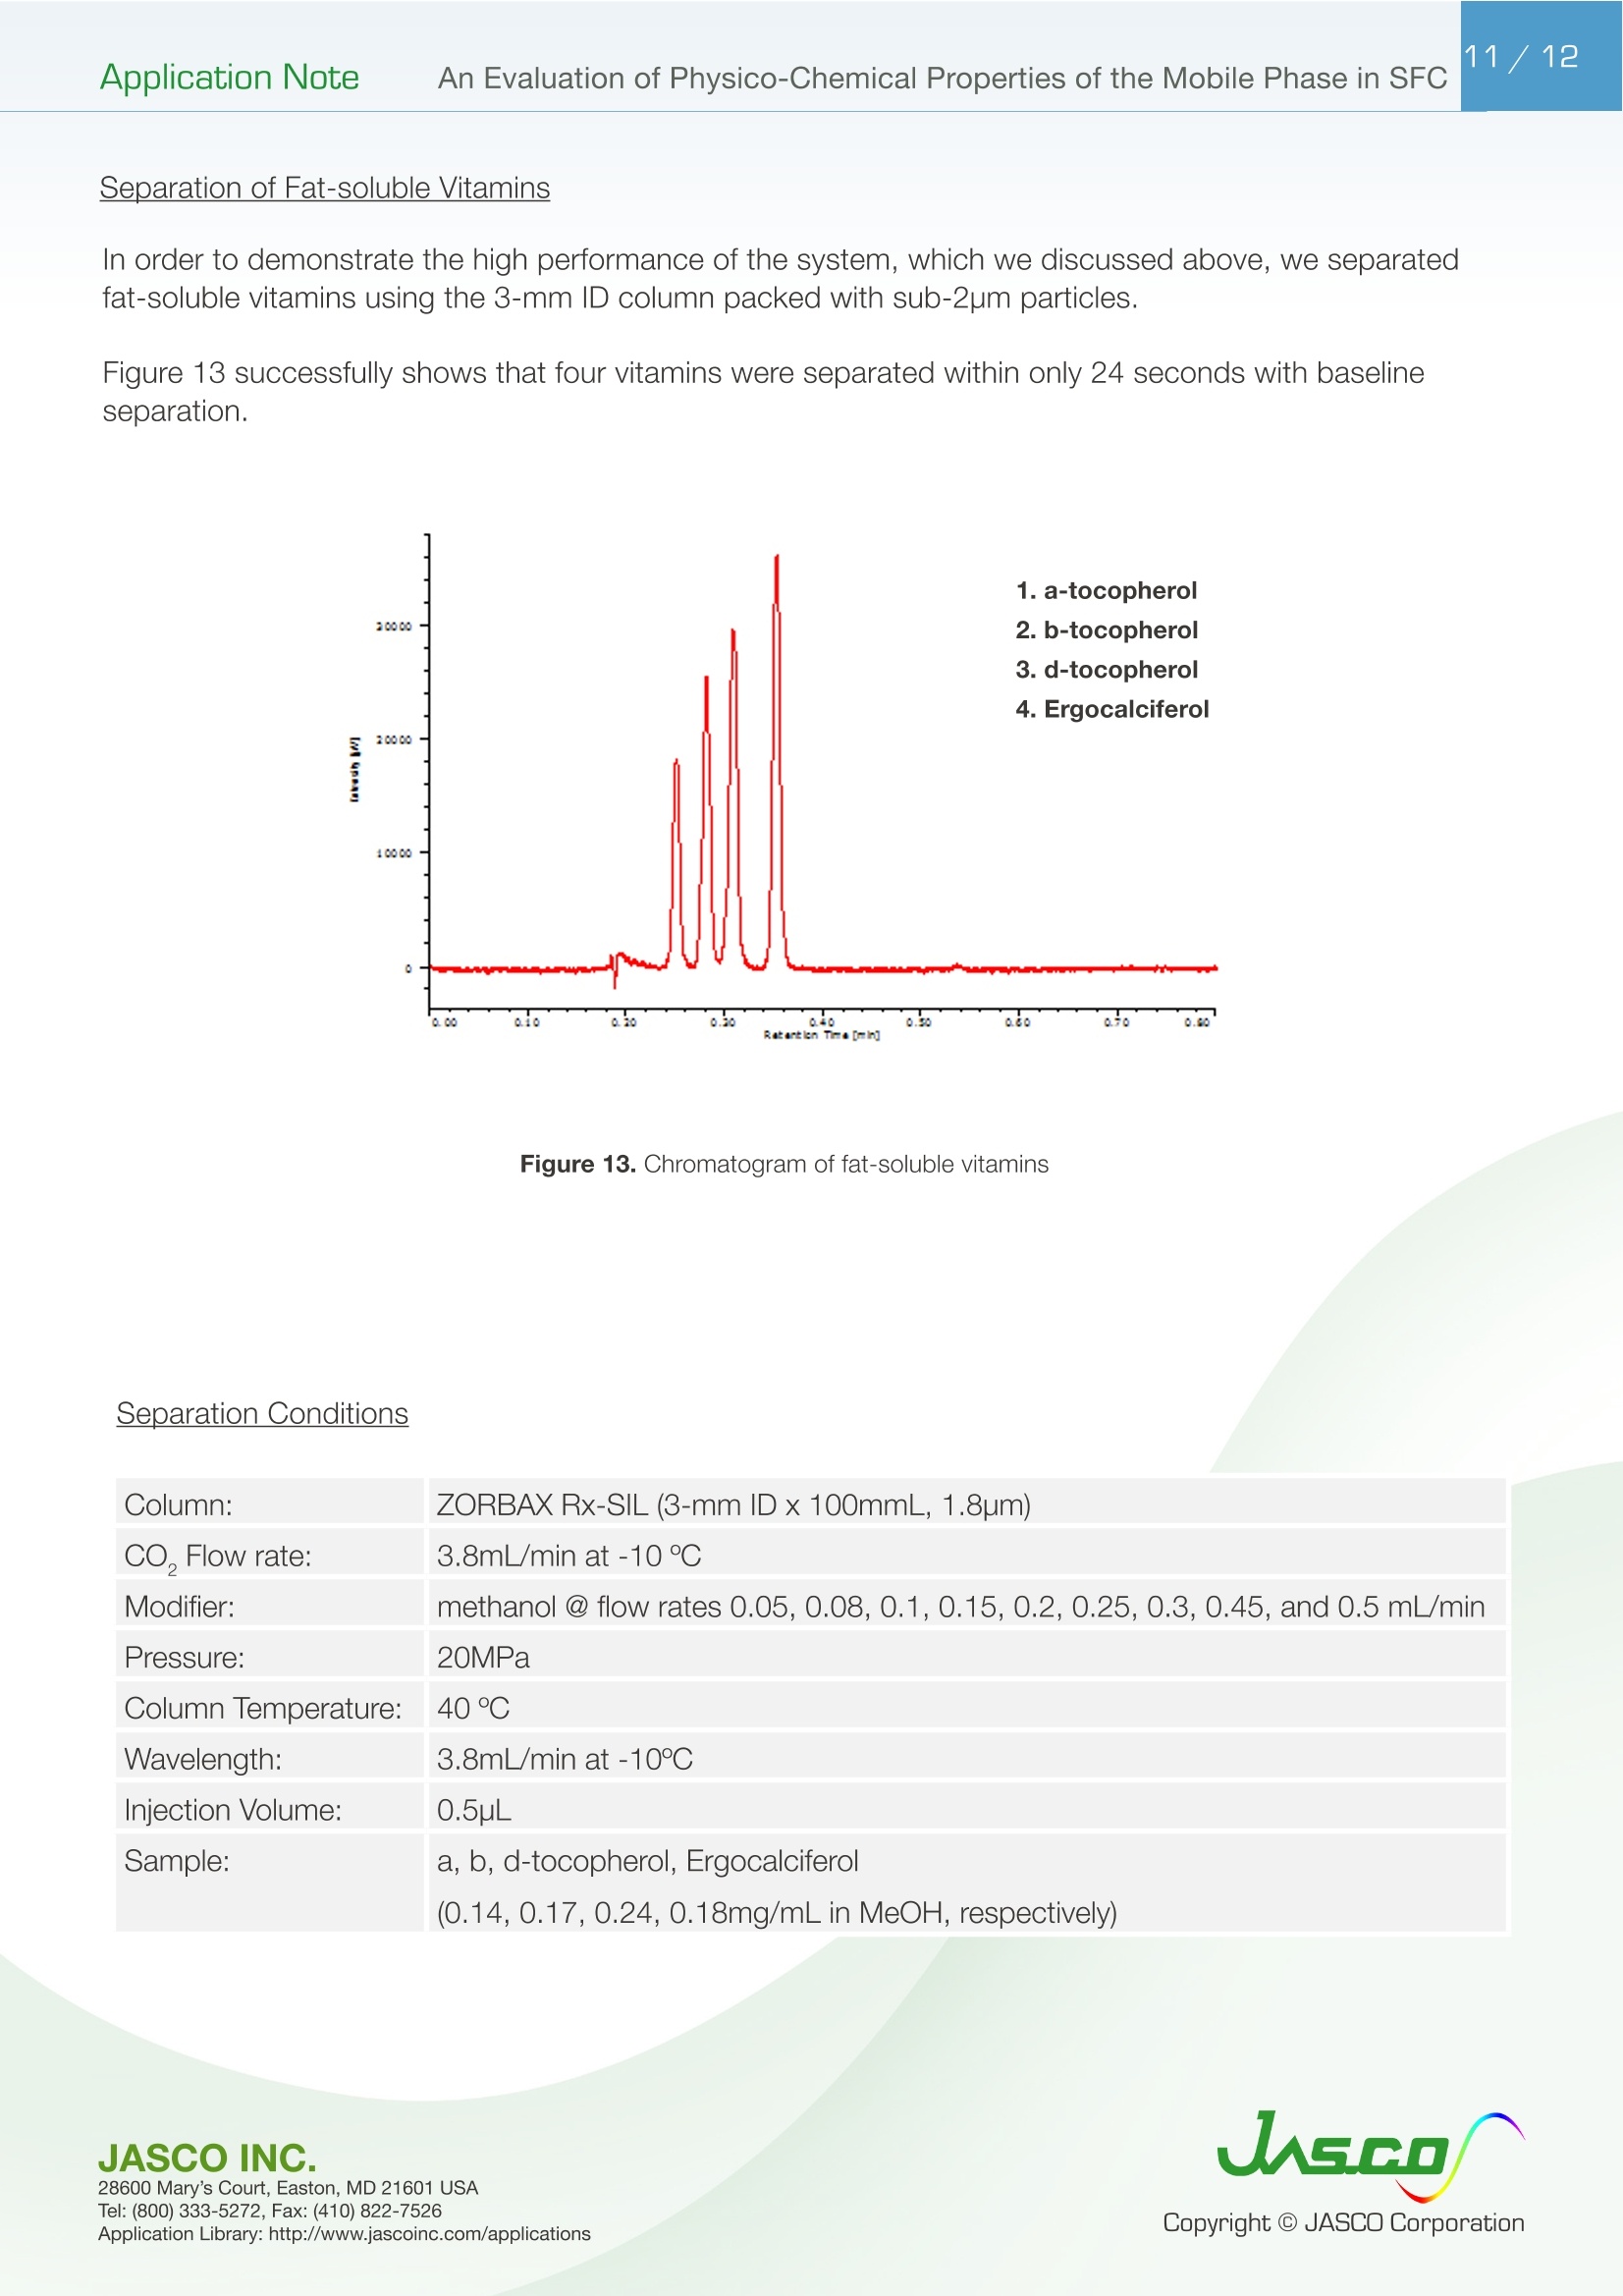
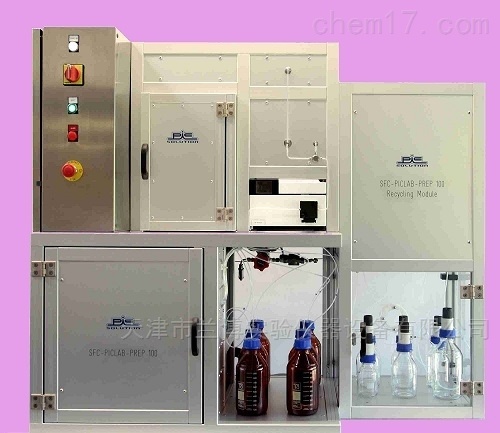
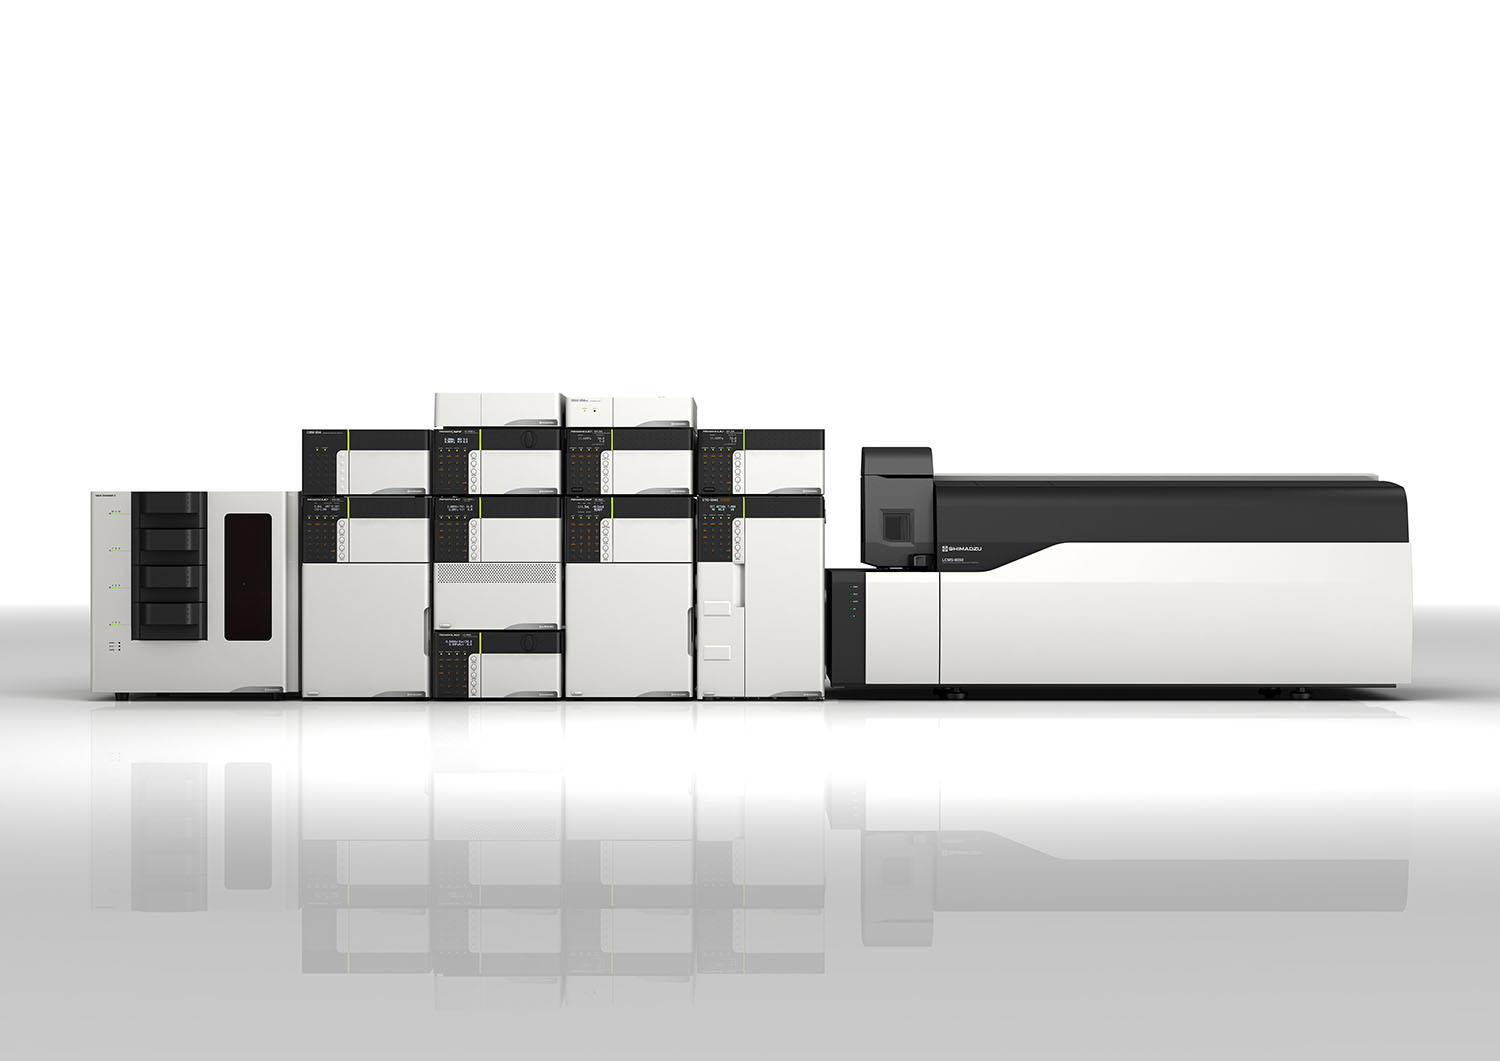
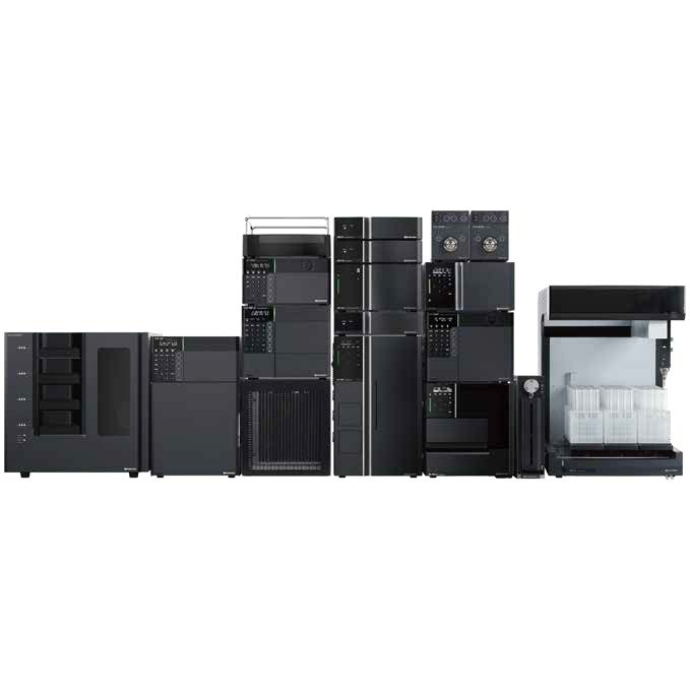
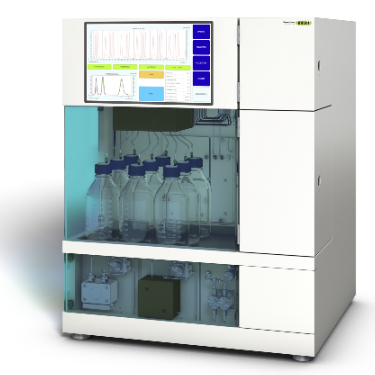
在超临界流体色谱(SFC)中,由于流动相的扩散系数很高,粘度很低,因此可以很容易地进行高速分析。最近,在高效液相色谱法(通常被称为超高效液相色谱仪(UHPLC))中,使用填充有低于2µm颗粒的柱进行高速分析而不牺牲柱效率变得很流行。如果SFC中使用填充有低于2µm颗粒的柱,则可以进行超高效超临界流体色谱(UHPSFC)。然而,在SFC中,人们普遍认为,使用低渗透性柱(如填充有低于2µm颗粒的柱)会导致柱效率差,这是因为整个柱的压降很大,沿着柱的长度产生了负密度梯度。如果实际洗脱条件处于超临界状态并且接近临界点,则这可能是真的。本应用中结论:1.今天的正常SFC条件下,CO2含有相对高浓度的有机改性剂,通常处于液态或亚临界状态。2.与SFC理论的遗留问题相反,这些条件不会降低亚2µm颗粒柱的柱效率,这会产生高的柱压降。3.如今的SFC色谱仪经常在不知道的情况下通过改变温度来改变色谱条件,从液体到超临界再到气相色谱,同时保持高于混合物临界压力的压力。4.对于SFC色谱仪来说,了解流动相混合物的关键参数对于控制洗脱行为是非常重要的。5.在24秒内分离出四种脂溶性维生素。Application Note 2/12Application NoteAn Evaluation of Physico-Chemical Properties of the Mobile Phase in SFC An Evaluation of Physico-Chemical Properties of the Mobile Phase in Supercritical Fluid Chromatography when using Sub-2um Particle Columns In Supercritical Fluid Chromatography (SFC), high speed analysi s can be performed easily because the diffusion coefficient of the m ob i le phase is very high and the viscosity is low. Recently, the use of columns packed with sub -2um partic l es has become popular to perform high speed analysis without sacrific i ng th e column e f ficiency in HPLC, often referred to as Ult r a High-Performance Liquid Chromatography (UHPLC). I f a column packed with sub-2pm par t icles is used in SFC, Ultra High-Performa n ce Supercritical Fluid Chromatography (UHPSFC)could be perfor m ed. However , in SFC, it is gene r allybe l ieved that the use of a low permeability column such a s those packed with sub-2um pa r ticles results i n poor column e f ficiency d u e to a large pressure drop across the column creat i ng a negative density gradient along the length of the column. This may be true if the actual elution conditions are in a supercritical state and close to the cr i tical point . Keyword: UHPSFC, Sub 2um, UHPLC, HPLC, SFC, Vitamins,Supercritical CO, density, Theoretical Plates, Van Deemter Plot Generally, a mixture of CO2 and an organic modif i er co-solvent, typically an alcohol is used as the mobile phase in SFC. The critical temperature and pressure for such a mixture is generally much higher than that for pure CO2, and the typical mobile phase used in ‘real world 'SFC is o f ten not in a supercritical st a te.Therefore, we have inves t igated the e f fect of several parameters such as temperature and pressure for the commonly used mobile phase mixture of CO2 and methanol and the impact on the H-u curve in UHPSFC. We f irst discuss f rom a theoretical point of view and then evaluate the experimental results by comparing them to the theoretical data. In addition, we evaluated high speed separation of fat -soluble vitamins by UHPSFC. Physical Proper t ies of CO2 and Methanol System and Vapor-liquid equilibria for CO2 and methanol system: I t is important to know the physical proper t ies of the CO2 and methanol mixture system that is used as a mobile phase . Figure 1 shows the experimental vapor -liquid equilibria data of CO2 and me t hanol mixture system at a temperature of 40 ℃ by Kodama e t al. The area enclosed by the measured data points shows the area that the mixture exists as two p hases; vapo r an d l iquid. The outside are a shows the area t hat the mixture exists a s one phase; liq u id or g a s or supercritical fluid. Generall y , in SFC a back pressure of 10MPa or higher is applied to t he column. At these pressures we can safely say that the mixture system is single phase. Figure 1. V ap o r-li q u i d e q uilibri a fo r t h e CO2 a nd Met h a n ol sy s tem at 40℃ Application Note Calculation of critical temperature and pressure of a mixture of CO2 and metha n ol : The cr i t i cal temperature and pressure of a mixture of CO2 and methanol can be calculated f rom the equa t ions proposed by Cheuh and Prausnit z 2). Saito and Nitta3 wrote a convenient computer program for the calculation of various mi xtures containing CO2 and organic solvents and compared the results with exper i mental data. The Kij va l ue was determined to be 0.2 according to the value proposed by Brunner 4). The coefficients, A, B, C, D, and E used i n the calculation were obtained from the reference 5);-0.0076,0.287, -1.343,5.443, and -3.038 respectivel y . The authors used the computer program to calculate the critical par a meters. Figure 2 shows a graph of the calculated cr i tica l temperature and pressure against the methanol mole fraction. As shown in this figure, the critical temperature elevates as the methanol mole fraction increases,while the crit i cal pressure exhibits a maximum value at the mole fraction of approximately 0.45. Table 1 lists several volumetric rat i os (90:10, 80:20, 70:30 and 50:50) of CO2 and methanol and corresponding methanol mole f ractions , cr i tical temperatures and pressures for the readers’co n venience.Even with a ratio of CO2 and methanol at 50:50 (considered a modifier rich condition,butoften used i n SFC)the cri t ical pressure is about 16MPa which is not an unusual pressure . However, the cri t ical temperature is 124°℃,which is outside of the normal temperature range used in SFC (a temperature lower than 60℃ is generally used). Under these conditions, t he mixture mobile phase is in the l i quid or subcr i tical state . Table 1. R ela t ionship be t ween CO2 and Meth a no l vo lum e r at i o a n d t he calc u la t ed c ri t i cal tem p erature and press ur e CO, Volume Ratio Methanol Methanol Critical Temperature Critical Pressure (MPa) Mole Fraction 90 10 0.07 51.13 10.46 80 20 0.12 64.91 12.22 70 30 0.20 85.92 14.37 50 50 0.36 124.37 16.54 Figure 2 Relat i onshi p b etwee n t he ca l c ul a t ed t emper a ture a n d pressure and t he m ole f r ac t i o n of CO2 and met h anol mix t u r e A p plicat i o n L i br a r y : htt p ://www.j as co i n c .c o m /ap p l i c a ti o n s Calculat i on of density of a mixture of CO2 and methanol: The density i n CO2 and methanol m ixture system can be calculated using t he Pseudo cub i c perturbed hard-sphere (PPHS) equations proposed by Kato e t al6). The a uthors wer e permitted by Dr. Kato to use his computer program to calculate the density of a mixture of CO2 and metha n ol at methanol mole f raction of 0.07. The Kij and lij values have not been measured. T herefore, we assumed these parameters to be zero . Figure 3 shows the relationship between the density and pressure calculated by the above method. As the pressure becomes higher , the density rapid l y increases. T his behavior is more significant when the fluid temperature i s higher . Thi s shows that the mobile phase state is transferred from gas to supe r cr i tical region when the pressure is increased at a higher temperature. In o t her words, t he chromatographer is changing the chromatographic conditions without knowing f r om liqui d to supercrit i cal to gas chromatography by changing the temperature while the pressure is maintained highe r than the mixture c r itical pressure. Figure 3. The ca l cu l ated den si t y o f a CO2 a n d methanol m ixt ur e (m o l e frac t i on =0.07) E xper imenta l Figure 4. UHPSFC System Figure 5. Schem a t i c of t h e U HPSFC Syst e m 1.CO,Cylinder 7.X-LCI M 3159AS Auto Sampler 2.Mo d i fi er So l vent 8.Co l umn 3.X -LC TM 3180PU with cooli n g j a c ket CO-2060 Colum n Oven CO , Delivery Pump X-LC TM 3075 UV Detec t or 4.X-LC TM 3185PU Modif i er Delivery Pumpwi t h hig h press u re cell 5.X-LC TM 3185HV Swit c h i ng Valve Un i tBP-2080 B ac k Pressure Regulator 6.MX-2080-32 Mixer ChromNAV Chromatography Data Stat i on A column, ZORBAX RX-SIL, 1.8pm, 2.1 mm I D x 100 mmL and 3.0 mm ID x 100 mmLwas purchased from Agilent Technologies , USA. Carbon dioxide (99.98%) was s u pplied by TOYOKO KAGAKU Co., Ltd, Kanagawa, Japan. HPLC-gra d e methanol used as a modifier solvent ; Caffeine , Toluene, and Ergocalcifero l (Vitamin D2) were purchased f r om Wako Pure Chemicals, Osaka, Japan. a, b, d-tocopherol (Vitamin E) were purchased from Eisai, Tokyo,Japan. Results and D iscuss i on V an De em ter Equa tion The Van Deemter equation is generally used to evaluate the e f ficiency of the column . The equation i s often expressed in a simplified form as equation (1). In SFC, DM is often more than 10 times higher than that for l iqui d solv e nts. Therefore, the Hmin value can be obtained at a higher u valu e , off e ring a h i gher speed of analysis than that in HPLC. However, slow mass transfer, stil l remains within the stat i onary phase which restricts the efficiency and the speed of the analysis . Thus, a smaller particle size a n d thinner stationary phase film thickness is preferable.Figure 6 illustrates the cont r ibution of each term in Equation (1) to H and u. In our exper i ment, the efficiency of a col u mn packed with sub-2pm part i cles was measured. H was calculated f rom the peak of caffeine and u was calculated by using the retention t ime of toluene as tO. Figure 6. The v a n D e e m ter cu r v e s h ow i n g t h e r e la t io n ship o f HE T P(H) vs. Li n ea r velocity Figure 7 shows the measured H-u plots for a 2-mm ID column. Unless otherwise noted, the pressures shown i n al l f igures are column outlet pressures applied by the back-pressure regulator. As shown i n this figure, H increases i n the range of lower l inear velocities only when the temperature and pressure is at 60℃and 10MPa, respectively. Under these conditions, the d e nsity is calcu l ated to be 0.5g/cm3 from the PPHS equat i o n s, and the chroma t ogr a phy behave s like ga s chromatog r aphy or t raditional supercritical f luid chromatography (pure CO2 mobile phase at re l atively hi g h temperatures); H increases at lower u ca u sed by higher longi t udi n al diffusio n of the sample solute in the mobile phase. When t he density i s increased to 0.7g/cm3 or more by elevating the pressure or lowering the temperature,the behavior tends toward s liquid chromatography because the solvating power depends on the density. It should be n oted that dens i ty d e pends not only on th e pressure but also on the tempe r atur e . Figure 8 shows the column pressure drop exhibited in the exper i ment of H-u plots discussed above. As shown i n the f igure, when the temperature is high, the col u mn pressure drop is low because both the v i scos i ty and density are low. T O Figure 7. H-u pl ots fo r su b 2pm si li ca c o l um n (2-m m ID) Figure 8. Li n ea r ve l oc i ty vs. co l um n pr essure The s e pa r at i on co n di t ions a r e t he s a me as in Figure 7 Separation Conditions Column: ZORBAX Rx-SIL (2-mm IDx100mmL , 1.8pm) CO2 Flow rate: 0.45,0.72, 0.9, 1.35,1.8,2.25,2.7,3.6,4.05, and 4.5mL/min at -10℃Modifier: methanol @ flow rates 0.05, 0.08,0.1,0.15,0.2,0.25,0.3,0.45, and 0.5 m L/min Pressure: 10, 20, and 30MPa Col u mn Temperature: 40, 60°℃Wavelength: 250nm Injection Volume: 0.5pL Sample: Toluene (5mg/mL) and Caffeine (0.17mg/mL) The same exper i ments were performed us i ng a 3-mm ID column. Figure 9 shows the H-u plots and Figure 10 shows the graph of t he column pressure drop against the l inear velocity. The H-u plots are similar to those for the 2-mm ID column. H was i ncreased in the range of lower linear veloci ti es only when the temperature and pressure are 60℃ and 10MPa, r espectively. Figur e 10 s hows the graph of the column pressur e drop against the linear velocity under the same conditi o ns as in Figure 9. As shown in this f igure, as t he temperature i ncreases, the column pressure decreases for the same reason discussed above. Compared with the 2-mm ID column, the column pressure drop is lower because of the wider column ID. Figure 9. H-u p lots on su b 2pm si li ca col u m n (3-m m I D ) Sample: Column: ZORBAX Rx-SIL (3-mm IDx100mmL,1.8um)CO2 Flow rate: 0.45,0.72,0.9,1.35,1.8,2.25,2.7,3.6,4.05, and 4.5mL/mi n at -10℃Modi f ier: methanol @ f l ow rates 0.05, 0.08,0.1,0.15,0.2,0.25,0.3, 0.45, a n d 0.5 mL/mi n Pressure: 10, 15, 20, a n d 30MPa Column Temperature: 40,60℃Wavelength: 250nm Injection Vo l ume: 0.5uL Toluene (5mg/mL in MeOH) and Caffeine (0.17mg/mL in MeOH) H -u plot s d ep e n d en c e on temperature Figure 11 shows the H-u plot depending on temperature. As the temperature was increased, the optimum velocity shifts to the higher velocity region, and H itse l f becomes smaller. That is because as the temperature i ncreases, the v i scosity decreases. Under the conditions of 60℃ an d 20MPa, which gave a column pressure drop of ca . 10MPa , th e minimum p late he i ght wa s about 4um, which is very close to the theoretical minimum value , proving th a t the overall chromatographic system is perform i ng extreme l y efficient l y. F i gure 11. H -u pl ots dependin g o n the t emperature Separation Conditions Column: ZORBAX Rx -SIL (3-mm IDx100mmL, 1.8pm) CO2 Flow rate: 0.45,0.72,0.9,1.35,1.8,2.25,2.7,3.6,4.05, a n d 4.5mL/min at-10℃Modifier : methanol @ f low rates 0.05, 0.08,0.1,0.15,0.2,0.25,0.3,0.45, and 0.5 mL/min Pressure: 20MPa Co l umn Temperature : 40, 60°℃Wavelength: 250nm Injection Volume: 0.5pL Sample: Toluene (5mg/mL in MeOH) and Caffeine (0.17mg/mL i n MeOH) H -u Cu rve dependen c e o n co l um n ID F i gure 12 A a n d B compare t he H-u plots for the 2-mm and 3-mm ID columns. The opt i mum velocities were 6mm/sec for bo t h columns. With this veloc i ty t he column pressure drop was ca .10MPa for both columns . However, the 3-mm ID column offers lower H than the 2-mm ID column at both 40 and 60℃temperatures. This resul t shows that the column pressure drop did not affect H. However, smal l er peak volumes generated by the 2-mm ID column could contribute more signi f icantly to extra -column band broadening,resulting in h i gher H. In any case, it is r emarkable that the 3-mm ID co l umn offered the H a s low as 4pm that is very close to the theoretical m inimum value. Figure 12. H-u p l ots on s ub 2p m s ili ca c o lu mn ; (A ) 2-mm I D co lu mn , (B) 3-m m I D col um n Separation Conditions Column: ZORBAX Rx -SIL (2 -and 3-mm IDx100mmL, 1.8um)CO2 Flow rate : 0.45,0.72,0.9,1.35,1.8,2.25,2.7,3.6, 4.05, and 4.5mL/m i n at -10℃Modi f ier : methanol @ f low rates 0.05, 0.08,0.1,0.15,0.2,0.25,0.3, 0.45, and 0.5 mL/m in Pressure: 20MPa Column Temperature: 40, 60℃Wavelength: 250nm Injection Volume: 0.5pL Sample: Toluene (5mg/mL in MeOH) and Caffeine (0.17mg/mL in MeOH) S eparation of Fat-solub l e Vitamins In order to demonstrate the high performance of the system, which we discussed above, we separated fat-soluble vitamins using the 3-mm ID column packed with sub-2um par t i cles. Figure 13 success f ully shows that four vitamins were separated within only 24 seconds with baseline separati o n. Figure 13. Chromato g r am of fa t-sol ub l e v i tam in s Separation Conditions Column: ZORBAX Rx-SIL (3-mm IDx100mmL, 1.8pm) CO, Flow rate: 3.8mL/mi n at -10°℃Modifier: methanol @ flow rates 0.05, 0.08,0.1,0.15,0.2,0.25,0.3,0.45, and 0.5 mL/min Pressure: 20MPa Column Temperature: 40℃Wavelength: 3.8mL/min at-10℃Injection Volume: 0.5pL Sample: a, b, d-tocopherol , Ergocalciferol (0.14,0.17,0.24, 0.18mg/mL in MeOH, respective l y) Co n c l us i ons 1. Today 's normal SFC conditions with CO2 contai n ing a rel a t i vely high- concentration of organic modifier are often i n the liquid or subcrit i cal state. 2. Contrary to the legacy of SFC theory, these conditions do n o t deteriorate the column efficiency of sub-2pm particle co l umns which give a high column pressure drop. 3. The SFC chromatographer today is often changing the chromatographic condit i ons without knowing from liquid to supercrit i cal to gas chromatography by changing the temperature while the pressure i s kep t higher t han the mixture critical pressure. 4. It is very i m portant for SFC chromatographers to know the critical parameters of a mobile phase mixture in order to control the elution behavior. 5. Four fat-soluble vitamins were separated within only 24 sec. Refer e nce 1) D. Kodama , N. Kubota, Y. Yamaki, H. Tanaka, M. Kato, NetsuBussei , 10, 16-20 (1996) 2) P. L. Cheuh and J . M. Prausnitz , AlChE J . 13, 1107 (1967) 3) E. Brunner, J . Chem. Thermodyn. 17, 671(1985) 4) M. Saito, T. Nitt a in M. Saito, Y. Yamauchi and T . Okuyama e ds:“Fractionation by Packed-Column SFC and SFE”, VCH Publishers, Inc. Chapter 2 (1994), New York. 5) C. C. Li, Can. J. Chem. Eng. 19,709 (1971) 6) M. Kato, M, Y amaguchi, T . Kiuchi, Fluid Phase Equilibria, 47,171-187 (1989)
确定


还剩10页未读,是否继续阅读?

产品配置单

佳士科商贸有限公司为您提供《使用亚2µm颗粒柱时,超临界流体色谱流动相的物理化学财产评估》,该方案主要用于其他中流动相检测,参考标准--,《使用亚2µm颗粒柱时,超临界流体色谱流动相的物理化学财产评估》用到的仪器有JASCO SFC4000超临界流体色谱仪
推荐专场

相关方案
更多
该厂商其他方案
更多