


方案详情
文
口感属性是评价红茶品质和等级的重要指标。本研究创造性地提出了基于电子舌系统的蚁群优化算法和化学计量学相结合的工夫红茶品质评价方法。
方案详情

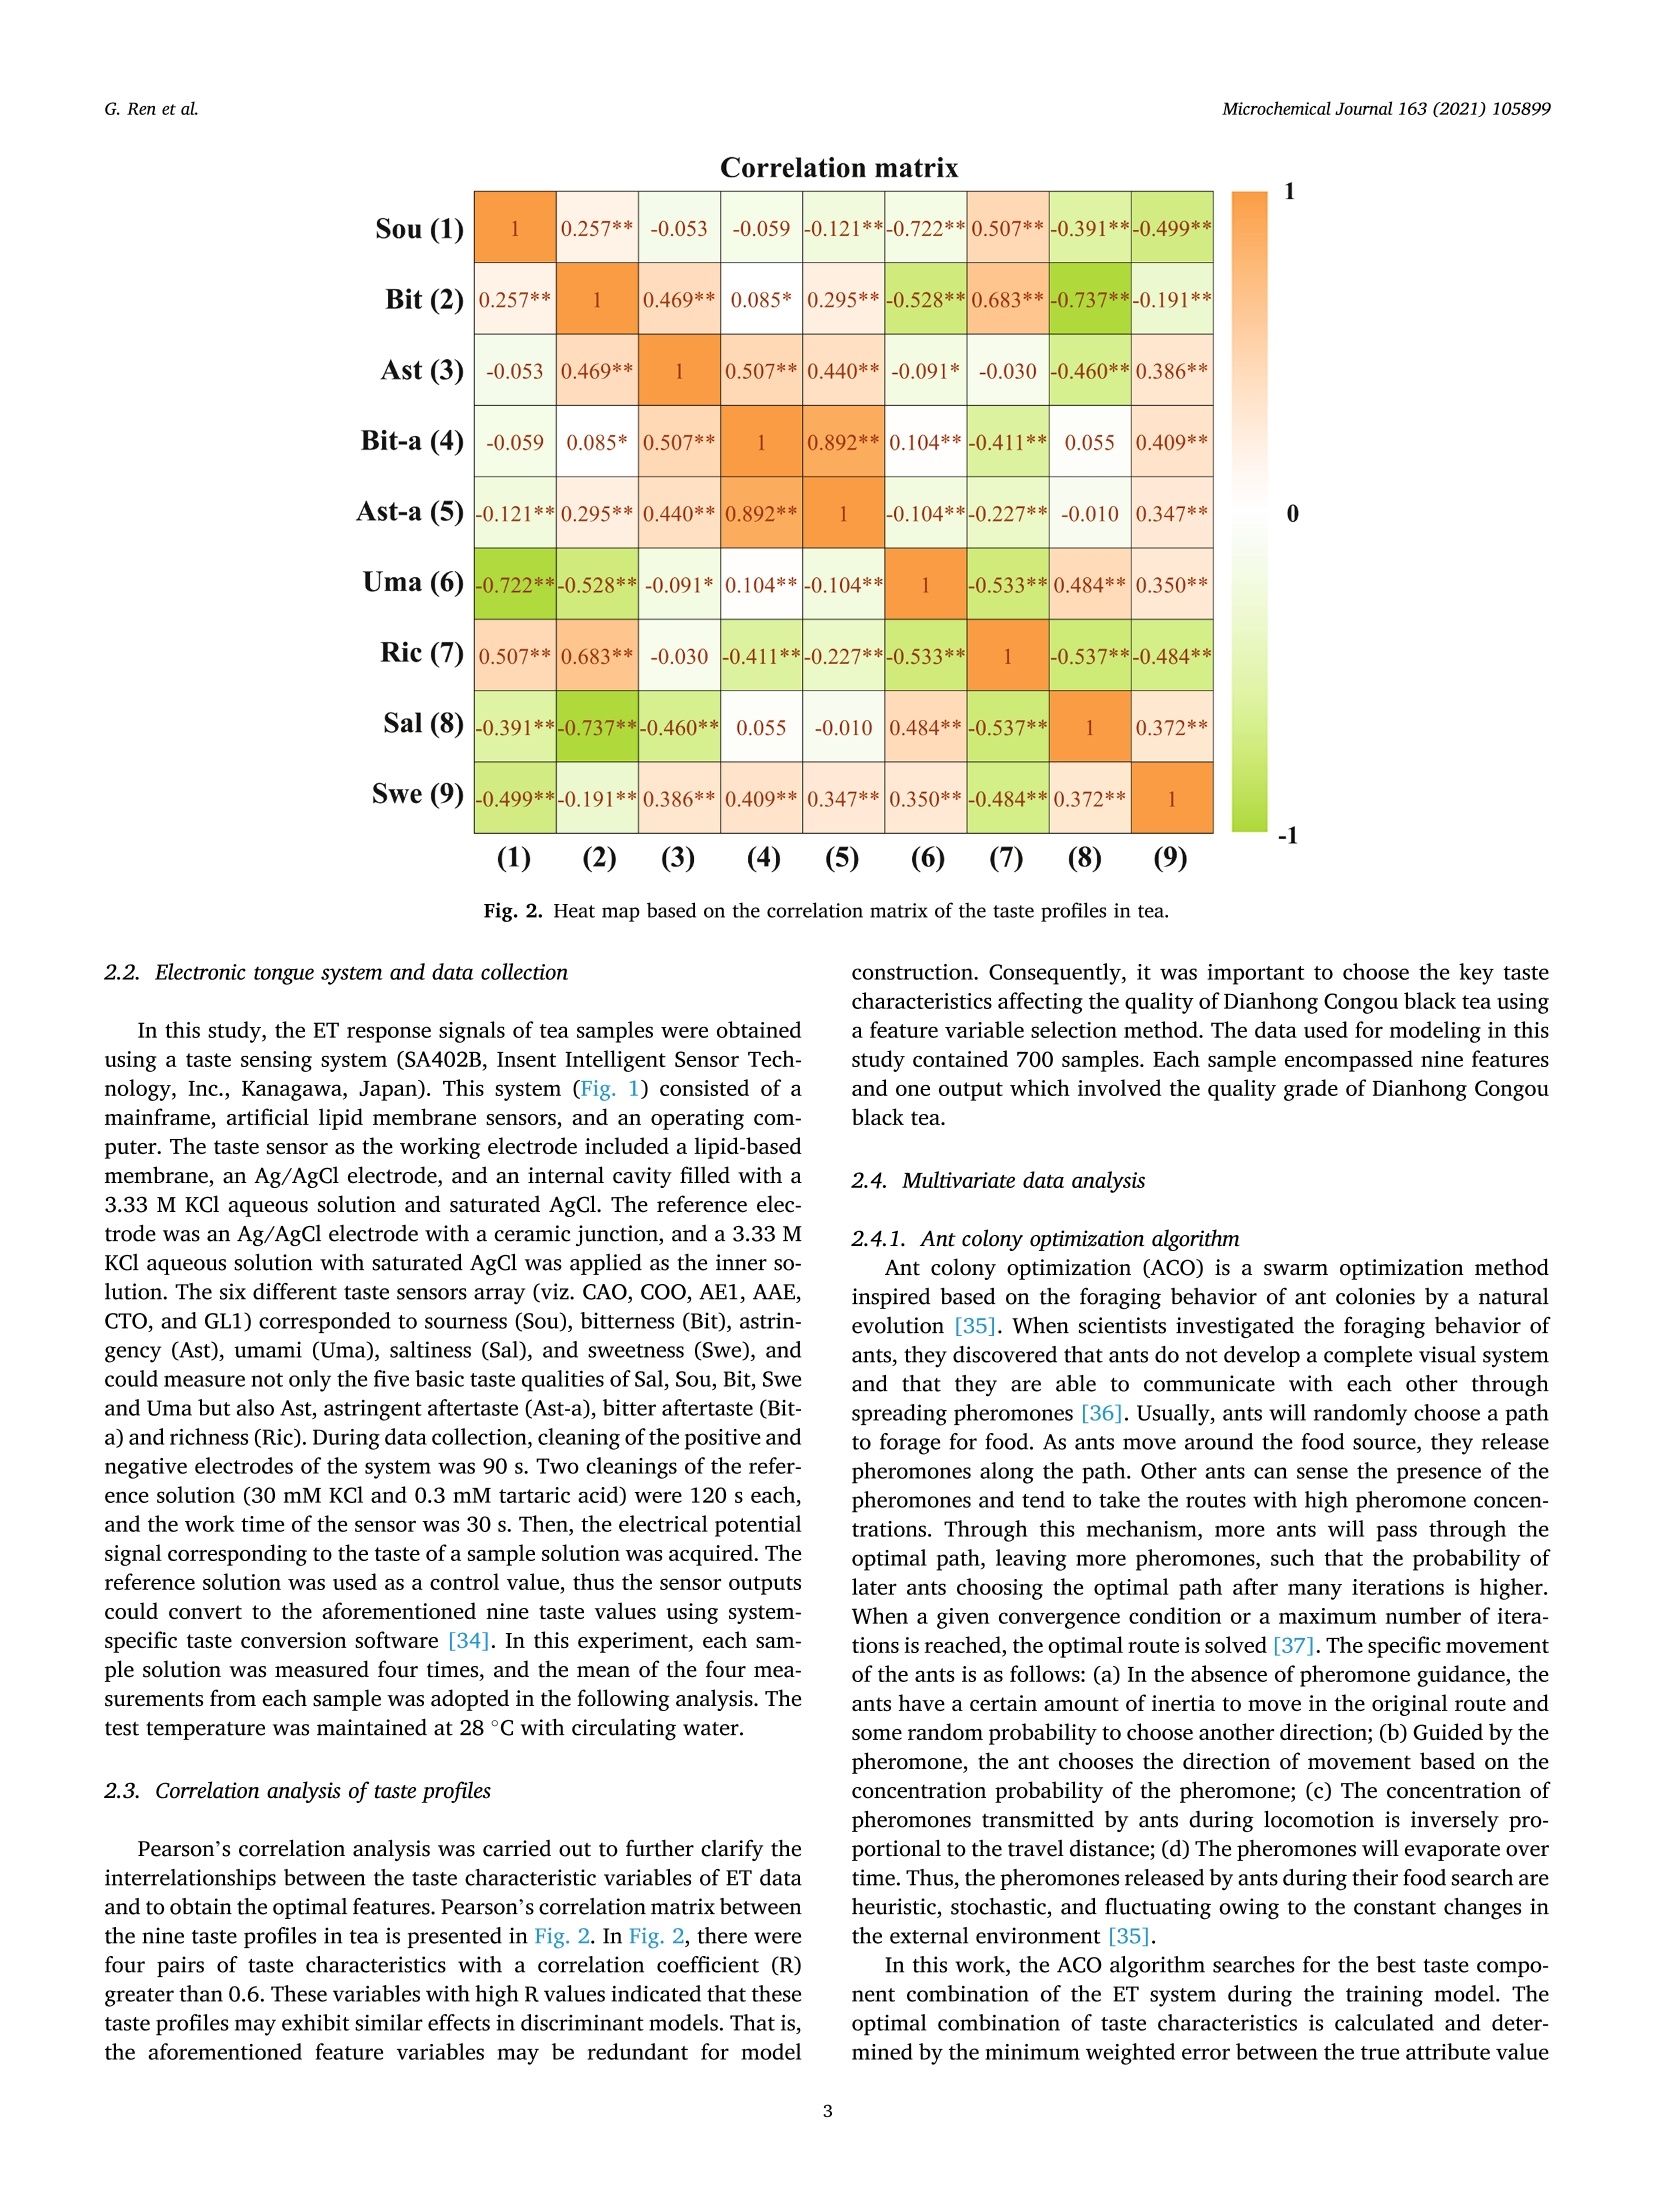
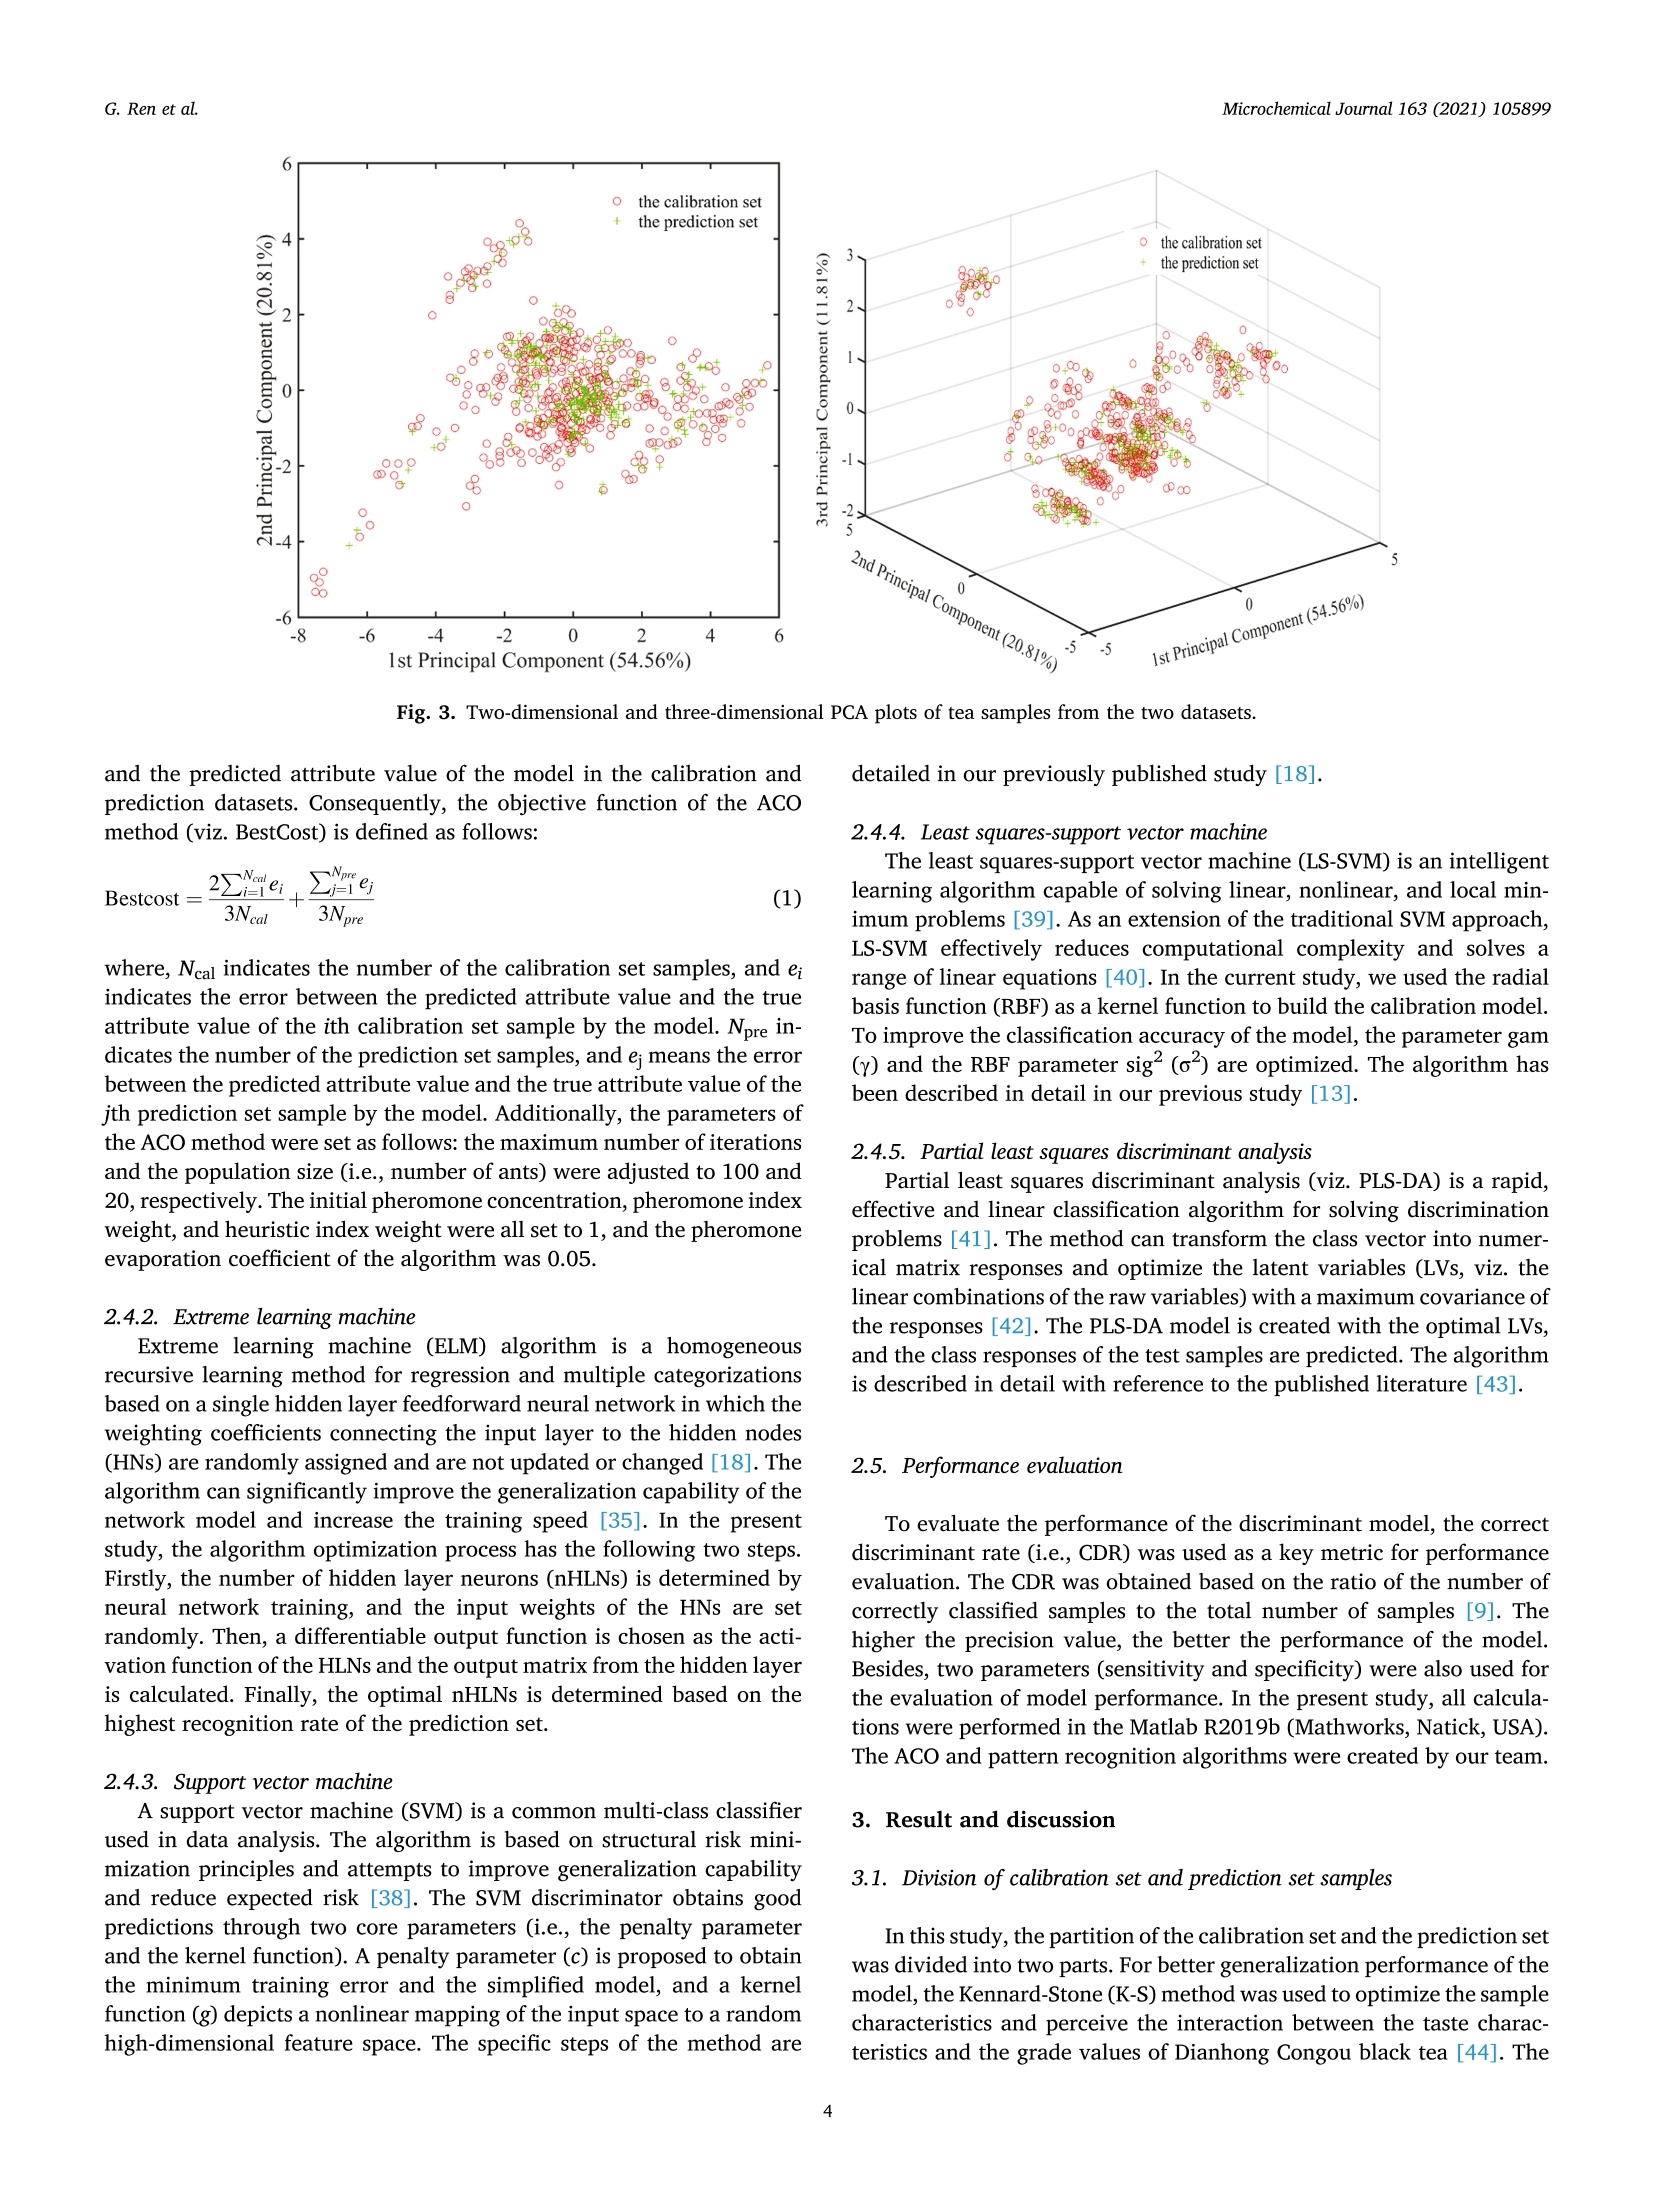
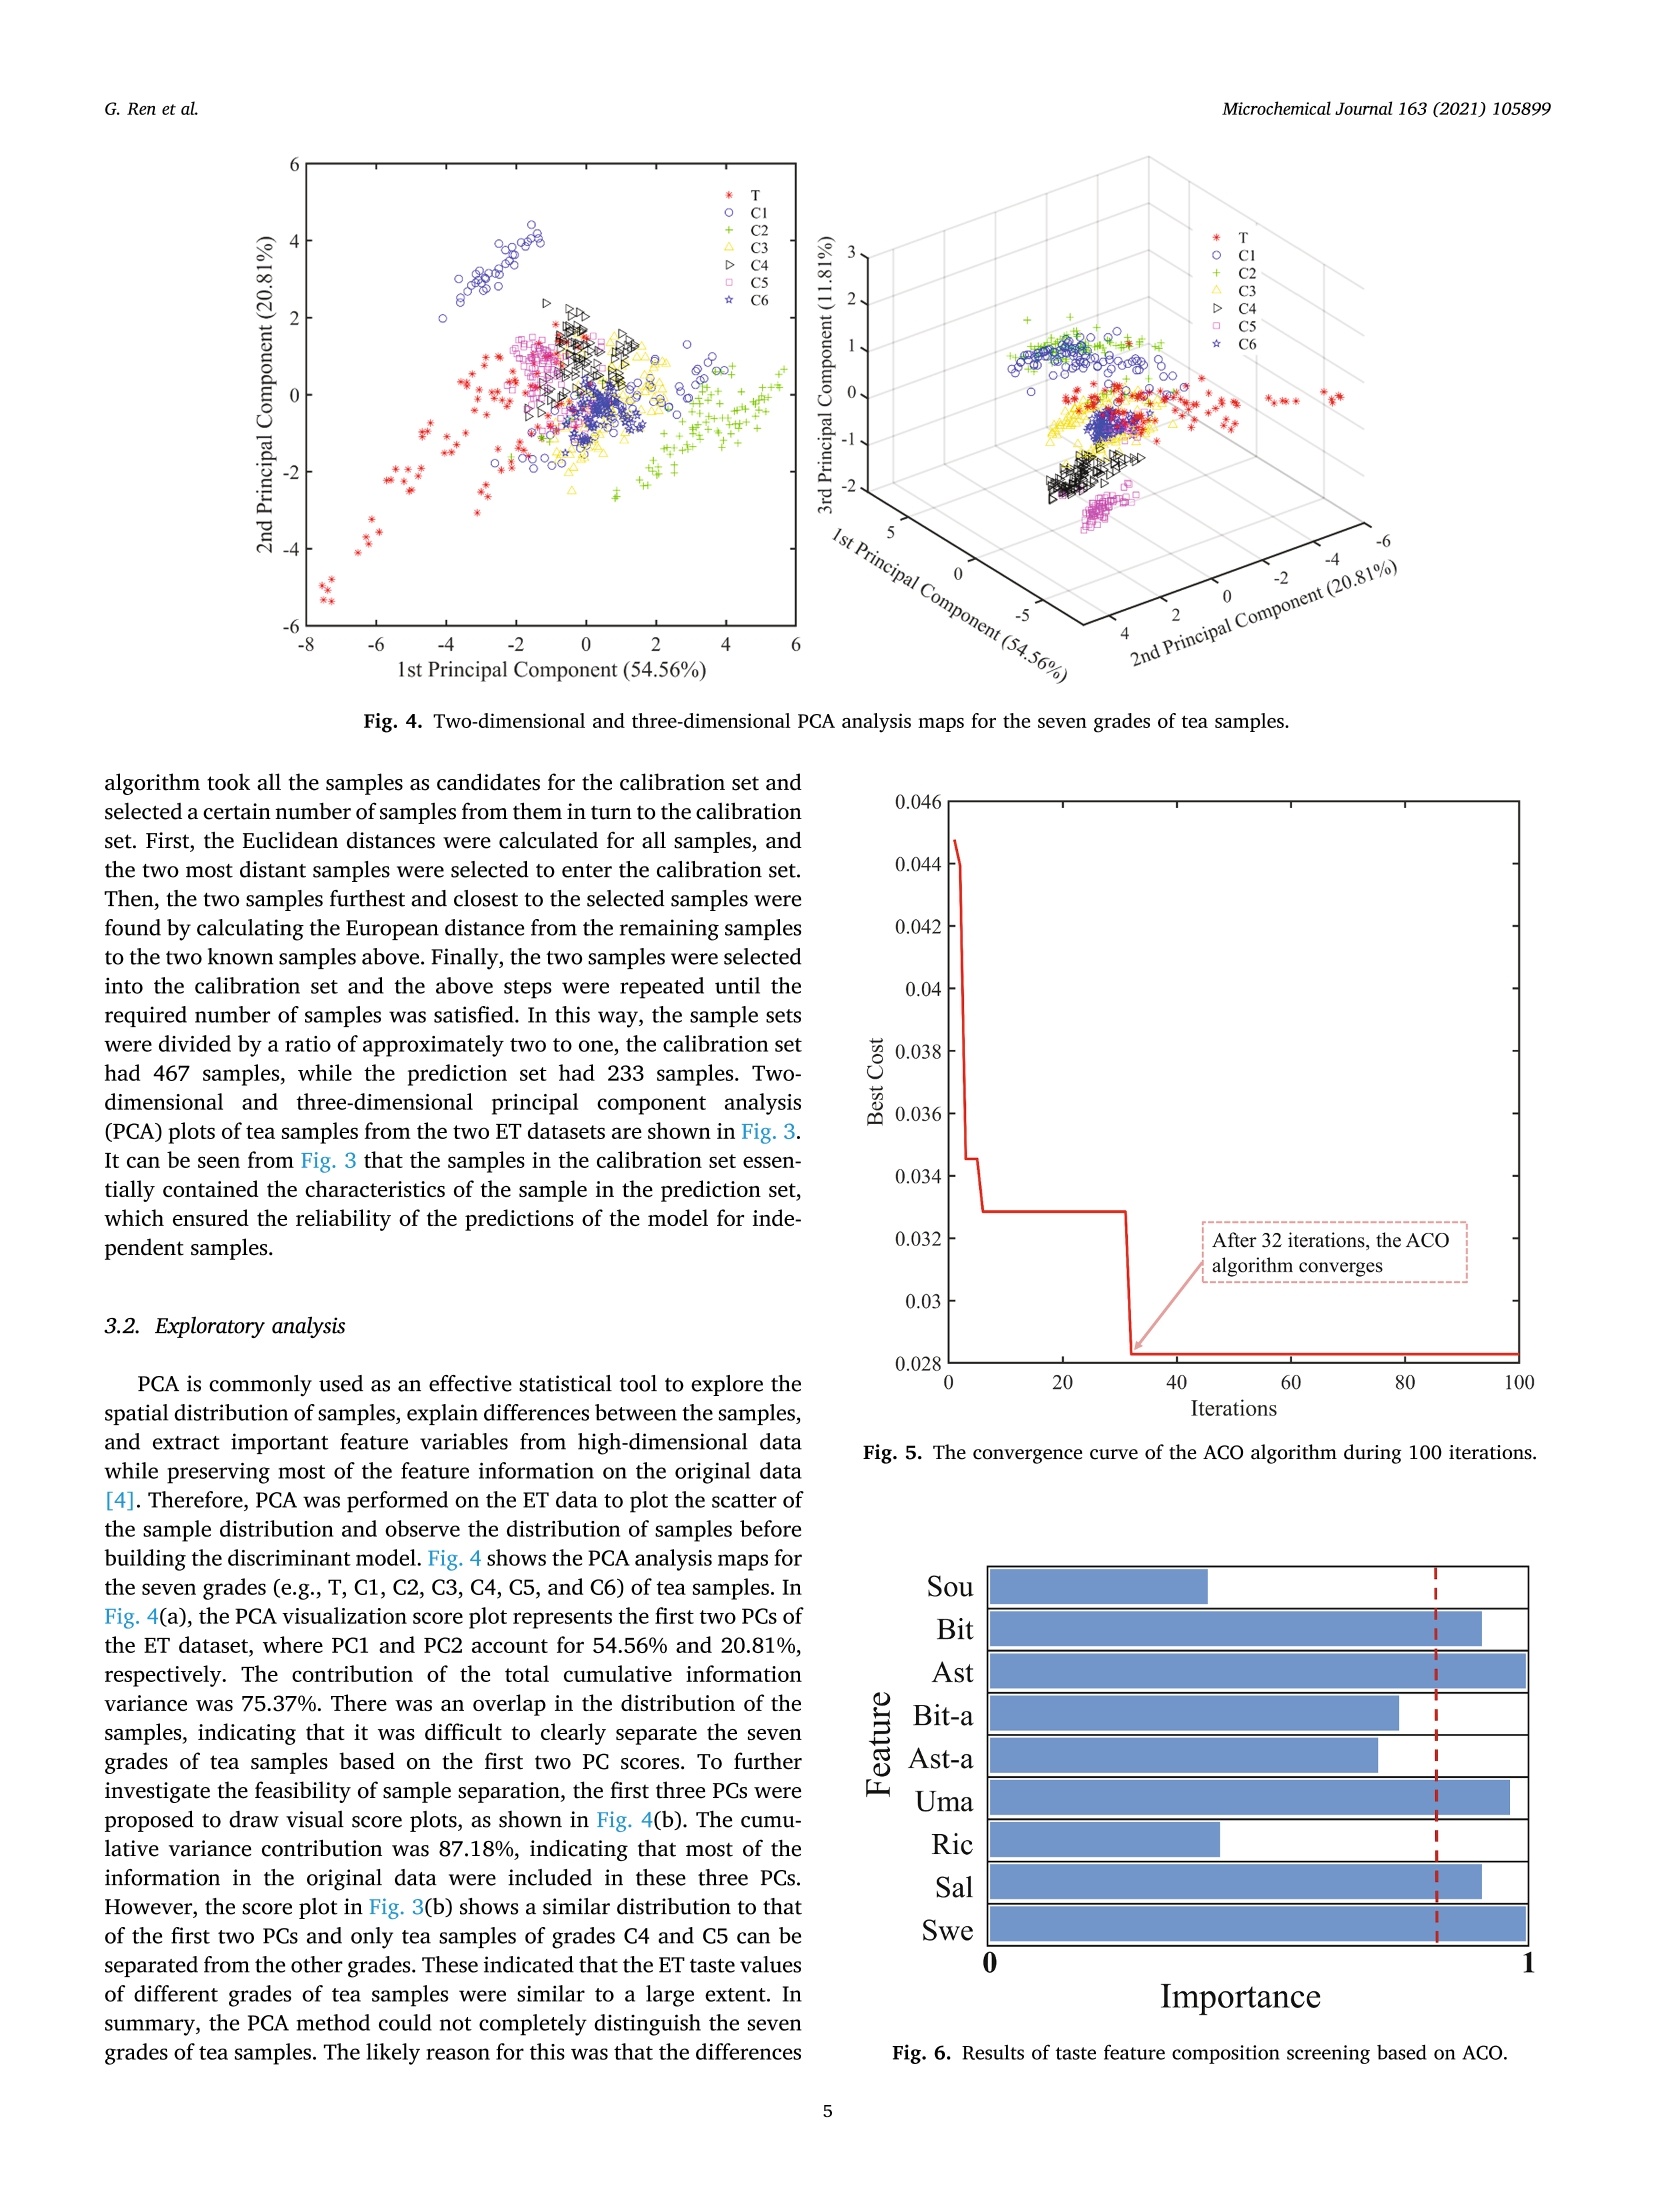
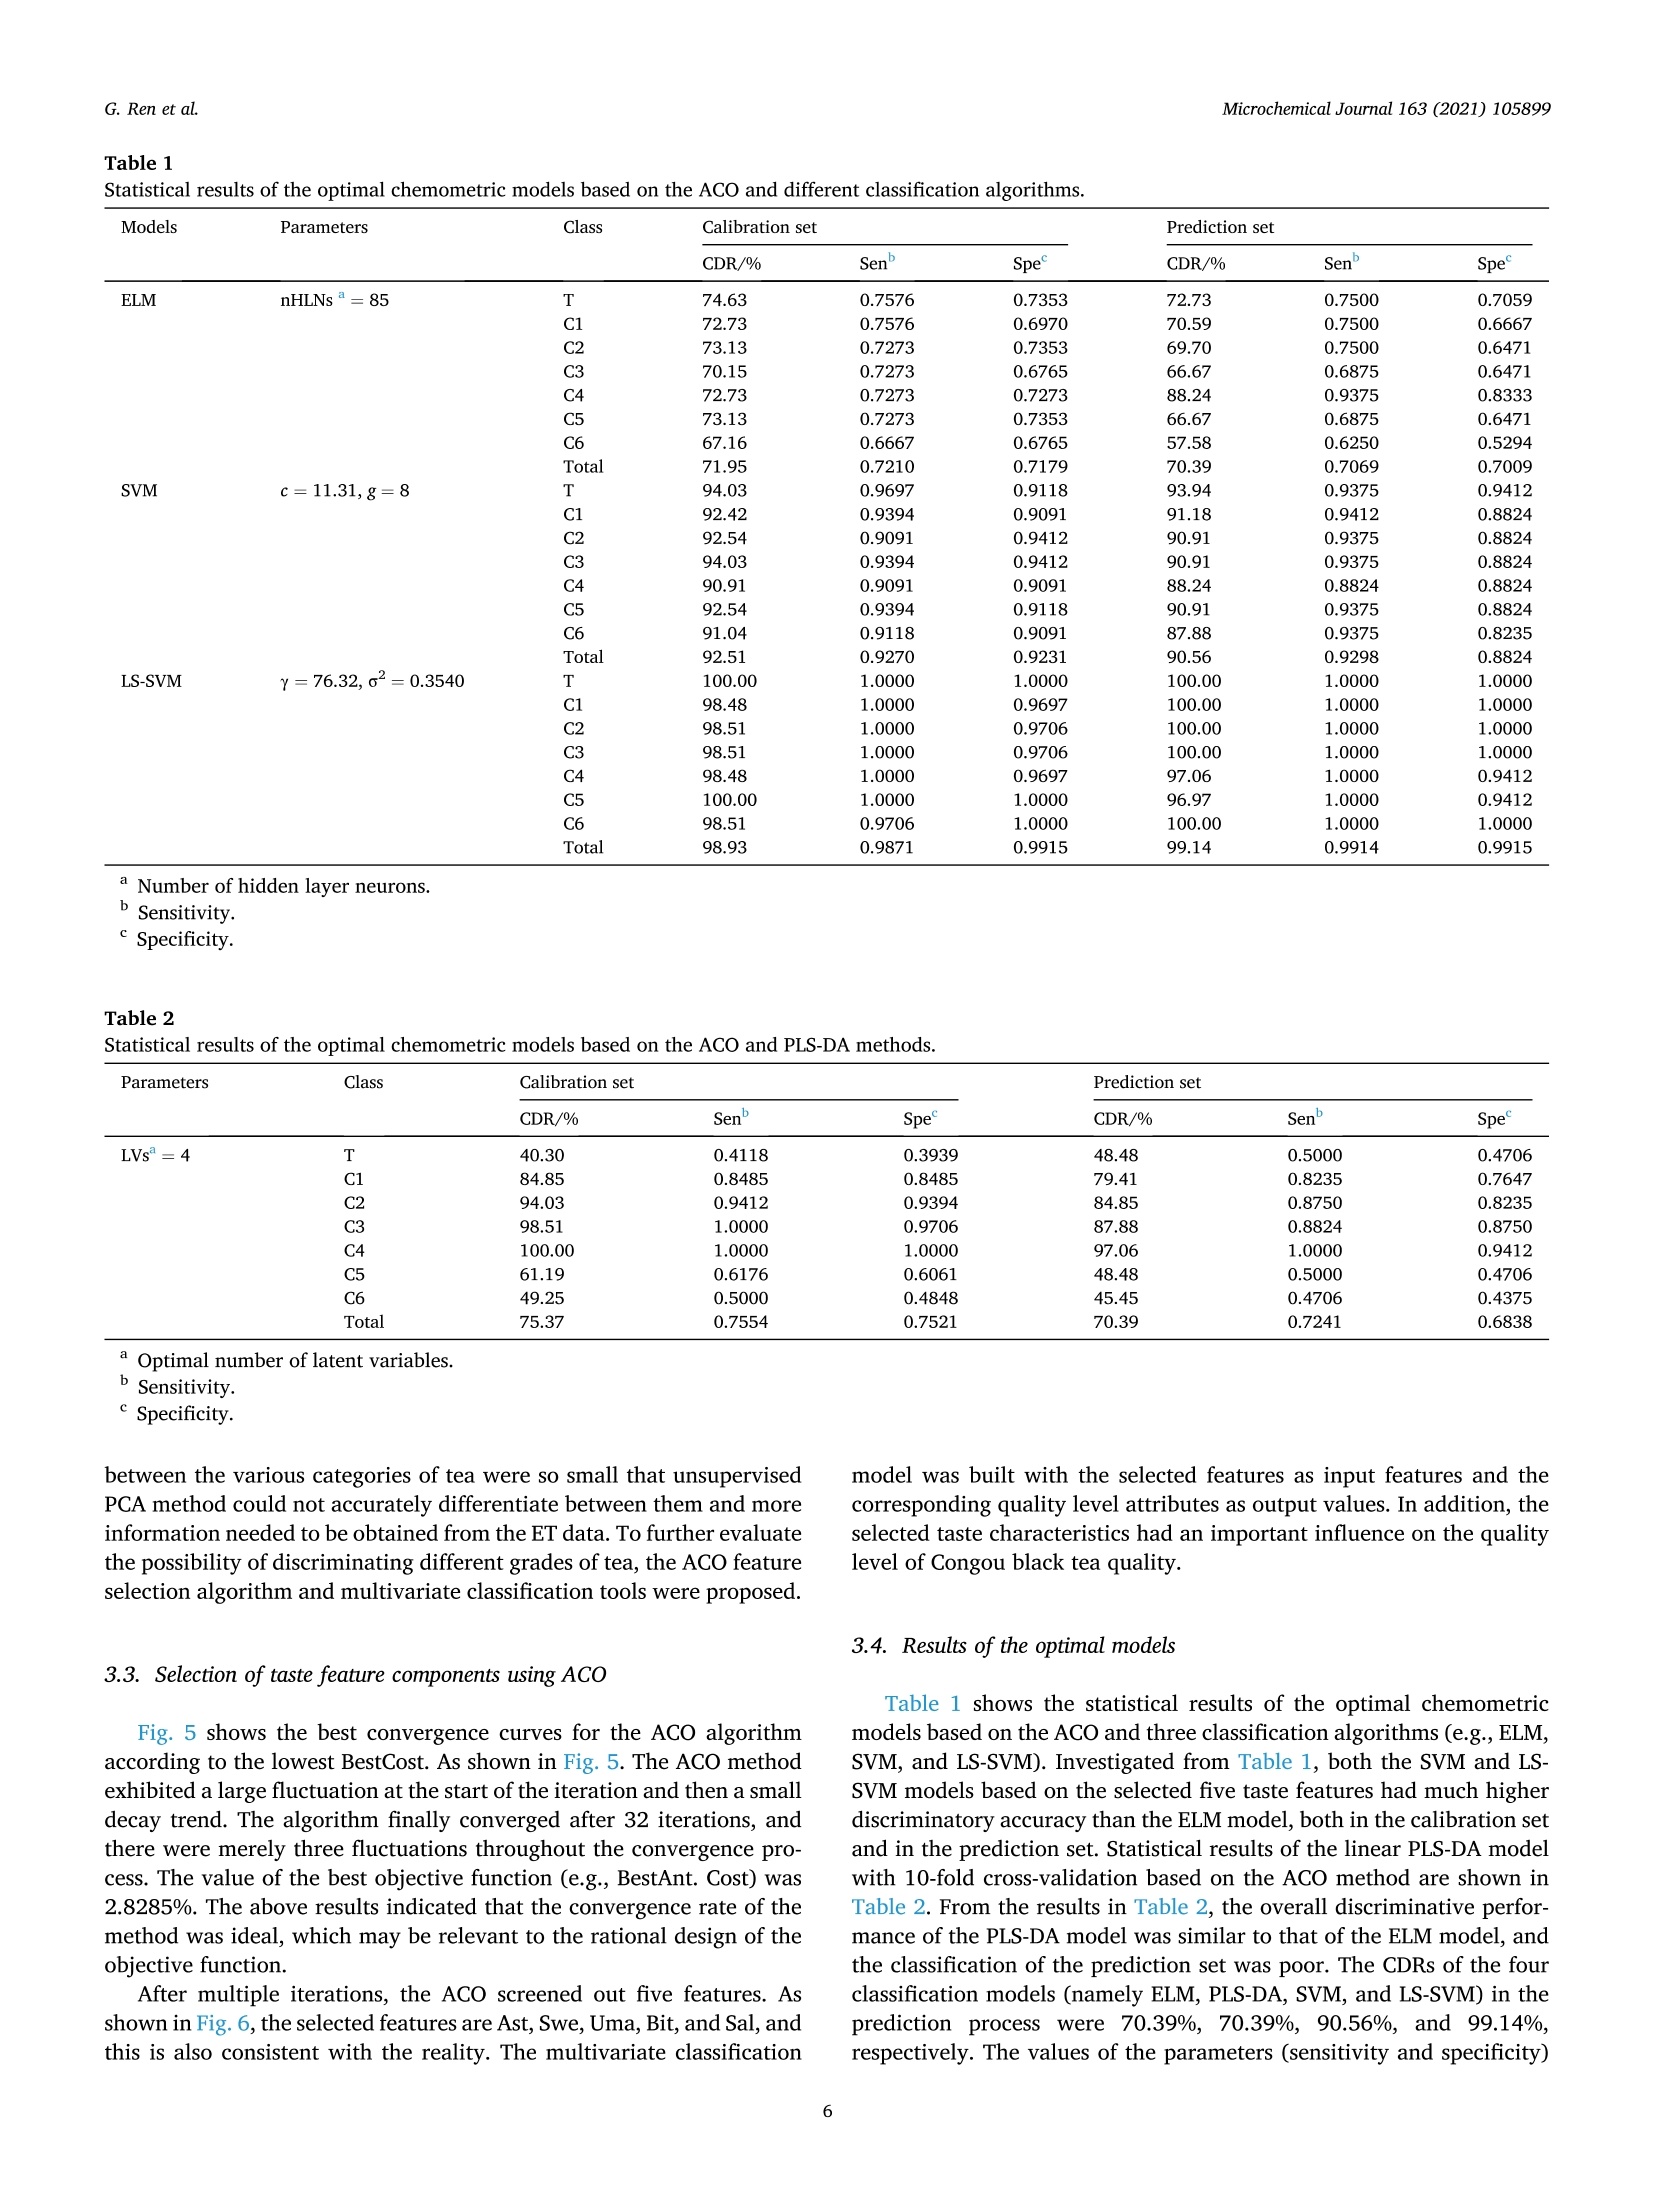
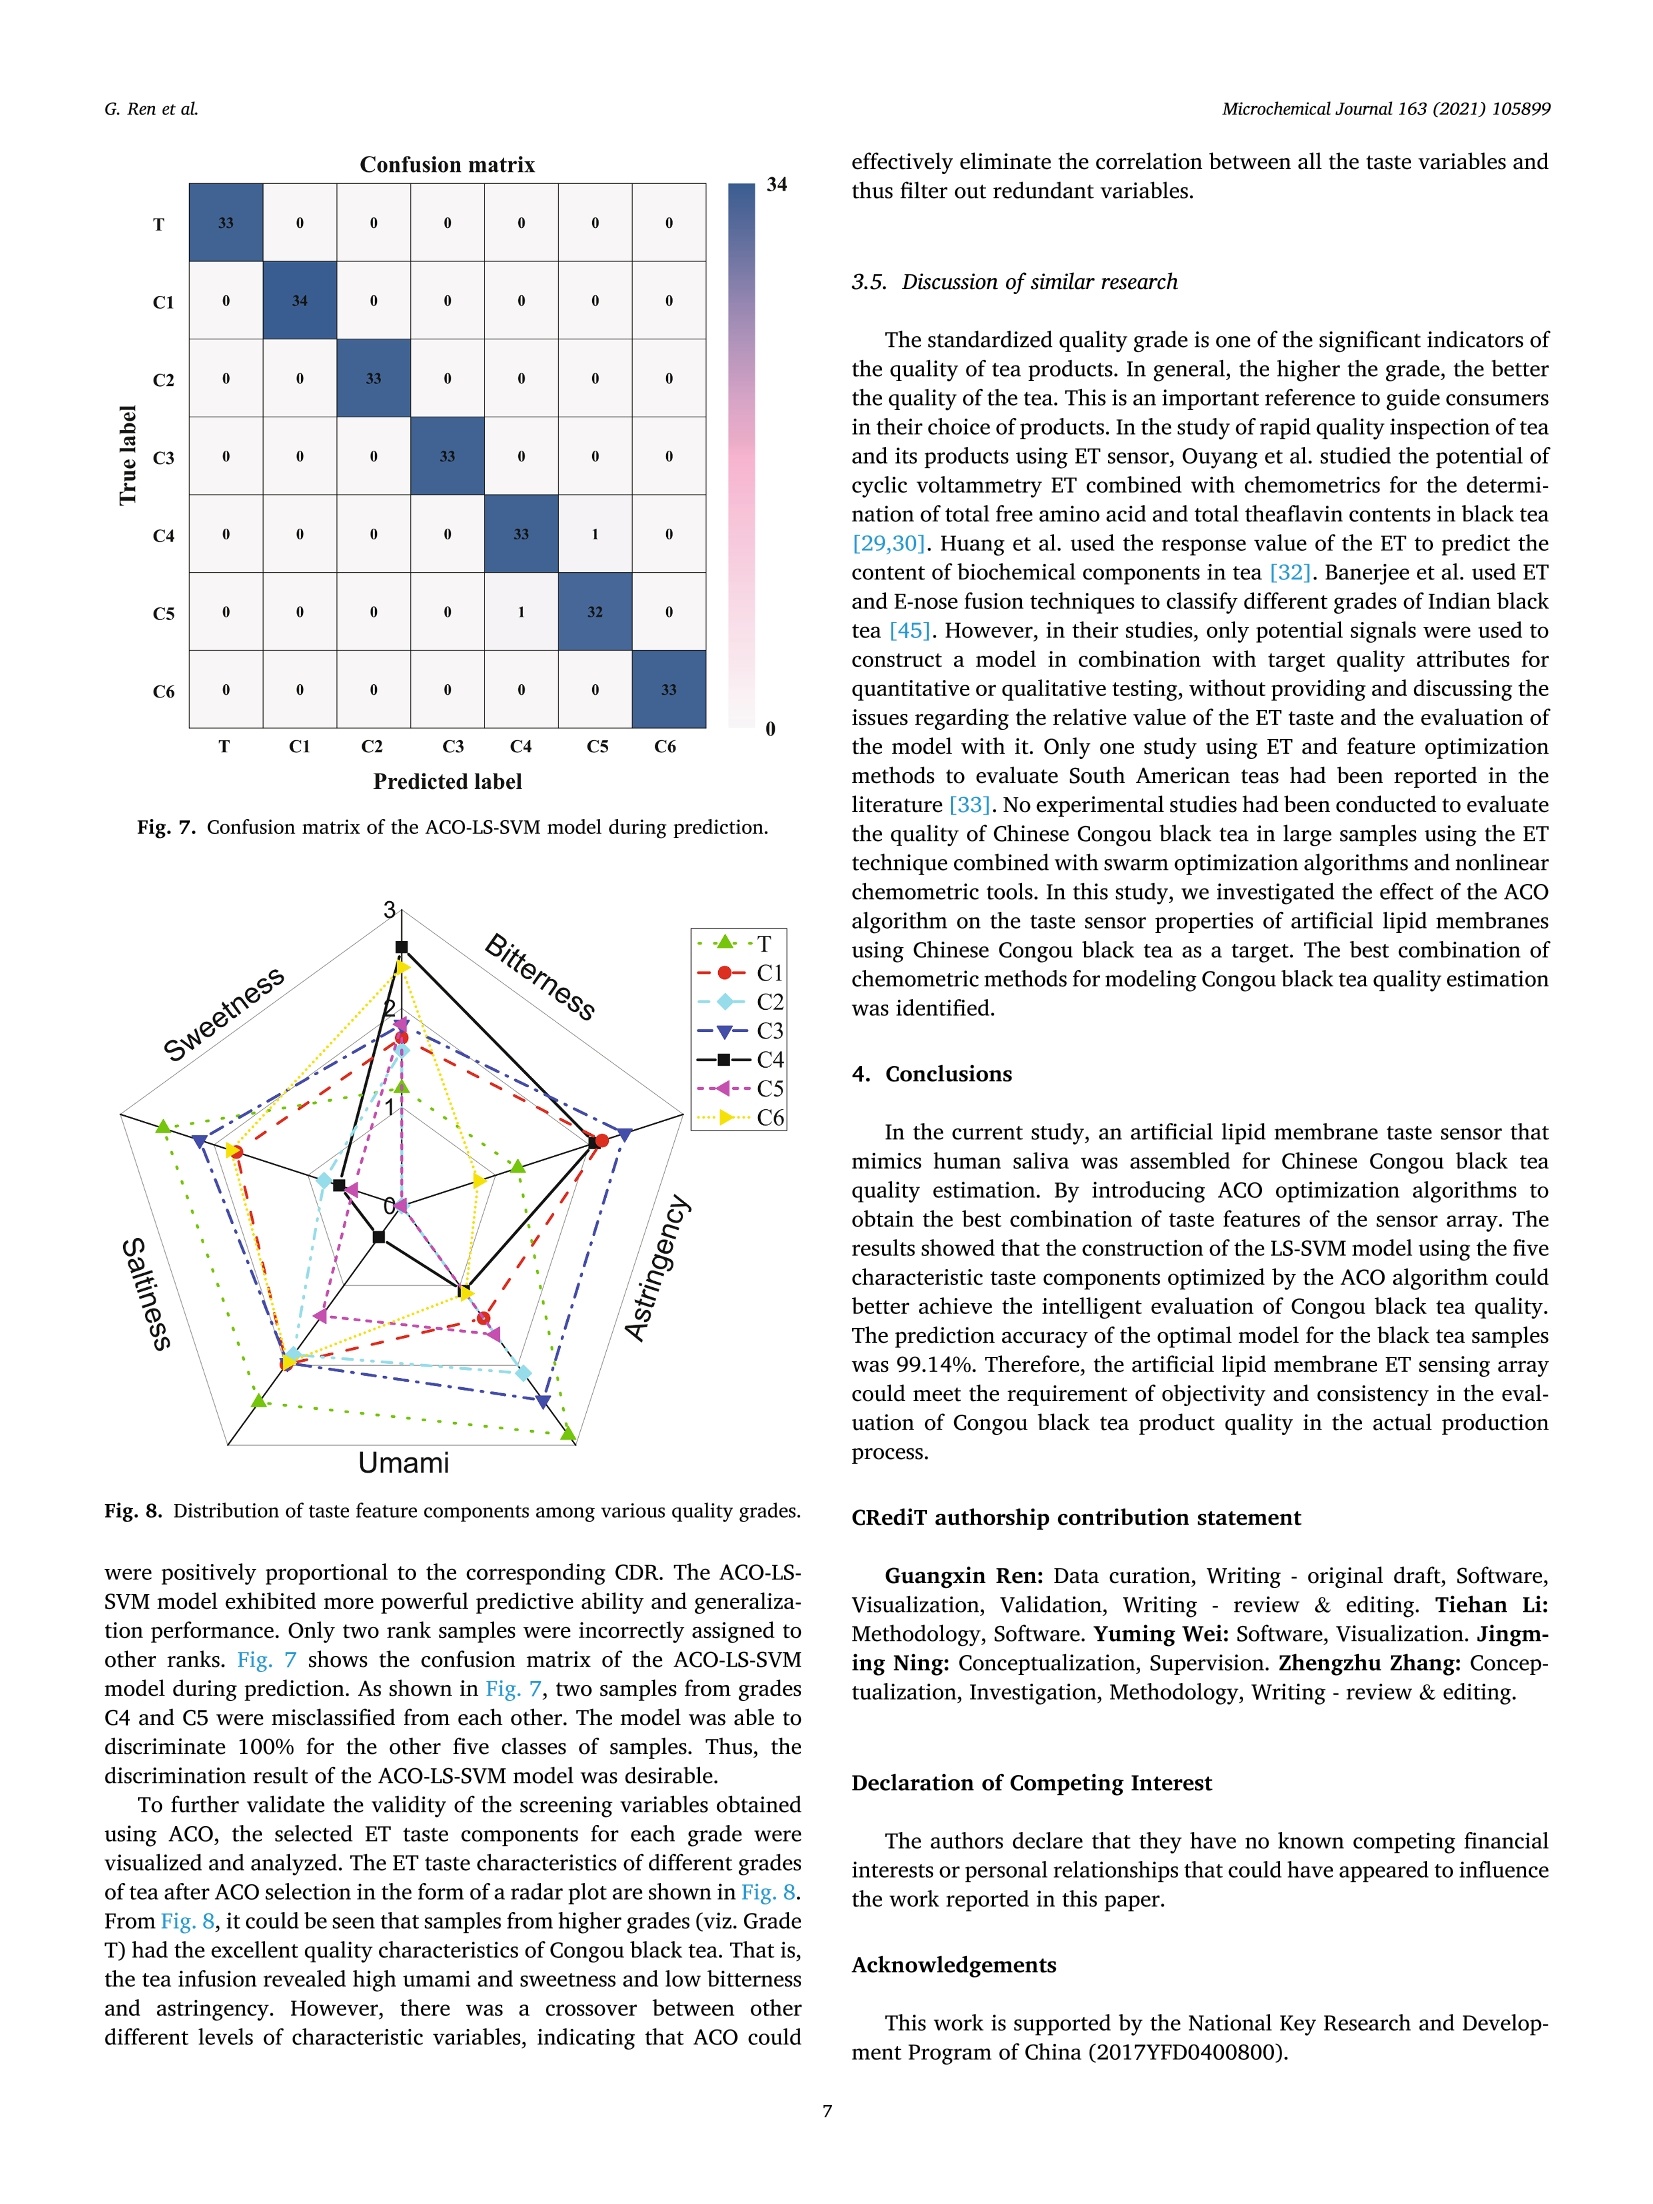
Microchemical Journal 163 (2021) 105899Contents lists available at ScienceDirectMicrochemical Journaljournal homepage: www.elsevier.com/locate/microc Microchemical Journal 163 (2021)105899G. Ren et al. Estimation of Congou black tea quality by an electronic tongue technologycombined with multivariate analysis Guangxin Ren, Tiehan Li, Yuming Wei, Jingming Ning, Zhengzhu Zhang State Key Laboratory of Tea Plant Biology and Utilization, Anhui Agricultural University, Hefei 230036, Anhui, PR China ARTICLEINFO ABSTRACT Keywords:Black teaElectronic tongue technologyTaste feature optimizationAnt colony optimizationLeast squares-support vector machine The taste attribute is an important indicator to estimate the quality and rank of black tea. It is crucial to preventfraud and avoid economic losses. This study creatively proposed the assessment of Congou black tea qualitybased on an electronic tongue system combined with the ant colony optimization (ACO) algorithm and stoi-chiometry. Firstly, the electronic tongue could effectively present the taste quality of black tea, capturingcharacteristic potential signals from 700 samples of seven different qualities and converting the signals into ninerelative characteristic taste values. Then, the taste indicators from different artificial lipid membrane sensorswere optimized using the ACO method. Finally, the discriminant models based on the extreme learning machine,support vector machine, partial least-squares discriminant analysis, and least squares-support vector machine(LS-SVM) were developed using the optimized taste characteristics for the assessment of black tea quality. Resultsindicated that the LS-SVM model, which was created using the five taste features, could obtain better predictiveoutcomes based on the generalization performance of the model. In the prediction set, the correct discriminantrate was 99.14%. The overall results demonstrate that the electronic tongue sensor array has potential appli-cation prospects for the assessment of Congou black tea products in the actual production process. 1. Introduction Black tea is the most important fermented tea product and themainstream of tea consumption in the world [1]. According to specificprocessing technologies, black tea can be divided into the followingthree categories: Congou black tea, Souchong black tea, and crush, tear,and curl (CTC) black tea [2]. Congou black tea is a famous Chinese teaproduct with a sweet and mellow taste, which is processed by thefollowing four steps: withering, rolling, fermentation, and drying [3].Tea taste, which is developed by the comprehensive action of taste-related compounds included in tea, is one of the crucial indexes thatdetermine the quality and value of black tea [4]. The main flavor-presenting substances in black tea are polyphenols, catechins, freeamino acids, caffeine, and soluble sugar. Tea polyphenols, catechins(especially epigallocatechin gallate), caffeine, amino acids (especiallytheanine), soluble sugar, inorganic salt, and mineral element, areconsidered to be the major sources of astringency, bitterness, umami,sweetness, and saltiness in black tea [5,6]. The diversity of taste in tea isdetermined by the composition and proportion of tea active ingredients.To guide consumers in making sound purchasing decisions, prevent fraud and avoid economic losses, evaluating the different tastes ofCongou black tea quality has become a pressing issue. Human panel sensory analysis is a conventional method of evalu-ating tea quality and grade. The qualities of tea samples are detected byprofessional tea assessors, which use the tea morphological features,color, aroma, texture, and taste of tea infusion as determining factors[7,8]. However, this approach includes considerable error as it canobtain various test results with different assessors using their sensoryorgans. It is impracticable for large-scale detection and identification asthe approach is cumbersome, expensive, and time-consuming. In addi-tion, it is challenging to develop standard terms that can describe thetaste of Congou black tea for tea researchers from various countries andregions [9]. To create an effective method to weaken the limitations ofsensory quality analysis and compensate for the shortcomings (e.g.,subjectivity, unpredictability, and inconsistency) of sensory evaluation,researchers have been devoted to developing various instrumentalanalytical techniques of evaluating tea quality and rank based on itsphysical and chemical profiles, such as liquid chromatography-masseS,:spectrometry [10], gas chromatography-mass spectrometry [11], andhigh-performance liquid chromatography [12]. Unfortunately, the ( * Corresponding author. ) ( E -mail address: z z z @ ah au . e d u .cn (Z . Z h ang). ) ( 0026-265X/C 2020 Elsevier B.V . All ri g hts reserved. ) Correlation matrix aforementioned methods are extraordinarily complex and labor-intensive. The obtained results using these methods are accurate butcannot rapidly estimate the quality and grade of tea. Consequently, it isnecessary to develop a convenient, rapid, and non-destructive detectionmethod for both scientific research and practical applications. In decades, many fast testing technologies on the estimation of teaquality and grade are created, such as near-infrared spectroscopy[13,14], hyperspectral imaging [15], olfactory visual sensor array[1,16], and fluorescent probes [17]. Though these methods mentioned4.above can yield pinpoint results, spectroscopic instruments are expen-sive, enormous, and require the involvement of skilled technicians, andchemical material methods need to apply a large number of toxicchemical reagents [18]. As a result, it is difficult for them to makefurther rapid evaluations or on-the-spot measurements of the tastequality of tea. At present, a new trend in food analysis and discrimina-tion is the shift from compound-oriented to pattern-oriented strategies[19], in which pattern recognition algorithms are employed to distin-guish and analyze distinctive profile information of compounds insteadof focusing on the quantification of certain specific compounds [20]. Electronic tongue (ET) is a bionic detection sensor system composedof cross-sensitive sensor arrays with different functions, which can sensethe total characteristic signal of the sample solution and identify thefingerprint of liquid phase samples with the help of appropriate patternrecognition methods [21,22]. This technology has been widely appliedin honey [21,23], wine [24,25], and other food industries [22,26,27].Currently, the potential of ET technology for adulteration identification[28], quantitative analysis [29-31], and quality control [4,32,33] of teahas been investigated, and studies have proven the efficiency of thisdevice. Although there has been a study of optimizing characteristicvariables to classify tea grades by the ET method, the published paper isspecific to tea samples from Brazilian and Argentinian, and it is imple-mented via a method of voltammetric tongues [33]. No study hasexperimented to estimate seven ranks of Chinese Congou black teaquality by a potentiometry electrochemical ET and swarm intelligenceoptimization algorithm. The main objective of this research is to explore an ant colonyoptimization (ACO) feature selection algorithm combined with pattern recognitions based on ET data for estimation of Congou black tea quality(n=7 tea grades). The radar chart of the main feature contributions isdeveloped for the inspection personnel reference. The specific workarrangements to be conducted in this research are as follows: First, thetaste sensing ET system is applied to obtain the taste-related charac-teristic response signals of Congou tea samples from seven differentgrades and convert the sensor outputs into nine taste characteristics.Then, the obtained taste features from different artificial lipid mem-brane sensors are optimized using the ACO method. Finally, the iden-tification models based on the optimized taste characteristics aredeveloped using four pattern discriminant algorithms, which areextreme learning machine (ELM), support vector machine(SVM), partialleast-squares discriminant analysis (PLS-DA), and least squares-supportvector machine (LS-SVM), and the effects of the four pattern recognitionalgorithms are compared. The schematic representation of ET technol-ogy combined with the ACO algorithm and chemometrics is shown inFig. 1. 2. Materials and methods 2.1. Sample preparation and preprocessing In this study, 700 Dianhong Congou black tea samples (seven grades,100 samples for every grade) were obtained from Yunnan large-leaf teacultivar in 2018. It was provided by Yunnan Dianhong Group Co.,Ltd.,China with a specification of 0.5 kg/bag. The tea samples were graded inaccordance with a Chinese official and standard analytical method ofDianhong black tea (GB/T 13738.2-2017), and these samples werestored at 4°C in a refrigerator until the analysis. Before data acquisition of the ET sensor system, a sequence of samplepreprocessing was as follows: First, 3.00 g of tea sample was put into thestandard evaluation cup and bowl, and brewed with 150 mL of distilledboiling water for 5 min. Then, tea infusion was filtered with three-layerfilter gauze. 35 mL of tea infusion filtrate was transferred to the samplecup of ET and allowed to cool at room temperature for collecting ETresponse signals. 1 0.257** -0.053 -0.059 -0.391** 10.507**1 -0.499** 0.257** 1 0.469** 0.085* 0.295** -0.528** 0.683**- -0.737**-0.191** -0.053 0.469** 1 0.507** 0.440** -0.091* -0.030 -0.460** 0.386** -0.059 0.085* 0.507** 1 0.892** 0.104** -0.411** 0.055 0.409** -0.121** 0.295** 0.440** 0.892** 1 -0.104** -0.010 0.347** -0.227** -0.722** -0.528** -0.091* 0.104** -0.104** 1 -0.533** 0.484** 0.350** 0.507** 0.683** -0.030 -0.411** 1 -0.484** -0.537** -0.391** -0.460** 0.055 -0.010 0.484** -0.537** 1 0.372** -0.737** -0.499** -0.191** 0.386** 0.409** 0.347** 0.350** -0.484** 0.372** 1 Fig.2. Heat map based on the correlation matrix of the taste profiles in tea. 2.2. Electronic tongue system and data collection In this study, the ET response signals of tea samples were obtainedusing a taste sensing system (SA402B, Insent Intelligent Sensor Tech-nology, Inc., Kanagawa, Japan). This system (Fig. 1) consisted of amainframe, artificial lipid membrane sensors, and an operating com-puter. The taste sensor as the working electrode included a lipid-basedmembrane, an Ag/AgCl electrode, and an internal cavity filled with a3.33 M KCl aqueous solution and saturated AgCl. The reference elec-trode was an Ag/AgCl electrode with a ceramic junction, and a 3.33 MKCl aqueous solution with saturated AgCl was applied as the inner so-lution. The six different taste sensors array (viz. CAO, COO, AE1, AAE,CTO, and GL1) corresponded to sourness (Sou), bitterness (Bit), astrin-gency (Ast), umami (Uma), saltiness (Sal), and sweetness (Swe), andcould measure not only the five basic taste qualities of Sal, Sou, Bit, Sweand Uma but also Ast, astringent aftertaste (Ast-a), bitter aftertaste (Bit-a) and richness (Ric). During data collection, cleaning of the positive andnegative electrodes of the system was 90 s. Two cleanings of the refer-ence solution (30 mM KCl and 0.3 mM tartaric acid) were 120 s each,and the work time of the sensor was 30 s. Then, the electrical potentialsignal corresponding to the taste of a sample solution was acquired. Thereference solution was used as a control value, thus the sensor outputscould convert to the aforementioned nine taste values using system-specific taste conversion software [34]. In this experiment, each sam-ple solution was measured four times, and the mean of the four mea-surements from each sample was adopted in the following analysis. Thetest temperature was maintained at 28 °C with circulating water. 2.3. Correlation analysis of taste profiles Pearson’s correlation analysis was carried out to further clarify theinterrelationships between the taste characteristic variables of ET dataand to obtain the optimal features. Pearson’s correlation matrix betweenthe nine taste profiles in tea is presented in Fig. 2. In Fig. 2,there werefour pairs of taste characteristics with a correlation coefficient (R)greater than 0.6. These variables with high R values indicated that thesetaste profiles may exhibit similar effects in discriminant models. That is,the aforementioned feature variables may be redundant for model construction. Consequently, it was important to choose the key tastecharacteristics affecting the quality of Dianhong Congou black tea usinga feature variable selection method. The data used for modeling in thisstudy contained 700 samples. Each sample encompassed nine featuresand one output which involved the quality grade of Dianhong Congoublack tea. 2.4. Multivariate data analysis 2.4.1. Ant colony optimization algorithm Ant colony optimization (ACO) is a swarm optimization methodinspired based on the foraging behavior of ant colonies by a naturalevolution [35]. When scientists investigated the foraging behavior ofants, they discovered that ants do not develop a complete visual systemand that they are able to communicate with each other throughspreading pheromones [36]. Usually, ants will randomly choose a pathto forage for food. As ants move around the food source, they releasepheromones along the path. Other ants can sense the presence of thepheromones and tend to take the routes with high pheromone concen-trations. Through this mechanism, more ants will pass through theoptimal path, leaving more pheromones, such that the probability oflater ants choosing the optimal path after many iterations is higher.When a given convergence condition or a maximum number of itera-tions is reached, the optimal route is solved [37]. The specific movementof the ants is as follows:(a) In the absence of pheromone guidance, theants have a certain amount of inertia to move in the original route andsome random probability to choose another direction; (b) Guided by thepheromone, the ant chooses the direction of movement based on theconcentration probability of the pheromone; (c) The concentration ofpheromones transmitted by ants during locomotion is inversely pro-portional to the travel distance;(d) The pheromones will evaporate overtime. Thus, the pheromones released by ants during their food search areheuristic, stochastic, and fluctuating owing to the constant changes inthe external environment [35]. In this work, the ACO algorithm searches for the best taste compo-nent combination of the ET system during the training model. Theoptimal combination of taste characteristics is calculated and deter-mined by the minimum weighted error between the true attribute value 6 Fig. 3. Two-dimensional and three-dimensional PCA plots of tea samples from the two datasets. and the predicted attribute value of the model in the calibration andprediction datasets. Consequently, the objective function of the ACOmethod (viz. BestCost) is defined as follows: where, Ncal indicates the number of the calibration set samples, and eiindicates the error between the predicted attribute value and the trueattribute value of the ith calibration set sample by the model. Npre in-dicates the number of the prediction set samples, and emeans the errorbetween the predicted attribute value and the true attribute value of thejth prediction set sample by the model. Additionally, the parameters ofthe ACO method were set as follows: the maximum number of iterationsand the population size (i.e., number of ants) were adjusted to 100 and20, respectively. The initial pheromone concentration, pheromone indexweight, and heuristic index weight were all set to 1, and the pheromoneevaporation coefficient of the algorithm was 0.05. 2.4.2. Extreme learning machine Extreme learning machine (ELM) algorithm is a homogeneousrecursive learning method for regression and multiple categorizationsbased on a single hidden layer feedforward neural network in which theweighting coefficients connecting the input layer to the hidden nodes(HNs) are randomly assigned and are not updated or changed [18]. Thealgorithm can significantly improve the generalization capability of thenetwork model and increase the training speed [35]. In the presentstudy, the algorithm optimization process has the following two steps.Firstly, the number of hidden layer neurons (nHLNs) is determined byneural network training, and the input weights of the HNs are setrandomly.Then, a differentiable output function is chosen as the acti-vation function of the HLNs and the output matrix from the hidden layeris calculated. Finally, the optimal nHLNs is determined based on thehighest recognition rate of the prediction set. 2.4.3. Support vector machine A support vector machine (SVM) is a common multi-class classifierused in data analysis. The algorithm is based on structural risk mini-mization principles and attempts to improve generalization capabilityand reduce expected risk [38]. The SVM discriminator obtains goodpredictions through two core parameters (i.e., the penalty parameterand the kernel function). A penalty parameter (c) is proposed to obtainthe minimum training error and the simplified model, and a kernelfunction (g) depicts a nonlinear mapping of the input space to a randomhigh-dimensional feature space. The specific steps of the method are detailed in our previously published study [18]. 2.4.4. Least squares-support vector machine The least squares-support vector machine (LS-SVM) is an intelligentlearning algorithm capable of solving linear,nonlinear, and local min-imum problems [39]. As an extension of the traditional SVM approach,LS-SVM effectively reduces computational complexity and solves arange of linear equations [40]. In the current study, we used the radialbasis function (RBF) as a kernel function to build the calibration model.To improve the classification accuracy of the model, the parameter gam(y) and the RBF parameter sig(o) are optimized. The algorithm hasbeen described in detail in our previous study [13]. 2.4.5. Partial least squares discriminant analysis Partial least squares discriminant analysis (viz. PLS-DA) is a rapid,effective and linear classification algorithm for solving discriminationproblems [41]. The method can transform the class vector into numer-ical matrix responses and optimize the latent variables (LVs, viz. thelinear combinations of the raw variables) with a maximum covariance ofthe responses [42]. The PLS-DA model is created with the optimal LVs,and the class responses of the test samples are predicted. The algorithmis described in detail with reference to the published literature [43]. 2.5. Performance evaluation To evaluate the performance of the discriminant model, the correctdiscriminant rate (i.e., CDR) was used as a key metric for performanceevaluation. The CDR was obtained based on the ratio of the number ofcorrectly classified samples to the total number of samples [9]. Thehigher the precision value, the better the performance of the model.Besides, two parameters (sensitivity and specificity) were also used forthe evaluation of model performance. In the present study, all calcula-tions were performed in the Matlab R2019b (Mathworks, Natick, USA).The ACO and pattern recognition algorithms were created by our team. 3. Result and discussion 3.1. Division of calibration set and prediction set samples In this study, the partition of the calibration set and the prediction setwas divided into two parts. For better generalization performance of themodel, the Kennard-Stone (K-S) method was used to optimize the samplecharacteristics and perceive the interaction between the taste charac-teristics and the grade values of Dianhong Congou black tea [44]. The Fig. 4. Two-dimensional and three-dimensional PCA analysis maps for the seven grades of tea samples. algorithm took all the samples as candidates for the calibration set andselected a certain number of samples from them in turn to the calibrationset. First, the Euclidean distances were calculated for all samples, andthe two most distant samples were selected to enter the calibration set.Then, the two samples furthest and closest to the selected samples werefound by calculating the European distance from the remaining samplesto the two known samples above. Finally, the two samples were selectedinto the calibration set and the above steps were repeated until therequired number of samples was satisfied. In this way, the sample setswere divided by a ratio of approximately two to one, the calibration sethad 467 samples, while the prediction set had 233 samples. Two-dimensional and three-dimensional principal component analysis(PCA) plots of tea samples from thetwo ET datasets are shown in Fig. 3.It can be seen from Fig. 3 that the samples in the calibration set essen-tially contained the characteristics of the sample in the prediction set,which ensured the reliability of the predictions of the model for inde-pendent samples. 3.2. Exploratory analysis PCA is commonly used as an effective statistical tool to explore thespatial distribution of samples, explain differences between the samples,and extract important feature variables from high-dimensional datawhile preserving most of the feature information on the original data[4]. Therefore, PCA was performed on the ET data to plot the scatter ofthe sample distribution and observe the distribution of samples beforebuilding the discriminant model. Fig. 4 shows the PCA analysis maps forthe seven grades (e.g.,T, C1, C2, C3, C4, C5, and C6) of tea samples. InFig.4(a), the PCA visualization score plot represents the first two PCs ofthe ET dataset, where PC1 and PC2 account for 54.56% and 20.81%,respectively. The contribution of the total cumulative informationvariance was 75.37%. There was an overlap in the distribution of thesamples,indicating that it was difficult to clearly separate the sevengrades of tea samples based on the first two PC scores. To furtherinvestigate the feasibility of sample separation, the first three PCs wereproposed to draw visual score plots, as shown in Fig. 4(b). The cumu-lative variance contribution was 87.18%, indicating that most of theinformation in the original data were included in these three PCs.However, the score plot in Fig. 3(b) shows a similar distribution to thatof the first two PCs and only tea samples of grades C4 and C5 can beseparated from the other grades. These indicated that the ET taste valuesof different grades of tea samples were similar to a large extent. Insummary, the PCA method could not completely distinguish the sevengrades of tea samples. The likely reason for this was that the differences Fig. 5. The convergence curve of the ACO algorithm during 100 iterations. Fig. 6. Results of taste feature composition screening based on ACO. Table 1Statistical results of the optimal chemometric models based on the ACO and different classification algorithms. Models Parameters Class Calibration set Prediction set CDR/% Sen Spe CDR/% Sen” Spe ELM nHLNs =85 T 74.63 0.7576 0.7353 72.73 0.7500 0.7059 C1 72.73 0.7576 0.6970 70.59 0.7500 0.6667 C2 73.13 0.7273 0.7353 69.70 0.7500 0.6471 C3 70.15 0.7273 0.6765 66.67 0.6875 0.6471 C4 72.73 0.7273 0.7273 88.24 0.9375 0.8333 C5 73.13 0.7273 0.7353 66.67 0.6875 0.6471 C6 67.16 0.6667 0.6765 57.58 0.6250 0.5294 Total 71.95 0.7210 0.7179 70.39 0.7069 0.7009 SVM c=11.31,g=8 T 94.03 0.9697 0.9118 93.94 0.9375 0.9412 C1 92.42 0.9394 0.9091 91.18 0.9412 0.8824 C2 92.54 0.9091 0.9412 90.91 0.9375 0.8824 C3 94.03 0.9394 0.9412 90.91 0.9375 0.8824 C4 90.91 0.9091 0.9091 88.24 0.8824 0.8824 C5 92.54 0.9394 0.9118 90.91 0.9375 0.8824 C6 91.04 0.9118 0.9091 87.88 0.9375 0.8235 Total 92.51 0.9270 0.9231 90.56 0.9298 0.8824 LS-SVM y=76.32,o²=0.3540 T 100.00 1.0000 1.0000 100.00 1.0000 1.0000 C1 98.48 1.0000 0.9697 100.00 1.0000 1.0000 C2 98.51 1.0000 0.9706 100.00 1.0000 1.0000 C3 98.51 1.0000 0.9706 100.00 1.0000 1.0000 C4 98.48 1.0000 0.9697 97.06 1.0000 0.9412 C5 100.00 1.0000 1.0000 96.97 1.0000 0.9412 C6 98.51 0.9706 1.0000 100.00 1.0000 1.0000 Total 98.93 0.9871 0.9915 99.14 0.9914 0.9915 Number of hidden layer neurons. Sensitivity. Specificity. Table 2Statistical results of the optimal chemometric models based on the ACO and PLS-DA methods. Parameters Class Calibration set Prediction set CDR/% Sen Spe CDR/% Sen” Spe LVs"=4 T 40.30 0.4118 0.3939 48.48 0.5000 0.4706 C1 84.85 0.8485 0.8485 79.41 0.8235 0.7647 C2 94.03 0.9412 0.9394 84.85 0.8750 0.8235 C3 98.51 1.0000 0.9706 87.88 0.8824 0.8750 C4 100.00 1.0000 1.0000 97.06 1.0000 0.9412 C5 61.19 0.6176 0.6061 48.48 0.5000 0.4706 C6 49.25 0.5000 0.4848 45.45 0.4706 0.4375 Total 75.37 0.7554 0.7521 70.39 0.7241 0.6838 Optimal number of latent variables. Sensitivity. between the various categories of tea were so small that unsupervisedPCA method could not accurately differentiate between them and moreinformation needed to be obtained from the ET data. To further evaluatethe possibility of discriminating different grades of tea, the ACO featureselection algorithm and multivariate classification tools were proposed. 3.3. Selection of taste feature components using ACO Fig. 5 shows the best convergence curves for the ACO algorithmaccording to the lowest BestCost. As shown in Fig. 5. The ACO methodexhibited a large fluctuation at the start of the iteration and then a smalldecay trend. The algorithm finally converged after 32 iterations, andthere were merely three fluctuations throughout the convergence pro-cess. The value of the best objective function (e.g., BestAnt. Cost) was2.8285%. The above results indicated that the convergence rate of themethod was ideal, which may be relevant to the rational design of theobjective function. After multiple iterations, the ACO screened out five features. Asshown in Fig. 6, the selected features are Ast, Swe, Uma, Bit, and Sal, andthis is also consistent with the reality. The multivariate classification model was built with the selected features as input features and thecorresponding quality level attributes as output values. In addition, theselected taste characteristics had an important influence on the qualitylevel of Congou black tea quality. 3.4. Results of the optimal models Table 1 shows the statistical results of the optimal chemometricmodels based on the ACO and three classification algorithms (e.g.,ELM,SVM, and LS-SVM). Investigated from Table 1, both the SVM and LS-SVM models based on the selected five taste features had much higherdiscriminatory accuracy than the ELM model, both in the calibration setand in the prediction set. Statistical results of the linear PLS-DA modelwith 10-foldcross-validation based on the ACO method are shown inTable 2. From the results in Table 2, the overall discriminative perfor-mance of the PLS-DA model was similar to that of the ELM model, andthe classification of the prediction set was poor. The CDRs of the fourclassification models (namely ELM, PLS-DA, SVM, and LS-SVM) in theprediction process were 70.39%, 70.39%,90.56%, and 99.14%,respectively. The values of the parameters (sensitivity and specificity) 34 Fig. 7. Confusion matrix of the ACO-LS-SVM model during prediction. Fig. 8. Distribution of taste feature components among various quality grades. were positively proportional to the corresponding CDR. The ACO-LS-SVM model exhibited more powerful predictive ability and generaliza-tion performance. Only two rank samples were incorrectly assigned toother ranks. Fig. 7 shows the confusion matrix of the ACO-LS-SVMmodel during prediction. As shown in Fig. 7, two samples from gradesC4 and C5 were misclassified from each other. The model was able todiscriminate 100% for the other five classes of samples. Thus, thediscrimination result of the ACO-LS-SVM model was desirable. To further validate the validity of the screening variables obtainedusing ACO, the selected ET taste components for each grade werevisualized and analyzed. The ET taste characteristics of different gradesof tea after ACO selection in the form of a radar plot are shown in Fig. 8.From Fig. 8, it could be seen that samples from higher grades (viz. GradeT) had the excellent quality characteristics of Congou black tea. That is,the tea infusion revealed high umami and sweetness and low bitternessand astringency. However, there was a crossover between otherdifferent levels of characteristic variables, indicating that ACO could 3.5. Discussion of similar research The standardized quality grade is one of the significant indicators ofthe quality of tea products. In general, the higher the grade, the betterthe quality of the tea. This is an important reference to guide consumersin their choice of products. In the study of rapid quality inspection of teaand its products using ET sensor, Ouyang et a. studied the potential ofcyclic voltammetry ET combined with chemometrics for the determi-nation of total free amino acid and total theaflavin contents in black tea[29,30]. Huang et al. used the response value of the ET to predict thecontent of biochemical components in tea [32]. Banerjee et al. used ETand E-nose fusion techniques to classify different grades of Indian blacktea [45]. However, in their studies, only potential signals were used toconstruct a model in combination with target quality attributes forquantitative or qualitative testing, without providing and discussing theissues regarding the relative value of the ET taste and the evaluation ofthe model with it. Only one study using ET and feature optimizationmethods to evaluate South American teas had been reported in theliterature [33]. No experimental studies had been conducted to evaluatethe quality of Chinese Congou black tea in large samples using the ETtechnique combined with swarm optimization algorithms and nonlinearchemometric tools. In this study,we investigated the effect of the ACOalgorithm on the taste sensor properties of artificial lipid membranesusing Chinese Congou black tea as a target. The best combination ofchemometric methods for modeling Congou black tea quality estimationwas identified. 4. Conclusions In the current study, an artificial lipid membrane taste sensor thatmimics human saliva was assembled for Chinese Congou black teaquality estimation. By introducing ACO optimization algorithms toobtain the best combination of taste features of the sensor array. Theresults showed that the construction of the LS-SVM model using the fivecharacteristic taste components optimized by the ACO algorithm couldbetter achieve the intelligent evaluation of Congou black tea quality.The prediction accuracy of the optimal model for the black tea sampleswas 99.14%. Therefore, the artificial lipid membrane ET sensing arraycould meet the requirement of objectivity and consistency in the eval-uation of Congou black tea product quality in the actual productionprocess. CRediT authorship contribution statement Guangxin Ren: Data curation, Writing-original draft, Software,Visualization, Validation, Writing - review & editing. Tiehan Li:Methodology, Software. Yuming Wei: Software, Visualization. Jingm-ing Ning: Conceptualization, Supervision. Zhengzhu Zhang: Concep-tualization, Investigation, Methodology, Writing- review & editing. Declaration of Competing Interest The authors declare that they have no known competing financialinterests or personal relationships that could have appeared to influencethe work reported in this paper. Acknowledgements This work is supported by the National Key Research and Develop-ment Program of China (2017YFD0400800). ( References ) ( [1 ] H . J i ang, W . X u, Q . C h e n, E v a l u ating a r o ma q u a l it y of bla c k t e a by a n olfac t or y v isu a l iz a ti o n s y stem : s e le cti o n o f f eatu r e s e n s o r u s i ng p a r ti cl e swarm o p timization , F oo d Res . I nt. 126 ( 2 0 1 9), 1 08605 . ) ( [2] Y . - J . W an g , T . - H . L i , L . - Q . Li , J . - M . N i n g, Z. - Z. Zh a ng, Ev a lu a ti n g taste - r ela t ed a ttribut e s o f b lack t e a by mic r o- N I R S, J . F o o d E n g . 2 9 0 (2 02 1),11 0 1 8 1. ) ( [3] G . R en, Y . L i u, J . Ning , Z . Zh a ng , H ype r spe ct ral im a ging f or dis c r im i n a tion of K eemun b l a c k te a qu a lity c a tegorie s : m u lt i v a r i a t e c a l i b ratio n a n alys i s a nd data f u s i o n , I n t. J . F ood S c i . T echnol. (2020). ) ( [4 ] X . C h en, Y . X u, L. M e n g , X . Chen, L . Yuan, Q. C a i, W. Shi , G. Hua n g, Non - p a r a m etric p ar t i a l l e a s t s qu a r e s- di s cr i minant an a l y s i s m o d el base d on s u m of r anki ng d iffe r e n ce a lgo rit h m for t e a gr ade i denti f ication us i n g e lectro n i c ton g ue d at a , Se n s . A c t uat . B : C hem. 3 1 1 ( 202 0 ), 1 27924. ) ( [5] L . Zhang, Q.-Q. C a o, D . G r anato, Y.-Q. Xu, C.-T. Ho, Association be t ween che m istry a nd taste of tea: a review, Trends Food Sci. Technol. 1 01 (2020) 139-149, htt ps:// doi .o r g/1 0. 1 01 6 / j . t if s. 2020.05 . 01 5 . ) ( [6] L . M en g , X . C h e n , X . C h en, L . Y u an, W. Sh i , Q. Ca i , G . H uang , Li n ea r a n d no n l inea r c lass i fication models f or tea grade i dentifi c atio n based o n t he e lemental p r ofil e , M icroc h e m.J . 1 53 (2020 ) , 1 0 4 512. ) ( [7] M . L i , T . P an, Q . C h e n, Es t i m a t i on of t e a qua l it y g ra d e u sin g s ta t i sti ca l i den t i fi cation o f k e y v a r ia b l es , F o o d Contro l 1 19 ( 2021) , 1 074 85 . ) [8]G. Ren, Q. Fan, X. He, W. Li, X. Tang, Applicability of multifunctional ( p r ep rocessin g de vic e f or s imu l t a ne o us e s t i m a t io n o f spreadi n g of g re e n t e a , w ithering o f b l a c k t e a and sh aki n g of o olong tea, J . Sc i . F o o d A gri c . 10 0 ( 2 020) 560-569 . ) ( [9] G .R e n, Y . W a ng , J. N i n g,Z. Zh a ng, U s i n g nea r -in fr ared hy p er s pe c tra l i m a gi n g with m u l tiple d e cisi o n tr e e m e thods to d el i ne a t e bla c k tea q u a l ity, S pe c t roc h im. Acta . A M ol. B iomol. S p e ctrosc. 2 37 ( 20 2 0), 1 18407. ) ( [10] C . D ong, T . A n , H . Z h u , J. W ang, B . H u , Y . J ia n g, Y . Y a ng , J . L i , Ra p id s en si n g of k ey qu a l i ty c o m p onents i n bl a c k te a fe r m e ntation u s i n g el ec trical ch a racteristics c o upl e d to v ariable s s e l ection al g orithms , S c i . Rep . 10 (2020) 1 598 . ) ( [ 11 ] Y . Y a n g, M . Z ha ng , J . H u a , Y . D en g , Y . J i a n g, J . L i , J . Wang, H . Yu a n, C . Dong, Q ua n t i t at ion o f pyr a z i nes i n r oas t e d gre en tea b y i nfra r e d - a s sis t ed ex t r a c tion c ou pl e d to h ea d space s o l i d - phase m i c r o e xtr a c t i o n i n c o m bi na t i on wi th G C - Q q Q - M S/M S , F o od R e s . I n t . 1 3 4 (2020) , 109167 . ) ( [12] G . R e n, S . Wang, J . N ing, R. X u, Y . W a ng, Z . X in g, X . Wan, Z. Z hang, Q uan t ita t i v e a na l y sis a nd ge o gr a ph ica l t ra c eabili t y of b lack tea us i n g F ourier t r a n s form nea r - i nf rar e d spec t ros c opy ( F T - N IRS), F o od R e s. I nt. 53 (2013) 8 22- 8 26. ) ( [13] G . R en, Y. Wang, J . Ning, Z. Zhang, H ighly identification of keemun black t ea r ank b ased o n cognitive spectroscopy: near infrared spectroscopy combined with f e aturevariable selection, Spectrochim. Acta Part A Mol. Biomol. S pectrosc. 2 30 (2020) 118079, h ttps :// d o i.o r g/1 0. 1 0 1 6 /j . s aa . 2 0 2 0. 1 1807 9 . ) ( [14 ] P . L iu, Y . W en, J . H u ang, A . Xi o ng, J . W e n, H. L i , Y. H u a n g, X. Z h u , S. Ai, R. W u , A n o ve l s t r ate gy o f n ea r - i n frar e d s pec t rosc o py d i me n s io n al i t y re du c t i on f o r d i s c rimin a tion o f g r ad e s, v a ri e ti es an d origins o f gre e n t e a , V i b. S p ect r osc .10 5 (2019), 1 0 2 984. ) ( [15] ] L . L i , S . Xi e , J. Ni n g , Q . Ch en, Z . Zh a ng, E v a luating g re en t e a q u ali t y b a se d o n m ult i se n sor d a t a fus i on c o mbin ing hype r spectral imagi n g and o lf a ct o ry v is u aliz a tio n s y st e m s , J . S c i . F oo d Agr ic. 9 9 (20 1 9 ) 1 787 -17 94. ) ( [16] L . L i , S. Xi e , F . Zhu , J . Nin g , Q . C h en, Z. Zhang, Col o rimet r ic s ensor a rra y - bas ed a rtif i c i a l o lfa c tory s y st e m for s e nsi n g C h ines e g r een t e a's q u al i ty: a meth o d o f f abri ca t ion , Int . J . F o o d P r op . 2 0 (2 0 1 7) 1 762 -1 7 73 . ) ( [17] J . Z hu, F . Z h u, L . L i , L . C h en g , L. Z hang, Y . S u n , X . W a n, Z. Zh a ng, H ig h ly d is c r iminant r a t e o f D i a n hong bl ac k t e a gr ade s b as e d o n flu o resce n t pro b escombined with chemometric method s , Food Ch e m. 2 9 8 (2 0 19 ) , 1 2 5046. ) ( [18] G . R en, Y . S u n, M . L i , J . N i n g, Z . Z h ang, C o g n itive sp e ctrosco p y for e v a l u ating C hinese b la c k t e a g r a d es (Camellia s i nensi s): n e ar- i nfra r ed s pe c trosc o p y a nd e vo l u t i o n a ry al gorithm A or s, J . Sc i . Food A g ri c. 1 00 ( 2 02 0 ) 3 9 50-3 9 5 9. ) ( [19] X . C e t o , S. P erez, V olta m m et ri c el e ctroni c t o ng ue for vin e g a r fin g erpri n ti ng , T alanta 219 (2020) , 12 1 2 53. ) ( [20 ] ] Z. Yang, N . M iao, X . Z h a n g , Q . L i , Z . W ang , C. Li , X . S un, Y . L a n, E m pl o y me n t o f a n e l e c t ro n ic tong u e c o m b ine d w i t h d e e p l ear n in g an d tran s fer l e arning f o r ) discriminating the storage time of Pu-erh tea, Food Control 121 (2021), 107608. ( [21] L . S obr ino -G r ego r i o , R . B a taller, J . S o to, I . Es c r iche , M on i t o r i ng ho n ey ad u l te rat i on w i th s u g a r sy ru p s u si n g a n automa t ic pu l s e v o ltamme t ri c e l e ct ro nic t o ngue, F o o d C on trol 91 ( 2 0 18 ) 2 54 - 260 . ) ( [22] Y . D a ng, L . H ao , T . Z h o u , J . Cao , Y . S u n , D . P a n , E s t abl i s hm e n t o f ne w ass e s s me nt m ethod f o r t he s y n e r g i s t i c eff e c t between umami p e p t id e s an d monosodium g lutamat e u sin g e l ectroni c ton gu e, F o od R e s . I nt. 12 1 (2019) 2 0- 2 7 . ) ( [23] L . S o br ino- G regorio, F . T a n l e q ue-Al b e r to, R. B a t a l l e r, J. S o to , I . E scriche, U s i ng a n a u t omati c p u lse vo lta m m etri c e l ectronic t o ngu e t o verify t he o rig in o f h o n ey f r om S pai n, Honduras, a n d M oz am biqu e , J . S ci . F o od A g ri c . 100 (2020) 2 12-2 17. ) ( [ 24] J. -L . - Z . Z aukuu, J . S o os, Z. B od o r , J . F e l fo l d i, I . M ag y ar, Z . K o v ac s , A ut h e nt ic a t i on o f t o k aj win e ( H u ngaricum) w i th t h e e l e c t ronic t o n gue a n d near i n f r ar e d s p e c t rosco p y, J . F ood S ci . 84 ( 2 019) 3 437-3 4 44 . ) ( [25] ( C . Garcia-Hernandez, C. Salvo-Comino, F. Martin-Pedrosa, C. Garcia-Cabezon,M.L.Rodriguez-Mendez, Analysis of red wines using an electronic tongue and infrared s pectroscopy. C orrelations with p henolic content and color parameters, LWT-Food S ci. Technol. 1 18 (2020) 108785. ) ( [26 J ] . Z h an g, J . C a o, Z. P e i, P . W e i, D . X i a ng, X. Ca o , X . S h e n, C . L i , V ol a tile f l a v ourcomponent s and t h e m echanis m s un d erlying th ei r p roduction i n golden p omp a no ( T rach i notus b l ochii) f il l et s s ub j ected to different dry in g m et h ods: a c o m p a r a t i v e s t ud y u s in g a n e l e ctronic n o se, an electroni c t o n gue and S D E-GC - MS , Foo d R es. In t. 1 23 (201 9 ) 217 - 2 2 5 . ) ( [27] H 1 . W an g , H . S u n , P o ten t i al u s e o f e l e c t r onic t ongue c o up led w i th c h e m o m e t r ic s a n a ly si s f or e a r ly d e t ect i on o f t he s p oila g e o f Z ygo sa cc har o m y ce s r o u xii in a p p l e j uice, F ood C hem. 290 ( 201 9 ) 152 - 1 5 8. ) ( [28] Y . L i , J . L ei, D . L ia n g , I denti f i ca t i on o f f a ke g reen t ea b y s e nsory a s ses s m e nt an d ele ct ro n ic ton g ue, F o o d S ci . T e c h nol. R e s . 21 ( 2015) 2 0 7-2 12. ) [29]Q. Ouyang, Y. Yang, J. Wu, Z. Liu, X. Chen, C. Dong, Q. Chen, Z. Zhang, Z. Guo,Rapid sensing of total theaflavins content in black tea using a portable electronictongue system coupled to efficient variables selection algorithms, J. Food Compost.Anal. 75 (2019) 43-48. ( [30] Q . Ouyang, Y . Y ang,J . W u , Q . C h e n , Z . G u o,H. Li , M e a sure m ent of t otal free a m ino a c id s c o nten t i n b lac k t e a u s in g elect r o n i c t o ng ue t echn o l o g y c ouple d w i th ch e mometrics , L W T - F o od S ci . T e chnol. 118 (202 0 ), 108768 . ) ( [31] P . S aha, S . Gh orai , B. T udu, 4 R , . Bandy o p adhyay, N . B h a ttacharyya ,F ea t u r e f us i o n f or pr ed i c t i o n of the a f l a vin a nd the a ru b igin in tea usi n g e l e ctr on ic tong u e, IE E E T rans . Instr u m . Mea s. 66 (2017 )1 703- 1 7 10. ) ( [32] D . H uang,Z. B i an, Q . Q i u, Y . W a ng, D . F an , X . W a ng, I d e n ti f ication of s i m ilarChinese c on go u blac k t e as u s i ng a n el ectronic t o ngue c om bined wit h pat t ern recogni t ion , Mo l ec ule s 2 4 (201 9 ) 4 549 . ) ( [33] D . R. R odr i gues , D . S . M . de O liv e ira, M . J . C . Ponte s , S. G . L em os, Volt am me t r i c e - t ongue ba s e d on a s i n gl e se n sor an d vari a b l e s e le c t i o n f or t he cl a s s i f i c a t io n of teas, F o o d An a l . Me t h . 1 1 ( 2 0 1 8) 19 58- 1 9 68. ) ( [34 ] Y . K obayashi,M . H a ba r a, H . I k e zazk i , R . C h e n , Y. N a i t o , K . T o k o, A d vanc e d tas t e s ensors based on ar t i f i cial l ip ids w it h gl o bal s e le c t ivi t y t o b a sic t aste qualities a n d h i gh c orr e la t ion t o s en so r y scor es , S e nsor s 10 ( 2 0 1 0) 3 41 1 - 3 44 3 . ) ( [35] H . J i a ng , W . X u, Q . C h e n, D e t ermination of te a polyp h en ols i n gr e en t e a b y h o mema d e co l o r s e n s i t i v e sen sor c omb in e d with multi v ari a t e a n a lysi s, F o o d Chem. 3 1 9 ( 2 020) , 126584 . ) ( [36] B . C h andra Mohan, R . B a s k a r an, A s u rvey: a nt C o l o ny O pt imization b ased recent r e s e a rch a n d i mp l eme n tat i on o n s e v e ra l e n ginee ri n g domain, E x pert S y st. A p pl. 3 9 (2 0 12) 4 618- 4 627 . ) ( [37] H . J i a n g,T . L i u, P . H e , Q . C h e n , Quant i t a tiv e a na l y sis o f fat t y a c i d v a l u e durin g rice s to rag e b ased on ol f ac t ory v i sua li zation sensor te c h n olog y , Sen s . Act u a t . B : C hem . 3 09(2020),127816 . ) ( [38] A .M. J im en e z-C a r ve l o, A . G o nza l ez- C a sado , M . G . B a gur-G o n z alez, L . C uadros- R odr i guez, A lternative d ata m ining/ m a chine l e a rning m e thods for th e an a lyticaleva l u a tion o f f ood q u a l ity a nd a u thentic i t y -a review, F ood R e s. I n t. 1 2 2 ( 2019) 2 5 - 3 9 . ) ( [39] H 1 . Z h a ng, S. Z ha ng , Y . C h e n, W. L u o , Y . H ua ng, D . T a o , B . Z h a n, X . L i u , No n- d estructi ve de t ermin at i o n o f f a t a n d m oi s t u re c o n te nt s i n Sal m o n ( Salmo sal a r ) f ill e t s us ing ne a r-inf r a red hy p e r s p e ctr a l i m a g i n g co u p led w i t h s pec t ra l a n d textu r a l fe a tures , J . Food C ompost. Anal. 9 2 (2020), 1 0356 7 . ) ( [40] W . L i , X . Y a n , J . P a n , S . L i u, D. Xue, H . Q u , R ap id a n a l y sis o f t h e T a n r e q i ng i njec t ion b y near - inf r a r e d s p ec tr o s c o py c ombined with le a s t s qua r es s upport vec t o r m a c h i n e a n d G a ussi a n p r o c e s s m o de lin g t e c h n i qu e s , S p e c tr o ch i m . Ac t a . A M ol . Biomol. Spectrosc . 218 ( 2019) 271 - 280 . ) ( [41] M . B arke r ,W. R a y e n s, P a r ti a l l e a s t s q uares f o r discrimi n ation, J . C hem o m. 1 7 (2003) 1 66 -173 . ) ( [42] G . R en , J . N i ng, Z . Z hang, M u lti-v a r i able s e l e ction s trategy b a sed on near- i nfrared ng . z . zh s pect r a for t he r a p id d e s c r ip t ion o f d i a n h on g b l a c k t ea qual i t y, S p e c t r o ch i m . A c ta . A M ol. Biomol. S p ectrosc . 24 5 (202 1) , 1 18918 . ) ( [43] D . B all a bio , V . C onson n i, C l a ss if icati o n t oo l s i n c h emi s t r y . P ar t 1 : line a r model s . P L S - D A , A n a l . M e t ho d s 5 ( 2 0 1 3 ) 37 90 - 3 79 8 . ) ( [44] J . L i u , S. Sun, Z . T an , Y . L i u , N ondestructive de tection o f s u n set y e l low in cr e a m b a sed o n n ear-i n frared s p e ct r oscopy a n d i n terva l r a ndo m fo r est , S p ec t rochi m . A ct a . A M ol. B iomol. S pec t rosc . 2 4 2 (2 020), 1 18 718 . ) ( [45] M . B . B anerjee , R . B . Roy, B . T u du , R . Ba n dyopadhyay , N. B h atta c ha r yy a , B l a c k t e a c l a ssi fi c at i o n e mployin g f ea tur e fusion o f E - N os e a nd E - Ton g ue response s, J . F ood En g . 2 44 ( 2 019) 55 - 6 3. ) 摘要:口感属性是评价红茶品质和等级的重要指标。本研究创造性地提出了基于电子舌系统的蚁群优化算法和化学计量学相结合的工夫红茶品质评价方法。首先,电子舌能够有效地呈现红茶的口感品质,从7种不同品质的700个样品中捕捉特征电位信号,并将信号转化为9个相对特征口感值。然后采用蚁群算法对不同人工脂膜传感器的味觉指标进行优化。最后,利用优化后的口感特征,建立了基于极值学习机、支持向量机、偏最小二乘判别分析和最小二乘支持向量机(LS-SVM)的红茶品质判别模型。结果表明,基于5个味觉特征建立的LS-SVM模型,基于模型的泛化性能,能够获得较好的预测结果。在预测集中,正确判别率为99.14%。综上所述,电子舌传感器阵列在实际生产过程中对工夫红茶产品的评价具有潜在的应用前景。关键词:红茶 电子舌技术 味觉功能优化 蚁群优化 最小二乘支持向量机
确定
还剩6页未读,是否继续阅读?

产品配置单
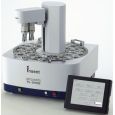
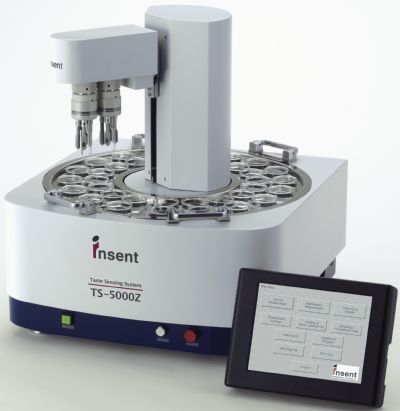
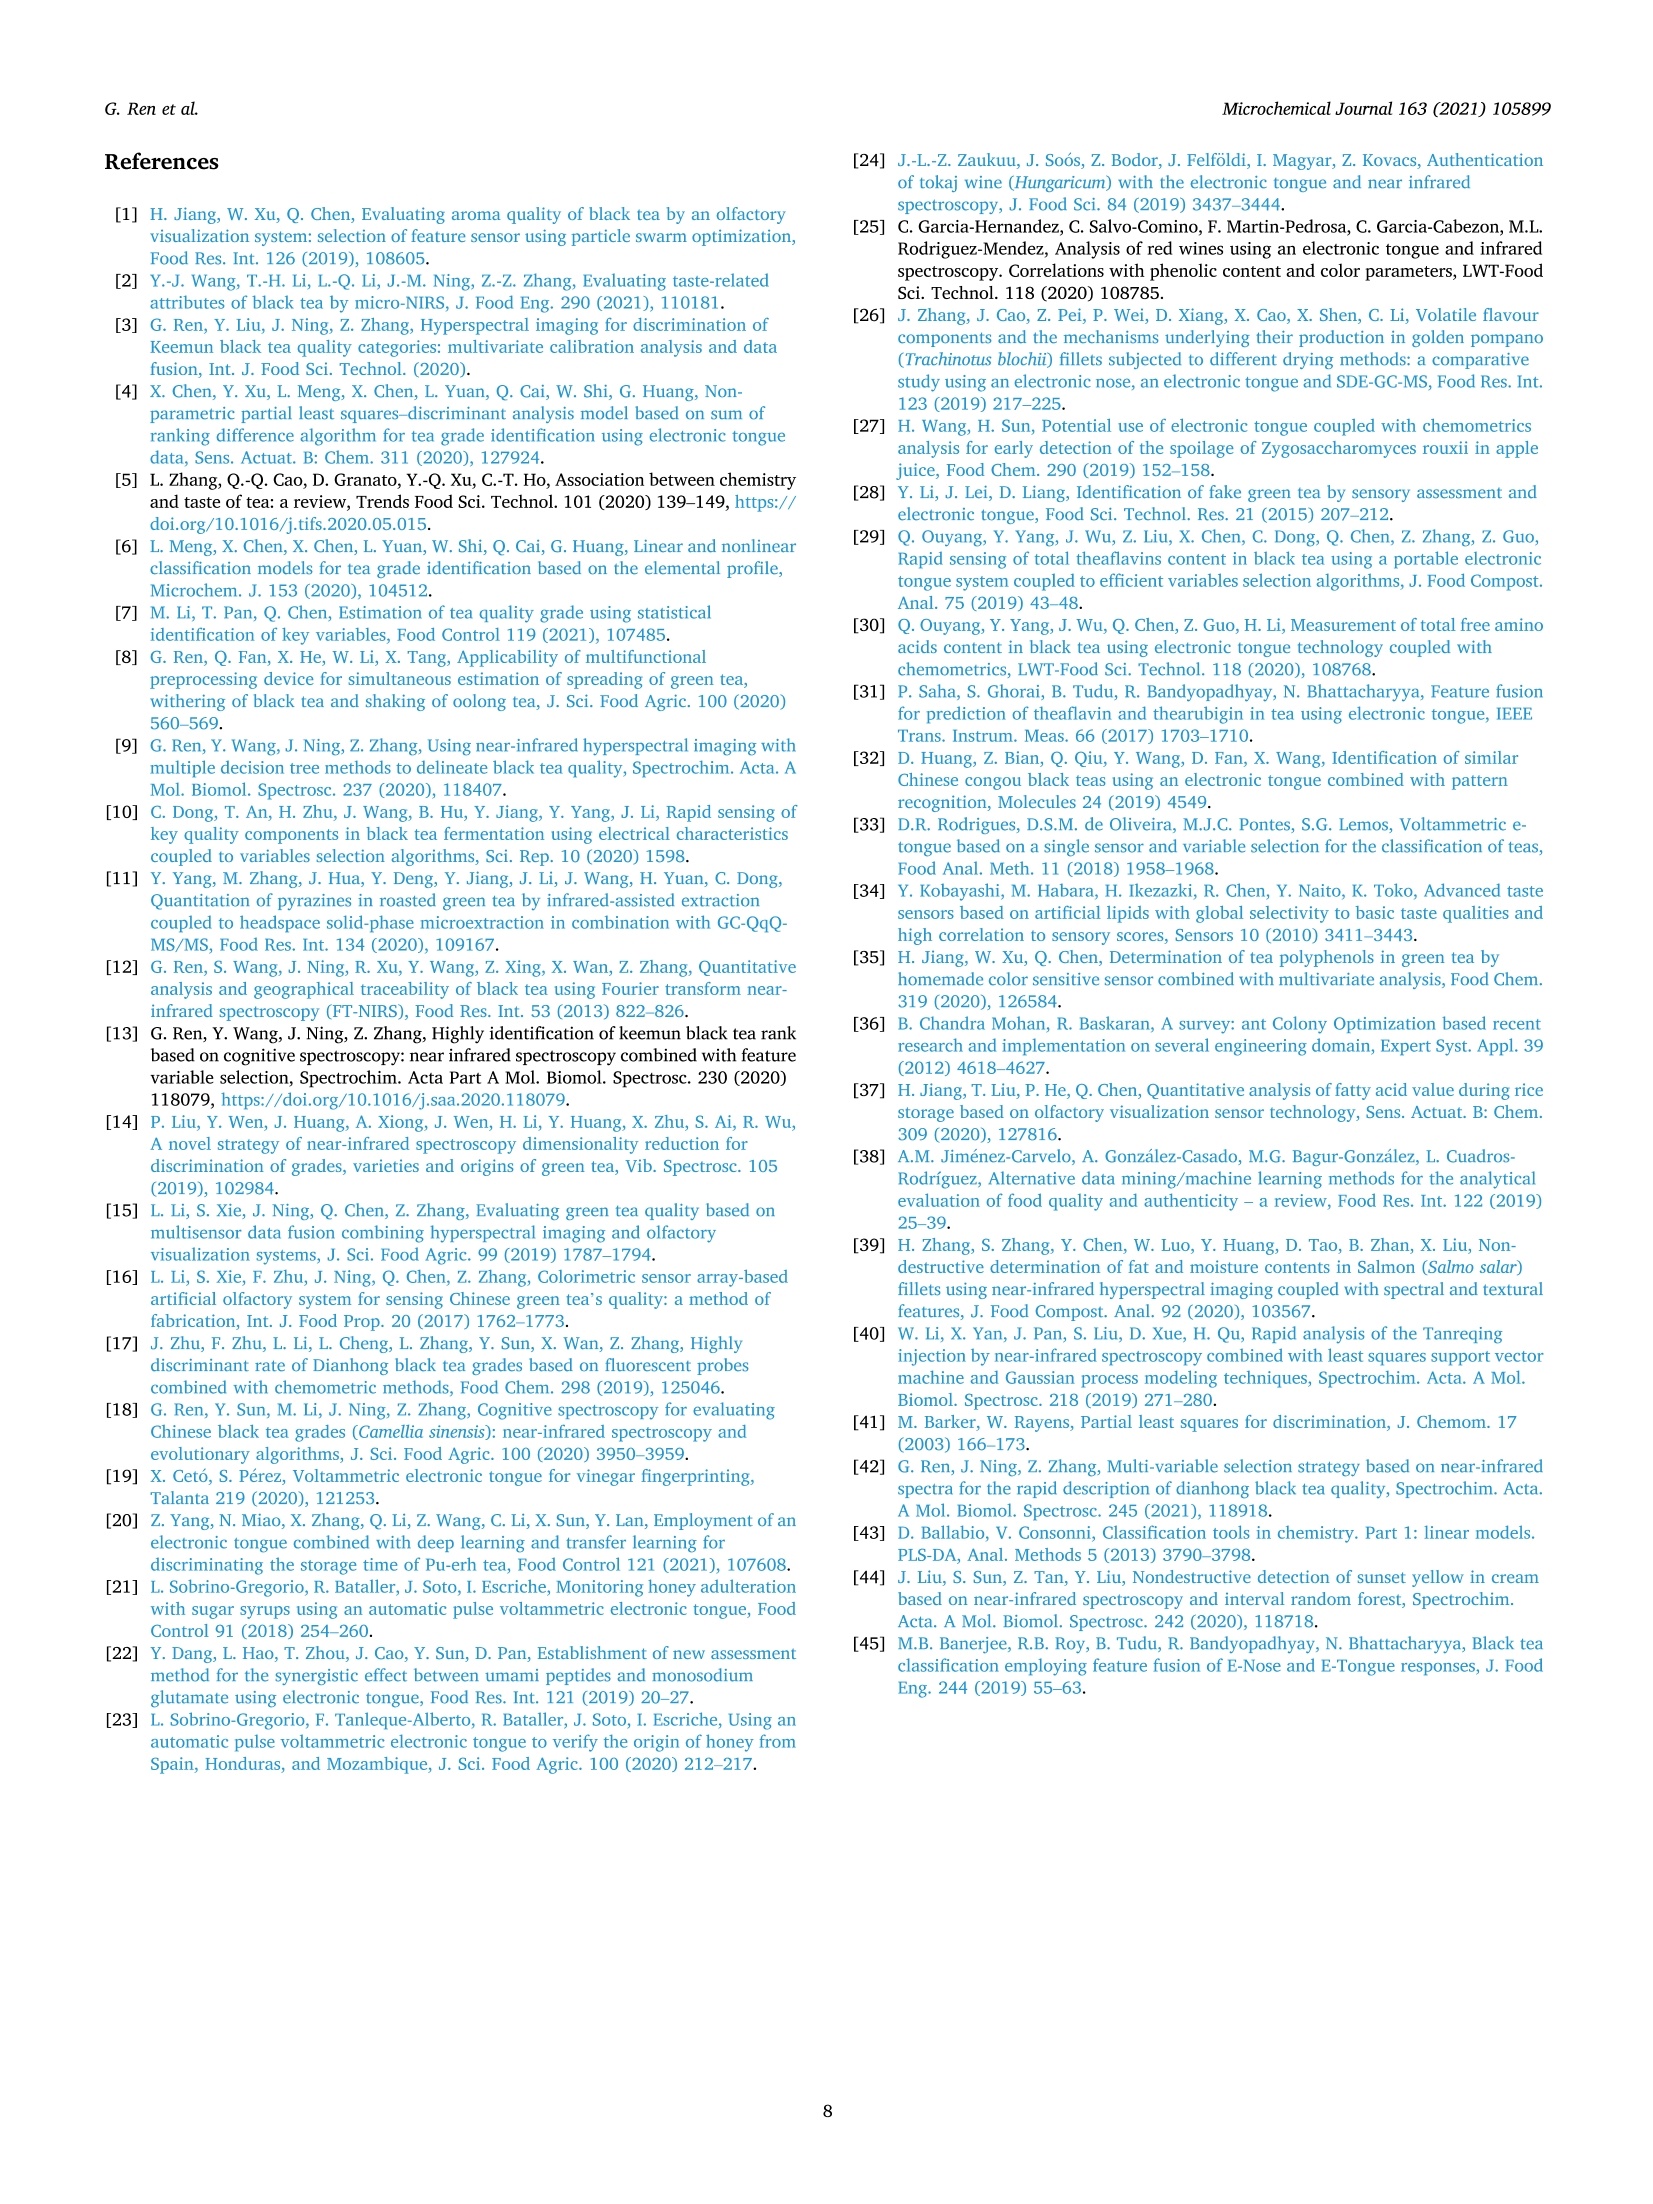
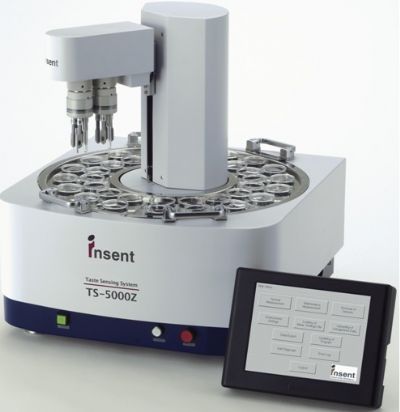
北京盈盛恒泰科技有限责任公司为您提供《工夫红茶中品质检测方案(感官智能分析)》,该方案主要用于茶叶中理化分析检测,参考标准--,《工夫红茶中品质检测方案(感官智能分析)》用到的仪器有日本INSENT味觉分析系统(电子舌)、电子舌
推荐专场
感官智能分析系统(电子鼻/电子舌)

相关方案
更多
该厂商其他方案
更多