


The evolution of texture and microstructure during plastic
deformation controls the bulk mechanical properties of
virtually all materials used to manufacture engineering
components and equipment. SEM based in-situ tensile/
compression testing allows investigating the onset of plastic
deformation as well as all intermediate deformation stages.
Microstructure and texture evolution can be quantified
when combining this technique with EBSD. The quantitative
results can then be used for refining the plastic deformation
theory as well as for confirming the existing simulation
models.
方案详情

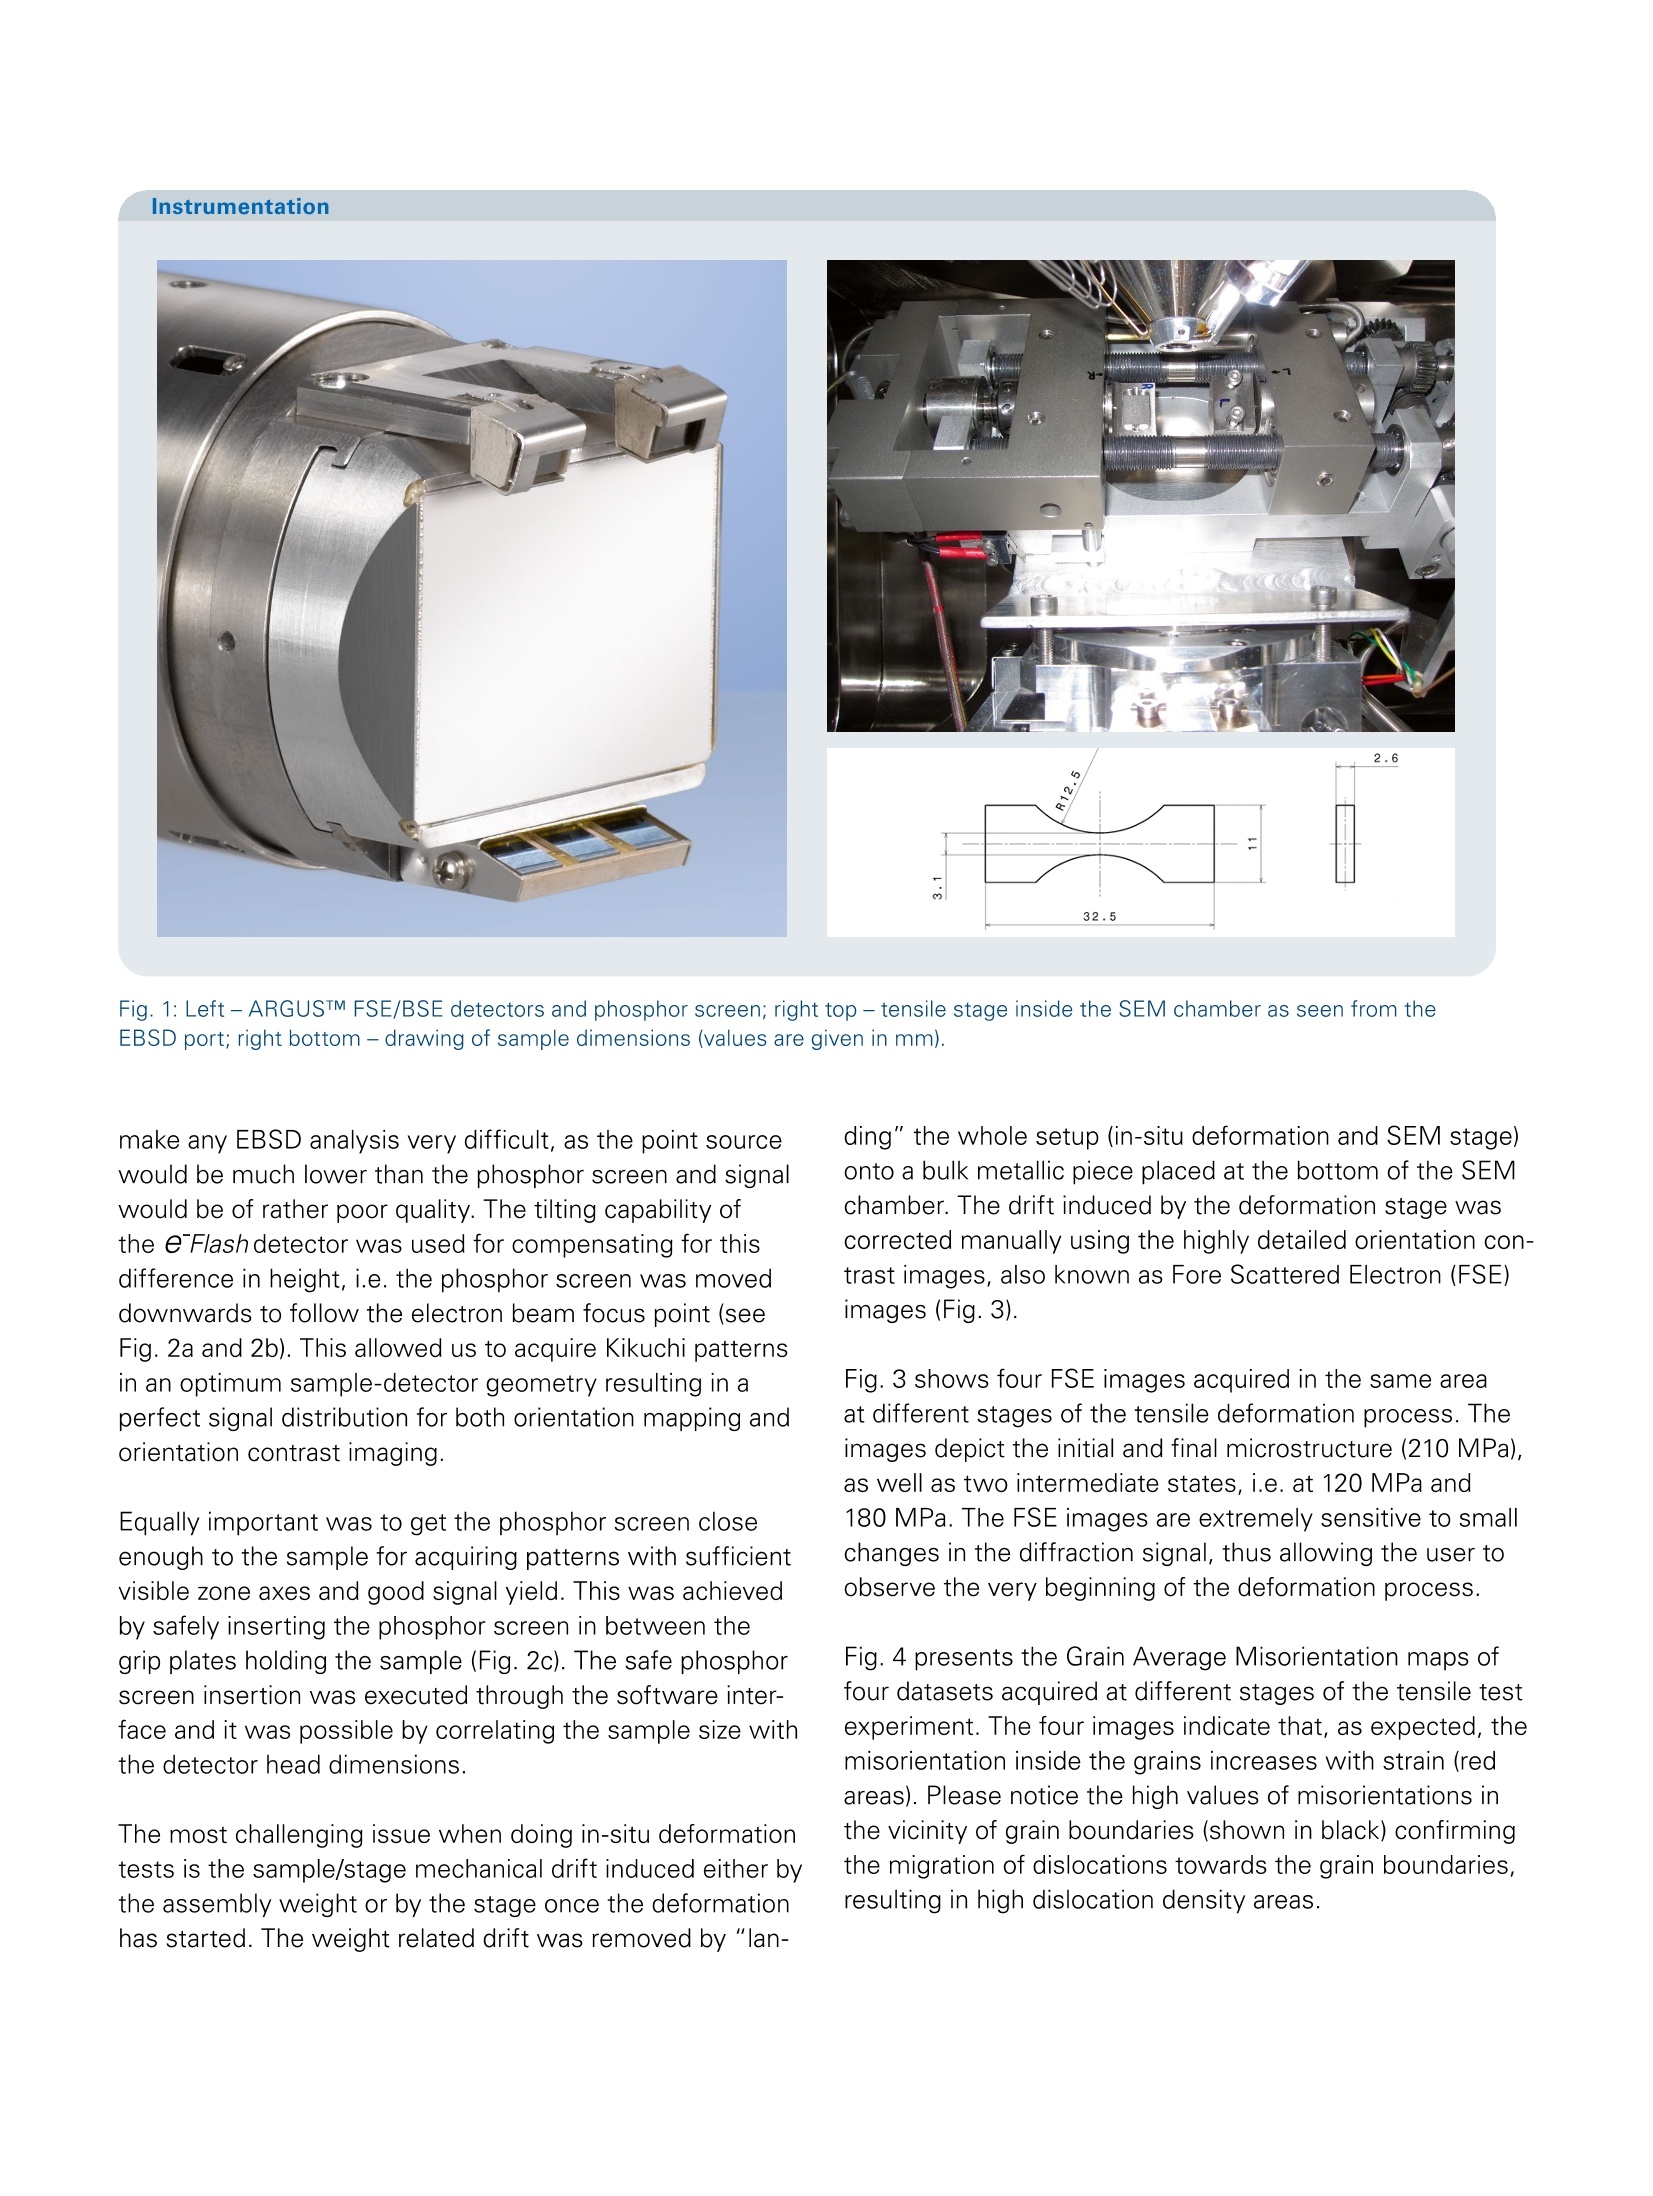
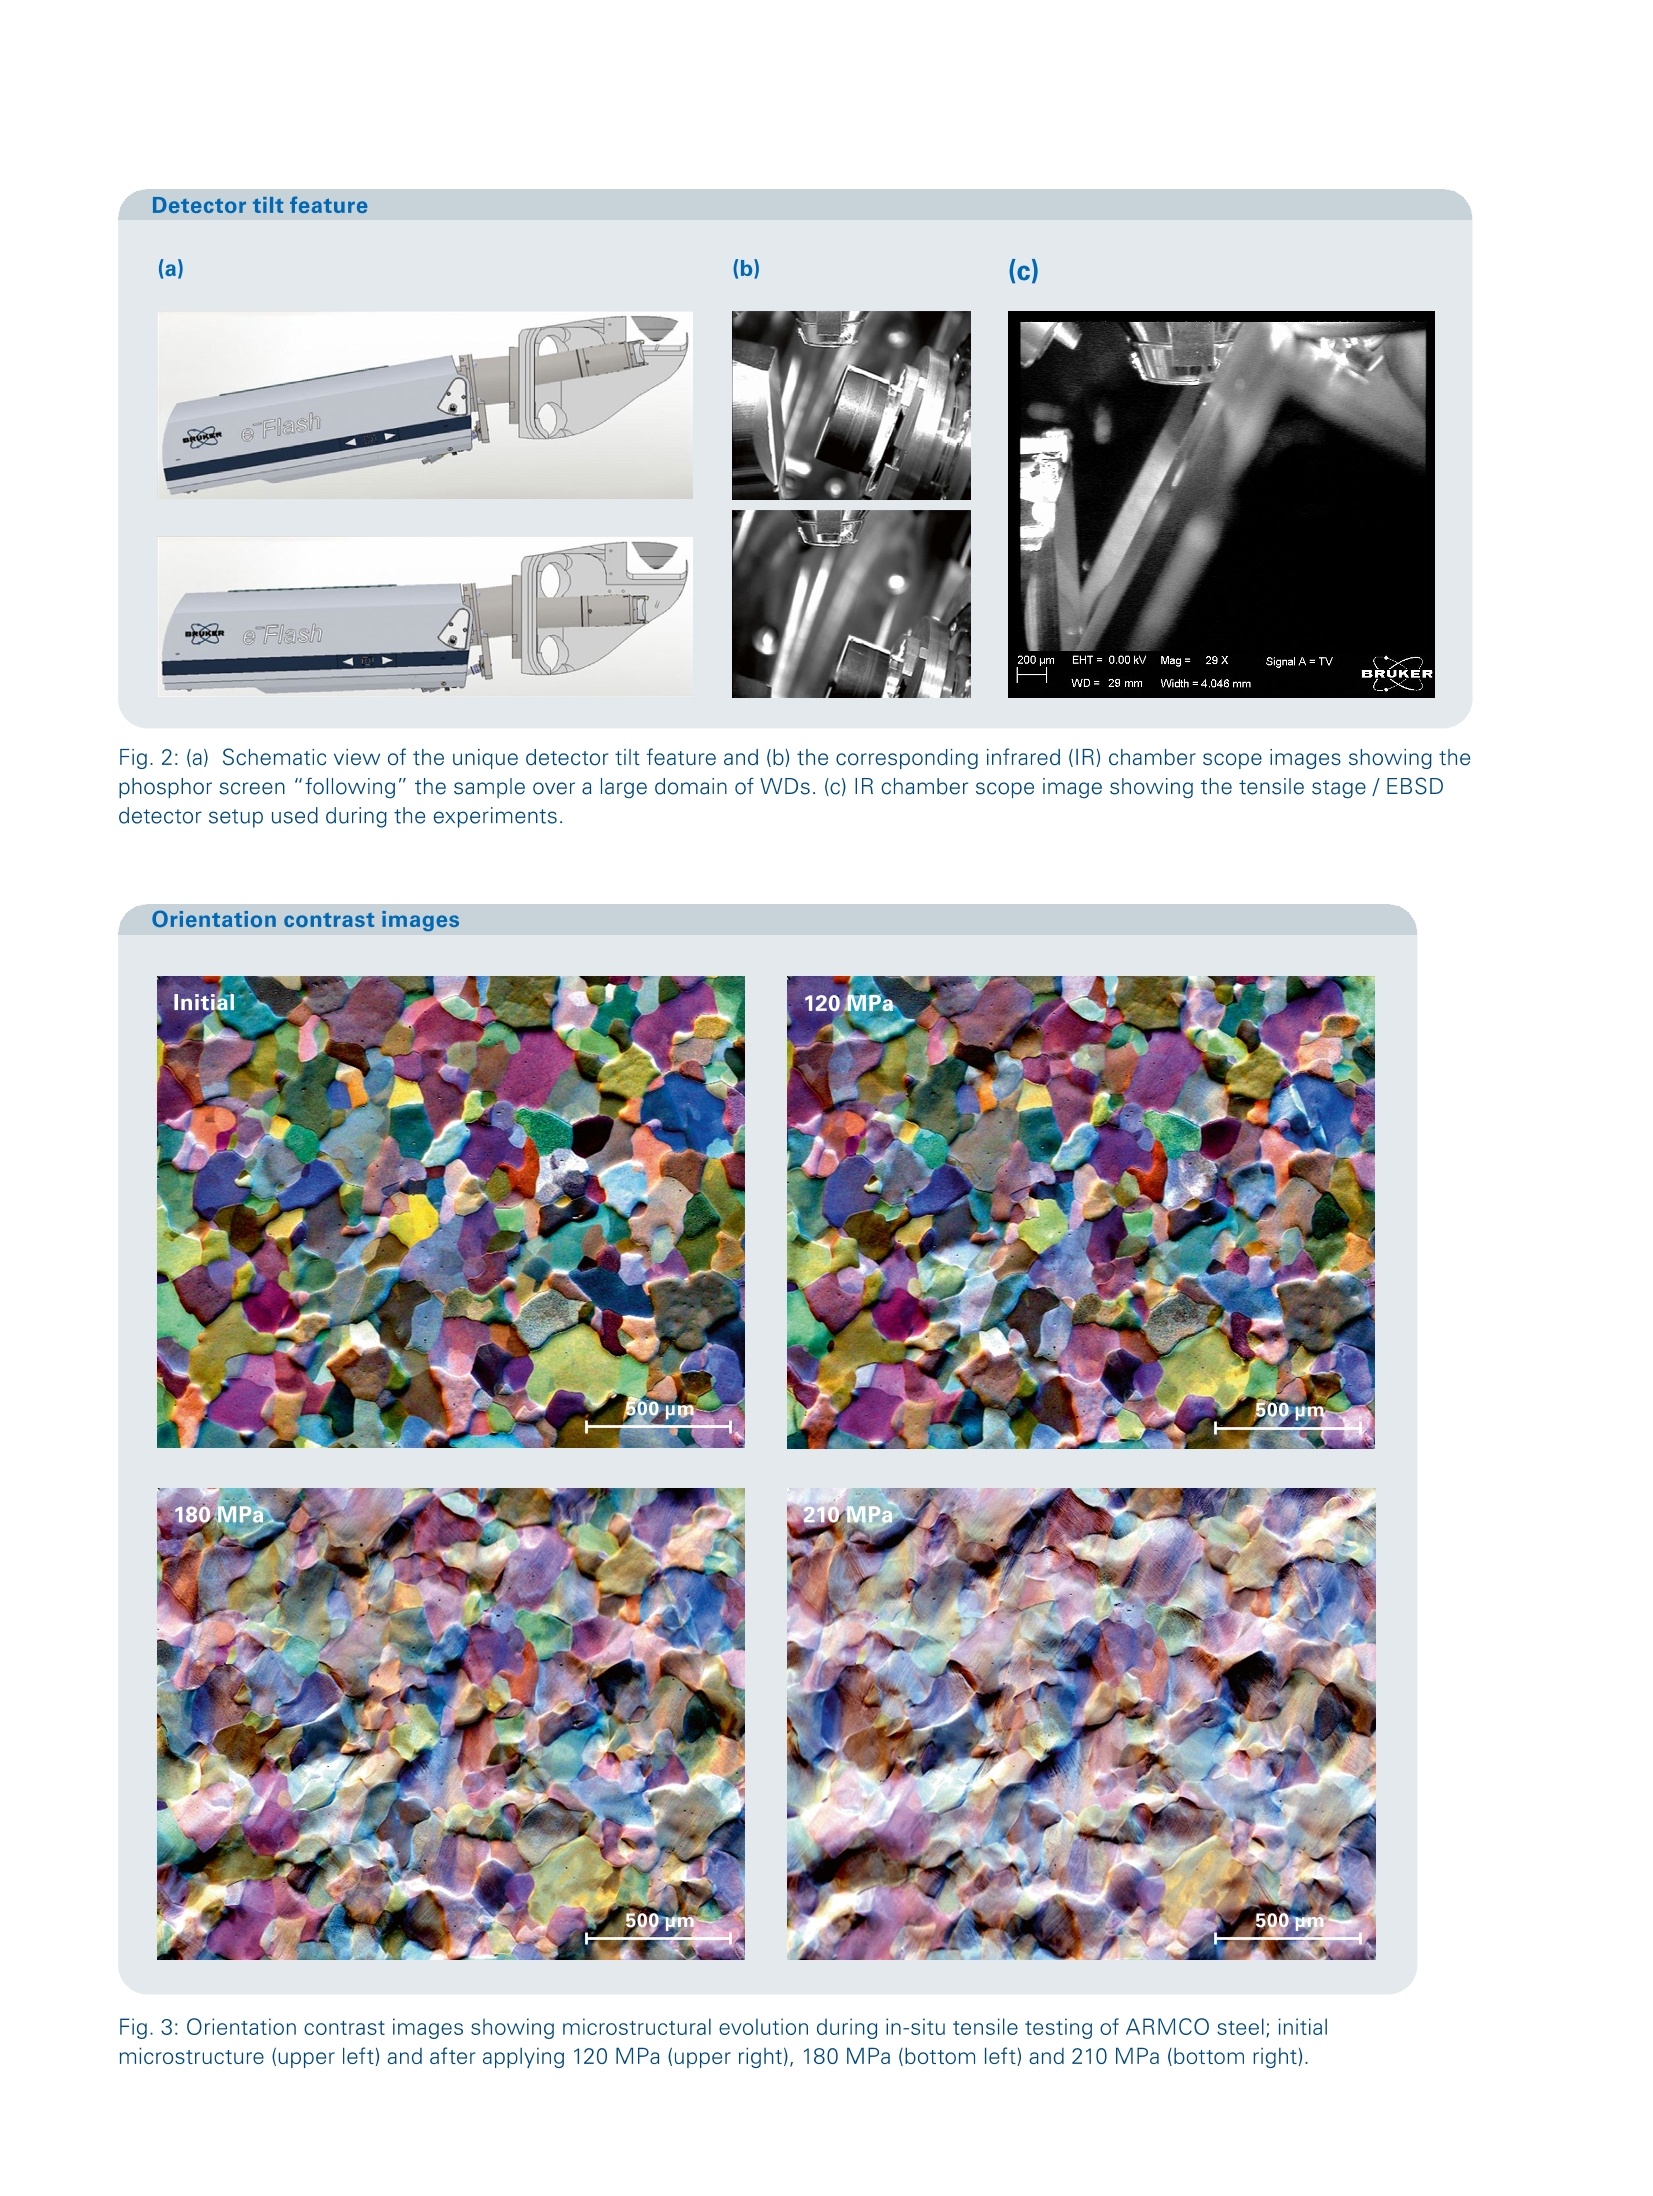
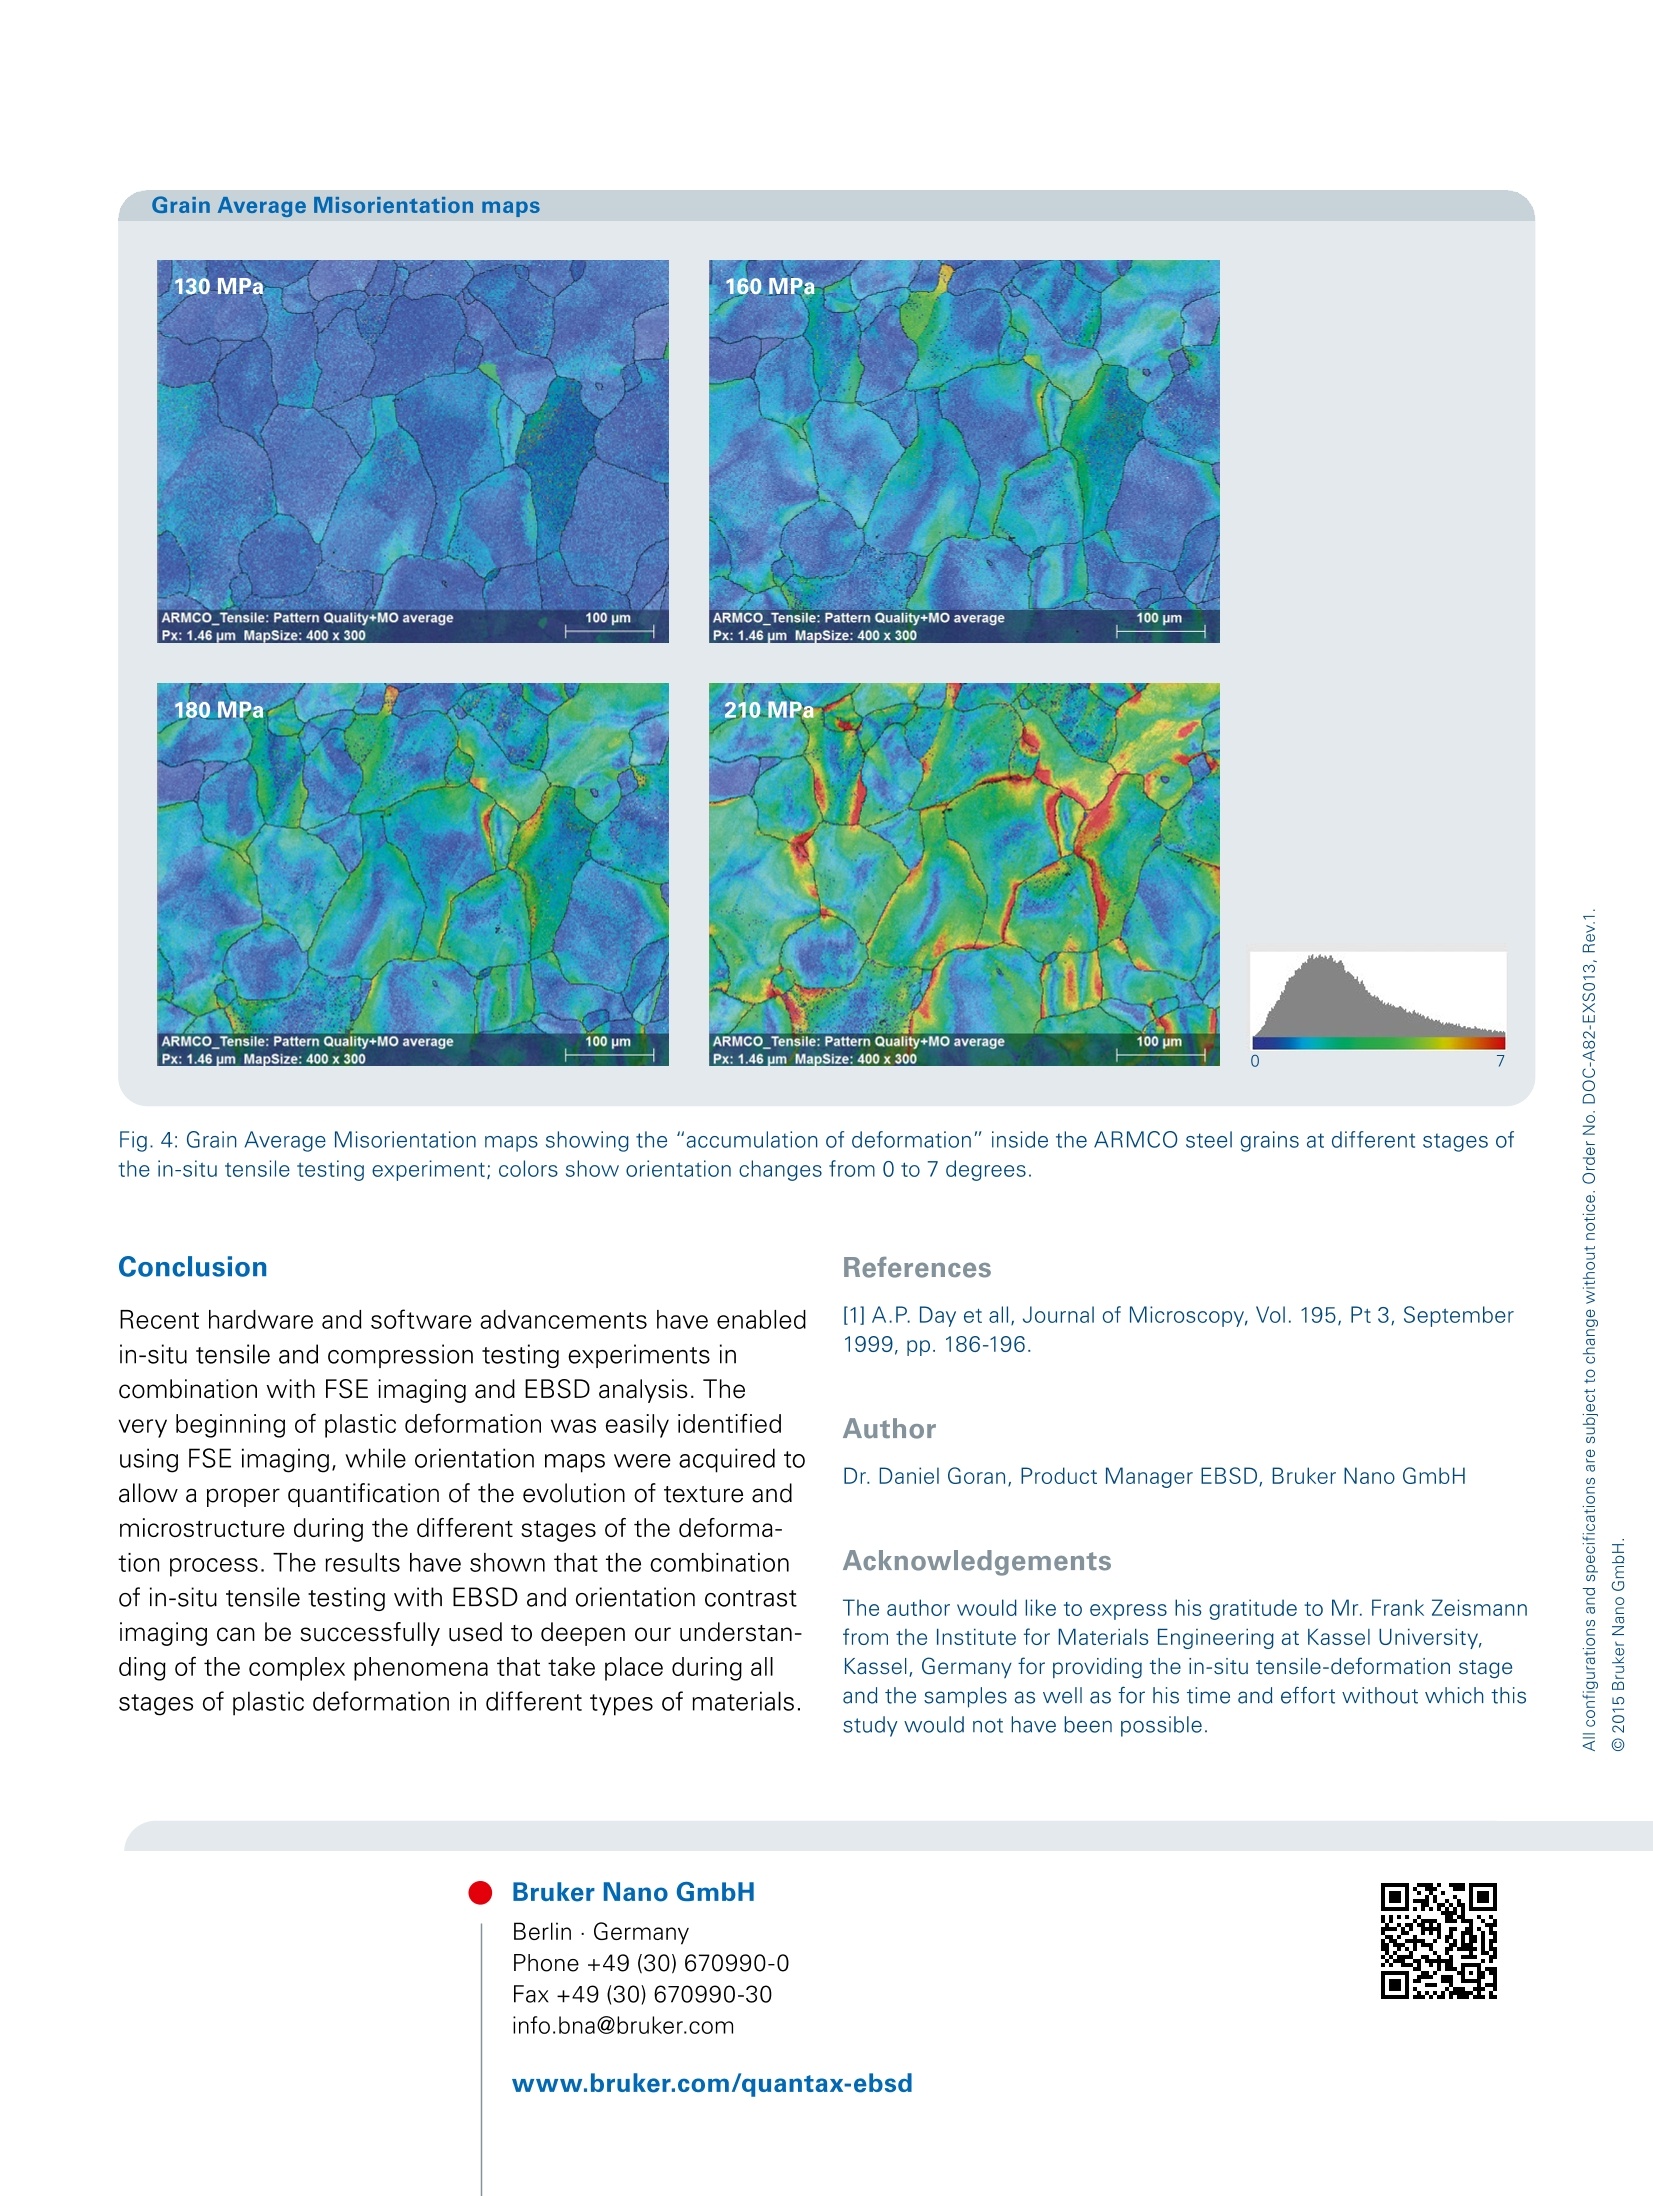
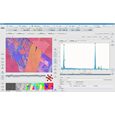
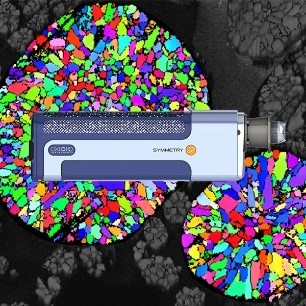
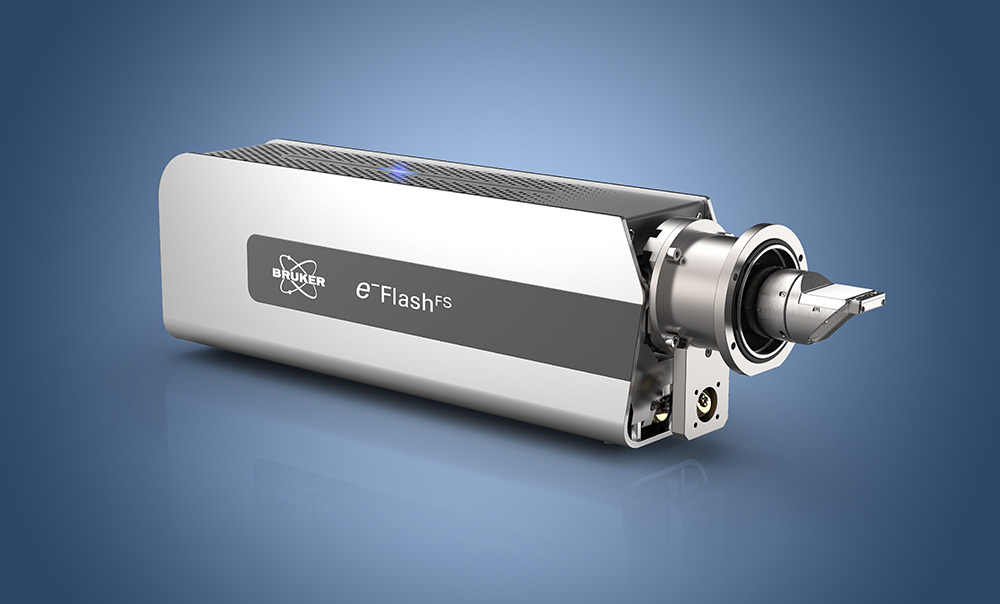
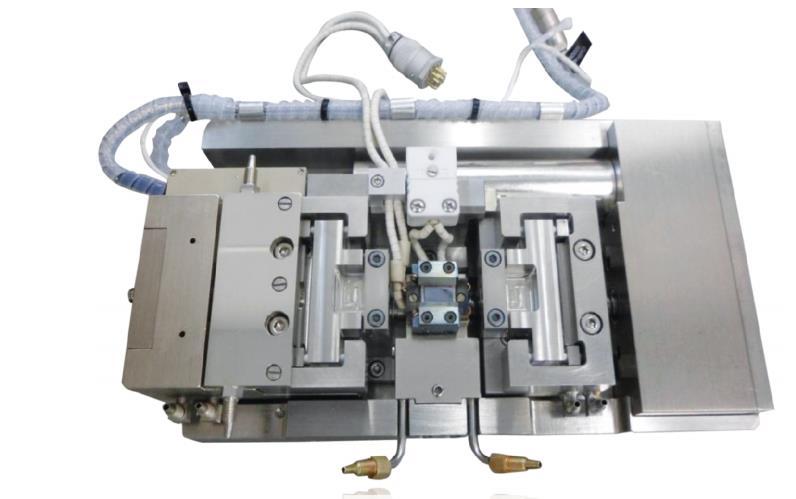
Instrumentation Orientation contrastimage Grain AverageMisorientation Detector alignment ARGUSTM Application Note # EBSD-02 Orientation contrast imaging and EBSDanalysis on materials deformed by in-situcompression and tensile testing The evolution of texture and microstructure during plasticdeformation controls the bulk mechanical properties ofvirtually all materials used to manufacture engineeringcomponents and equipment. SEM based in-situ tensile/compression testing allows investigating the onset of plasticdeformation as well as all intermediate deformation stages.Microstructure and texture evolution can be quantifiedwhen combining this technique with EBSD. The quantitativeresults can then be used for refining the plastic deformationtheory as well as for confirming the existing simulationmodels. In spite of its great potential for delivering extremely usefulexperimental information, the combination of the twotechniques is still not extensively used due to technicalchallenges posed by drift, hardware design limitations andacquisition time. While the acquisition time issue has beensolved with the introduction of high speed EBSD systems,other challenges still remain. This application note aimsat discussing these remaining issues while presentingexperimental results to prove the advantages of the recenthardware/software development advances. Experimental procedures and results The experiments were made using a ZEISS SUPRA 55VPFE-SEM and a 10 kN Kammrath & Weiss stage (see Fig.1)designed for in-situ tensile/compression tests at 70°tilt foroptimal EBSD signal. The evolution of texture and microstructure was characte-rized by EBSD and orientation contrastimaging using thee"FlashHR+high resolution EBSD detector and its integratecARGUSTM FSE/BSE imaging system, which features theunique capabilityof delivering colorcoded orientationcontrast images. For details on the color coded orientationcontrast imaging technique, please consult the paper byA.P. Day et all [1]. Samples with dimensions defined in thedrawing shown in Fig. 1 were cut from annealed ARMCOsteel with an average grain size of approx. 130 pm usingspark erosion. Due to the relatively large size of the power-ful in-situ tensile stage (maximum load of 10 kN) and to thespecial geometry required when performing EBSD analysis,the minimum possible working distance (WD) for scanningthe sample was 27 mm. A very high WD would normally Fig. 1: Left-ARGUSTM FSE/BSE detectors and phosphor screen; right top- tensile stage inside the SEM chamber as seen from theEBSD port; right bottom- drawing of sample dimensions (values are given in mm). make any EBSD analysis very difficult, as the point sourcewould be much lower than the phosphor screen and signalwould be of rather poor quality. The tilting capability ofthe e"Flash detector was used for compensating for thisdifference in height, i.e. the phosphor screen was moveddownwards to follow the electron beam focus point (seeFig. 2a and 2b). This allowed us to acquire Kikuchi patternsin an optimum sample-detector geometry resulting in aperfect signal distribution for both orientation mapping andorientation contrast imaging. Equally important was to get the phosphor screen closeenough to the sample for acquiring patterns with sufficientvisible zone axes and good signal yield. This was achievedby safely inserting the phosphor screen in between thegrip plates holding the sample (Fig. 2c). The safe phosphorscreen insertion was executed through the software inter-face and it was possible by correlating the sample size withthe detector head dimensions. The most challenging issue when doing in-situ deformationtests is the sample/stage mechanical drift induced either bythe assembly weight or by the stage once the deformationhas started. The weight related drift was removed by “lan- ding" the whole setup (in-situ deformation and SEM stage)onto a bulk metallic piece placed at the bottom of the SEMchamber. The drift induced by the deformation stage wascorrected manually using the highly detailed orientation con-trast images, also known as Fore Scattered Electron (FSE)images (Fig.3). Fig. 3 shows four FSE images acquired in the same areaat different stages of the tensile deformation process. Theimages depict the initial and final microstructure (210MPa)as well as two intermediate states, i.e. at 120 MPa and180 MPa. The FSE images are extremely sensitive to smallchanges in the diffraction signal, thus allowing the user toobserve the very beginning of the deformation process. Fig. 4 presents the Grain Average Misorientation maps offour datasets acquired at different stages of the tensile testexperiment. The four images indicate that, as expected, themisorientation inside the grains increases with strain (redareas). Please notice the high values of misorientations inthe vicinity of grain boundaries (shown in black) confirmingthe migration of dislocations towards the grain boundaries,resulting in high dislocation density areas. Detector tilt feature Fig. 2: (a) Schematic view of the unique detector tilt feature and (b) the corresponding infrared (IR) chamber scope images showing thephosphor screen“following" the sample over a large domain of WDs. (c) IR chamber scope image showing the tensile stage / EBSDdetector setup used during the experiments. Orientation contrast images Fig. 3: Orientation contrast images showing microstructural evolution during in-situ tensile testing of ARMCO steel; initialmicrostructure (upper left) and after applying 120 MPa (upper right), 180 MPa (bottom left) and 210 MPa (bottom right). Fig. 4: Grain Average Misorientation maps showing the "accumulation of deformation"inside the ARMCO steel grains at different stages ofthe in-situ tensile testing experiment; colors show orientation changes from 0 to 7 degrees. Conclusion Recent hardware and software advancements have enabledin-situ tensile and compression testing experiments incombination with FSE imaging and EBSD analysis. Thevery beginning of plastic deformation was easily identifiedusing FSE imaging, while orientation maps were acquired toallow a proper quantification of the evolution of texture andmicrostructure during the different stages of the deforma-tion process. The results have shown that the combinationof in-situ tensile testing with EBSD and orientation contrastimaging can be successfully used to deepen our understan-ding of the complex phenomena that take place during allstages of plastic deformation in different types of materials. References [1] A.P. Day et all, Journal of Microscopy, Vol. 195, Pt 3, September1999, pp.186-196. Author Dr. Daniel Goran, Product Manager EBSD, Bruker Nano GmbH Acknowledgements The author would like to express his gratitude to Mr. Frank Zeismannfrom the Institute for Materials Engineering at Kassel University,Kassel, Germany for providing the in-situ tensile-deformation stageand the samples as well as for his time and effort without which thisstudy would not have been possible. Bruker Nano GmbH Berlin· GermanyPhone +49 (30)670990-0Fax +49 (30)670990-30 info.bna@bruker.com in-situ tensile and compression testing experiments incombination with FSE imaging and EBSD analysis. Thevery beginning of plastic deformation was easily identifiedusing FSE imaging, while orientation maps were acquired toallow a proper quantification of the evolution of texture andmicrostructure during the different stages of the deformationprocess. The results have shown that the combinationof in-situ tensile testing with EBSD and orientation contrastimaging can be successfully used to deepen our understandingof the complex phenomena that take place during allstages of plastic deformation in different types of materials.
确定

还剩2页未读,是否继续阅读?

产品配置单

布鲁克电子显微纳米分析仪器部为您提供《钢铁中元素含量检测方案(EBSD系统)》,该方案主要用于粗钢中含量分析检测,参考标准--,《钢铁中元素含量检测方案(EBSD系统)》用到的仪器有布鲁克 电子背散射衍射仪 EBSD、布鲁克扫描电镜专用原位纳米力学测试系统PI 88、布鲁克 ESPRIT 四合一分析软件
推荐专场

相关方案
更多