


方案详情
文
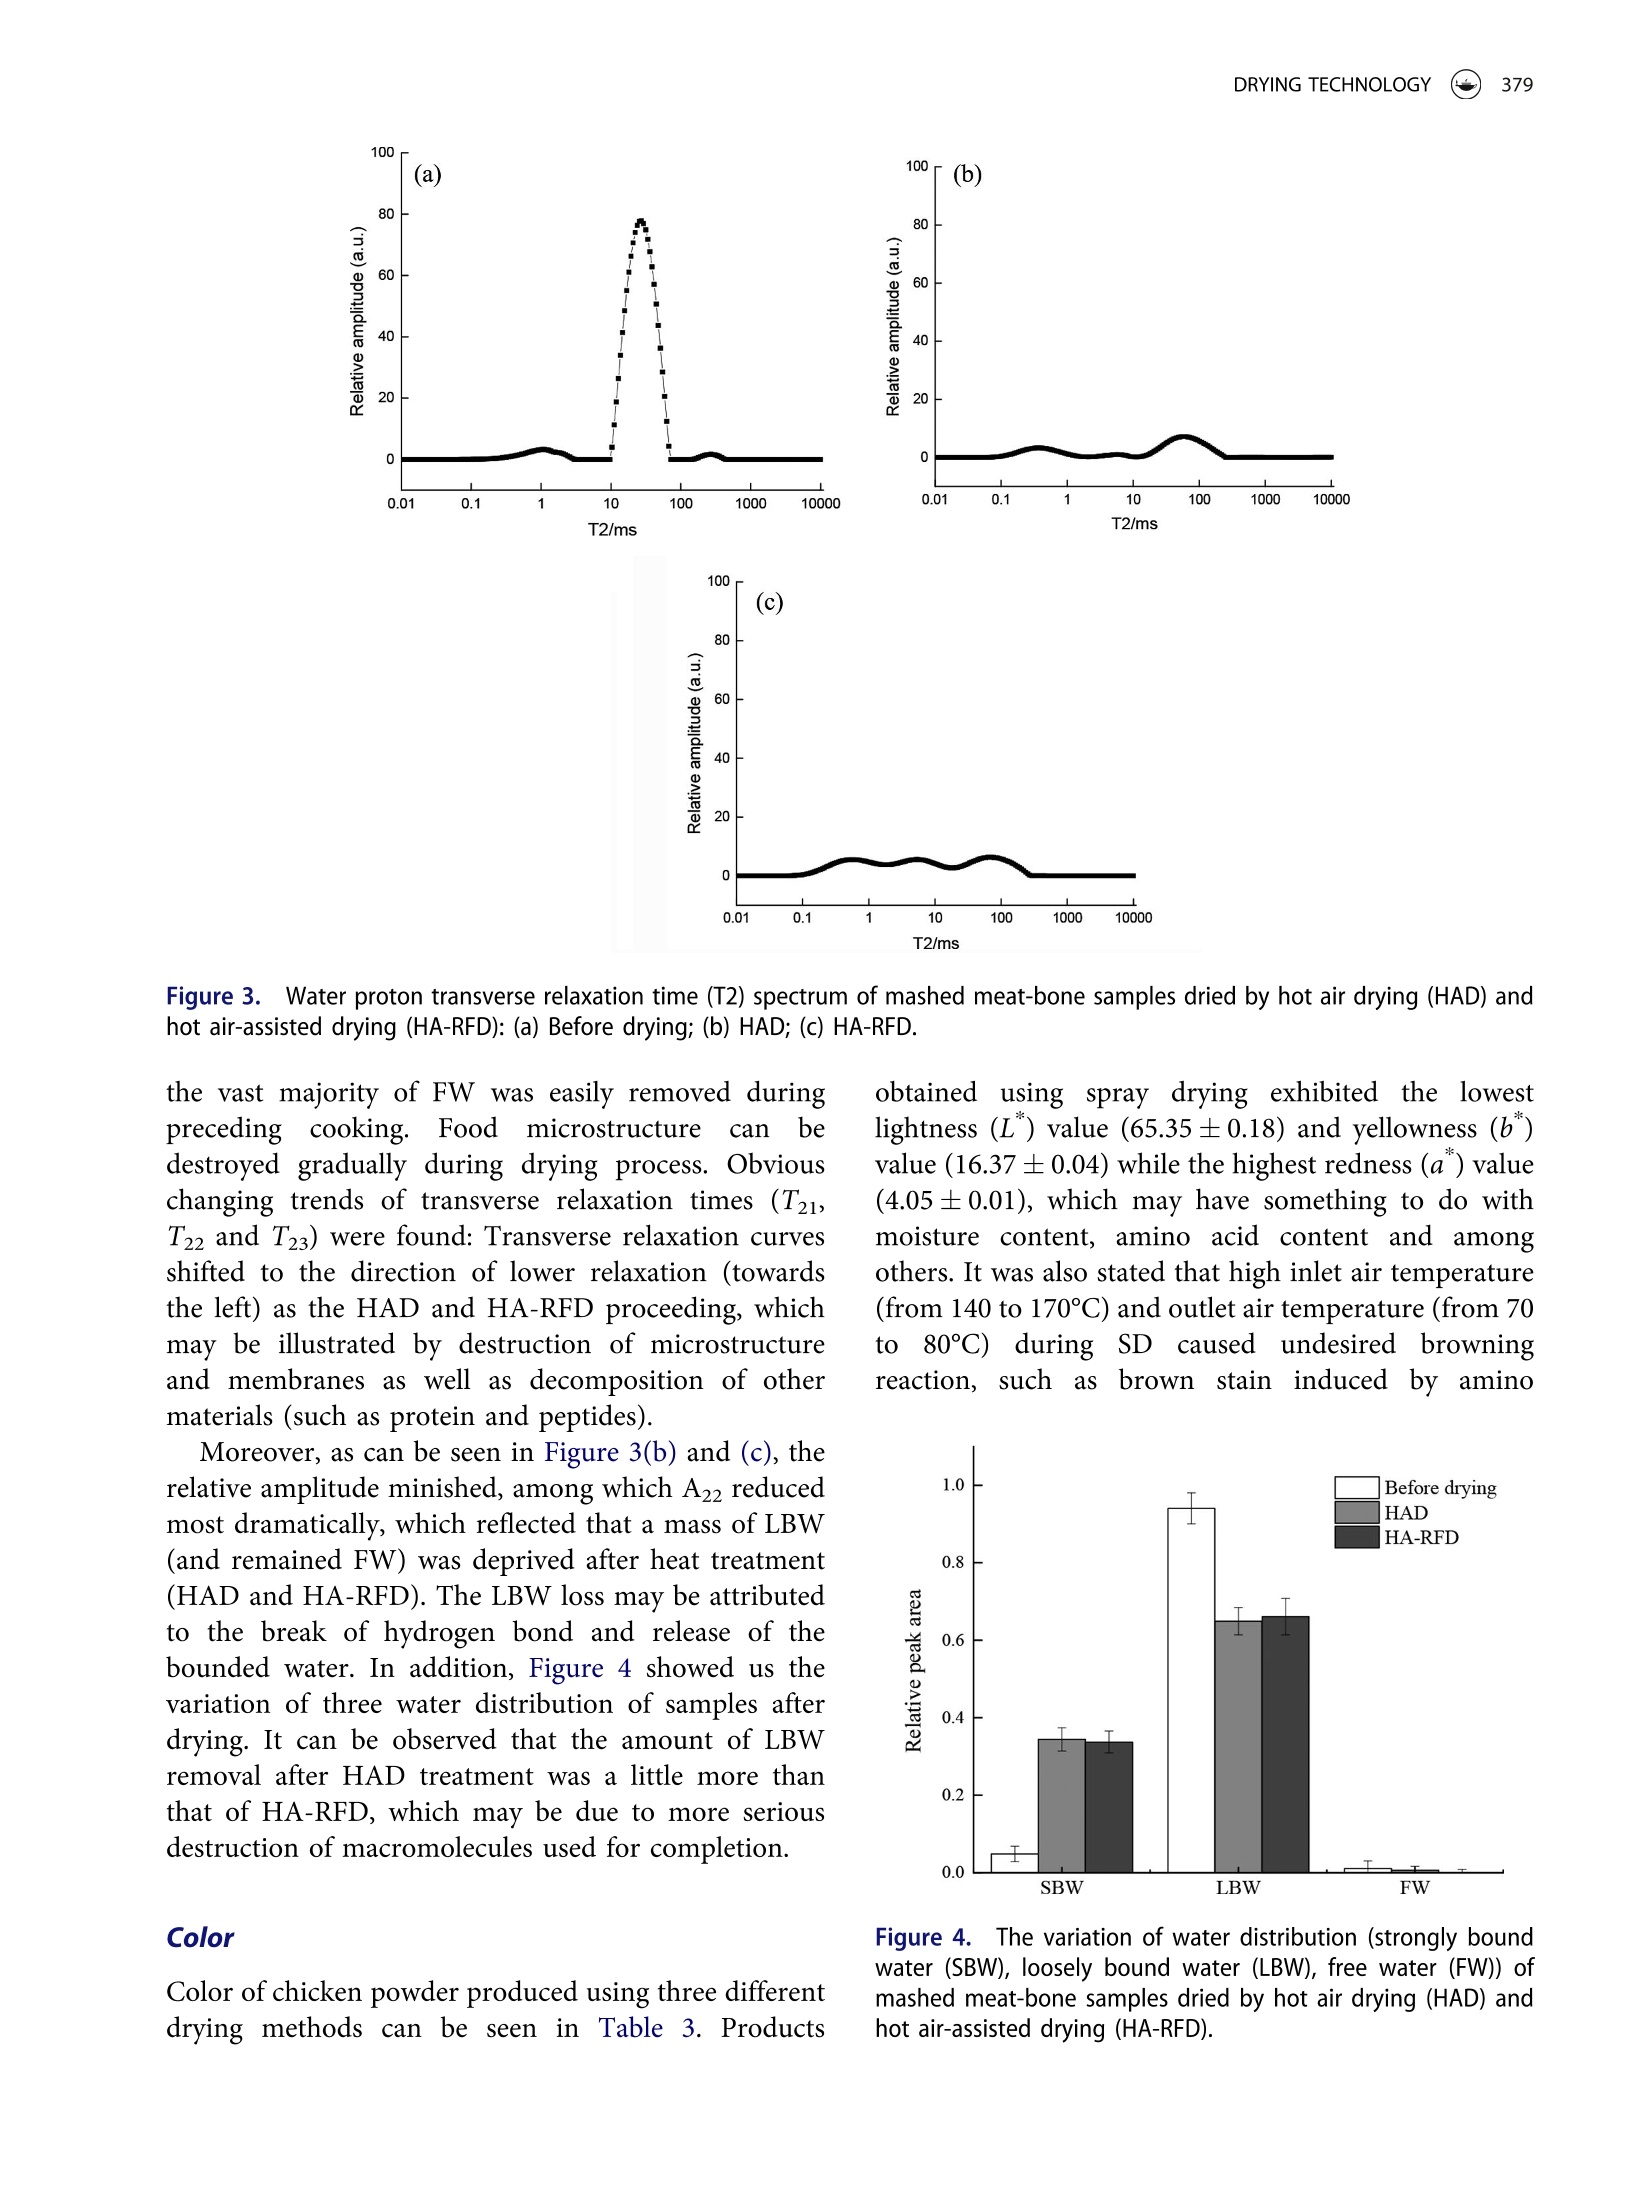
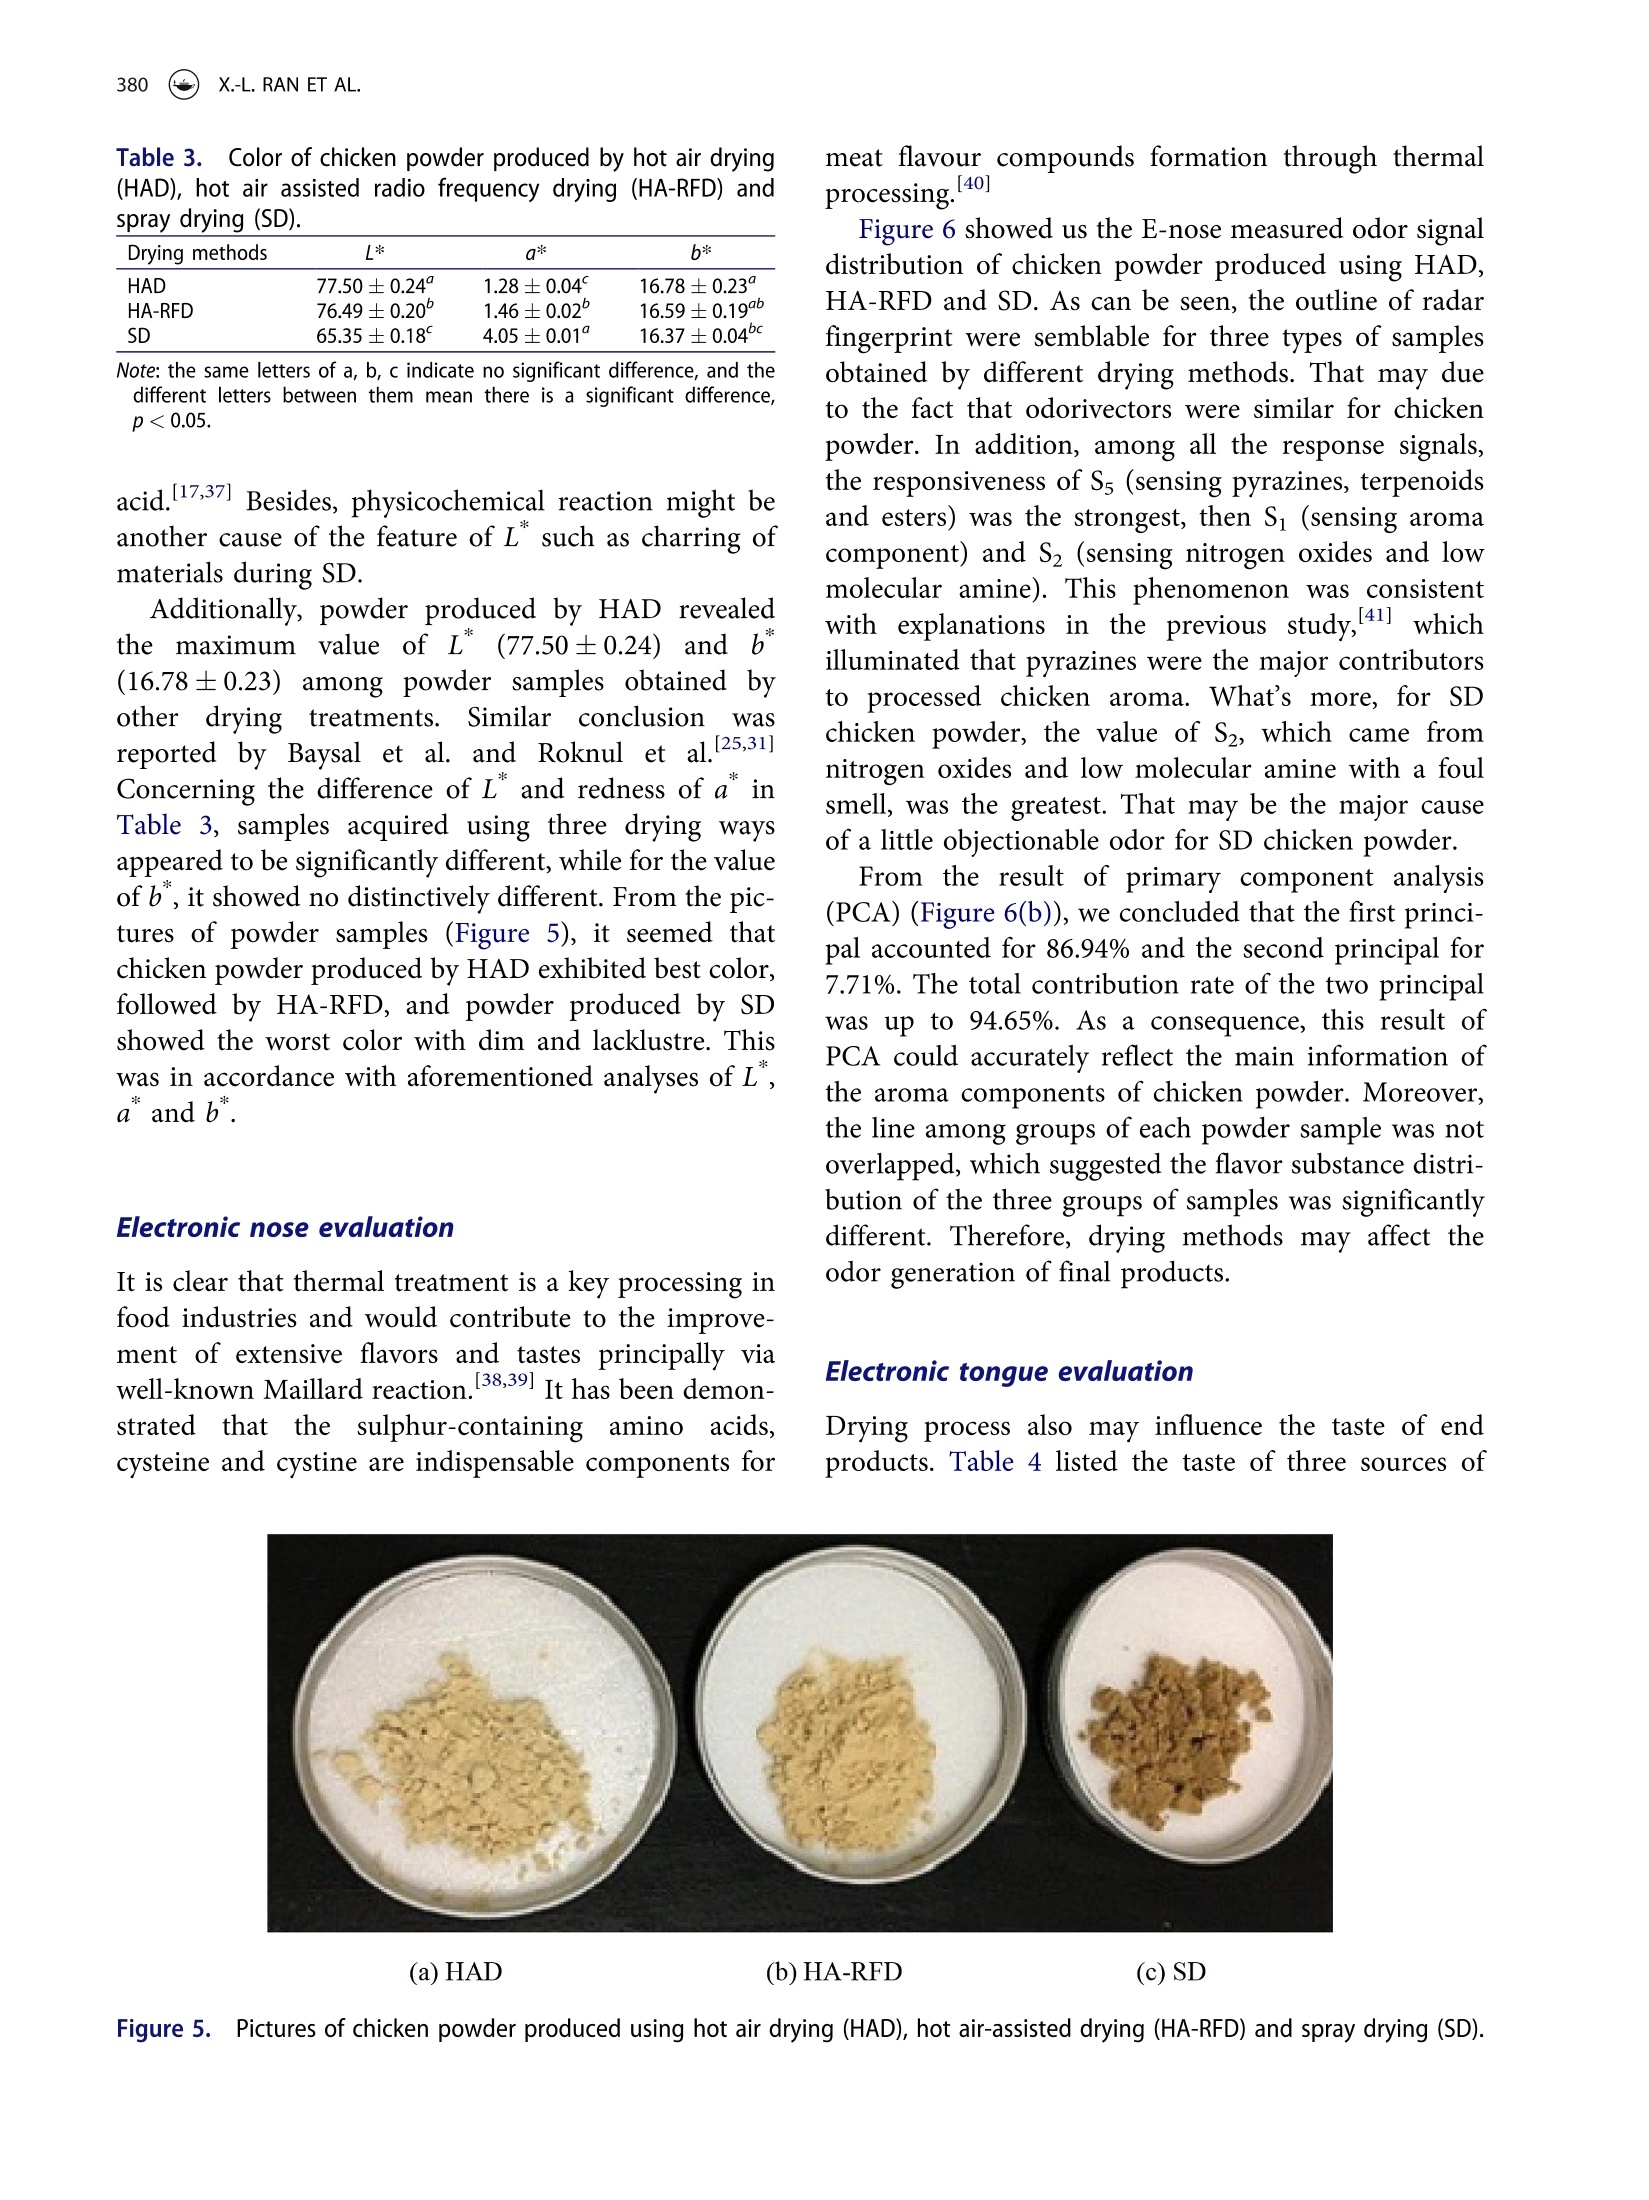
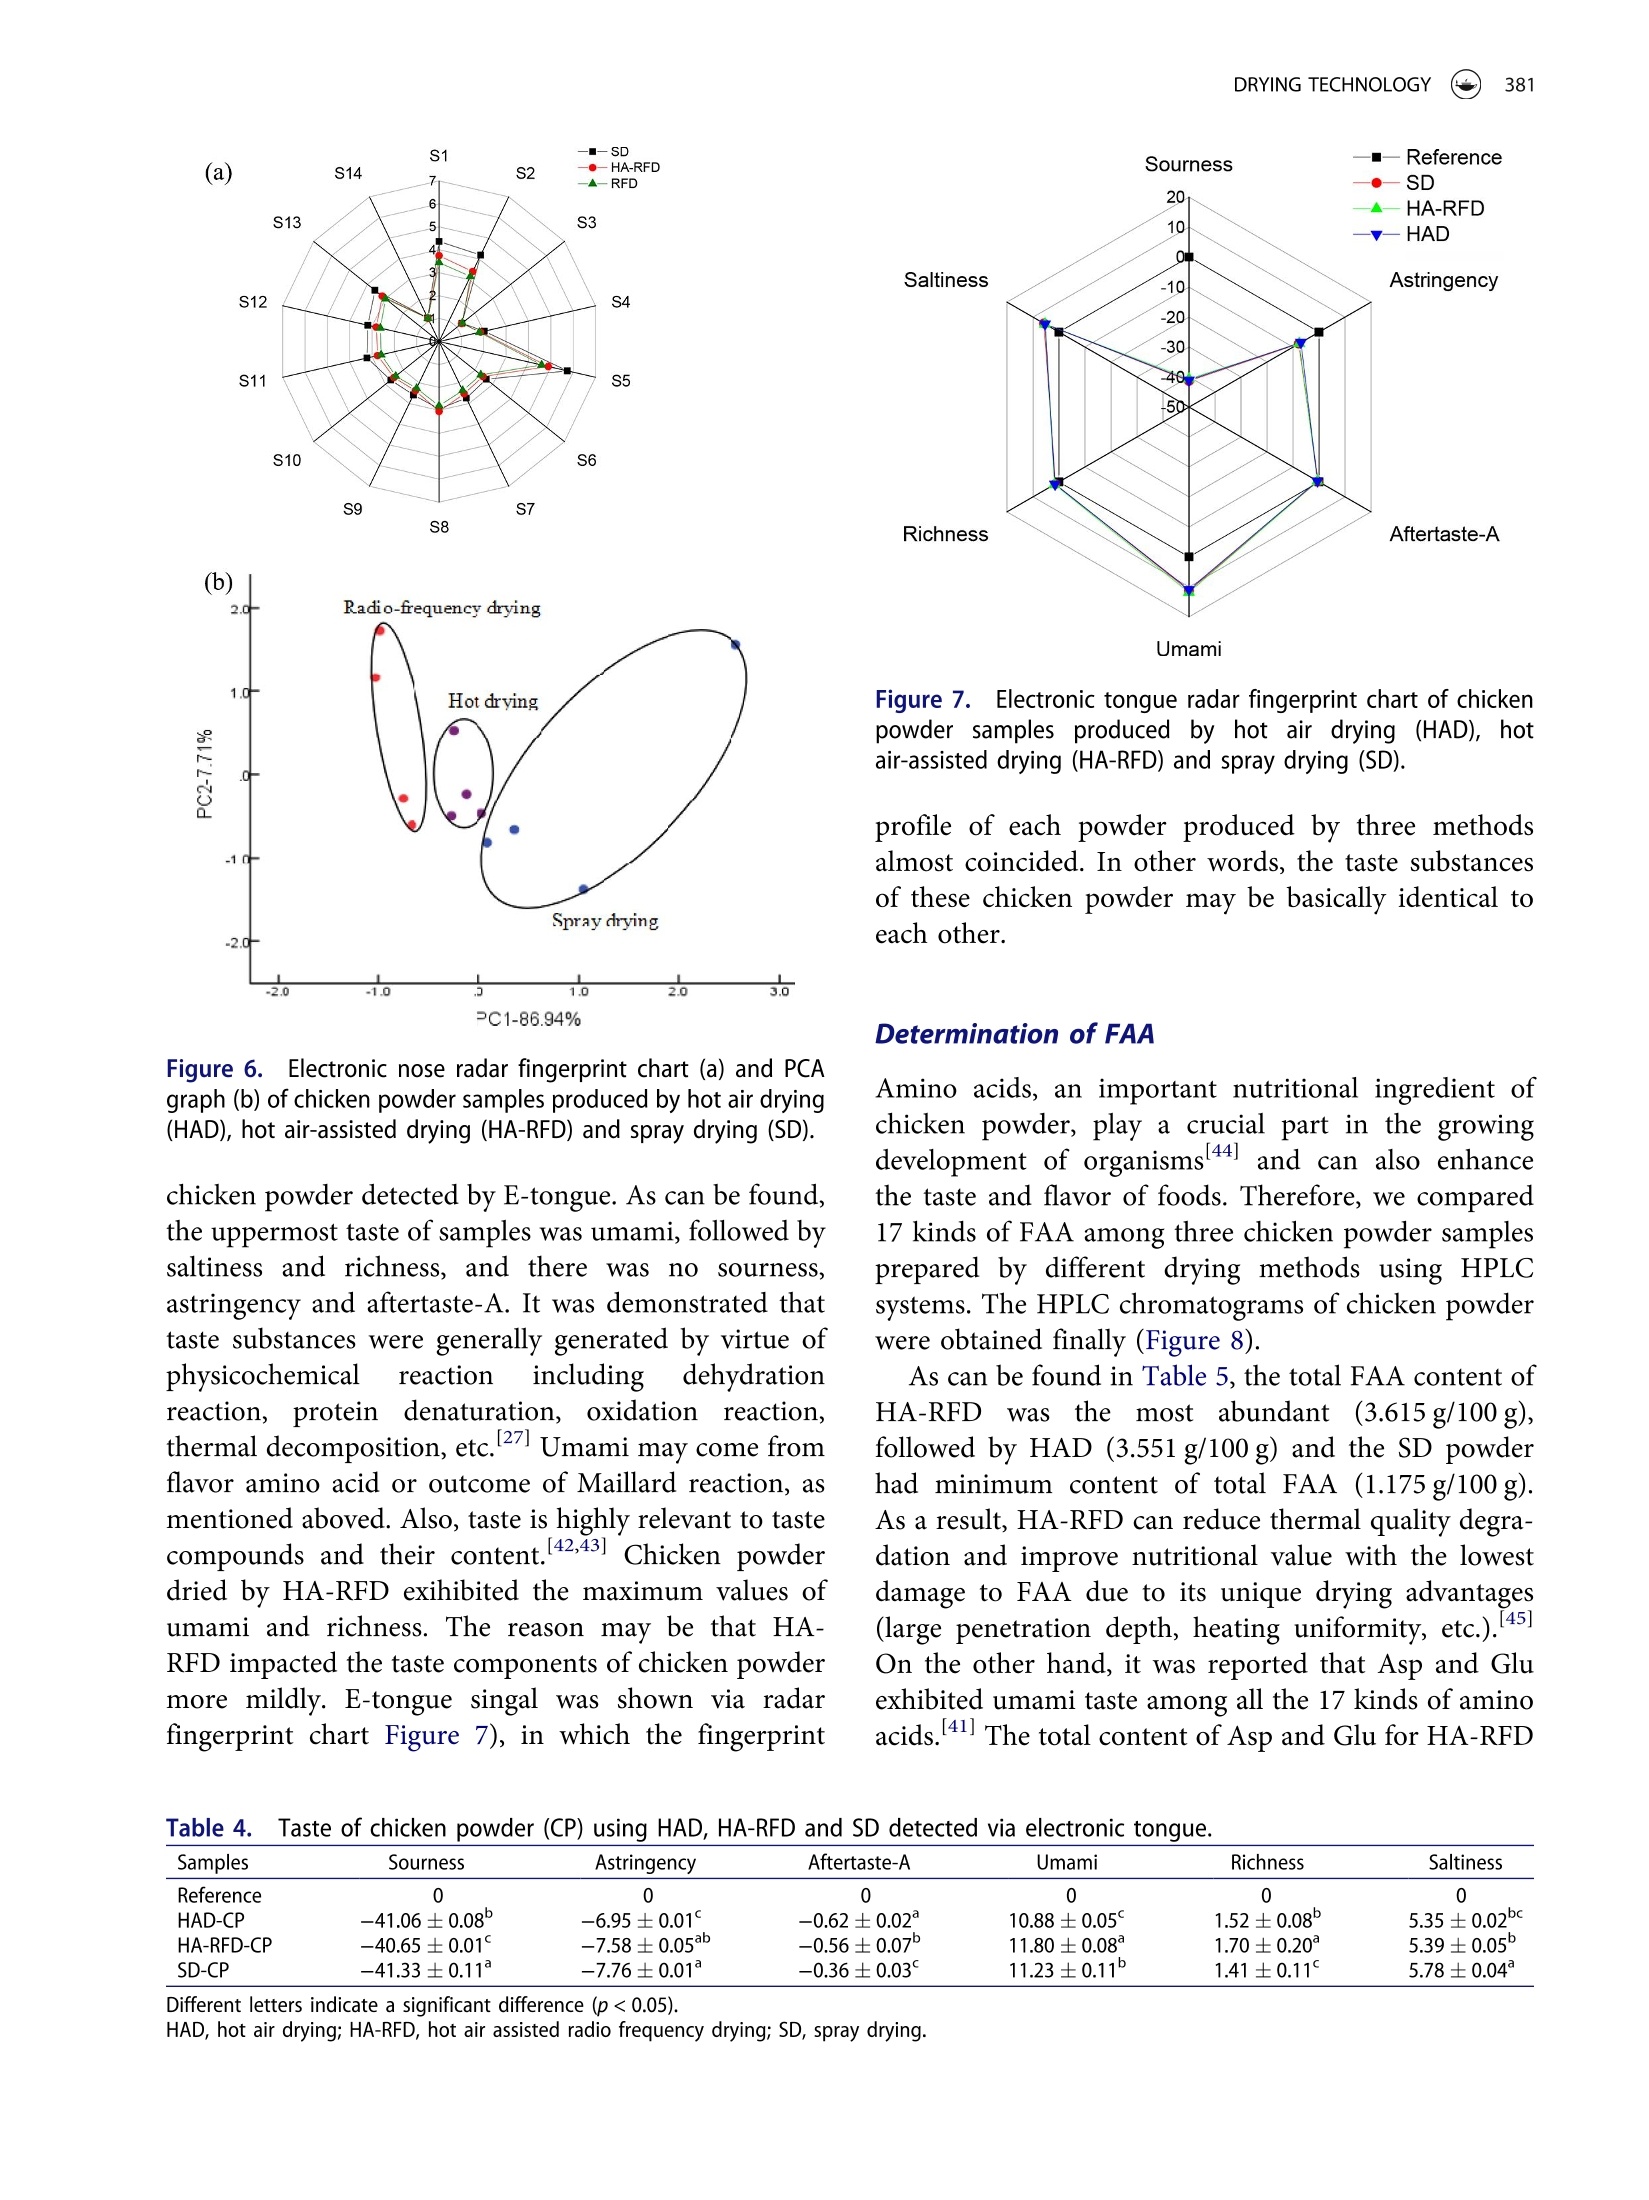
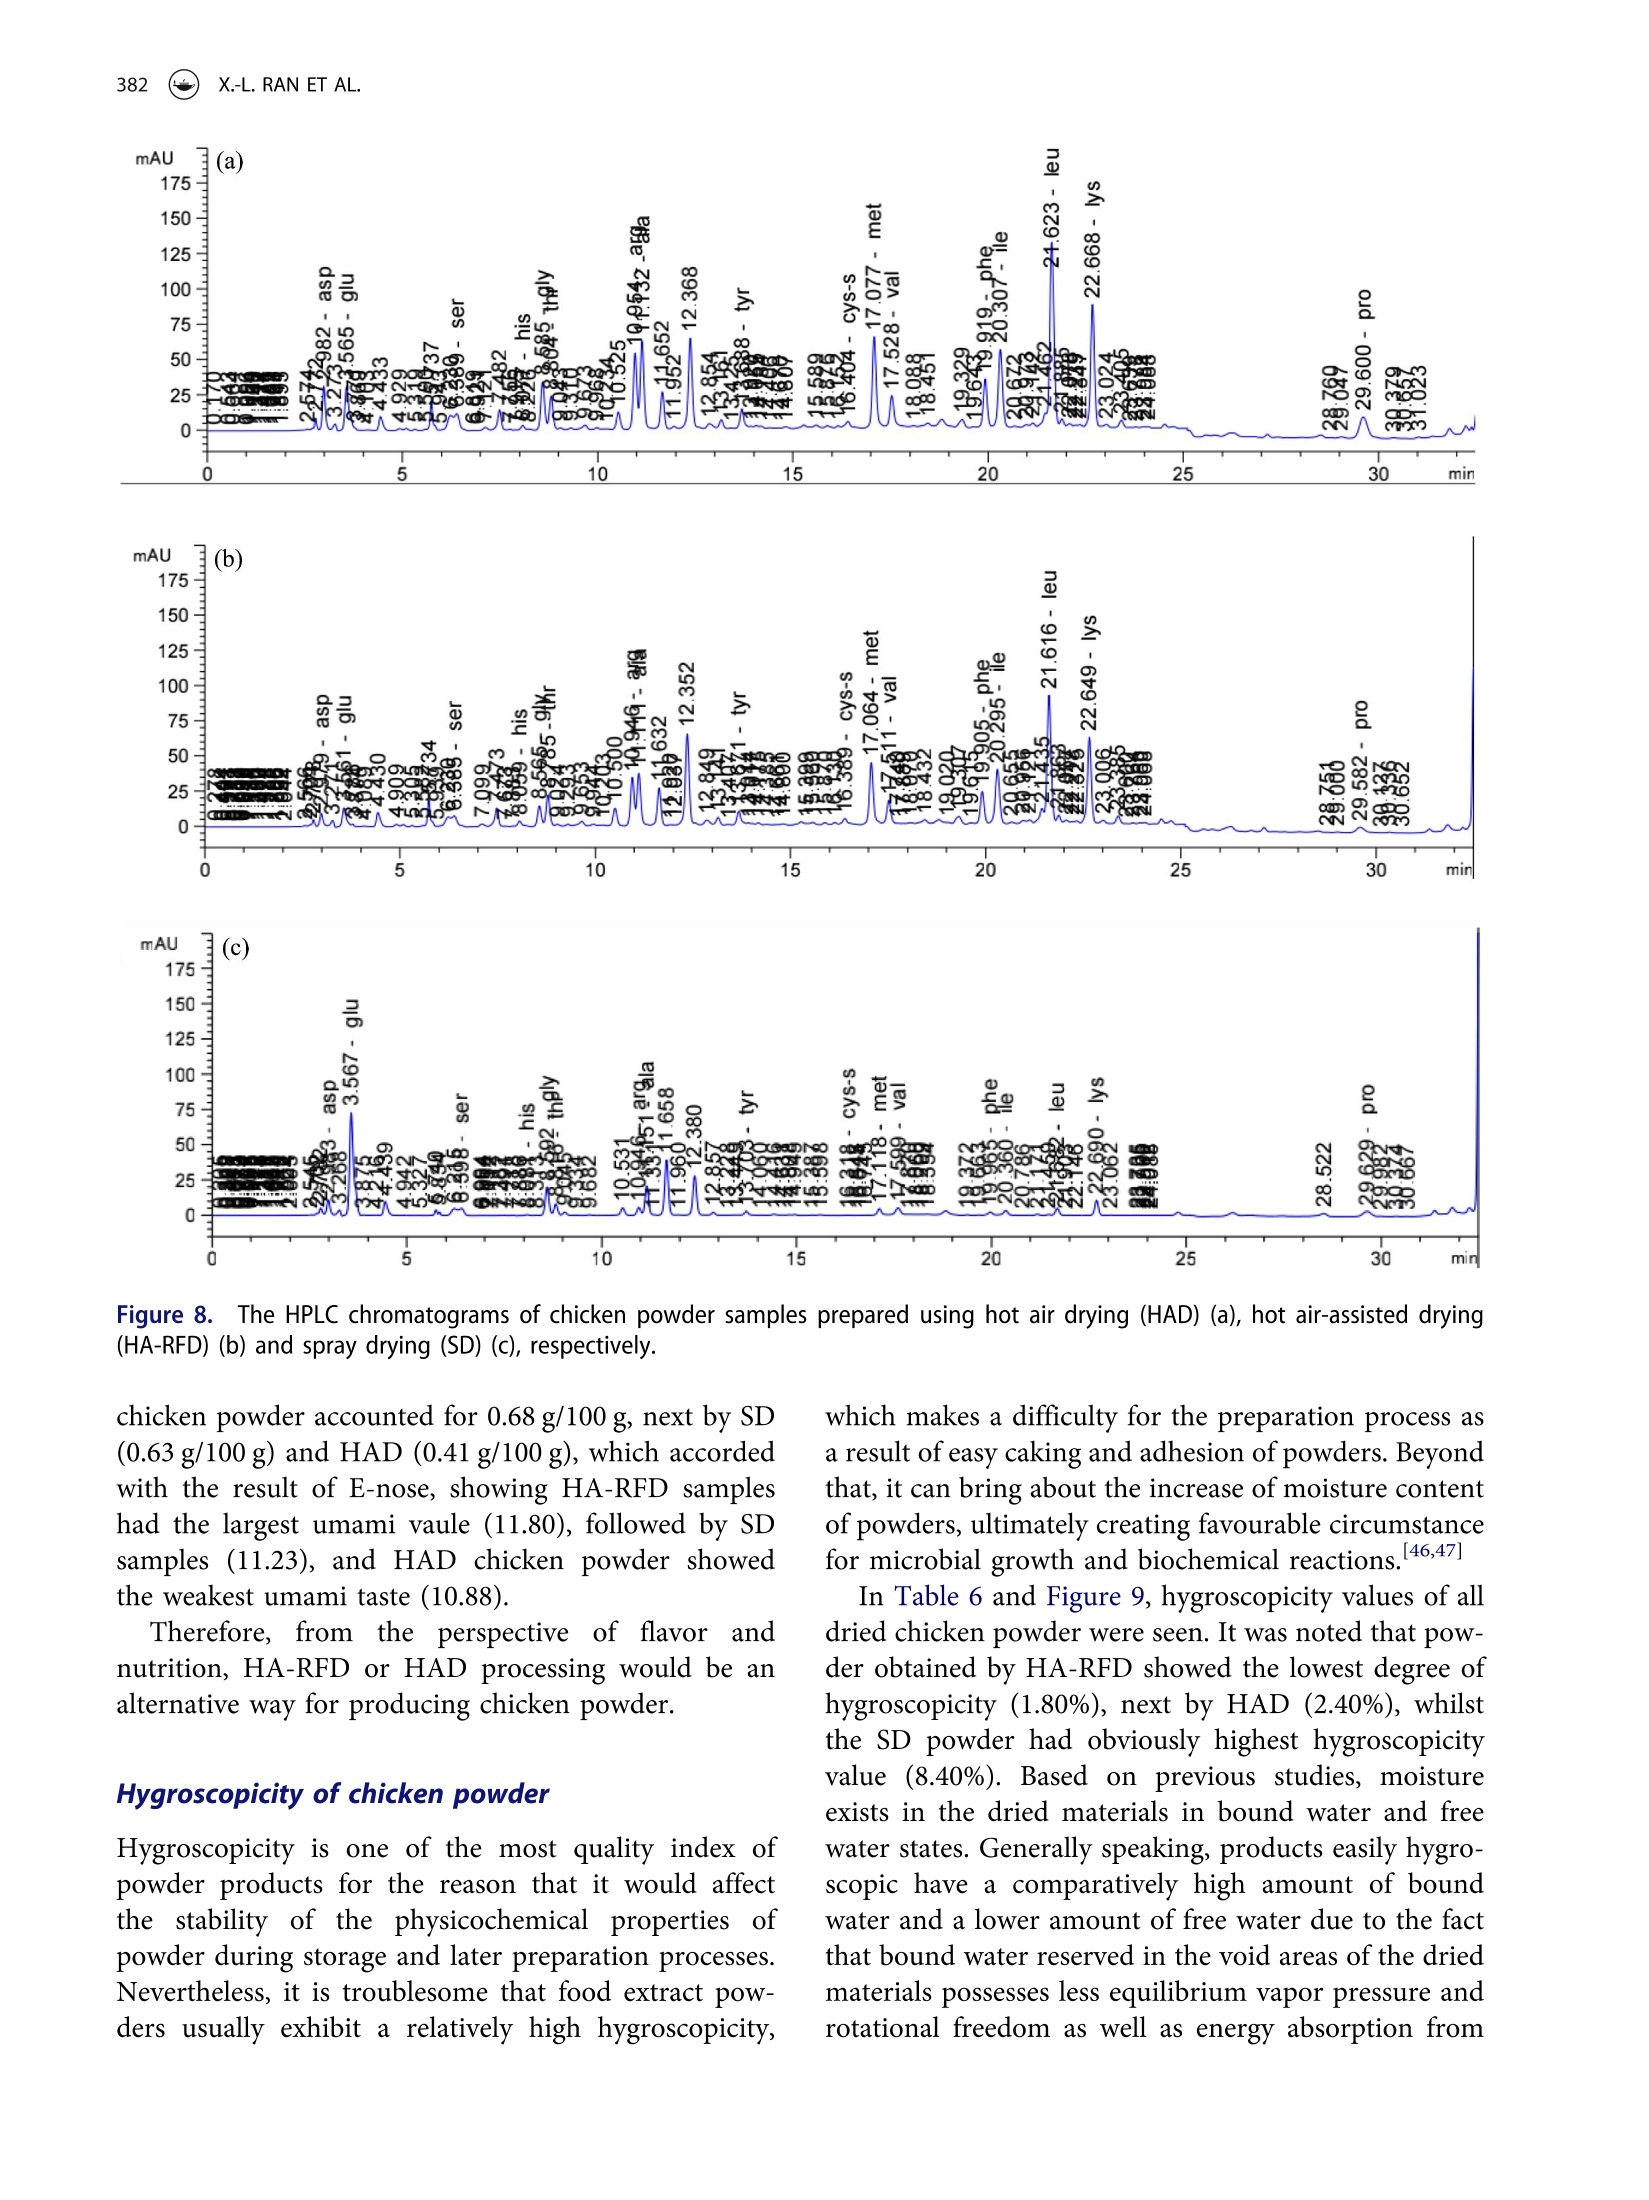
采用热风干燥法(HAD)、热风辅助射频干燥法(HARFD)和喷雾干燥法(SD)制备了鸡粉。比较了干燥时间对产品风味、风味、游离氨基酸(FAA)含量和理化性质的影响。
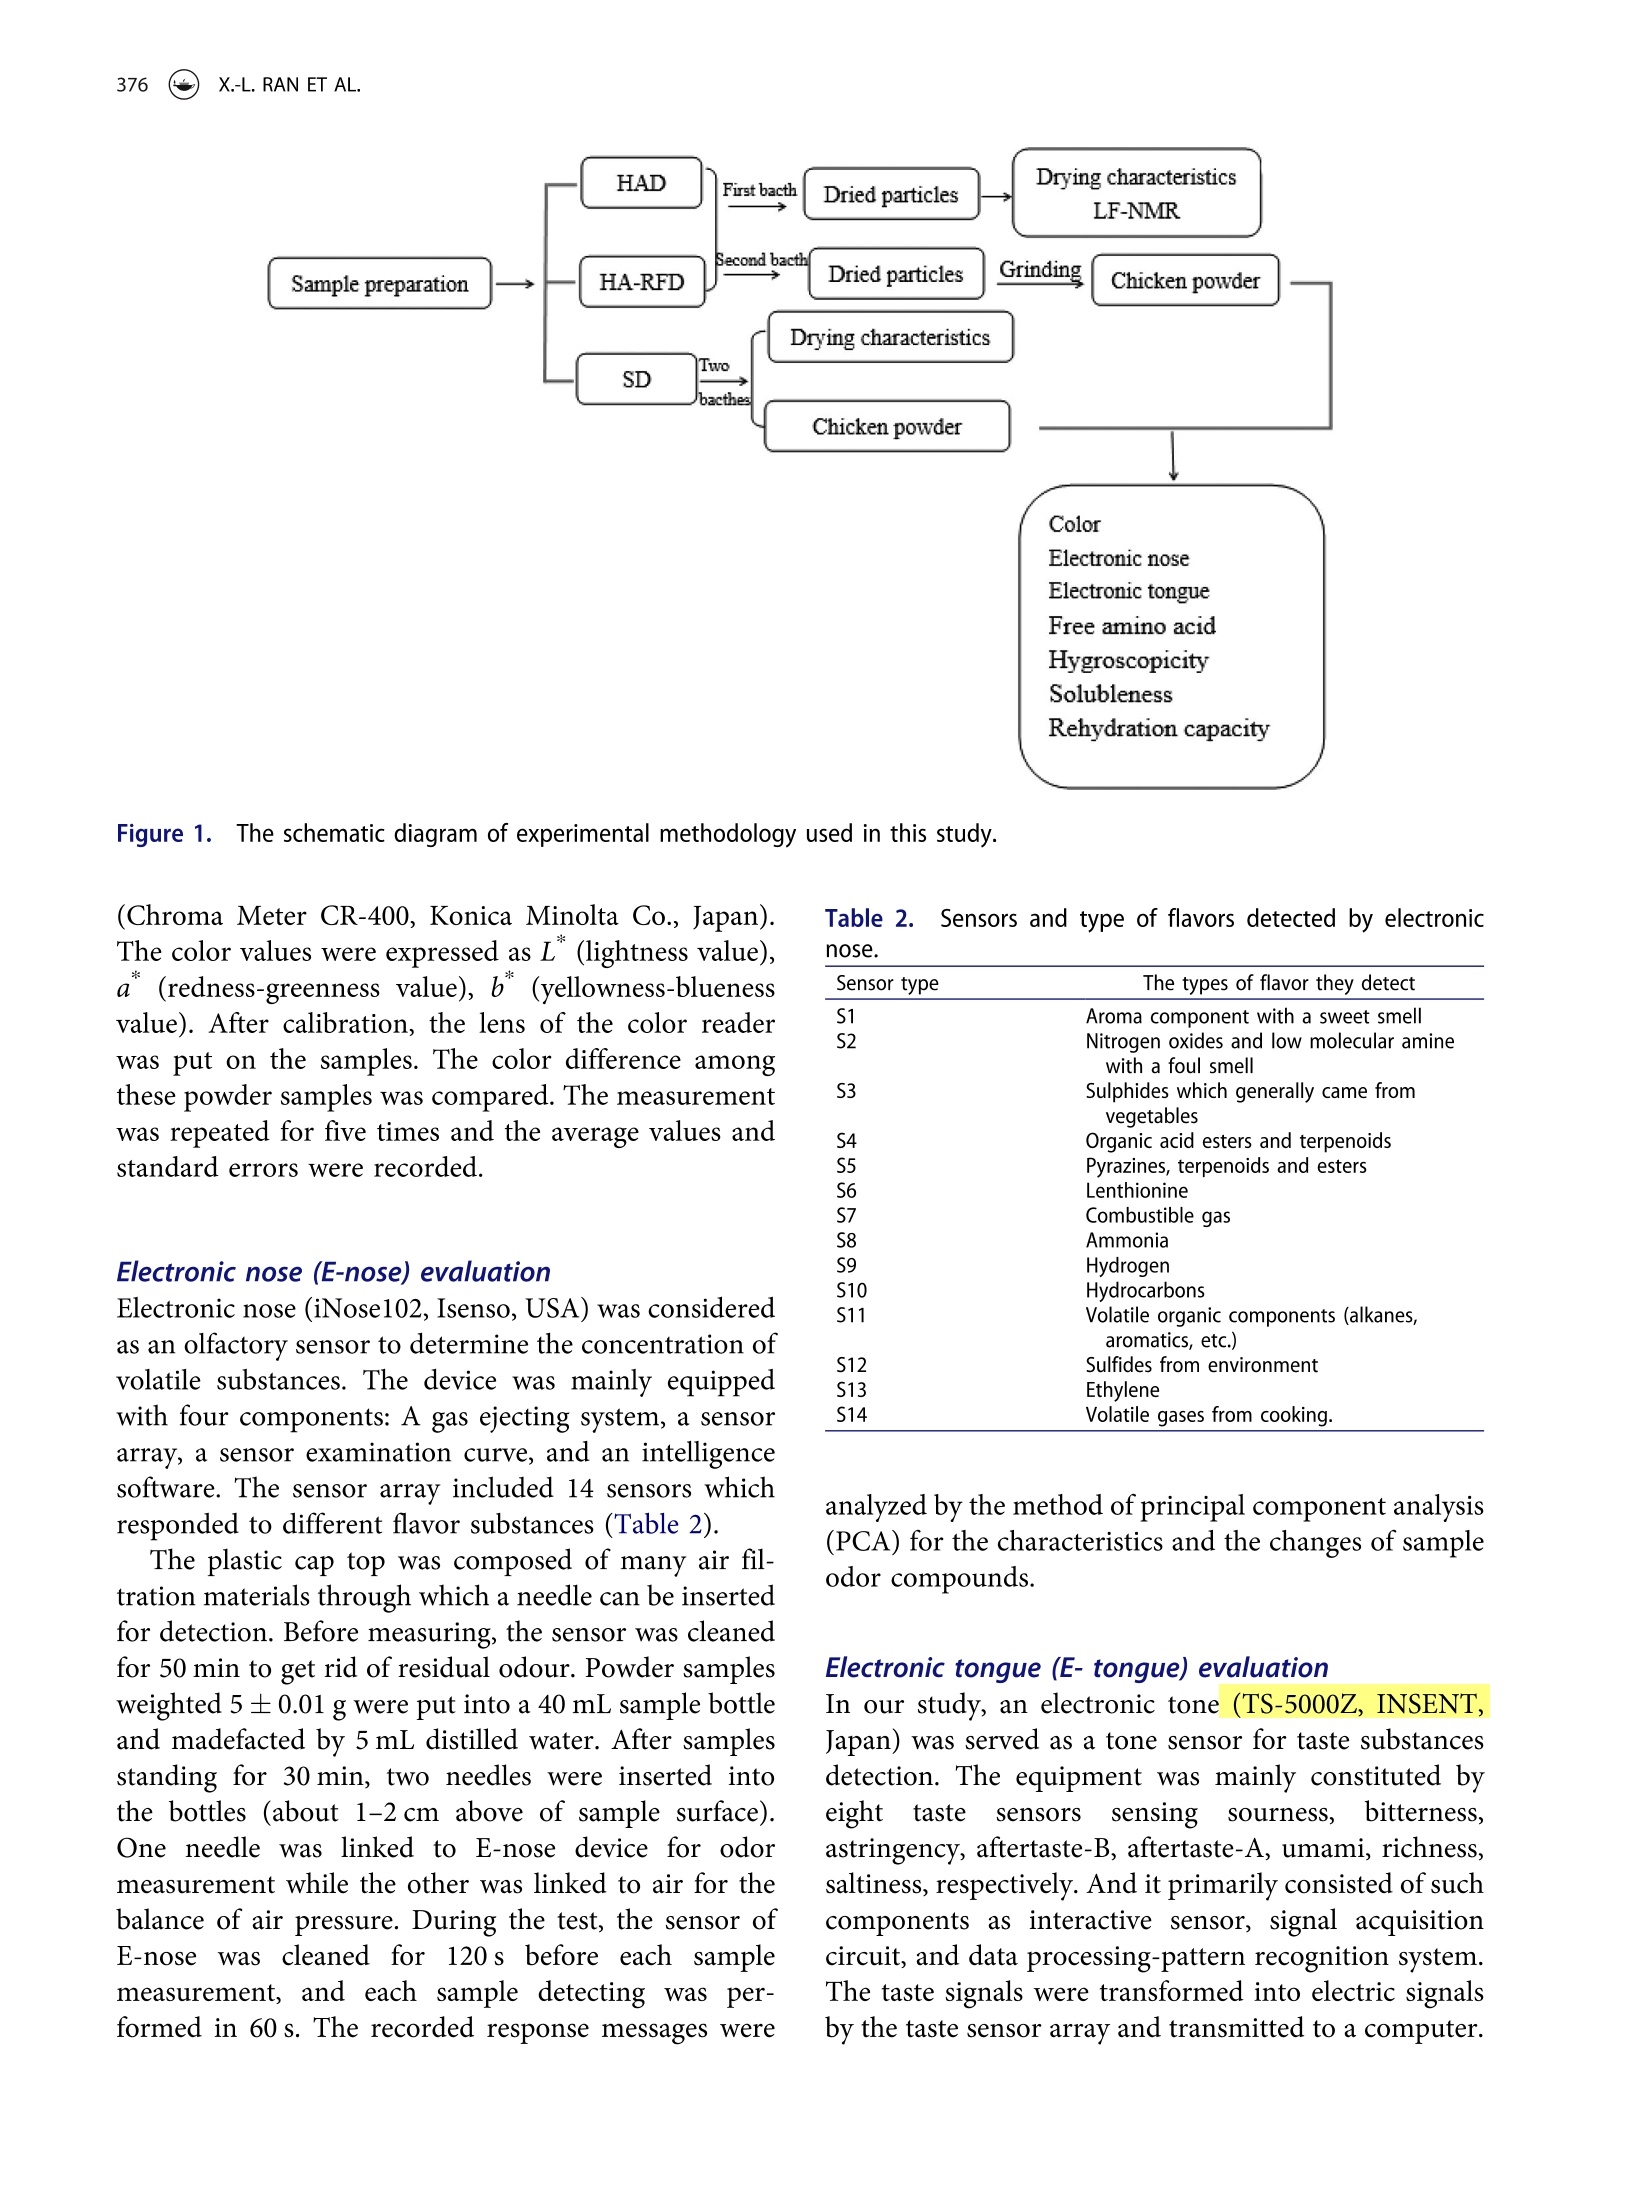
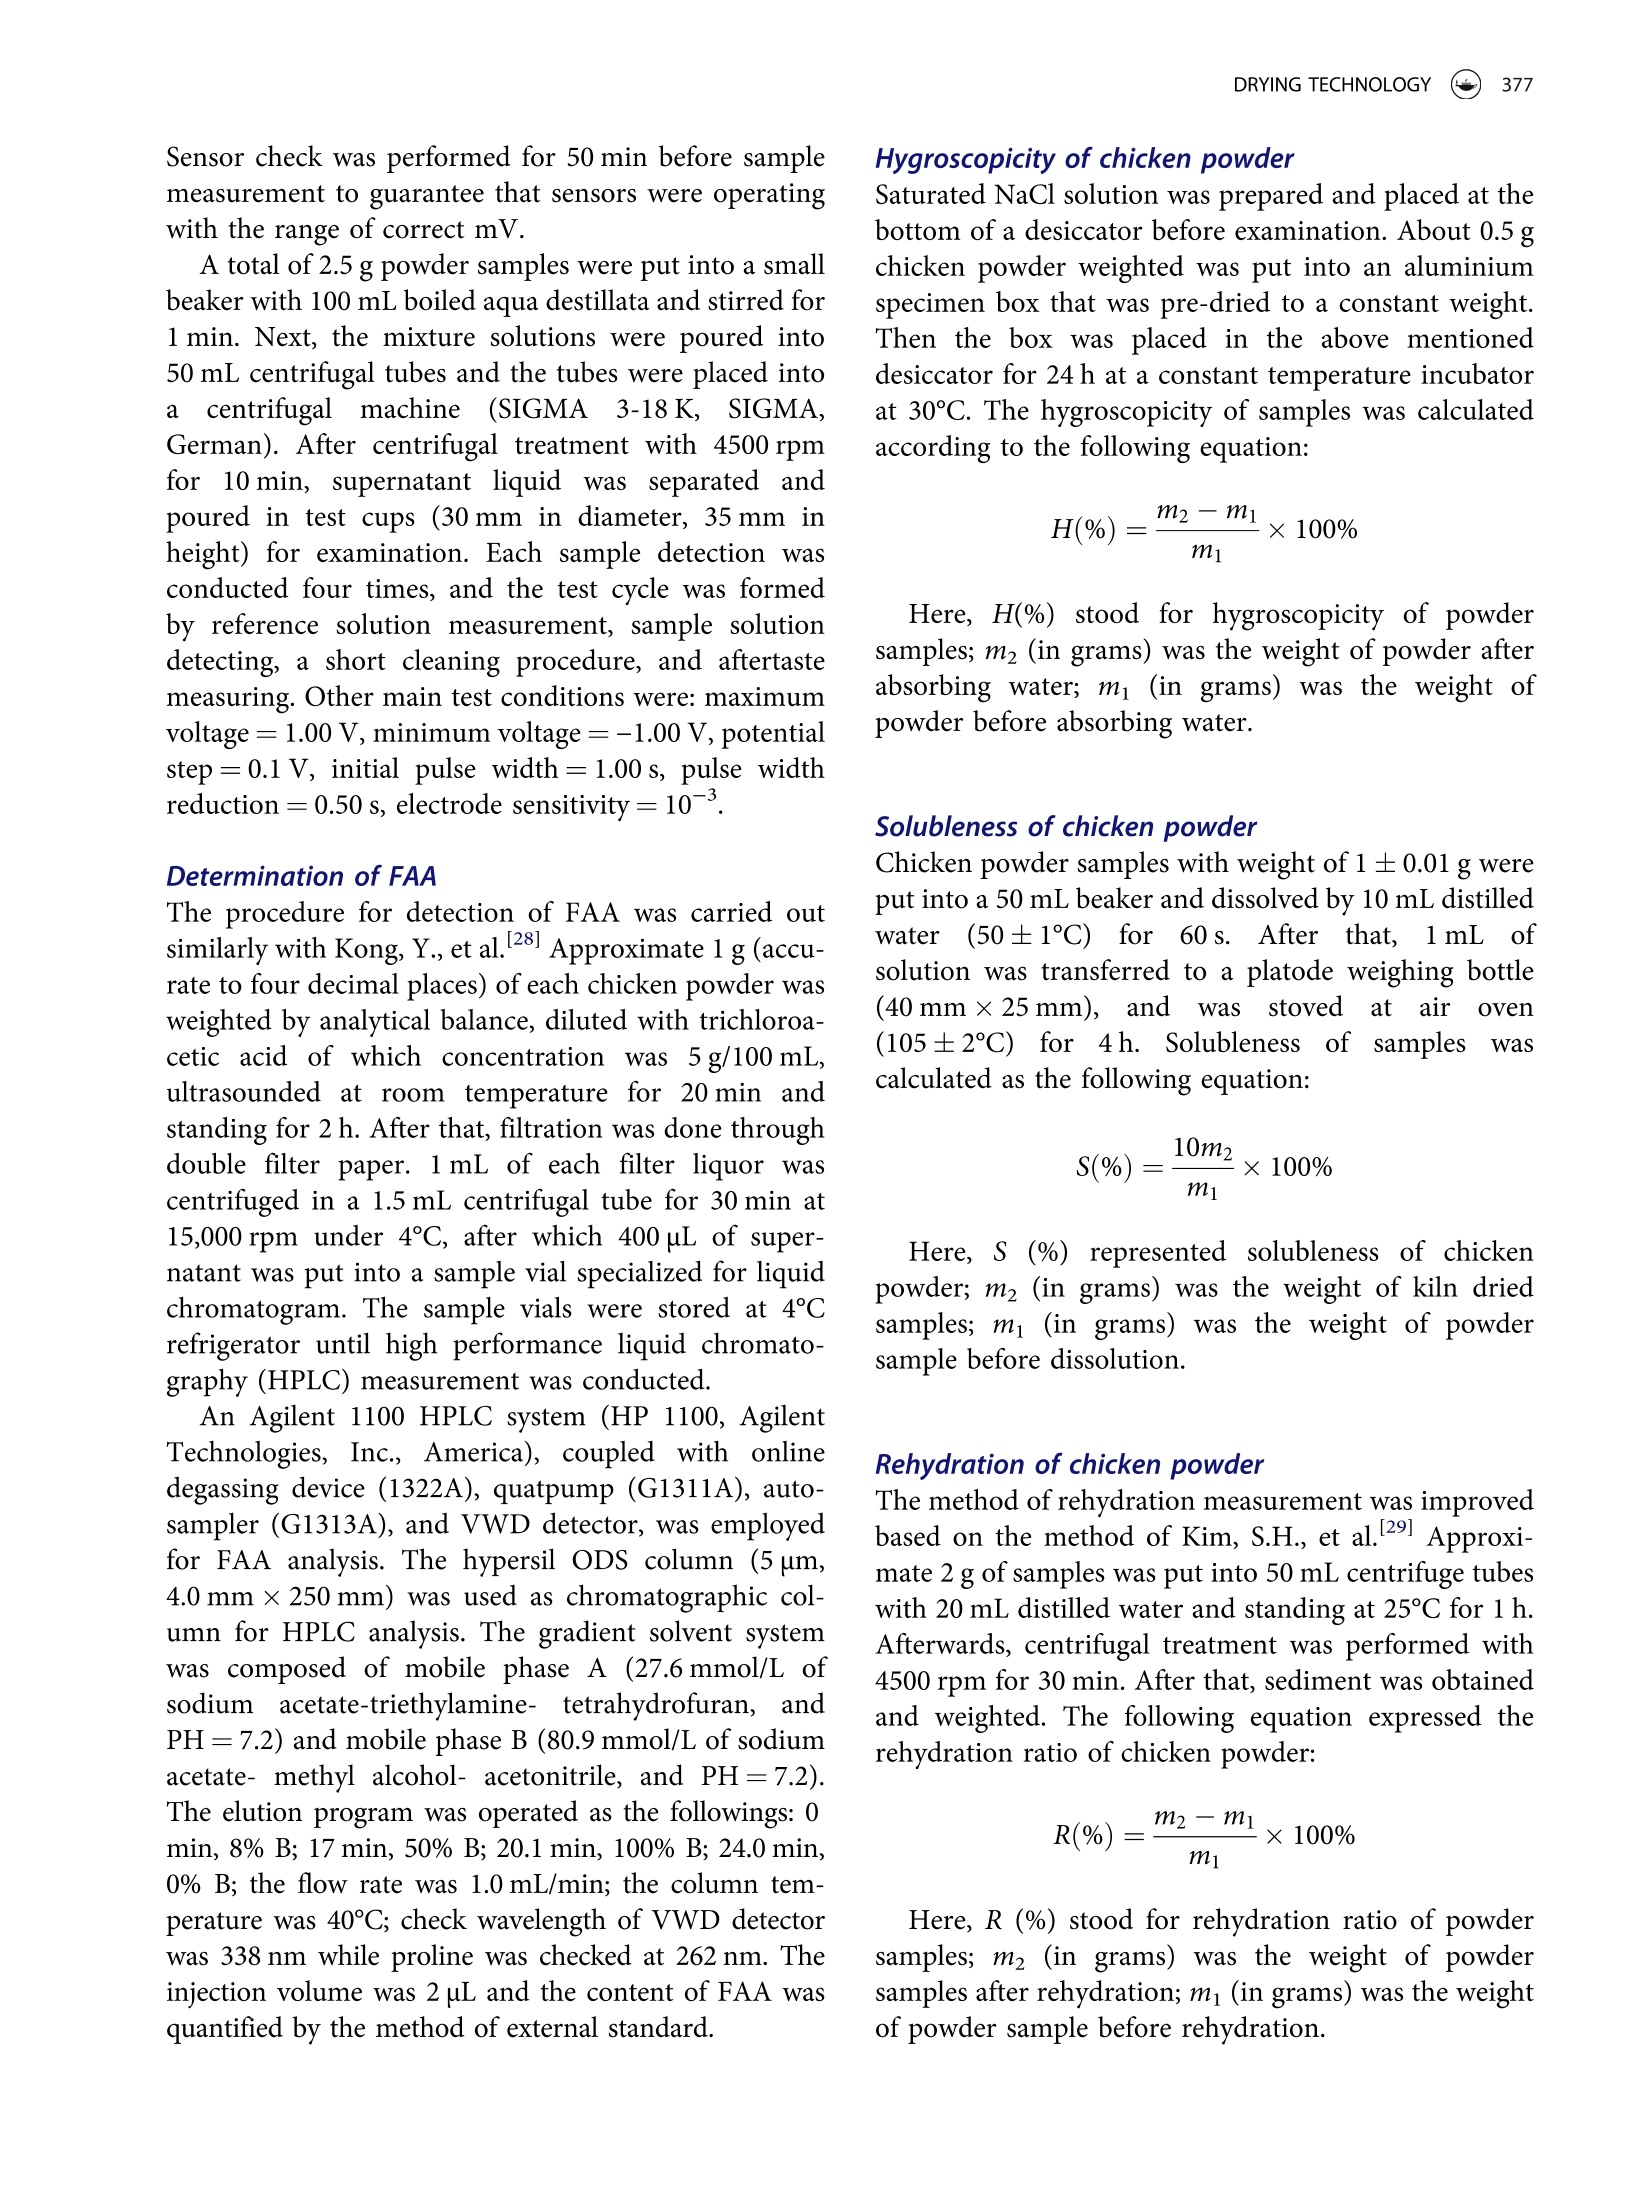
方案详情

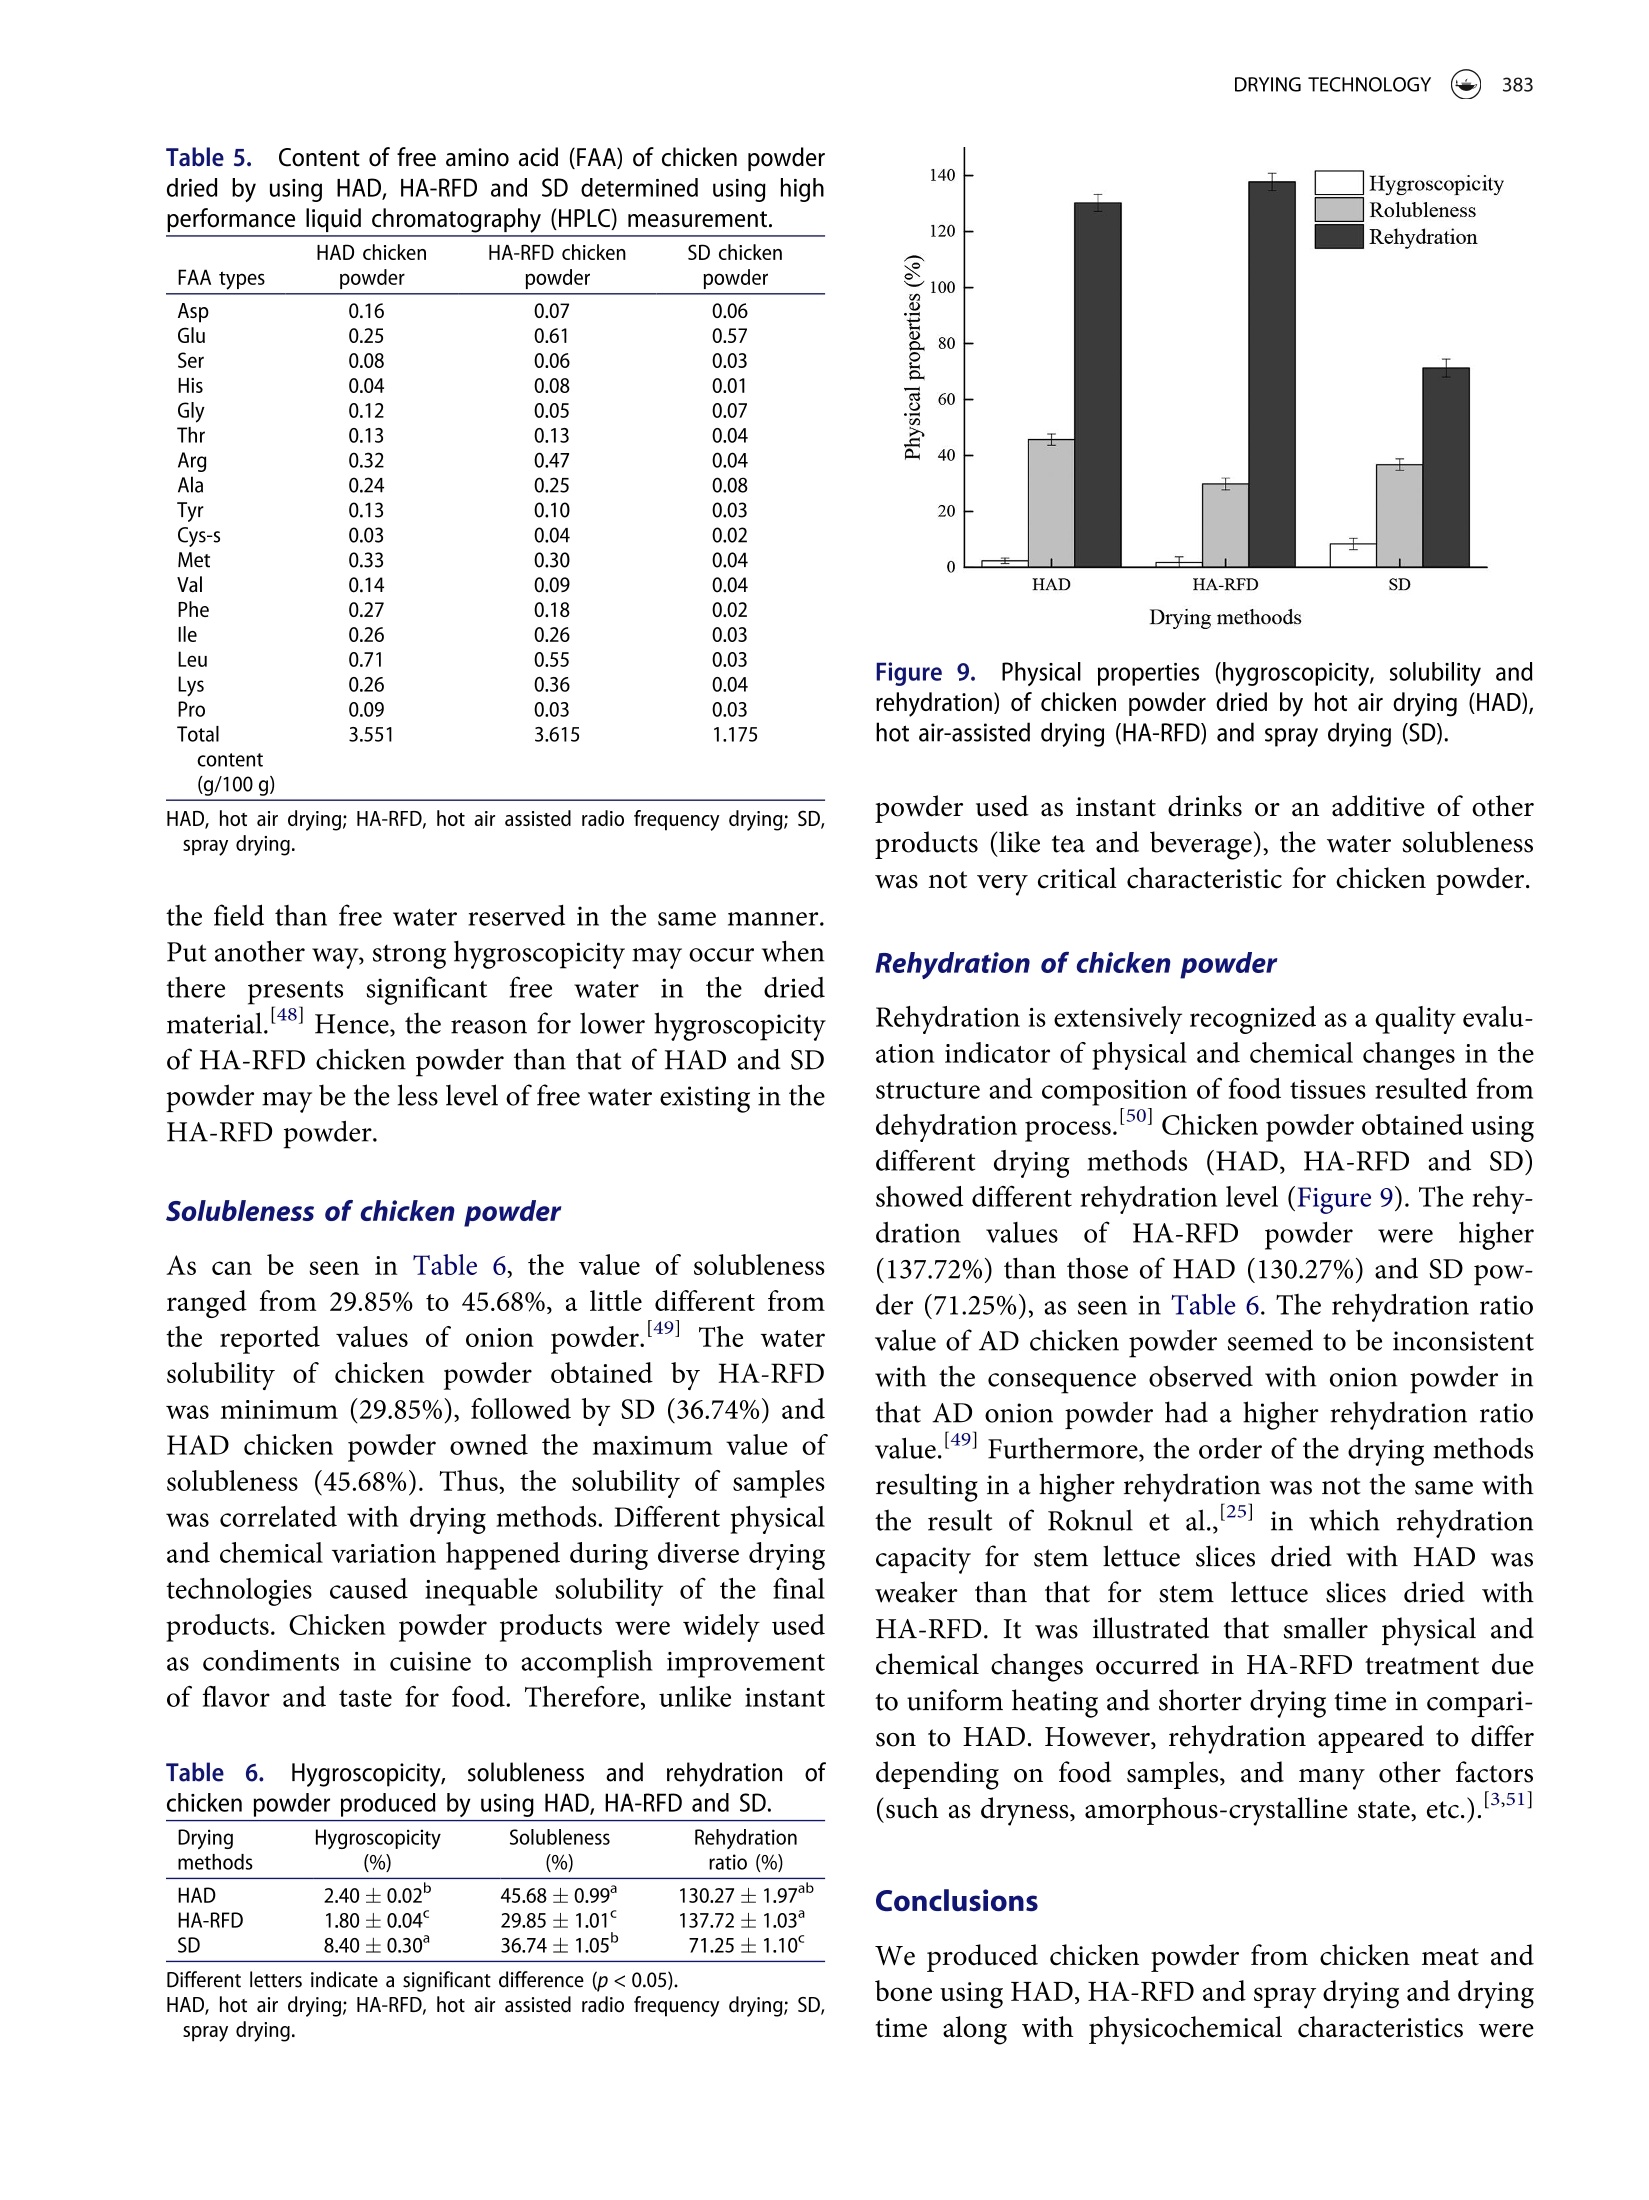
Taylor & FrancisTaylor & Francis GroupDrying TechnologyISSN: 0737-3937 (Print) 1532-2300 (Online)journal homepage: https://www.tandfonline.com/loi/ldrt20 DRYING TECHNOLOGY2019,VOL. 37, NO.3,373-386https://doi.org/10.1080/07373937.2018.1458734Taylor & FrancisTaylor & Francis Group An International Journal A comparative study of three drying methods ondrying time and physicochemical properties ofchicken powder Xin-Li Ran, Min Zhang, Yuchuan Wang & Yaping Liu To cite this article: Xin-Li Ran, Min Zhang, Yuchuan Wang & Yaping Liu (2019) A comparativestudy of three drying methods on drying time and physicochemical properties of chicken powder,Drying Technology, 37:3, 373-386, DOI: 10.1080/07373937.2018.1458734 To link to this article: https://doi.org/10.1080/07373937.2018.1458734 Submit your article to this journal e Article views: 286 View related articles C View Crossmark data C CrossMark Citing articles: 5 View citing articles C Check for updates A comparative study of three drying methods on drying time andphysicochemical properties of chicken powder Xin-Li Ranab, Min Zhanga, Yuchuan Wang, and Yaping Liud State Key Laboratory of Food Science and Technology, Jiangnan University, Wuxi, Jiangsu, China; bInternational Joint Laboratory on FoodSafety, Jiangnan University, Wuxi, Jiangsu, China; Jiangsu Province Key Laboratory of Advanced Food Manufacturing Equipment andTechnology, Jiangnan University, Wuxi, China; R & D Center, Guangdong Galore Food Co. Ltd, Zhongshan, China ABSTRACT Chicken powder produced by hot air drying (HAD), hot air-assisted radio frequency drying (HA-RFD) and spray drying (SD) was obtained. Drying time along with flavor, taste, free amino acid(FAA) content and physico-chemical properties of products were compared. It was resulted thatHA-RFD was the fastest means (90 min) with HAD was the slowest (240 min) to achieve targetmoisture content (under 5%). Concerning product quality, HA-RFD chicken powder exhibited thelowest hygroscopicity (1.80%), best rehydration (137.72%), and better flavor and taste as well ascolor, and HAD powder exerted best color, solubleness (45.68%) and better rehydration (130.27%).While for chicken powder produced by SD showed the most undesirable color and flavor andhighest degree of hygroscopicity (8.40%). Besides, the total FAA content of HA-RFD was the mostabundant (3.615 g/100 g), followed by HAD (3.551 g/100 g) and the SD powder had minimumcontent of total FAA (1.175 g/100 g), which suggested that HA-RFD can reduce thermal qualitydegradation and improve nutritional value with the lowest damage. Besides, HA-RFD chickenpowder had the largest total content of Asp and Glu (3.615 g/100 g), which were the primarycontributor to umami. Based on the results, it was concluded that HAD or HA-RFD appeared to be apromising way to prepare for chicken powder. Received 21 January 2018Revised 25 February 2018 Accepted 26 March 2018 KEYWORDS Amino acid content; chickenpowder; hot air drying; hotair-assisted radio frequencydrying; physico-chemicalproperties; spray drying Introduction Pure chicken powder (or dehydrated chicken powder),taking chicken breast (and chicken skeleton) as rawmaterials, are well known as natural flavorings at homeand abroad. Industrially, chicken powder products aregenerally obtained by the processes of water extraction,mincing, enzymolysis, concentration, colloid milling,homogeneity and spray drying. Due to its rich nutrient,natural health and nice flavor (chicken flavor), chickenpowder has enjoyed great popularity in terms ofapplication to compound condiment, instant noodlesseasoning, prepared foods and so on, especially inChina. Drying refers to the process of removing volatilesubstances (moisture) to obtain solid products. Notably,drying methods and their conditions can make a differ-ence to the physicochemical (color, texture, rehydration,etc.) and functional properties (protein, inoxidizability,etc.) of materials to be dehydrated. 1:2] Many dryingtechniques have been applied successfully to differentfood materials, but each of them has its own meritsand demerits. Hot air drying (HAD) is one of the mostcommon drying methods for various food materials considering its convenient operation, low cost andhigh productivity. However, the major disadvantagesassociated with HAD has been reported for its lowenergy efficiency and long drying time, which may leadto quality deterioration of final products, especially forheat sensitive materials.3] Radio frequency (RF) energy has been exploited todrying treatment for improving conventional dryingtechnologies withithe advantages of fine dryinguniformity, great penetration depth, stable product[4.51temperature. 4.5]Together with microwave drying,radio frequency drying (RFD) belongs to dielectricdrying,6which hasSseveraladvantages overconventional drying methods, including shorter dryingtime,higher energyefficiency, betterprocess[7]control, less occupied space, and so on.Recently,the application of RF heating technology on foodand! agricultural mater has been extensivelystudiedfor thawing[,8,9]pasteurization 10,11] anddisinfestation. 12,13]Researches about RFD of woodmaterials has been widely conducted.14-16] However,only a few researches about RFD in the field of foodsand agricultural products are reported. ( C O N T AC T M in Zhang g ) m in @ ji a ngnan.e du .cn 9 School of Fo o d S cience and Te c hnol o gy, Jiangnan University, 214122 W u xi, Jiangsu Province, C hina. Color versions o f one or m ore of the f i gures in t he article can be f ound online at w ww.t a n d f onli n e . c om /l d rt. ) The most frequently applied technique for producingchicken powder products is spray drying (SD), which isconsidered as a relatively rapid drying technology provid-ing powder products with high-quality. Nevertheless,powder produced by SD often own a small particle sizeunder 50 mm, resulting in high level of hygroscopicityand poor reconstitution properties.17 On the basis ofour knowledge, SD chicken powder is easy to absorbwater and agglomerate during storage, which allowingmicroorganism for growth and propagation. In addition,glass transition is a common phenomenon in SD process,and it has prove to be concerned with degradation andbrowning of anthocyanin, 18 crystallization, agglomer-ation, and caking of the products. 19] Numerous litera-tures about spray drying of fruit and vegetable juicepowders can be found, taking tomato,l20.21] bayberry 17and watermelon22 for example. Up to now, domestic studies about chicken powderare mostly concentrated on exploration for technologi-cal conditions of spray drying for products,I23]orapplication of chickenpowder asican additivee tocompound seasonings and prepared foods.24 Limitedresearches focused on developing innovative dryingmethods for chicken powder along with their influenceon flavor, nutritional and physicochemical characteris-tics of final products. Using chicken breast and chickenskeleton as raw materials, this study produced chickenpowder products by means of HAD, HA-RFD andSD. Additionally, the taste, flavor, nutritional andphysicochemical properties were compared basing onevaluation of electronic tongue, electronic nose, freeamino acid (FAA) and physicochemical quality. Theobjectives of the current study was to exploit thepotential of HAD and HA-RFD as alternative ways forproduction of chicken powder. Materials and methods Raw materials Chilled chicken breast (skinless) and chicken skeletonwere purchased from a local supermarket in Wuxi,China, and then stored at 4C and 95%6 relativehumidity in a refrigerator before experiment (no longerthan two days) to prevent rot. The moisture content(MC) of raw chicken breast was 75.97 ±0.96% (wb).Besides, the content of protein and fat were 33.20 ±0.09 g/100 g and 1.74±0.03 g/100 g, respectively. The equipment for HAD was described by Roknul, A.S.M., et al. 25] A convective electric oven (model 101-1- BS, Shanghai Medical Devices Co., Shanghai, China),26]in which the air temperature can be regulated, was usedfor HAD. The dryer consists of six main parts, includinga heater, heating control unit, an electrical fan, measure-ment sensors, an air duct, and a drying chamber. Theheating control unit included an electric heater (3kW)installed insidea duct. The drying chamber wasconstituted by sheet iron with a cavity dimension of450 mm × 450 mm× 500 mm. The air temperature inthe chamber, achieved by electrical resistance heating,was determined directly with the thermocouple andadjusted by the heating control unit. The air flowed pastthe device with the desired temperature, entered intothe chamber from the air inlet and flowed out throughthe air outlet. The air velocity was surveyed with a digi-tal anemometer (Prova AVM-03, ISR Instrumentation,Ontario, Canada). Hot air-assisted radio frequency (HA-RF) dryer The samples were dried in a 6-kW, 27-MHz pilot-scaleRF dryer (SO 6B, Monga Strayfield, Pune, MaharashtraIndia). Two parallel polar plates were used as the appli-cator for RFD with upper electrode dimensions of83 cm × 40 cm and bottom electrode dimensions of99 cm × 59 cm.The dryer was3econstructed of twobuilt-in hot air blowing systems and a controller fortemperature and air flow. The samples were dehydratedmotionlessly in a Teflon container (28 cm ×20 cm ×4 cm) with a perforated bottom. The hot air flowed intothe RF cavity vertically through inlet holes at the bottomelectrode and the air flow was kept at a velocity of 1 m/s,which was measured by a digital anemometer (ProvaAVM-03, ISR Instrumentation, Ontario, Canada). Spray dryer The constructure of spray dryer (SD-05; Yibu Co., Ltd.,Wuxi, China) was described by Cao, X., et a1.27 Thepilot-scale equipment (1.8 m x 0.93 m ×2.2 m, 5 kg/hwater evaporation rate, centrifugal spray) consisted offive main components: A feed system with a feed pipeand peristaltic pump; a scattering system with a high-speed motor, a centrifugal pan and polarized panels; adrying system with a heater, an air distributor andpipes; a collecting system with an air blower, an air pipeand a receptor; a polarization system with a powersource, electric wire and polarized panels. Experimental methods Sample preparation Chilled chicken breast was washed, cleared (residual fat)and cut into chicken nuggetss (3cm ×3 cm ×3 cm).Frozenchicken skeleton was thawed ffor10 min, washed, and remained viscera and skin was removed,after which the skeleton was chopped into small pieces(a piece the size of above chicken nuggets). Chickennuggets and bones (at the ratio of 1:1) was cooked for20 min, then drained and cooled for 10 min. After that,put them into a2000 mL beaker and enzymolysistreatment (degradation of proteins and peptides) wasconducted for better flavor. About 0.3% compoundprotease and 0.3% flavourzyme (Novozymes, Wuxi,China) were added. Afterwards, we placed the beakerin a water bath for enzymatic hydrolysis at 60℃ for3 h, then killed enzyme at 95℃ for 15 min. Finally, weminced the enzymolysis; mixture and divided themashed meat-bone (MC=63.87±0.63%, wb) aver-agely into two parts.One part was directly used forthe followingRHAD2and RFD,another oneWashomogenized using high-pressure homogenizer(NS1001 L2K, Niro Soavi, Italy) and diluted to 10%(MC=80.03±0.74%, wb) for the following SD. Eachpart of samples was prepared for two batches. Table 1showed the experimental plan for prepared samplesused in this study. Drying experiment Figure 1 showedi usttlheschematitcic diagram ofexperimental methodology used in this study. In thisexperiment, the same load of mashed meat-bone(400±0.1g) was used to be dried using HAD, hotair-assisted drying (HA-RFD), and spray drying (SD).After a series of preliminary experiments, the dryingconditions in this study were set as the followings:Hot air flowed vertically through the wire mesh at avelocity of 1.5 m/s during HAD and samples were dehy-drated at the temperature of 60℃ and maintained untilthe target moisture (under 5%(wb)) was achieved,which was required in industrial standard of china;hot air flowed into the RF cavity vertically through inletholes at the bottom electrode and the air flow was keptat a velocity of 1 m/s during HA-RFD, and samples weredried with the plate distance of 120 mm and the processwas stopped until the final moisture (under 5%(w.b.)) Table 1.Experimental plan of drying treatment. Batch Applications Measurements First batch Hot air drying, frequency, Drying characteristics Spray drying Hot air-assisted radio Second Hot air drying, Color, batch Hot air-assisted radio LF-NMR frequency frequency, Electronic nose Spray drying Electronic tongue Free amino acid Hygroscopicity Solubleness Rehydration capacity was achieved. DDrriieedd sampleswereeremoved every30 min from the drying container to determine themoisture content to obtain drying curves. After drying,the dried particles of HAD and HA-RFD were collected,weighed, and divided into two parts, one of which wasdirectly sealed and stored at 5℃ in dark for moisturemeasurement and low- field nuclear magnetic resonanceanalysis, and the other was pulverized using a comminu-tor (Asahi Man 800Y, Platinum Europe Hardware Pro-ducts Co., Yongkang, China) for further measurements. The sample suspension for spraydrying wasdehydrated in a pilot-scale spray dryer configured witha 40 mm standard rotating disk of centrifugal atomi-zation. Four inlet air temperature was set as 140, 150,160, and 170C while the outlet air temperature rangedbetween 70 and 80C. The flow rate was 1.8 L/h withrotate speed of 30,000 rpm and feed temperature of25℃. A polarization voltage of 48 V was set duringdrying procedure. The dried powder was gathered in aclean container and kept inside desiccators until itcooled off to environment temperature. Whereafter,the cooled powder was weighed, sealed, and stored at5℃ in dark for further analysis. Analytical methods Moisture content The moisture content (MC) of dried samples wasdetermined via oven method (National Standard ofChina/AOAC Method 1999). At fixed time intervalsduring dehydration (30 min), samples were fetchedout and dried in the oven for 5 h at 105±1°C to achievea constant weight. This test was conducted in triplicate. Low-field nuclear magnetic resonance (LF-NMR) The water migration of HAD and HA-RFD samplesafter drying procedure was measured by the way ofLF-NMRAnalyzer(MicroMR20-030V-I,l,ShanghaNiumag Technology Co., Ltd, Shanghai, China) withmagnetic field strength of 0.47T and resonant fre-quency for protons of 20 MHz. A particular glass tube(30×200 mm) and T2-Inverter software were used.Dried samples with weight of 3±0.5 g were placedinto the tube. T2 relaxation time was examined viaCarr-Purcell-Meiboom-Gill sequence. Theie repeatingtime between two successive scans was 3 s. The relax-ationnspectrum was checked at 28±3℃.Otherprimary parameters were set as follows: TW (ms)=4000, NS= 16, and NECH=1000. Color measurment The color of chicken powder produced by the three dif-ferent drying means was measured using a colorimeter (Chroma Meter CR-400, Konica Minolta Co., Japan).The color values were expressed as L" (lightness value),a (redness-greenness value), b (yellowness-bluenessvalue). After calibration, the lens of the color readerwas put on the samples. The color difference amongthese powder samples was compared. The measurementwas repeated for five times and the average values andstandard errors were recorded. Electronic nose (E-nose) evaluation Electronic nose (iNose102,Isenso,USA) was consideredas an olfactory sensor to determine the concentration ofvolatile substances. The device was mainly equippedwith four components: A gas ejecting system, a sensorarray, a sensor examination curve, and an intelligencesoftware. The sensor array included 14 sensors whichresponded to different flavor substances (Table2). The plastic cap top was composed of many air fil-tration materials through which a needle can be insertedfor detection. Before measuring, the sensor was cleanedfor 50 min to get rid of residual odour. Powder samplesweighted 5 ±0.01 g were put into a 40 mL sample bottleand madefacted by 5 mL distilled water. After samplesstanding for 30 min, two needles were inserted intothe bottles (about 1-2 cm above of sample surface).One needle was linked to E-nose device for odormeasurement while the other was linked to air for thebalance of air pressure. During the test, the sensor ofE-nose was cleaned for 120s before eachsamplemeasurement, and each sample detecting wasper-formed in 60 s. The recorded response messages were Table 2..Sensors and type of flavors detected by electronicnose. Sensor type The types of flavor they detect S3 Aroma component with a sweet smell Nitrogen oxides and low molecular amine with a foul smell Sulphides which generally came from .vegetables Organic acid esters and terpenoids Pyrazines, terpenoids and esters Lenthionine Combustible gas Ammonia Hydrogen S10 Hydrocarbons S11 Volatile organic components (alkanes, aromatics, etc.) S12 . Sulfides from environment S13 Ethylene S14 Volatile gases from cooking. analyzed by the method of principal component analysis(PCA) for the characteristics and the changes of sampleodor compounds. Electronic tongue (E-tongue) evaluation In our study, an electronic tone (TS-5000Z, INSENT,Japan) was served as a tone sensor for taste substancesdetection. The equipment was mainly constituted byeight taste sensors sensing sOurness bitterness,astringency, aftertaste-B, aftertaste-A, umami, richness,saltiness, respectively. And it primarily consisted of suchcomponents as interactive sensor, signal acquisitioncircuit, and data processing-pattern recognition system.The taste signals were transformed into electric signalsby the taste sensor array and transmitted to a computer. Sensor check was performed for 50 min before samplemeasurement to guarantee that sensors were operatingwith the range of correct mV. A total of 2.5 g powder samples were put into a smallbeaker with 100 mL boiled aqua destillata and stirred for1 min. Next, the mixture solutions were poured into50 mL centrifugal tubes and the tubes were placed intod centrifugal machine(SIGMA 3-18 K,SIGMA,German). After centrifugal treatment with 4500 rpmfor 10 min, supernatant liquid was separated andpoured in test cups (30 mm in diameter, 35 mm inheight) for examination. Each sample detection wasconducted four times, and the test cycle was formedby reference solution measurement, sample solutiondetecting, a short cleaning procedure, and aftertastemeasuring. Other main test conditions were: maximumvoltage =1.00 V, minimum voltage =-1.00V, potentialstep =0.1 V, initial pulse width=1.00 s, pulse widthreduction= 0.50 s, electrode sensitivity=10. Determination of FAA The procedure for detection of FAA was carried outsimilarly with Kong, Y., et al. 28 Approximate 1g(accu-rate to four decimal places) of each chicken powder wasweighted by analytical balance, diluted with trichloroa-cetic acid of which concentration was5 g/100 mL,ultrasounded at room temperature for 20 min andstanding for 2 h. After that, filtration was done throughdouble filter paper. 1 mL of each filter liquor wascentrifuged in a 1.5 mL centrifugal tube for 30 min at15,000 rpm under 4°C, after which 400 uL of super-natant was put into a sample vial specialized for liquidchromatogram. The sample vials were stored at 4℃refrigerator until high performance liquid chromato-graphy (HPLC) measurement was conducted. An Agilent 1100 HPLC system (HP 1100, AgilentTechnologies, Inc., America),), coupledwithh onlinedegassing device (1322A), quatpump (G1311A), auto-sampler (G1313A), and VWD detector, was employedfor FAA. analysis. The hypersil ODS column (5 um,4.0 mm ×250 mm) was used as chromatographic col-umn for HPLC analysis. The gradient solvent systemwas composed of mobile phase A (27.6mmol/L ofsodiumacetate-triethylamine- tetrahydrofuran, andPH=7.2) and mobile phase B (80.9 mmol/L of sodiumacetate- methyl alcohol- acetonitrile, and PH=7.2).The elution program was operated as the followings: 0min,8% B; 17 min, 50% B; 20.1 min, 100% B; 24.0 min,0% B; the flow rate was 1.0 mL/min; the column tem-perature was 40℃; check wavelength of VWD detectorwas 338 nm while proline was checked at 262 nm. Theinjection volume was 2 uL and the content of FAA wasquantified by the method of external standard. Hygroscopicity of chicken powder Saturated NaCl solution was prepared and placed at thebottom of a desiccator before examination. About 0.5 gchicken powder weighted was put into an aluminiumspecimen box that was pre-dried to a constant weight.Then the box was placed in the above mentioneddesiccator for 24 h at a constant temperature incubatorat 30℃. The hygroscopicity of samples was calculatedaccording to the following equation: Here, H(%) stood for hygroscopicity of powdersamples; m2 (in grams) was the weight of powder afterabsorbing water; m (in grams) was the weight ofpowder before absorbing water. Solubleness of chicken powder Chicken powder samples with weight of 1 ±0.01 g wereput into a 50 mL beaker and dissolved by 10 mL distilledwater(50±1℃) fforr60 s.S.After:that. 1mLLofsolution was transferred to a platode weighing bottle(40 mm ×25mm),andwasS.stovediaatairroven(105±2℃)for 4h. Solubleness; of sampleswascalculated as the following equation: Here, S((%) represented solubleness of chickenpowder; m2 (in grams) was the weight of kiln driedsamples; m (in grams) was the weight of powdersample before dissolution. Rehydration of chicken powder The method of rehydration measurement was improvedbased on the method of Kim, S.H., et al. 29] Approxi-mate 2 g of samples was put into 50 mL centrifuge tubeswith 20 mL distilled water and standing at 25℃ for 1 h.Afterwards, centrifugal treatment was performed with4500 rpm for 30 min. After that, sediment was obtainedand weighted. The following equation expressed therehydration ratio of chicken powder: Here, R (%) stood for rehydration ratio of powdersamples; m2 (in grams) was the weight of powdersamples after rehydration; m1 (in grams) was the weightof powder sample before rehydration. Statistical analysis was completed using SPSS softwarefor Windows (version 20.0 SPSS Inc., Chicago, IL).Differences among product properties were determinedfor significance by one-way analysis of variance (ANOVA).Significance was demonstrated at P<0.05 level. Results and discussion Drying curves The moisturecontent(curveof chickenn powderproduced using HAD, HA-RFD and SD was shown inFigure 2. The drying curves exhibited a near exponentialdecay for HA-RFD and SD, while a typical profile fortraditional HAD, similar to that found in HA-RFDdrying for In-shell Macadamia Nuts and industrial silodrying of Macadamia nuts, respectively.l5,30] It can beseen that the total drying time required for HAD wasthe longest (240 min), followed by SD (180 min) andHA-RFD (90 min) to reach the target moisture content(MC) under 5%. It was also observed that the decreaseof moisture was very fast at the beginning and sloweddown as MC was under 10%. Just like drying in themicrowave field, the less available moisture to interactwith the radio frequency (RF) field resulted in the lessremoval of water inside samples, which was stated insome previous researchers.31,32] In addition, linearrrregression analyses werecompleted using SPSS software and the linear regressionequation was obtained as followings: Y=57.1260-0.2388X1, R?= 0.9631; Y2=58.959-0.6839X2,R,=0.9251; Y3=74.094-0.4407X3: R?=0.9439,which corresponded respectively to HAD, HA-RFD Figure 2. Moisture content curves of samples dried using hotair drying (HAD), hot air-assisted radio frequency drying(HA-RFD) and spray drying (SD). and SD. The statistical analysis indicated that the dryingrate of HA-RFD was the highest with slope of 0.6839(absolute value), which contributed to a shortest dryingtime (90 min) needed for HA-RFD. This can be attrib-uted to volumetric heat import (during HA-RFD) thatobviously accelerates dehydration velocity comparedto surface heating in convection and conduction drying.Similar consequence has been reported for microwaveand infrared drying carrot and garlic.31 Low-field nuclear magnetic resonance (LF-NMR) With the assistance of LF-NMR, it is capable to non-destructively discern the degree of changes in connec-tion with the water status and microstructure. The sig-nal in the experimental samples mainly derived fromthe water proton in food systems. The change of theproton signal reflects the state of water inside the sys-tem. The length of the relaxation time (T2) indicateswater activity. As shown in Figure 3, variation rangeof T2 for samples was from 0.1 to 1,000 ms. Accordingto some pertinent literatures,33,34]investigation ofmoisture status inside food tissues via NMR analysisbased on different interaction of water proton with dif-ferent molecular environment and two or three kinds ofmoisture states were generally studied. In this article, wedivided the water inside minced chicken-bone particlesinto three states on the basis of relaxation time: From0.1 to 20 ms, water with extremely constrained flowabil-ity was defined as strongly bound water (SBW), whichcombined complexly with macromolecular substance;..from 20 to 100 ms, water with slight mobility was recog-nized as loosely bound water (LBW), which united withmacromolecular materials by hydrogen bonding; from100 to 1,000 ms, water with the most mobility wasconsidered as free water (FW), which can be readilyremoved. Bound water iss adsorbed by intracellularcolloidal particles as well as macromolecules or existsin the macromolecular structure and can not movefreely. Therefore, both LBW and SBW are relativelydifficult to be wiped off unless intense physical treat-ment (such as heat) or chemical actions are utilized. Figure 3 shows therepresentative LF-NMRtransverse relaxation1 time (T2) curves of mashedmeat-bone samples dried by HAD and HA-RFD. Threepeaks were observed, distinguished as T21, T22, T23,which suggested the above mentioned three moisturefractions.[35] The corresponding relative amplitude inthe figure stood for the content of each moisturecomponent, 36] which was identified as A21, A22, A23.As can be found in Figure 3(a), before HAD andHA-RFD, the dominating moisture inside samples fordrying was LBW (more than 90%) not FW because 100 T2/ms Figure 3.. Water proton transverse relaxation time (T2) spectrum of mashed meat-bone samples dried by hot air drying (HAD) andhot air-assisted drying (HA-RFD): (a) Before drying; (b) HAD;(c) HA-RFD. the vast majority of FW was easily removed duringpreceding cooking.Foodmicrostructure Can bedestroyed gradually during drying process. Obviouschanging trends of transverse relaxation times (T21,T22 and T23) were found: Transverse relaxation curvesshifted to the direction of lower relaxation (towardsthe left) as the HAD and HA-RFD proceeding, whichmay be illustrated by destruction of microstructureand membranes as well as decomposition of othermaterials (such as protein and peptides). Moreover, as can be seen in Figure 3(b) and (c), therelative amplitude minished, among which A22 reducedmost dramatically, which reflected that a mass of LBW(and remained FW) was deprived after heat treatment(HAD and HA-RFD). The LBW loss may be attributedto the break of hydrogen bond and release of thebounded water. In addition, Figure 4 showed us thevariation of three water distribution of samples afterdrying. It can be observed that the amount of LBWremoval after HAD treatment was a little more thanthat of HA-RFD, which may be due to more seriousdestruction of macromolecules used for completion. Color Color of chicken powder produced using three differentdrying methods can be seen in Table 3. Products obtained ising spray ddrryyiinngg eexhibited the lowestlightness (L*) value (65.35±0.18) and yellowness (b")value (16.37±0.04) while the highest redness (a") value(4.05±0.01), which may have something to do withmoisture content, amino acid content and amongothers. It was also stated that high inlet air temperature(from 140 to 170°℃) and outlet air temperature (from 70to80℃) during $SD caused1 undesired browningreaction, suchhasbrownSstaininducedby amino Figure 4. The variation of water distribution (strongly boundwater (SBW), loosely bound water (LBW), free water (FW)) ofmashed meat-bone samples dried by hot air drying (HAD) andhot air-assisted drying (HA-RFD). Table 3. Color of chicken powder produced by hot air drying(HAD), hot air assisted radio frequency drying (HA-RFD) andspray drying (SD). Drying methods L* a* b* HAD 77.50±0.24 1.28±0.04 16.78±0.23" HA-RFD 76.49±0.20° 1.46±0.02° 16.59±0.19 SD 65.35±0.18° 4.05±0.01° 16.37±0.04° Note: the same letters of a, b,c indicate no significant difference, and thedifferent letters between them mean there is a significant difference,p<0.05. acid. 17.371 Besides, physicochemical reaction might beanother cause of the feature of Lsuch as charring ofmaterials during SD. Additionally, powder produced by HAD revealedthemaximum value of L* (77.50±0.24))aanddb(16.78±0.23) among powder samples obtained byother drying treatments. Similar conclusionwasreported by Baysal et al. and Roknul et al.25,31Concerning the difference of L* and redness of a inTable 3, samples acquired using three drying waysappeared to be significantly different, while for the valueof b, it showed no distinctively different. From the pic-tures of powder samples (Figure 5), it seemed thatchicken powder produced by HAD exhibited best color,followed by HA-RFD, and powder produced by SDshowed the worst color with dim and lacklustre. Thiswas in accordance with aforementioned analyses of L,a* and b*. Electronic nose evaluation It is clear that thermal treatment is a key processing infood industries and would contribute to the improve-ment of extensive flavors and tastes principally viawell-known Maillard reaction.[38,39] It has been demon-strated tthatthe sulphur-containingamino acids,cysteine and cystine are indispensable components for meat flavour compounds formation through thermalprocessing.40l Figure 6 showed us the E-nose measured odor signaldistribution of chicken powder produced using HAD,HA-RFD and SD. As can be seen, the outline of radarfingerprint were semblable for three types of samplesobtained by different drying methods. That may dueto the fact that odorivectors were similar for chickenpowder. In addition, among all the response signals,the responsiveness of Ss (sensing pyrazines, terpenoidsand esters) was the strongest, then S (sensing aromacomponent) and S2 (sensing nitrogen oxides and lowmolecular amine). This phenomenon was consistentwith explanations in the previous study,41lwhichilluminated that pyrazines were the major contributorsto processed chicken aroma..What’s more, for SDchicken powder, the value of S2, which came fromnitrogen oxides and low molecular amine with a foulsmell, was the greatest. That may be the major causeof a little objectionable odor for SD chicken powder. From the result of primary component analysis(PCA)(Figure 6(b)), we concluded that the first princi-pal accounted for 86.94% and the second principal for7.71%. The total contribution rate of the two principalwas up to 94.65%. As a consequence, this result ofPCA could accurately reflect the main information ofthe aroma components of chicken powder. Moreover,the line among groups of each powder sample was notoverlapped,which suggested the flavor substance distri-bution of the three groups of samples was significantlydifferent. Therefore, drying methods may affect theodor generation of final products. Electronic tongue evaluation Drying process also may influence the taste of endproducts. Table 4 listed the taste of three sources of (a) HAD (b) HA-RFD (c) SD Figure 55.. Pictures of chicken powder produced using hot air drying (HAD), hot air-assisted drying (HA-RFD) and spray drying (SD). (a) (bp) Figure 6. Electronic nose radar fingerprint chart (a) and PCAgraph (b) of chicken powder samples produced by hot air drying(HAD), hot air-assisted drying (HA-RFD) and spray drying (SD). chicken powder detected by E-tongue. As can be found,the uppermost taste of samples was umami, followed bysaltiness and richness, and there was no sourness,astringency and aftertaste-A. It was demonstrated thattaste substances were generally generated by virtue ofphysicochemical reaction including dehydrationreaction, protein denaturation, oxidation reaction,thermal decomposition, etc.27 Umami may come fromflavor amino acid or outcome of Maillard reaction, asmentioned aboved. Also, taste is highly relevant to tastecompounds and their content. 42,43] Chicken powderdried by HA-RFD exihibited the maximum values ofumami and richness. The reason may be that HA-RFD impacted the taste components of chicken powdermore mildly. E-tongue singal was shown via radarfingerprint chart Figure 7), in which the fingerprint Figure 7. Electronic tongue radar fingerprint chart of chickenpowder samples produced by hot air drying (HAD), hotair-assisted drying (HA-RFD) and spray drying (SD). profile of each powder produced by three methodsalmost coincided. In other words, the taste substancesof these chicken powder may be basically identical toeach other. Determination of FAA Amino acids, an important nutritional ingredient ofchicken powder, play a crucial part in the growingdevelopment of organisms 44 and can also enhancethe taste and flavor of foods. Therefore, we compared17 kinds of FAA among three chicken powder samplesprepared by different drying methods using HPLCsystems. The HPLC chromatograms of chicken powderwere obtained finally (Figure 8). As can be found in Table 5, the total FAA content ofHA-RFDwasthe most abundant(3.615 g/100 g)followed by HAD (3.551 g/100 g) and the SD powderhad minimum content of total FAA (1.175 g/100 g).As a result, HA-RFD can reduce thermal quality degra-dation and improve nutritional value with the lowestdamage to FAA due to its unique drying advantage[s451(large penetration depth, heating uniformity, etc.).[45]On the other hand, it was reported that Asp and Gluexhibited umami taste among all the 17 kinds of aminoacids.41] The total content of Asp and Glu for HA-RFD Table 4. Taste of chicken powder (CP) using HAD, HA-RFD and SD detected via electronic tongue. Samples Sourness Astringency Aftertaste-A Umami Richness Saltiness Reference 0 0 0 0 0 0 HAD-CP -41.06±0.08° -6.95±0.01 -0.62±0.02° 10.88±0.05 1.52±0.08° 5.35±0.02bc HA-RFD-CP -40.65±0.01 -7.58±0.05 -0.56±0.07° 11.80±0.08° 1.70±0.20° 5.39±0.05° SD-CP -41.33±0.11° -7.76±0.01° -0.36±0.03 11.23±0.11° 1.41±0.11 5.78±0.04° Different letters indicate a significant difference (p<0.05). HAD, hot air drying; HA-RFD, hot air assisted radio frequency drying; SD, spray drying. mAU 0 5 10 15 20 25 30 min Figure 8.5.TThe HPLC chromatograms of chicken powder samples prepared using hot air drying (HAD) (a), hot air-assisted drying(HA-RFD) (b) and spray drying (SD) (c), respectively. chicken powder accounted for 0.68 g/100 g, next by SD(0.63 g/100 g) and HAD (0.41 g/100 g), which accordedwith the result of E-nose, showing HA-RFD sampleshad the largest umami vaule (11.80), followed by SDsamples (11.23), and HAD chicken powder showedthe weakest umami taste (10.88). Therefore, from the perspective of 1flavor andnutrition, HA-RFD or HAD processing would be analternative way for producing chicken powder. Hygroscopicity of chicken powder Hygroscopicity is one of the most quality index ofpowder products for the reason that it would affectthe stability of the physicochemical properties ofpowder during storage and later preparation processes.Nevertheless, it is troublesome that food extract pow-ders usually exhibit a relatively high hygroscopicity, which makes a difficulty for the preparation process asa result of easy caking and adhesion of powders. Beyondthat, it can bring about the increase of moisture contentof powders, ultimately creating favourable circumstancefor microbial growth and biochemical reactions. 46,47 In Table 6 and Figure 9, hygroscopicity values of alldried chicken powder were seen. It was noted that pow-der obtained by HA-RFD showed the lowest degree ofhygroscopicity (1.80%), next by HAD (2.40%), whilstthe SD powder had obviously highest hygroscopicityvalue (8.40%). Based on previous studies, moistureexists in the dried materials in bound water and freewater states. Generally speaking, products easily hygro-scopic have a comparatively high amount of boundwater and a lower amount of free water due to the factthat bound water reserved in the void areas of the driedmaterials possesses less equilibrium vapor pressure androtational freedom as well as energy absorption from Table 5. Content of free amino acid (FAA) of chicken powderdried by using HAD, HA-RFD and SD determined using highperformance liquid chromatography (HPLC) measurement. HAD chicken HA-RFD chicken SD chicken FAA types powder powder powder Asp 0.16 0.07 0.06 0.25 0.61 0.57 0.08 0.06 0.03 0.04 0.08 0.01 0.12 0.05 0.07 0.13 0.13 0.04 Arg 0.32 0.47 0.04 0.24 0.25 0.08 0.13 0.10 0.03 Cys-s 0.03 0.04 0.02 Met 0.33 0.30 0.04 Val 0.14 0.09 0.04 Phe 0.27 0.18 0.02 lle 0.26 0.26 0.03 Leu 0.71 0.55 0.03 0.26 0.36 0.04 0.09 0.03 0.03 Total 3.551 3.615 1.175 content (g/100 g) HAD, hot air drying; HA-RFD, hot air assisted radio frequency drying; SD,spray drying. the field than free water reserved in the same manner.Put another way, strong hygroscopicity may occur whenthere presents5、significant free water in the driedmaterial.48] Hence, the reason for lower hygroscopicityof HA-RFD chicken powder than that of HAD and SDpowder may be the less level of free water existing in theHA-RFD powder. Solubleness of chicken powder As can be seen in Table 6, the value of solublenessranged from 29.85% to 45.68%, a little different fromthe reported values of onion powder. 49] The watersolubility of chicken powder obtained by HA-RFDwas minimum (29.85%), followed by SD (36.74%) andHAD chicken powder owned the maximum value ofsolubleness (45.68%). Thus, the solubility of sampleswas correlated with drying methods. Different physicaland chemical variation happened during diverse dryingtechnologies caused inequable solubility of the finalproducts. Chicken powder products were widely usedas condiments in cuisine to accomplish improvementof flavor and taste for food. Therefore, unlike instant Table 6.FHygroscopicity, solubleness and rehydration ofchicken powder produced by using HAD, HA-RFD and SD. Drying Hygroscopicity Solubleness Rehydration methods (%) (%) ratio (%) HAD 2.40±0.02° 45.68±0.99° 130.27 ±1.97ab HA-RFD 1.80±0.04 29.85±1.01 137.72±1.03° SD 8.40±0.30° 36.74±1.05° 71.25±1.10 Different letters indicate a significant difference (p<0.05). HAD, hot air drying; HA-RFD, hot air assisted radio frequency drying;SD,spray drying. Figure 9. Physical properties (hygroscopicity, solubility andrehydration) of chicken powder dried by hot air drying (HAD),hot air-assisted drying (HA-RFD) and spray drying (SD). powder used as instant drinks or an additive of otherproducts (like tea and beverage), the water solublenesswas not very critical characteristic for chicken powder. Rehydration of chicken powder Rehydration is extensively recognized as a quality evalu-ation indicator of physical and chemical changes in thestructure and composition of food tissues resulted fromdehydration process. 50] Chicken powder obtained usingdifferent drying methods (HAD, HA-RFD and SD)showed different rehydration level (Figure 9). The rehy-drationvalues of HA-RFDpowder were higher(137.72%) than those of HAD (130.27%) and SD pow-der (71.25%), as seen in Table 6. The rehydration ratiovalue of AD chicken powder seemed to be inconsistentwith the consequence observed with onion powder inthat AD onion powder had a higher rehydration ratiovalue.[49] Furthermore, the order of the drying methodsresulting in a higher rehydration was not the same withthe result of Roknul et al.,25] in which rehydrationcapacity for stem lettuce slices dried with HAD wasweaker than that for stem lettuce slices dried withHA-RFD. It was illustrated that smaller physical andchemical changes occurred in HA-RFD treatment dueto uniform heating and shorter drying time in compari-son to HAD. However, rehydration appeared to differdepending on food samples, and many other factors(such as dryness, amorphous-crystalline state, etc.).3,51 Conclusions We produced chicken powder from chicken meat andbone using HAD,HA-RFD and spray drying and dryingtime along with physicochemical characteristics were compared. On the basis of drying time required,HA-RFD was the most effective method and HADwas the slowest to achieve target moisture content. Interms of product quality, HA-RFD exhibited the lowesthyscopicity, best rehydration, and better flavor and tasteas well as color, while for chicken powder produed byspray drying showed the most undesirable color andflavor and highest degree of hygroscopic, which is adominating cause for caking and spoiling of products.Concerning FAA content, the total FAA content ofHA-RFD was the most abundant, followed by HAD,and the SD powder had minimum content of totalFAA, which suggested that HA-RFD can reduce thermalquality degradation and improve nutritional value withthe lowest damage. Besides, HA-RFD chicken powderhad the largest total content of Asp and Glu, which wereregarded as primary contributor to umami taste. From the point of flavor and nutrition, it wasconcluded that hot-air drying or HA-RFD processesappeared to be an industrial application potential forchicken powder production. Nonetheless, before popu-larization, spray drying is still be a preferred technologyfor producing chicken powder if low cost and higherproduction throughput are required. Funding ( This work was f i nancially supported by National Key R&DProgram o f China ( Contract No. 2017YFD0400901), J iangsuProvince ( China) A g ricultural I n novation Pr o ject (C o ntractNo. C X(17)2017), Jiangsu P rovince ( C hina) “ C ollaborativeInnovation Center for Food Safety and Quality ControlIndustry Development P rogram, J iangsu Province Key Lab-oratory Project of Advanced Food Manufacturing Equipment and Technology (No. FMZ201803). ) ( References ) ( [1] Krokida, M. K.; Maroulis, Z. B. Effect of Drying Method on S hrinkage a nd P o rosity. Drying T e chnol. 1997, 15(10),2441-2458. DOI: 10 . 1 0 80 / 0 7 373 9 397 0891 7 369 . ) ( [2] K H rokida, M . K .; Karathanos, V. T . ; Maroulis, Z . B . Compression A nalysis s of Dehydrated A gricultural Products . Dryin g T echnol. 2000, , 18(1-2),395-408. DOI: 1 0 . 1 08 0/ 0 73739 3 0 008 9 177 11 . ) ( [3] I Ratti, C. Hot\Air and Freeze-Drying of High-ValueFoods: A Review. J. Food Eng. 2001,49(4), 311-319. DOI: 1 0.1 0 16/ s0 260-8 7 74(00 ) 00 2 28- 4. ) ( [4] M N arra, F.;Zhang, L.; Lyng, J. G. Radio Frequency Treatmentof Foods: R eview of Recent A d vances. J. F o od Eng. 2009, 91(4), 497-508. DOI: 10.1016 / j. j fo oden g. 2 008 . 10.0 15 . ) ( [5 W ] ang, Y . ; Zhang, L . ; Johnson, J ; Gao, M.; Tang, J.; Powers, J . R.; Wang, S . D e veloping Hot Air-Assisted Radio F requency Drying for In-shell Macadamia Nuts.Food Bioprocess Technol. 2013,7(1),2 7 8-288. DOI: 10 .100 7 / s 11 947 -01 3 - 1055 -2 . ) ( [6] Wang, Y . Y.; Li, Y . R.; W a ng, S. J.; Li, Z . ; G a o, M. X.; T ang, J . M. R eview of Dielectric Drying of Foods a n dAgricultural Products. Int. J. Agric. Biol. Eng. 2011, 4(1), 1-19. ) ( [7] Guo, W .; Z hu, X . Dielectric Properties of Red Pepper Powder Related t o Radiofrequency and Microwave Dry-ing. Food B ioprocess T echnol. 2 014, 7(12), 3 591-3601. DOI: 1 0. 1007 /s 119 47-0 1 4 -13 75 -x . ) ( [8] F : arag, K. W .; L yng,J. G .; Morgan, D. J.; Cronin, D. A. A Comparison of C onventional a nd R adio F r equency Thawing of B eef Meats: E ffects on Product Temperature D i stribution. Food B i oprocess Technol. 2009, 4(7), 1128-1136. DOI: 1 0 . 100 7 /s119 47 - 00 9- 0205-z. ) ( [9] Farag, K. W.; Marra, F .; Lyng, J. G.; Morgan, D . J; Cronin , D. A. Temperature Changes and P ower Consumption During Radio F r equency Tempering o f Beef L ean/Fat F ormulations. Food Bioprocess T echnol. 2008, 3(5), 732-740. DOI: 1 0.1007/ s 1 194 7 - 0 0 8 - 0 1 3 1- 5. ) ( [10] 1 L uechapattanaporn, K .; Wang, Y.; Jian, W.; T ang, J; Hallberg, L. M.; Dunne, C. P. S terilization of ScrambledEggs i n M ilitary P olymeric Trays by R a dio FrequencyEnergy. J. Food Sci. 2005, 70(4), E288-E294. DOI: 1 0.1 1 11 /j .1 365-26 2 1 . 200 5 .tb 0 71 8 5.x. ) ( [11 ] Gao, M .; T ang, J ; Villarojas, R.; Wang, Y.; W ang, S . Pasteurization Process Development f or C ontrolling Salmonella in In-Shel l Almonds using Radio Frequency Energy. J . F ood E ng. 2011,104(2),299-306. DOI: 1 0 . 1 01 6/ j.j f oo de n g .2 010. 1 2 . 0 21 . ) ( [12] W ang, S.; M o nzon, M.; Joh n son, J. A.; Mitcham, E. J.; Tang, J . Industrial-Scal e Radi o Frequency Treatments f or Insect Control i n Walnuts: II: I nsect Mortality and P roduct Quality. Postharvest B i ol. Technol. 2007, 45(2),247-253. DOI: 10 . 1 0 16 /j .posth a r vbio .20 0 6 . 12 .0 2 3. ) ( [13 ] L agunassolar, M. C.; Pan, Z.; Zeng, N. X.; Truong, T. D.; Khir, R.; Amaratunga, K. S. P. Ap plication of Radiofrequency Power for Non-Chemical Di s infestationof Rough R i ce with Full R etention of Quality Attributes. Appl. Eng. Agric. 2007,23(5), 647-654. DOI: 10.1303 1 / 2013 .236 6 1. ) ( [14] 4 L ee, N .-H.; L i, C .; Zhao, X.-F.; P ark, M .-J. Effect o f Pretreatment y with H igh Temperature and L ow Humidity on Drying Time and Prevention of Checking During R adio-Frequency/Vacuum D r ying o f J a paneseCedar P i llar. J . . Wood Sci.2009, , 56(1), 19-24.DOI:1 0 . 1 0 0 7/s 10086 - 009 - 10 50- 4 . ) ( [15] 1 L i, C.; Lee, N. H. The Effect of Compressive Load on theMoisture Content of OakBlocksDuringRadio- Frequency/Vacuum Dr y ing. Fo r . Prod. J.20 0 8, 58 ( 4),34-38. ) ( [16] Koumoutsakos, A.; A v ramidis, S.; H a tzikiriakos, S. G . Radio Frequency Vacuum D r ying of Wood. II. Experi- mental Model Evaluation. Drying Technol. 20 0 1, 19(1), 85-98. DOI: 10. 10 81/d r t- 100 0 01 35 3 . ) ( [17 G ] ong, Z . ; Z hang, M.; M u jumdar, A. S. ; Sun, J. S p rayDrying and Agglomeration of Instant B a yberry Powder.Drying Technol. 2 007, 2 6 (1), 1 1 6-121. DOI: 10 . 1 0 8 0/0 7 37 39 3 0 7 01 7 81 7 51. ) ( [18] R oos, Y . H .; Himberg, M . J. Nonenzymatic Browning Behavior, as R elated to G lass Transition, of a Food Model a t Chilling Temperatures. J . Agric. F ood Chem.1994,42(4),893-898. DOI: 1 0 . 1 0 21 / j f0 0040a011. ) ( [19] Lloyd, R . J .; Chen, X. D.; Hargreaves, J. B . Glass Tra n - sition and C aking o f S p ray-dried l a ctose. I nt. J . FoodSci. . . T echnol. 1 996, 3 1(4), 305-311. DOI: 1 0 .1 0 4 6 / i .1 36 5 -26 21. 19 9 6.00352. x . ) ( [20] Goula, A. M.; Adamopoulos, K. G.; K a zakis, N . A. Influ- ence of Spray Drying Conditions on T omato P o wderProperties. Drying T echnol. 2 004, 22(5), 1129-1151. DOI: 1 0.1 08 1/dr t -12 0 0 3 85 84 . ) ( [21] Goula, A. M.; Adamopoulos, K. G. S p ray D r ying of T omato Pulp in D e humidified Air: I. T he E f fect on Product R ecovery. J . Food E ng. 2 005, 6 6(1), 25-34.DOI: 1 0. 101 6 / j .j fo ode ng . 200 4 .0 2 .0 2 9 . ) ( [22] Quek, , S. Y.; Chok K , , N. K.;Swedlund, P.. The P hysicochemical Properties of Spray-Dried Watermelon Powders. C hem. E n g. Process. Process Intensif. 2007, 46(5), 386-392. D OI: 1 0 .1 0 1 6/j.ce p. 2 0 06. 06.020. ) ( [23] L I iu, W.; Z hang, P. The T e chnology of Producing Pure C hicken P owder. Food Sci. Technol. 2012, 4,262-264. ) ( [24] Yi, F.-R.; Li, Y. Application of Natural C hicken Meat Powder&Natural Ch i cken Meat Pa s te i n I n stant Noodle I n gredients. S c i. Technol. F o od In d . 20 1 1, 10 , 470-472. ) ( [25] Roknul, A. S. M.; Zhang,M.; Mujumdar, A. S.; Wang, Y. A C omparative S tudy of F our Dr ying Methods onDrying Ti m e and Quality Characteristics of Stem LettuceSlices (Lactuca s ativa L.). Drying T e chnol. 2014, 32 ( 6),657-666. DOI: 1 0. 1 0 8 0/07373 93 7 . 201 3 .850 4 35. ) ( [26] F eng, Y. F .; Zhang, M.; Jiang, H.; Sun, J . C. Microwave-Assisted Spouted B ed Drying o f Lettuce Cubes. D r ying Technol . 2012, , 30(13), 1 1482-1490. . DOI: 1 0. 10 8 0 / 0737 39 3 7 .20 12 .69 19 29. ) ( [27] Cao, X.; Zhang, M.; Qian, H.; Mujumdar, A. S.; Wang, Z. Physicochemical a nd Nutraceutical P roperties of Barley Grass Powder Microencapsulated by Spray Drying. Dry- ing Technol. 2017, 35(11), 1 358-1367. D O I: 10 . 1 0 80 / 0 7373937.201 7 .133 2 074 . ) ( [28] K ong, Y.; Zhang, L. L.; Sun, Y.; Zhang, Y. Y.; Sun, B. G.; Chen, H. T. Determination of the Free Amino Acid, Organic Acid, and Nucleotide in C ommercial Vinegars. J. Food Sci. 2017,82(5), 1 116-1123. DOI: 10. 1 111 / 1 750- 384 1.13 696. ) ( [29] K im, S . H . ; Choi, Y. J; Lee, H.; Lee , S.- H .; Ahn , J.-B.; Noh, B.-S.; M in, S. C . Physicochemical Properties of Jujube Powder from Air, Vacuum, and F r eeze Dryingand their Correlations. J. Korean Soc. Appl. Biol . Chem.2012,55(2),271-279. DOI: 1 0 .1007 /s137 6 5-012- 1 0 39- 3. ) ( [30] B Iorompichaichartkul, C . ; L u engsode, K.; Chinprahast,N.; Devahastin, S. Improving Quality of Macadamia Nut ( Macadamia integrifolia) through the Use of HybridDrying Process. J. Food Eng. 2009,93(3), 348-353. DOI: 1 0.10 16 /j. jfoode ng.200 9 .01 . 03 5 . ) ( [31] B aysal, T . ; Icier, F.; E rsus, S.; Y ildiz, H . Effects o f Micro- wave and Infrared D r ying on the Qu a lity of Carrot andGarlic. Eur. Food R es. Technol. 2003, 218(1), 68-73.DOI: 1 0 .1 0 07/ s0 0 2 1 7 -003 -0 791 - 3. ) ( [32]\ Wang , J .; Sheng, K . Far-Infrared a nd 11 Microwave Drying of Peach. L WT-Food Sci. Technol. 20 0 6, 39 ( 3),247-255. DOI: 10.1 01 6 / j.lwt.20 0 5. 02 .0 0 1. ) ( [33] T 7 routman, M . Y.; M a stikhin, I . V .; B alcom, B. J ; Eads, T. M .; Ziegler, G. R. Moisture M igration in S oft- Panned Confections D uring Engrossing and Aging a s ) ( Observed b y M agnetic Resonance I m aging. J . F o odEng. 2001, ) ( 48(3),257-267. DOI: 10.1 0 1 6 /s 02 60- 8 7 74( 00 ) 00 1 67 -9 . ) ( [34] C ( haland, B.; M ariette, F.; Marchal, P.; De, C. J. 1HNuclear M agnetic R e sonance Relaxometric Ch a racteri- zation of Fat and Water States in Sof t and Hard Cheese. J. Dairy Res. 2000, 6 7(4), 609. DOI: 1 0 .101 7/ s0 022 0 29 900 004398 . ) ( [35] ( Q iao, Y .; Galvosas, P.; Callaghan, P. T . D i ffusion Correlation NMR S p ectroscopic Study of Anisotropic Diffusion of Water in Plant T issues. B iophys. J. 2005,89(4), 2899-2905. DOI: 1 0 . 15 29 /bi op h y s j .105 .0 6 4 70 9 ) ( [36] K ] han, M. I. H.; Wellard,R . M.; Nagy, S. A.; Joardder, M. U. H .; K arim, M. A . I n vestigation of Bound an d Free Water i n P lant-Based Food M aterial using NMR T 2 Relaxometry. Innovative Food Sci. Emerg. T echnol..2016, 38,252-261.DOI: 10 . 10 16/ j .i fs et. 2 0 1 6.1 0 . 0 1 5. ) ( [37] Z eng, Q.-R.; Zhang, M.; Adhikari, B. P.;Mujumdar, A. S. Effect of Drying Processes o n the Fu n ctional Properties of C ollagen P eptides Produced f r om C h icken Sk i n. Drying T echnol. 2013、 31(13-14), 1653-1660. DOI: 1 0 .10 80/ 0 7 373 9 37 . 201 3 . 790 8 2 6. ) ( [38] M artins, S. I. F . S.; Jongen, W. M. F . ; B oekel, M. A . J . S.V. A Review N oof M aillard R eaction in Food and Implications to Kinetic Modelling. Trends F o od Sci.Technol. 2000, 11(9-10), 364-373. DOI: 1 0.1 0 16/s0924 - 2 2 44 ( 0 1 )0 00 22 -x. ) ( [39] Mildner-Szkudlarz, ,S.; Siger r , , A.; S zwengiel, A.; P rzygonski, K .; W ojtowicz, E.; Z a wirska-Wojtasiak, R. PhenolicCompounds Reduce Formation of N(epsilon)-(carboxymethyl)lysine and P yrazinesFormed by Maillard Reactions in a Model Bread System.Food Chem. 2017, 2 31, 1 75-184. DOI: 1 0. 101 6/ j . food c h e m . 2 0 1 7 . 0 3.1 26 . ) ( [40] Wang, R.; Y ang, C .; Song, H. Key Meat Flavour Com- pounds Formation Mechanism in a Glutathione-Xylose Maillard Reaction. Food Chem. 2012,1 3 1(1),280-285. D OI: 1 0.1 0 1 6 / j.f o odchem. 2 0 11. 0 8. 0 7 9. ) ( [41] L iu, J .; Liu, M.; He, C.; Song, H.; Chen, F. Effect of Ther- mal Treatment on the F lavor Generation from Maillard Reaction of Xylos e an d Chicke n Peptide. LWT-FoodSci. Technol. 2015, 64(1), 3 16-325. D OI: 10 .101 6 / j . l w t. 2015. 05 .0 6 1. ) ( [42] Z 2 hu, L . ; Seburg, R. A.; Tsai, E.; Puech, S.; Mifsud, J.- C . Flavor Analysis in a P harmaceutical Or al SolutionFormulation Using an f Electronic-Nose. J. Pharm. Biomed. Anal. 2004,34(3),4 5 3-461. DOI: 1 0. 1016 / s0 7 3 1 - 7085(03) 0 0 6 5 1- 4 . ) ( [43] Ghasemi-Varnamkhasti, M . ; A g hbashlo,M. Ele c tronic Nose and E l ectronic Mucosa as Innovative Instrumentsfor Real-Time M onitoring of Food Dryers. Trends Food S ci. Technol.2014, 38(2), 158-166. ) ( [44] S un, H.; Liu, F.; Sun, L.; Liu, J.;Wang, M.; Chen, X.; Xu, X.; Ma, R.; Feng, K . ; Jiang, R . P r oteomic An a lysis of Amino Acid M e tabolism Differences b etween W ild and C ultivated Panax Ginseng. J. Ginseng Res. 2016, 40 (2), 1 13 . D OI: 1 0 .1 01 6 / j.jg r .20 1 5.06 .0 01. ) ( [45] Z hang, M.; Chen, H.; Mujumdar, A. S.; Zhong, Q.; Sun, J.Recent Developments i n H igh-Quality Drying withEnergy-Saving C h aracteristic f or Fresh Foods. D r ying Technol l . . 2015, 33(13), 1 590-1600.DOII: 1 0.1 0 80/ 073 7 393 7 .2 015 . 1 0 122 67. ) ( [46] Carpin, M.; B e rtelsen, H .; D a lberg, A.; R o i land, C. ; Risbo,J.; Schuck, P.; Jeantet, R. Impurities Enhance Cak- ing in L actose Powder. J. Food E ng. 2017, 1 98, 91-97. D OI: 1 0 . 10 1 6/j.jfo od e ng .20 1 6 . 11 .01 3. ) ( [47] Carpin, M.; Be r telsen, H.; Bec h , J. K.; Jeantet, R.; Risbo, J ; S chuck, P . C aking o f L a ctose: A C r itical Review. Trends Food Sci. . Technol . 2016,53, 1-12. DOI: 1 0 .1016 / j. t i fs . 2 0 1 6 . 0 4 . 0 0 2 . ) ( [49] Kim, H . R .; Seog, E . J.; Lee, J . H.; Rhim, J. W. Physicochemical Properties of Onion Powder a s I nfluenced by Drying Methods. J. Korean Soc. Food Sci. Nutr.2007, 36(3), 342-347. DOI: 10. 3 74 6 / j kf n .20 0 7 .36 .3.342. ) [50]Krokida, M. K.; Maroulis, Z. B. Structural Properties ofDehydrated Products during Rehydration. Int. J. FoodSci. Technol. 2010,36(5),529-538. DOI::10.1046/i.1365-2621.2001.00483.x. ( [51 ] K rokida, M. K.; Philippopoulos, C . R e hydration o f Dehydrated Foods. D rying T echnol. . 2005,23(4),799-830.DOI: 1 0 .108 1 / d rt -200 054 201. ) Full Terms & Conditions of access and use can be found athttps://www.tandfonline.com/action/journallnformation?journalCode=ldrt Taylor & Francis 采用热风干燥法(HAD)、热风辅助射频干燥法(HARFD)和喷雾干燥法(SD)制备了鸡粉。比较了干燥时间对产品风味、风味、游离氨基酸(FAA)含量和理化性质的影响。结果表明,HA-RFD是达到目标水分含量(低于5%)最快的方法(90 min),而HAD是最慢的方法(240 min)。在产品质量方面,HA-RFD鸡粉的吸湿性最低(1.80%),复水性最好(137.72%),风味、口感和色泽都较好;HAD鸡粉的色泽、水溶性最好(45.68%),复水性最好(130.27%)。而SD制得的鸡粉色香味差,吸湿性最高(8.40%)。此外,HA-RFD的总FAA含量最丰富(3.615 g/100 g),其次是HAD (3.551 g/100 g), SD粉的总FAA含量最低(1.175 g/100 g),说明HA-RFD可以降低热质量降解,提高营养价值,且损害最小。此外,HA-RFD鸡粉中Asp和Glu总含量最高(3.615 g/100 g),这是其鲜味的主要贡献者。结果表明,HAD和HA-RFD是一种较好的制备鸡粉的方法。
确定

还剩13页未读,是否继续阅读?

产品配置单
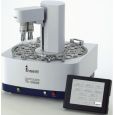
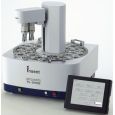
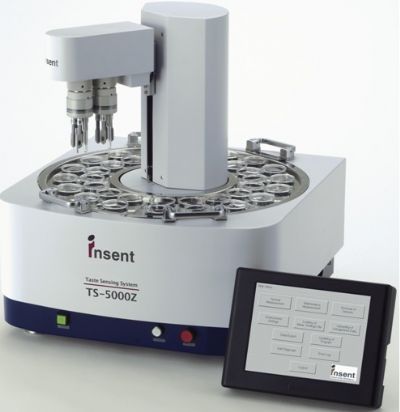
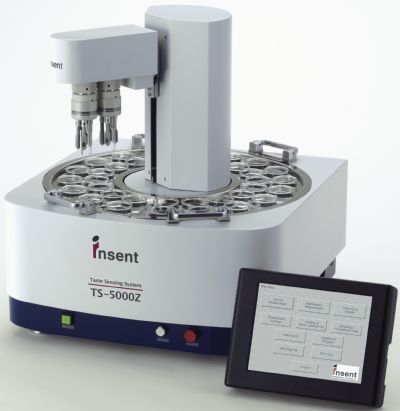
北京盈盛恒泰科技有限责任公司为您提供《鸡粉中产品风味、游离氨基酸(FAA)含量和理化性质检测方案(感官智能分析)》,该方案主要用于固态复合调味料中理化分析检测,参考标准--,《鸡粉中产品风味、游离氨基酸(FAA)含量和理化性质检测方案(感官智能分析)》用到的仪器有电子舌、日本INSENT味觉分析系统(电子舌)
推荐专场
感官智能分析系统(电子鼻/电子舌)

该厂商其他方案
更多