


方案详情
文
黄化是黄茶生产的关键工艺,但黄化过程对茶叶品质和化学成分的影响尚不清楚。本研究首次采用电子眼、舌及代谢组学研究茶叶黄变过程中的动态变化
方案详情

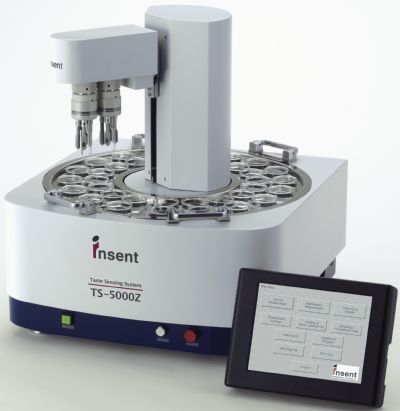
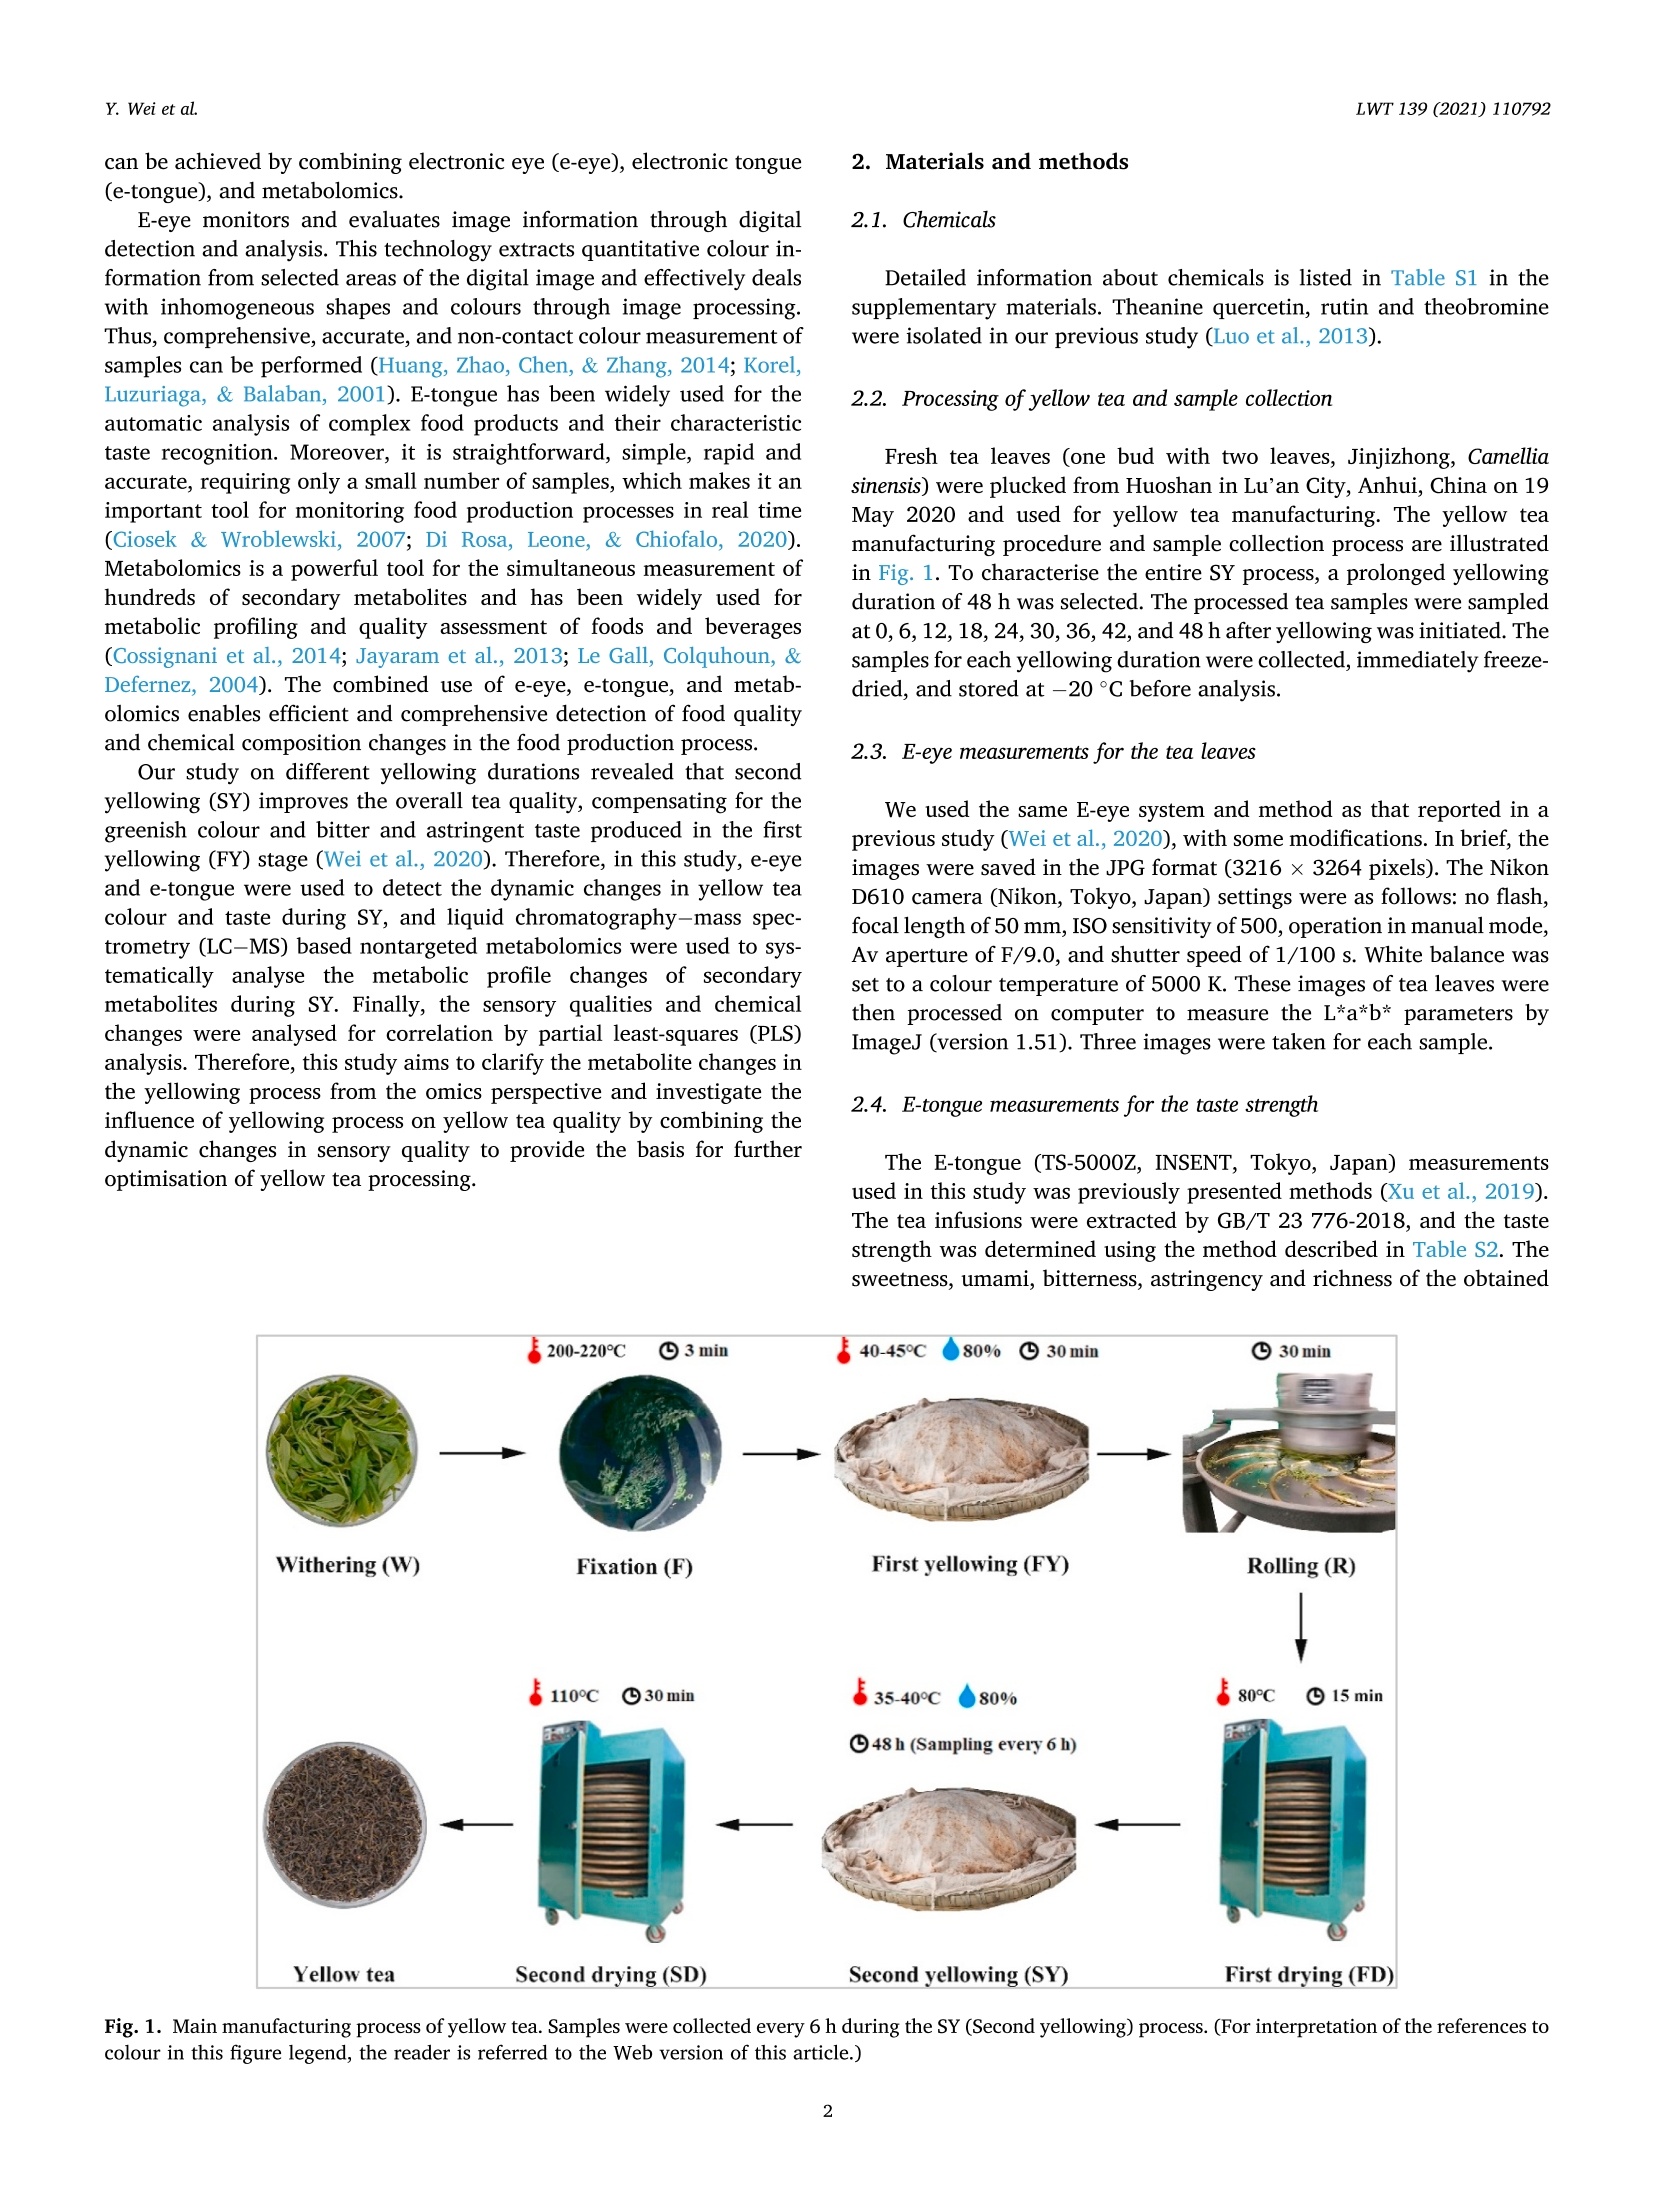
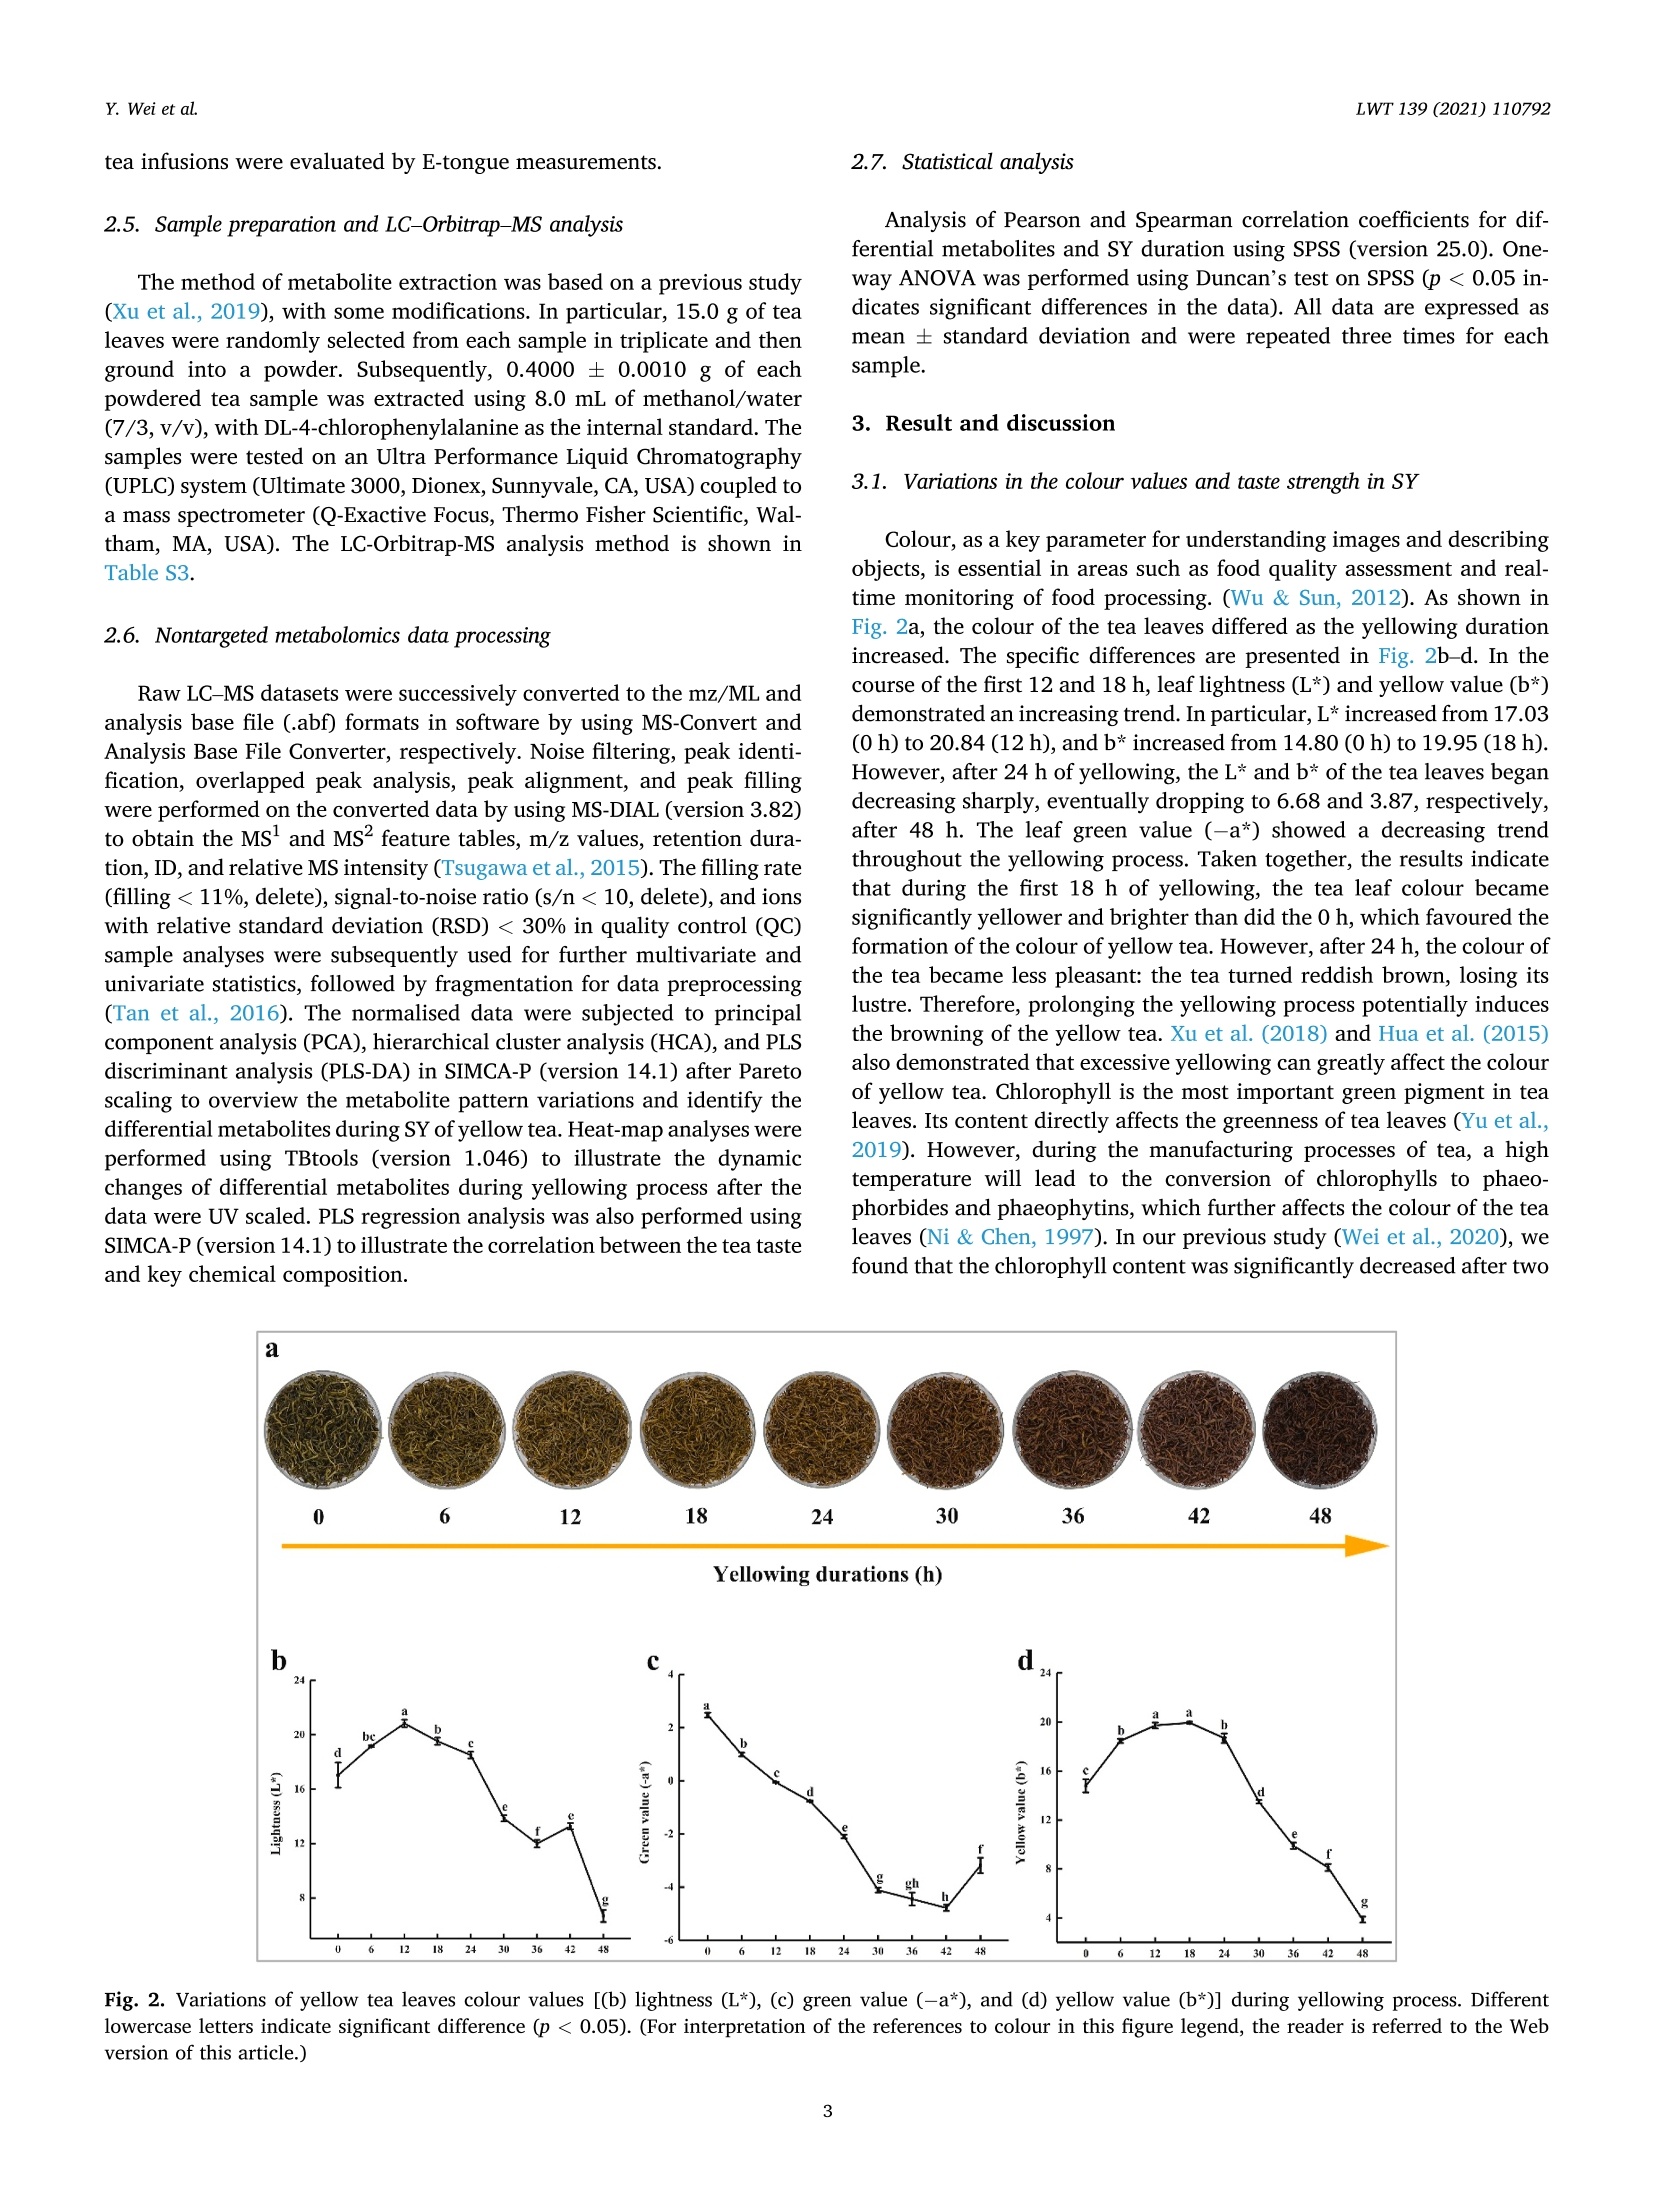
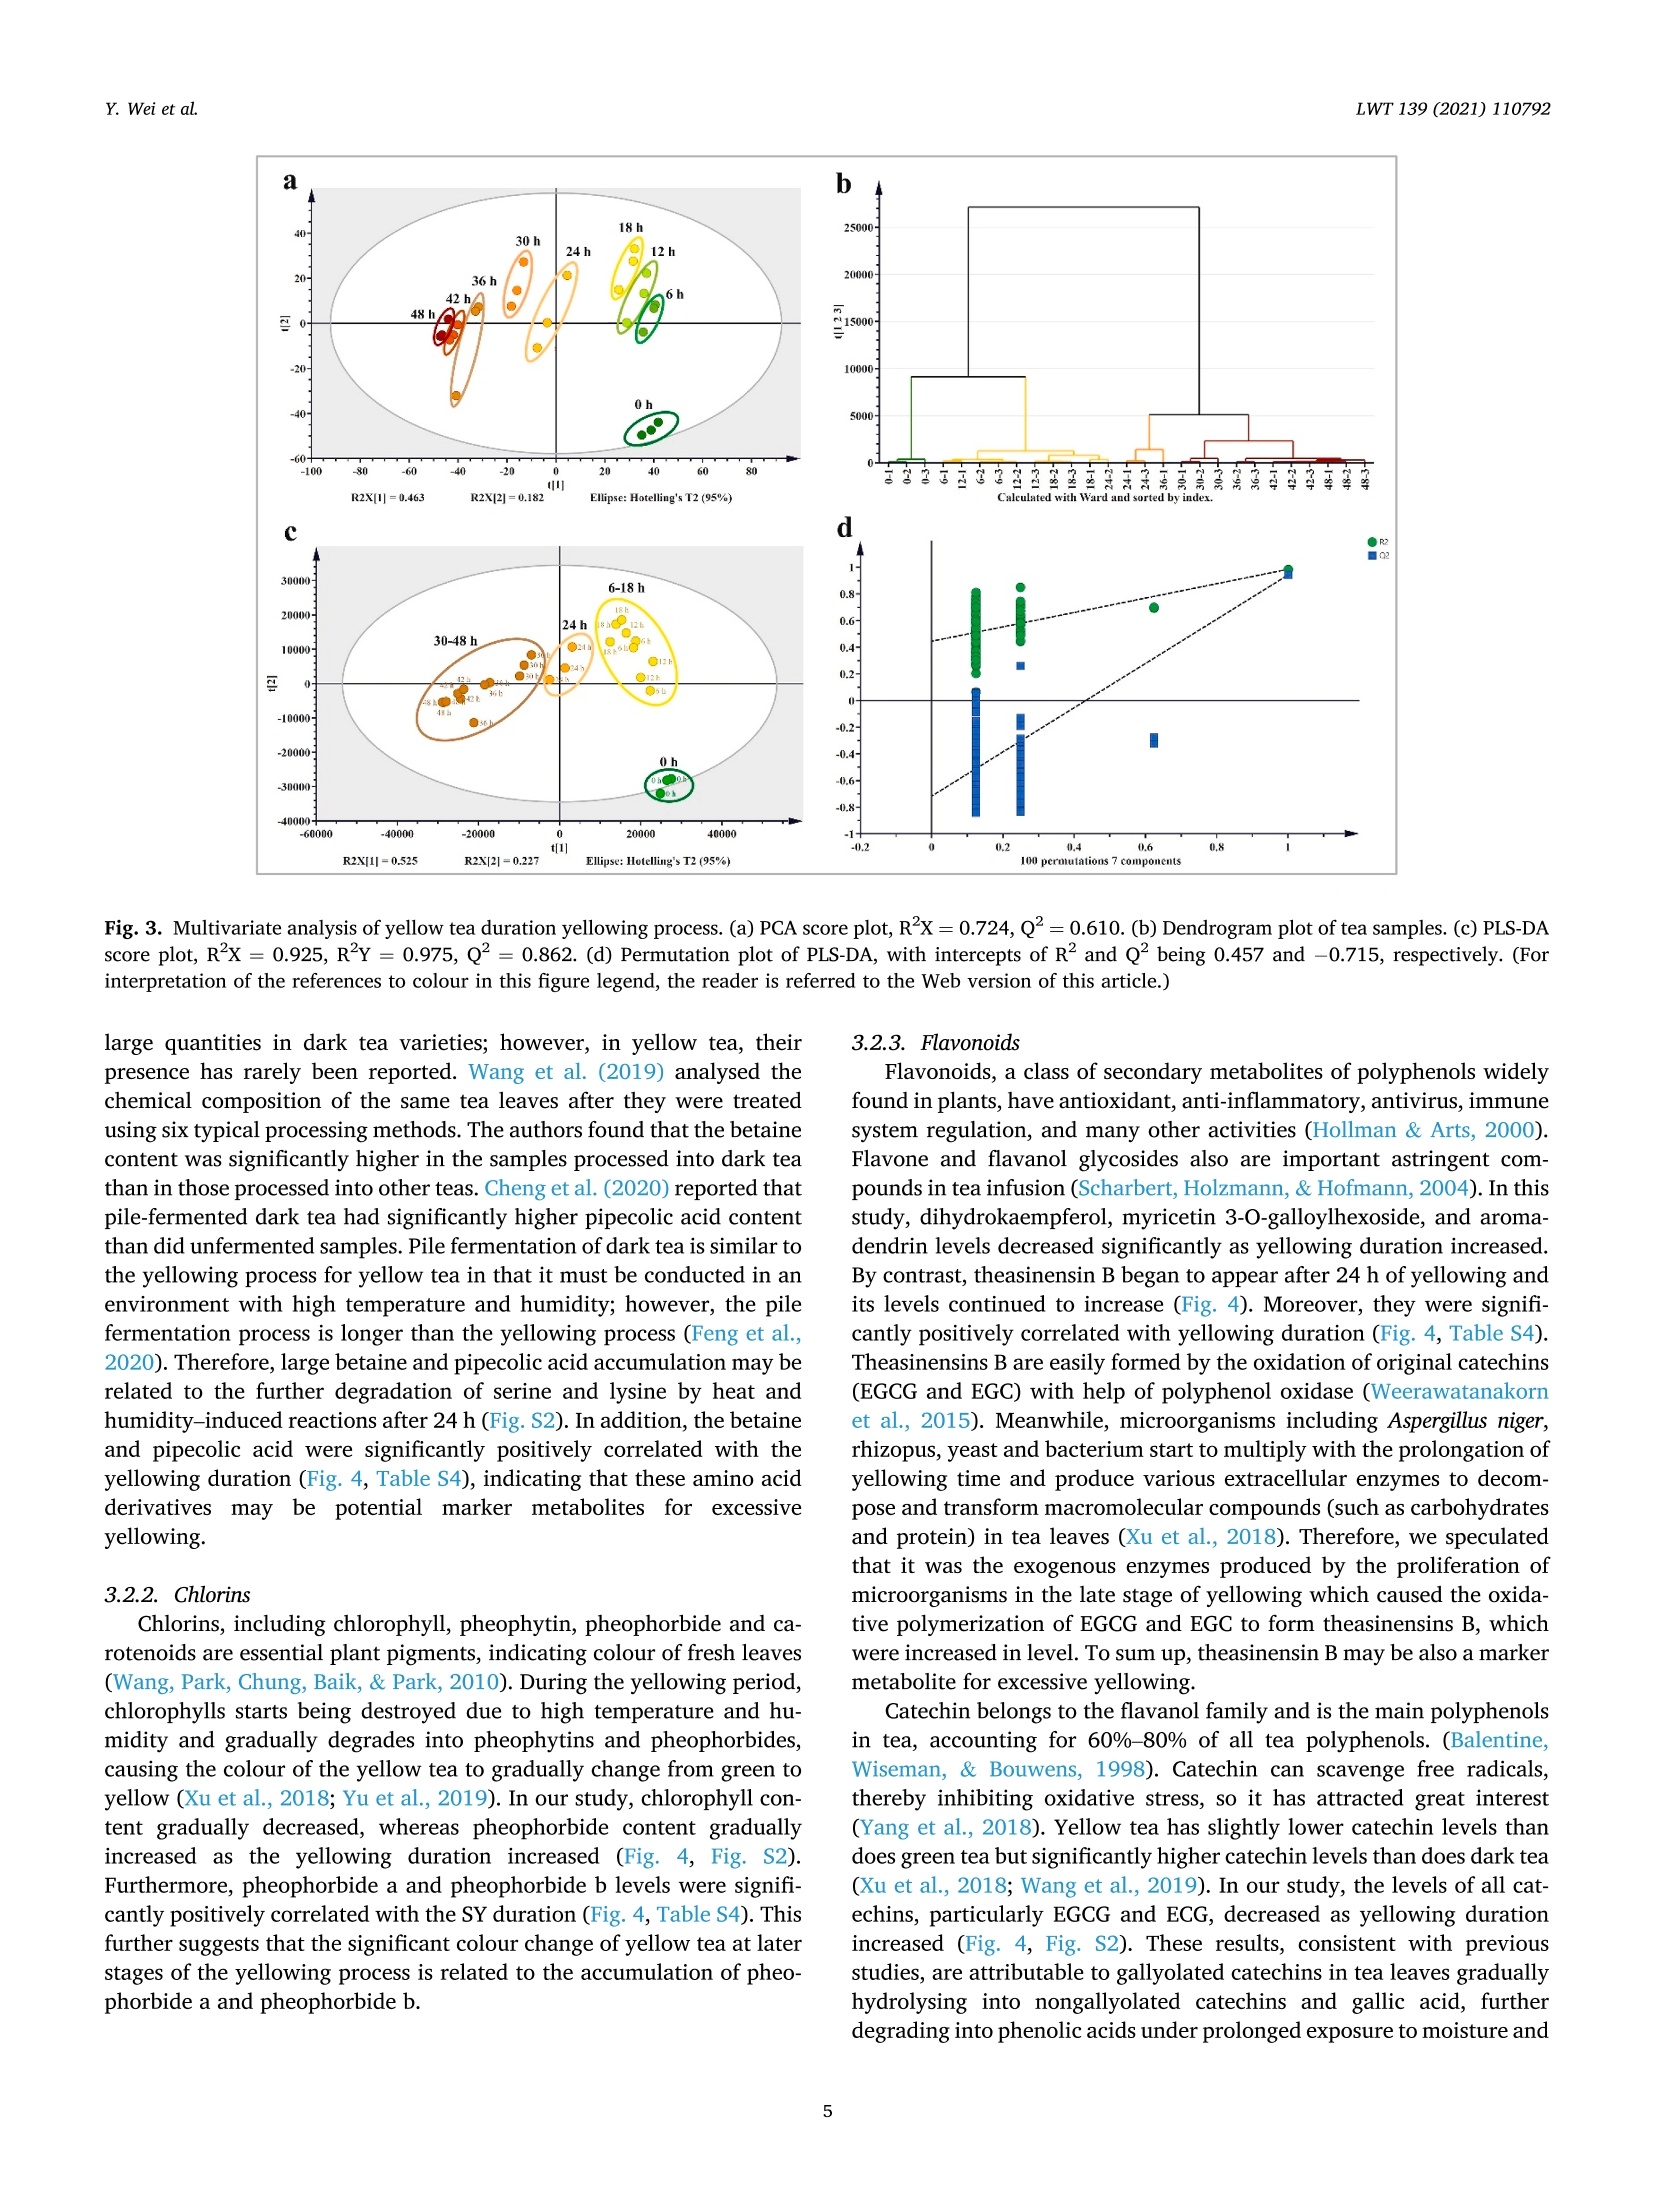
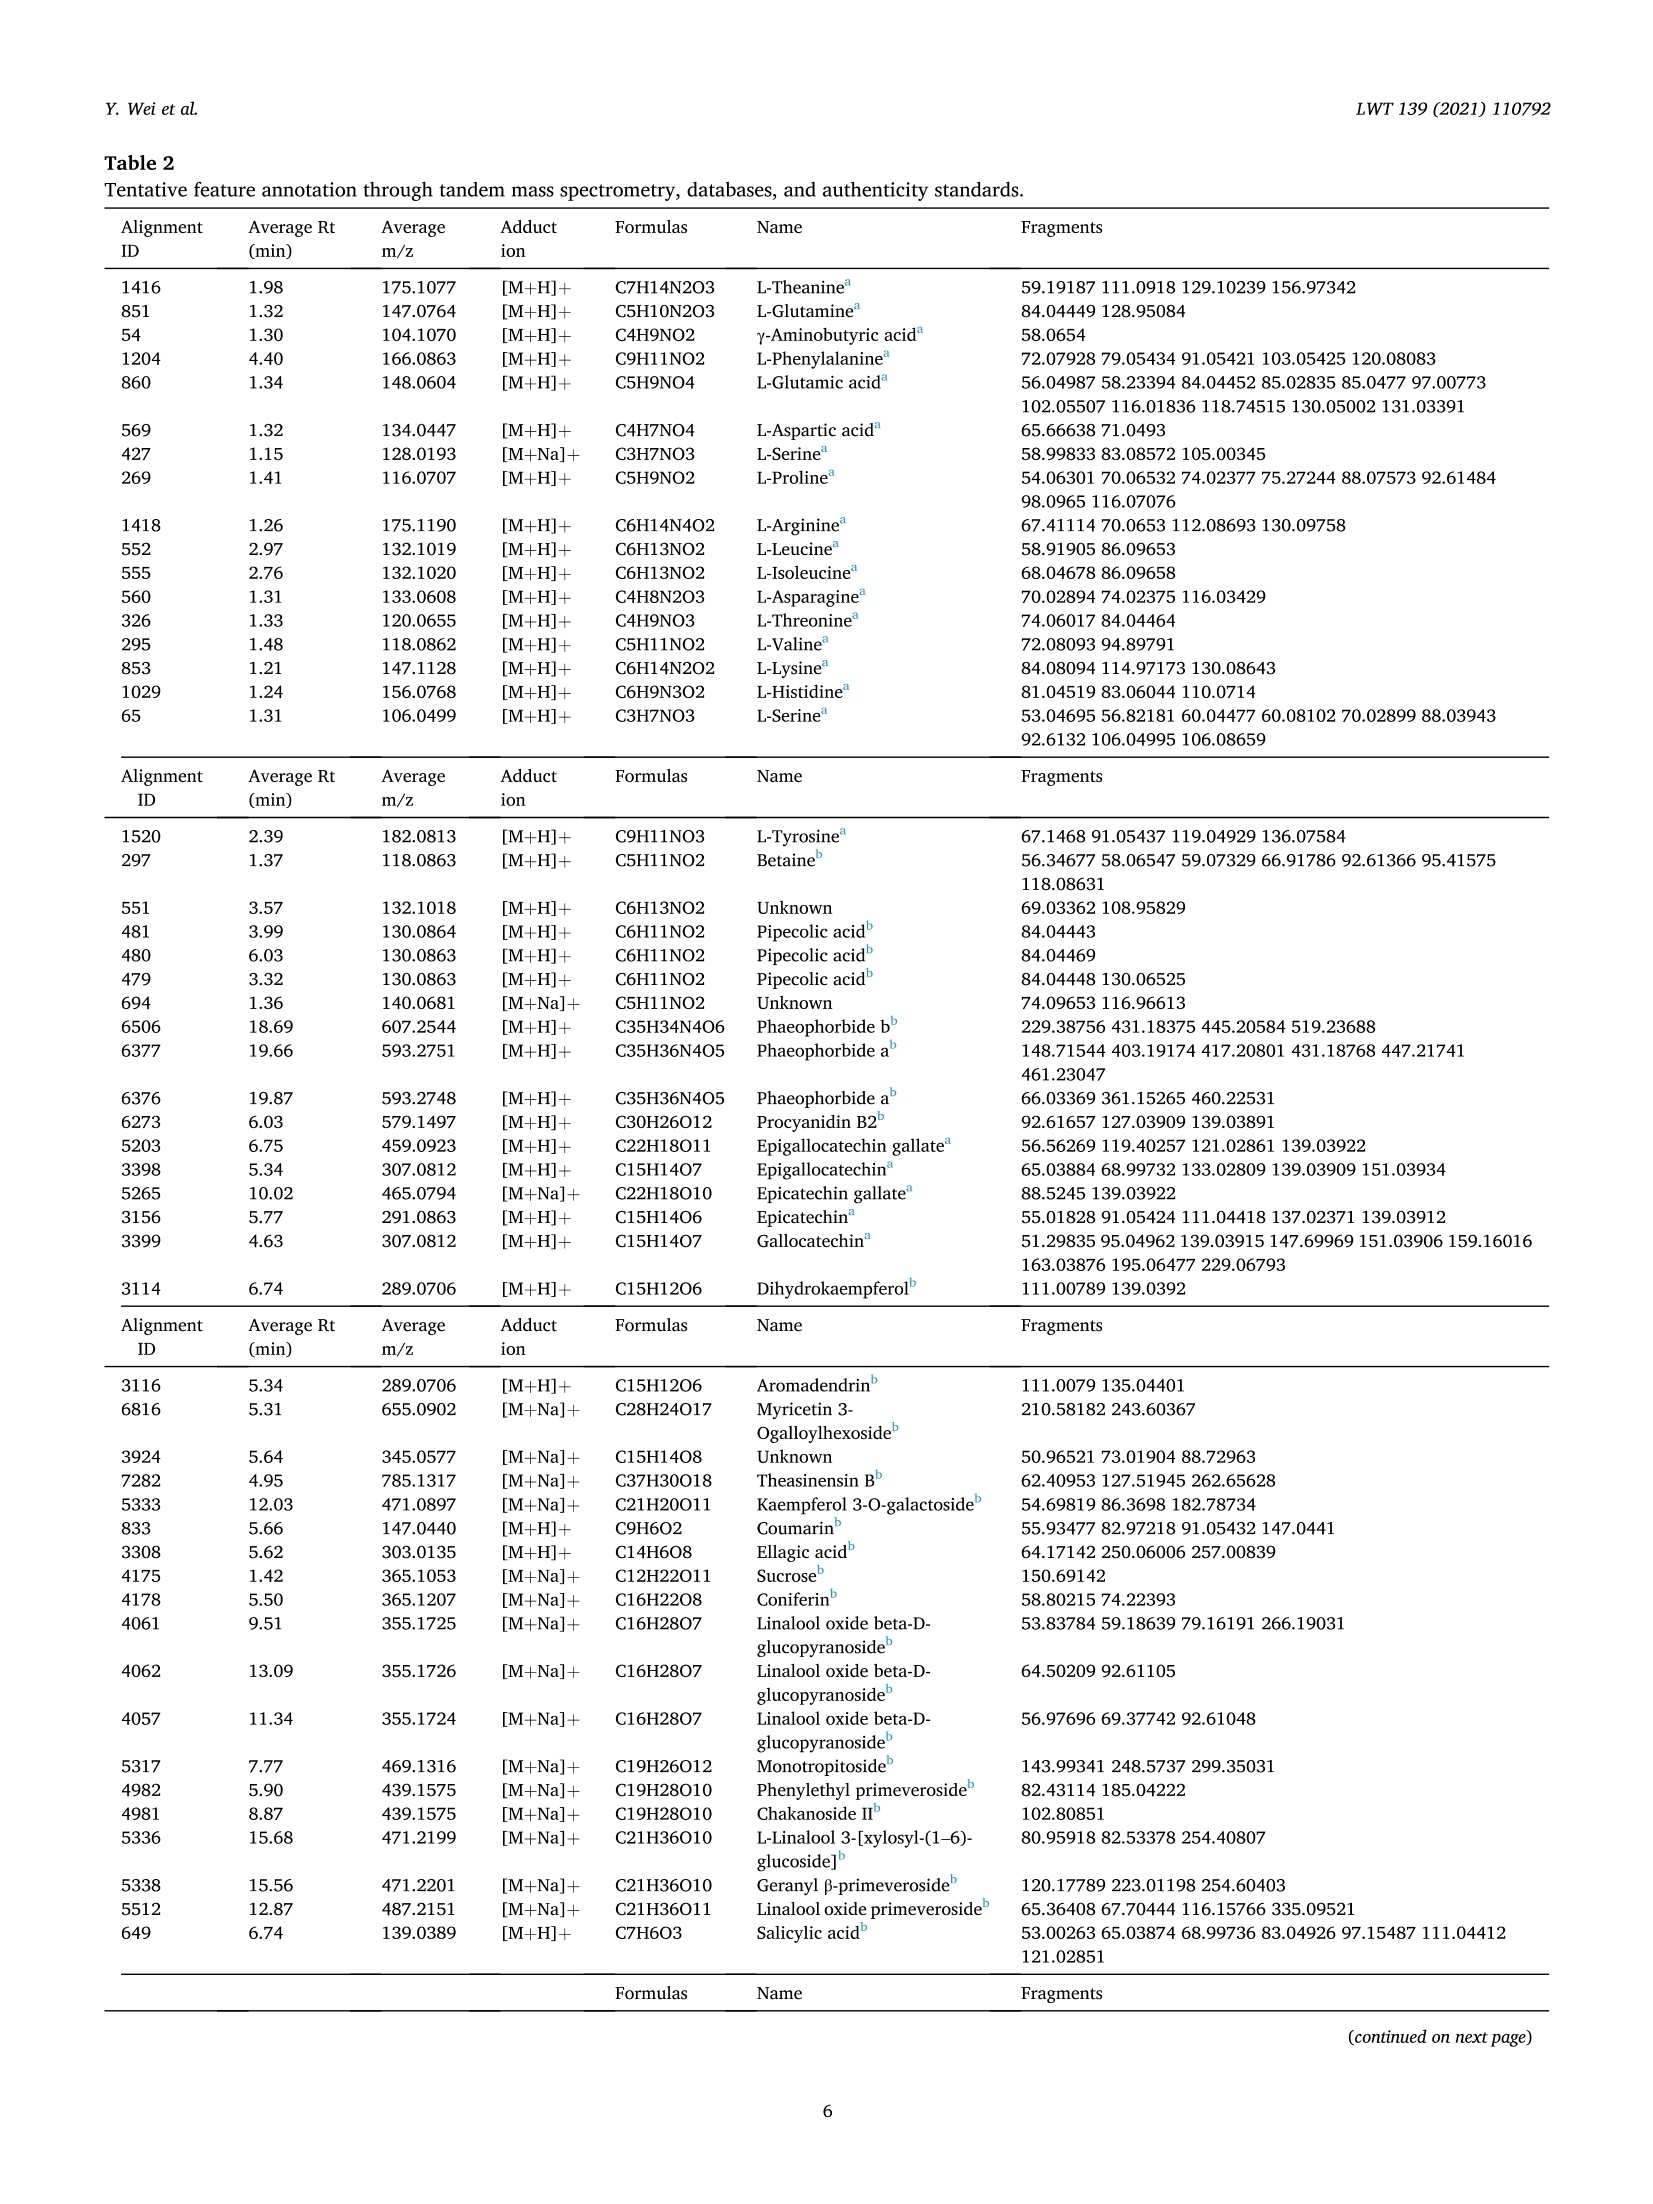
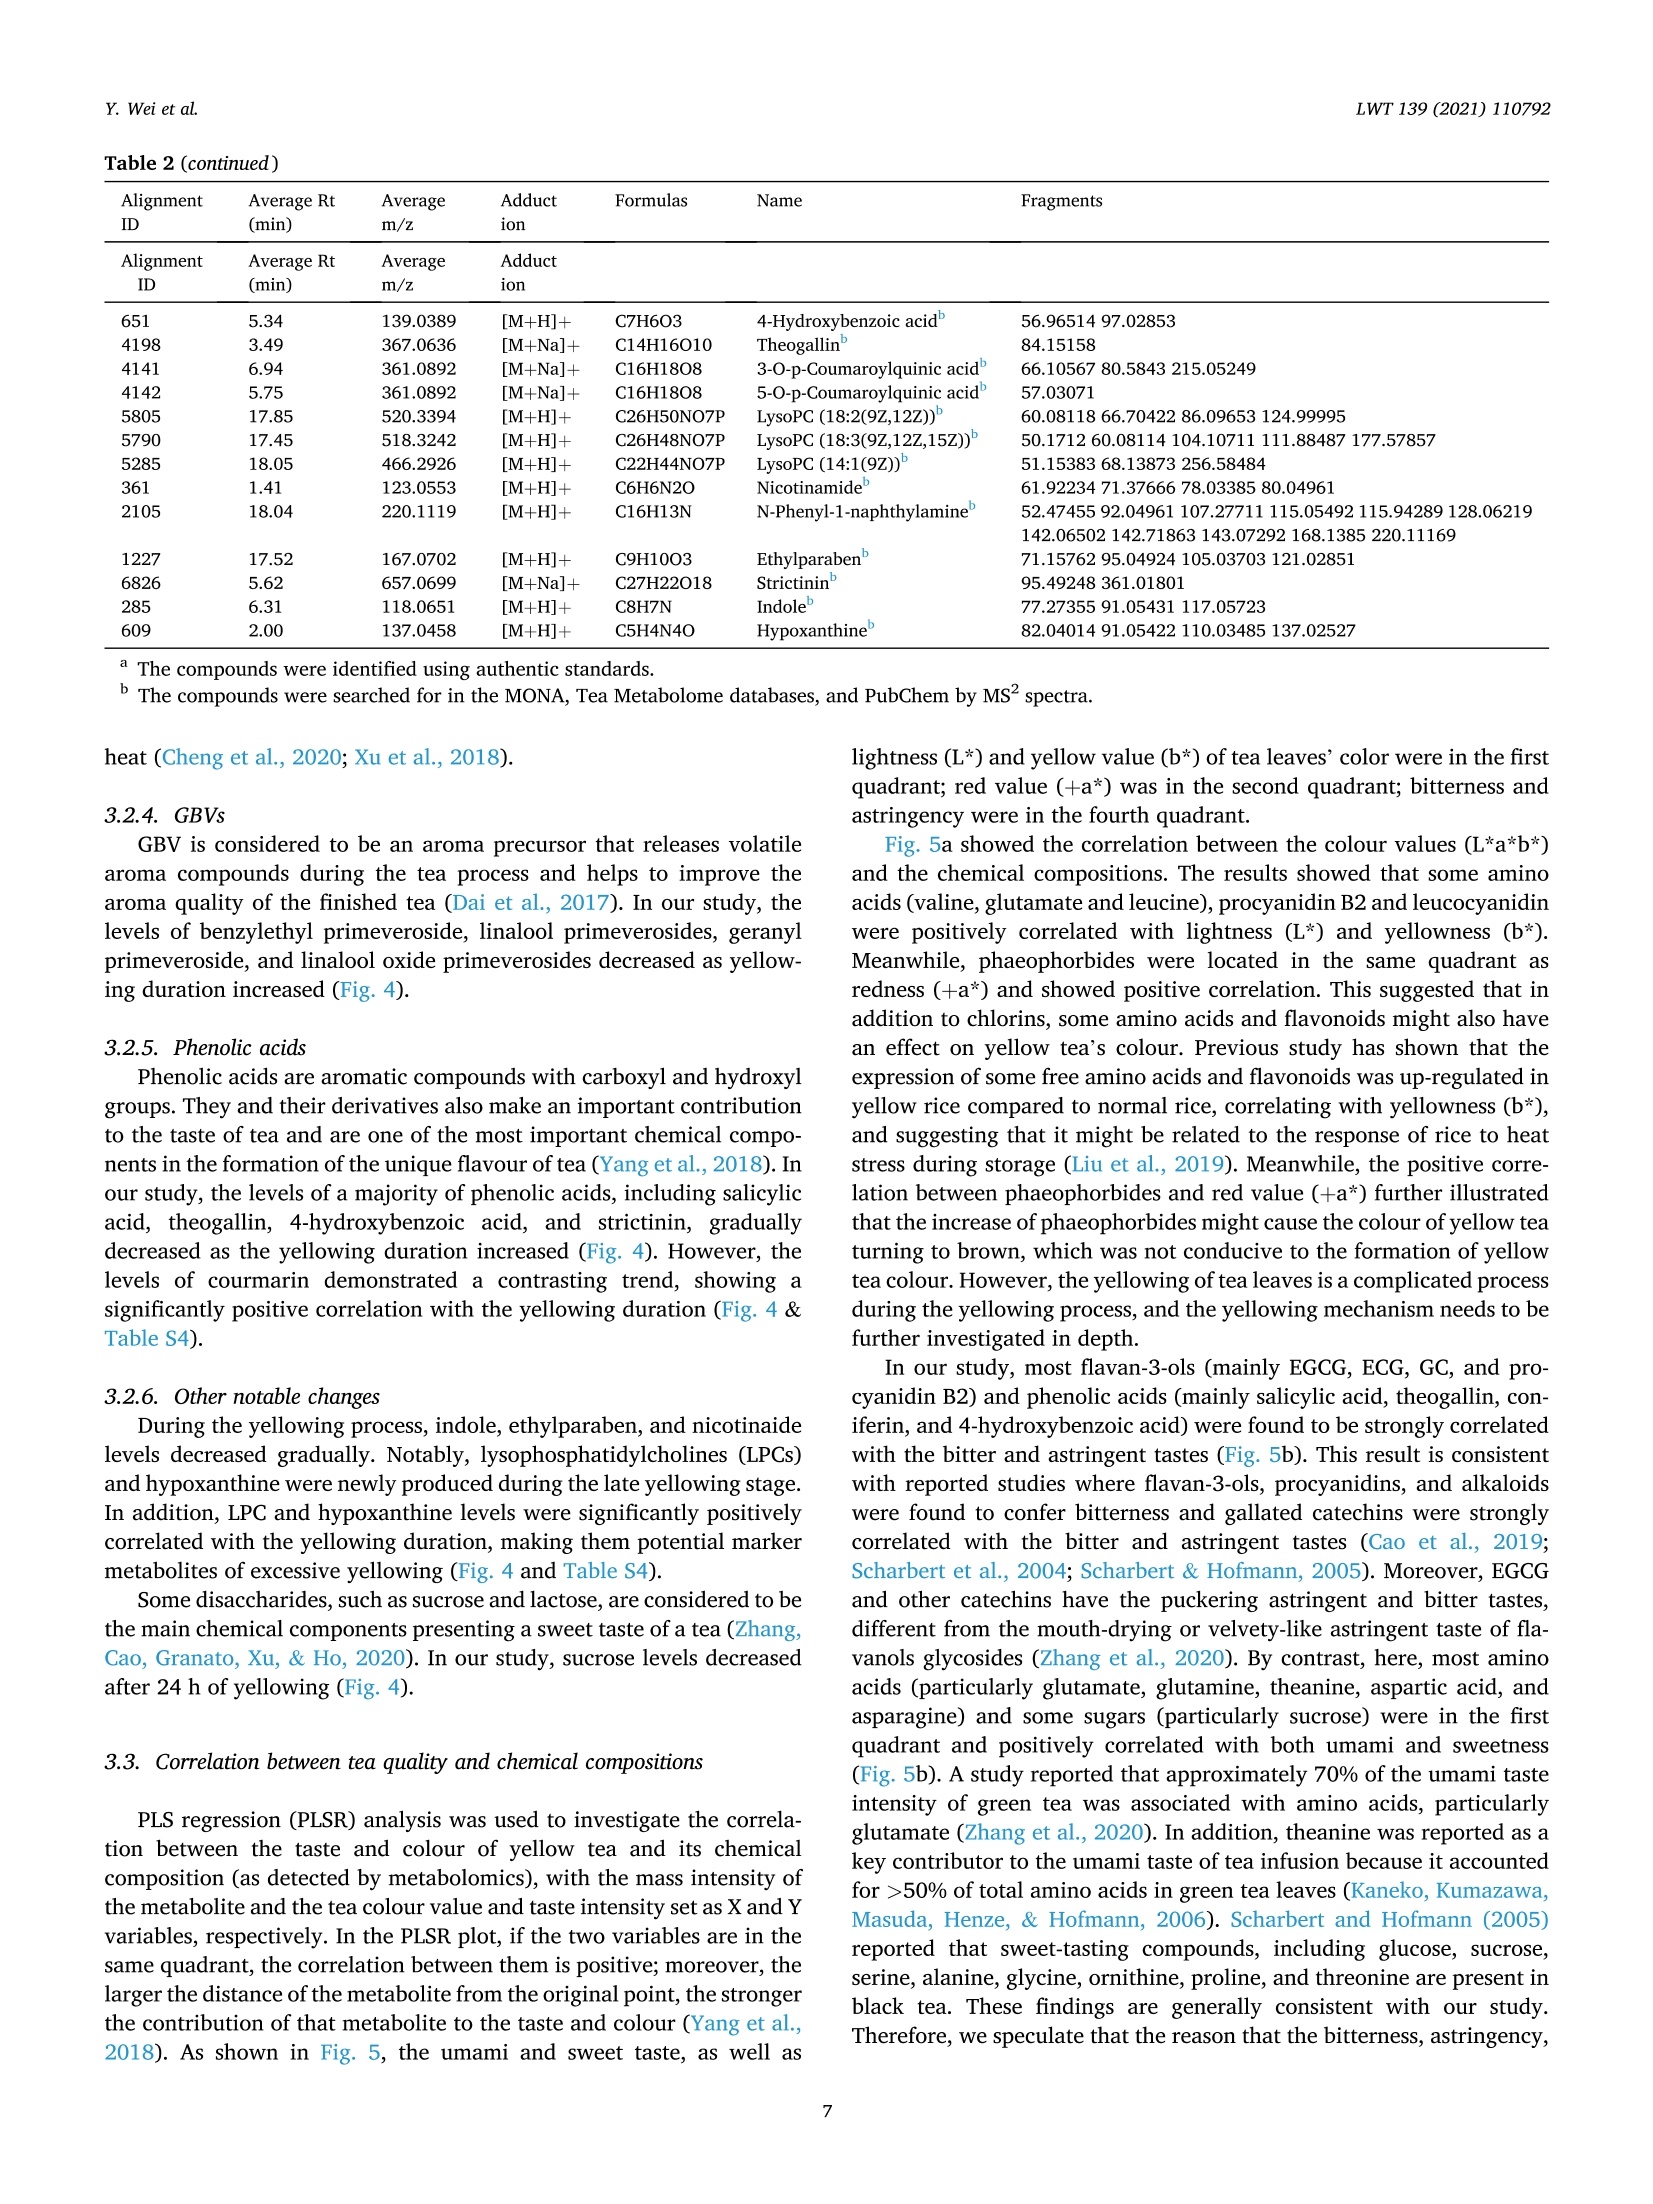
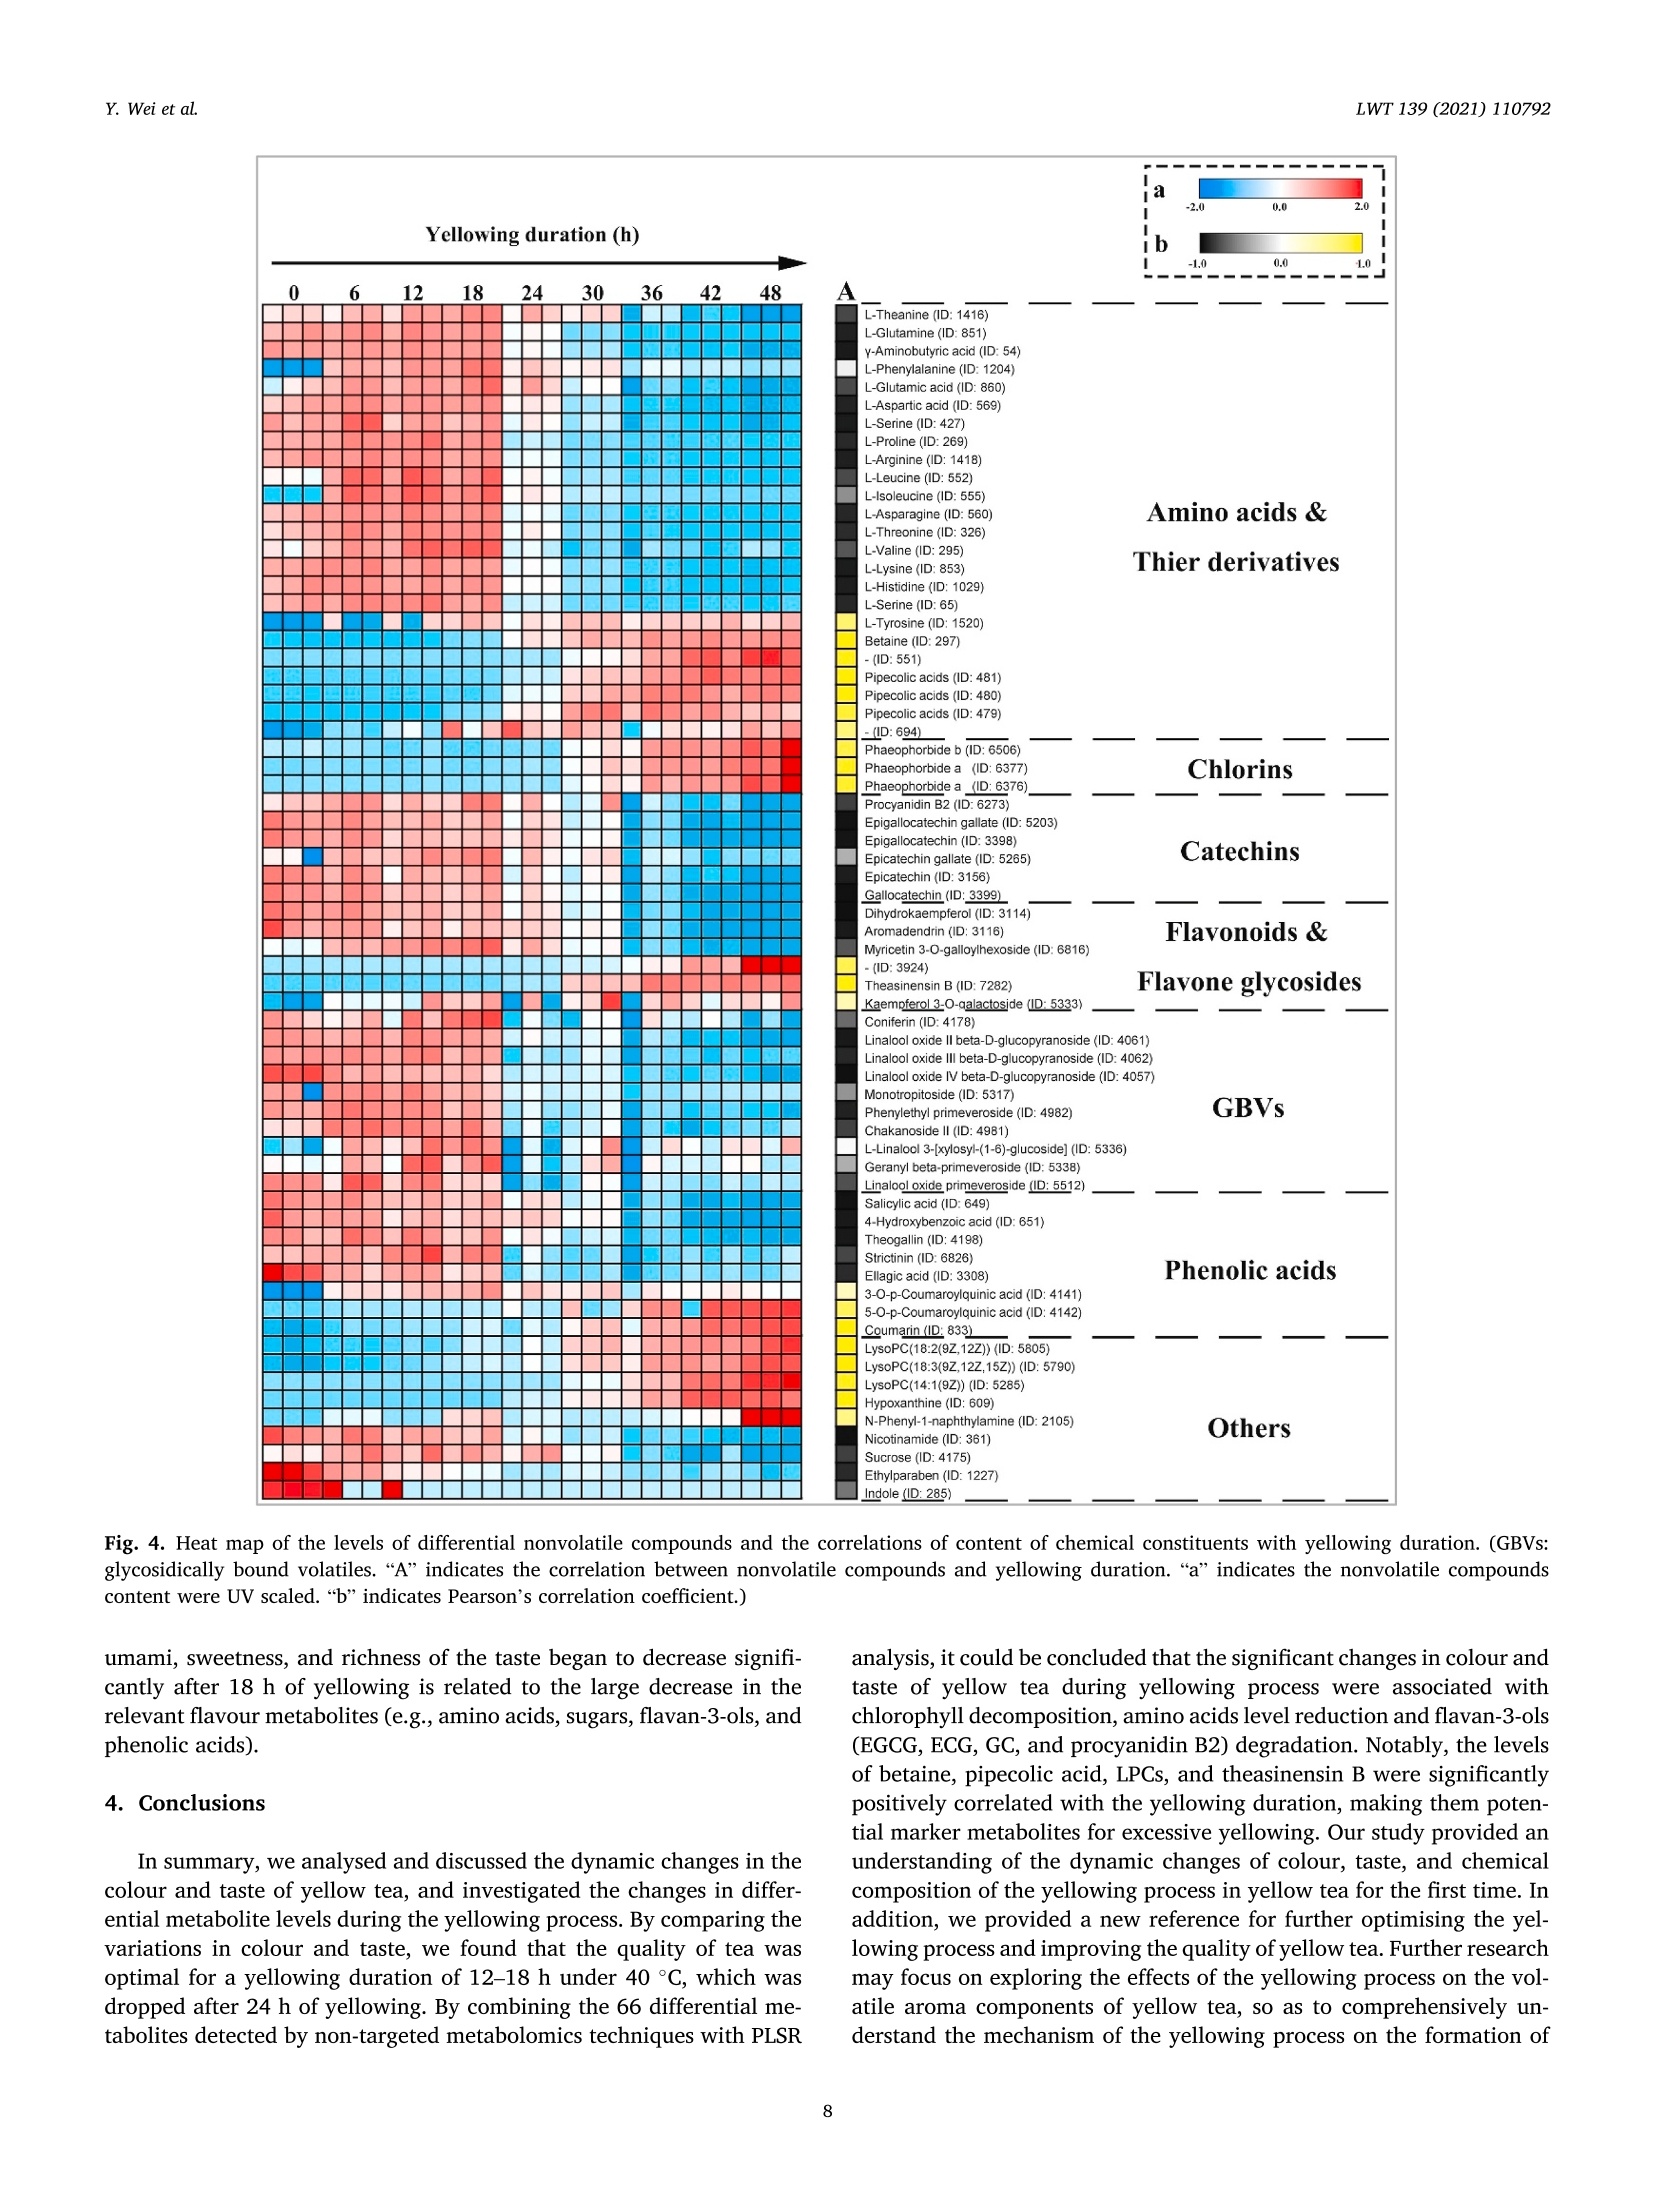
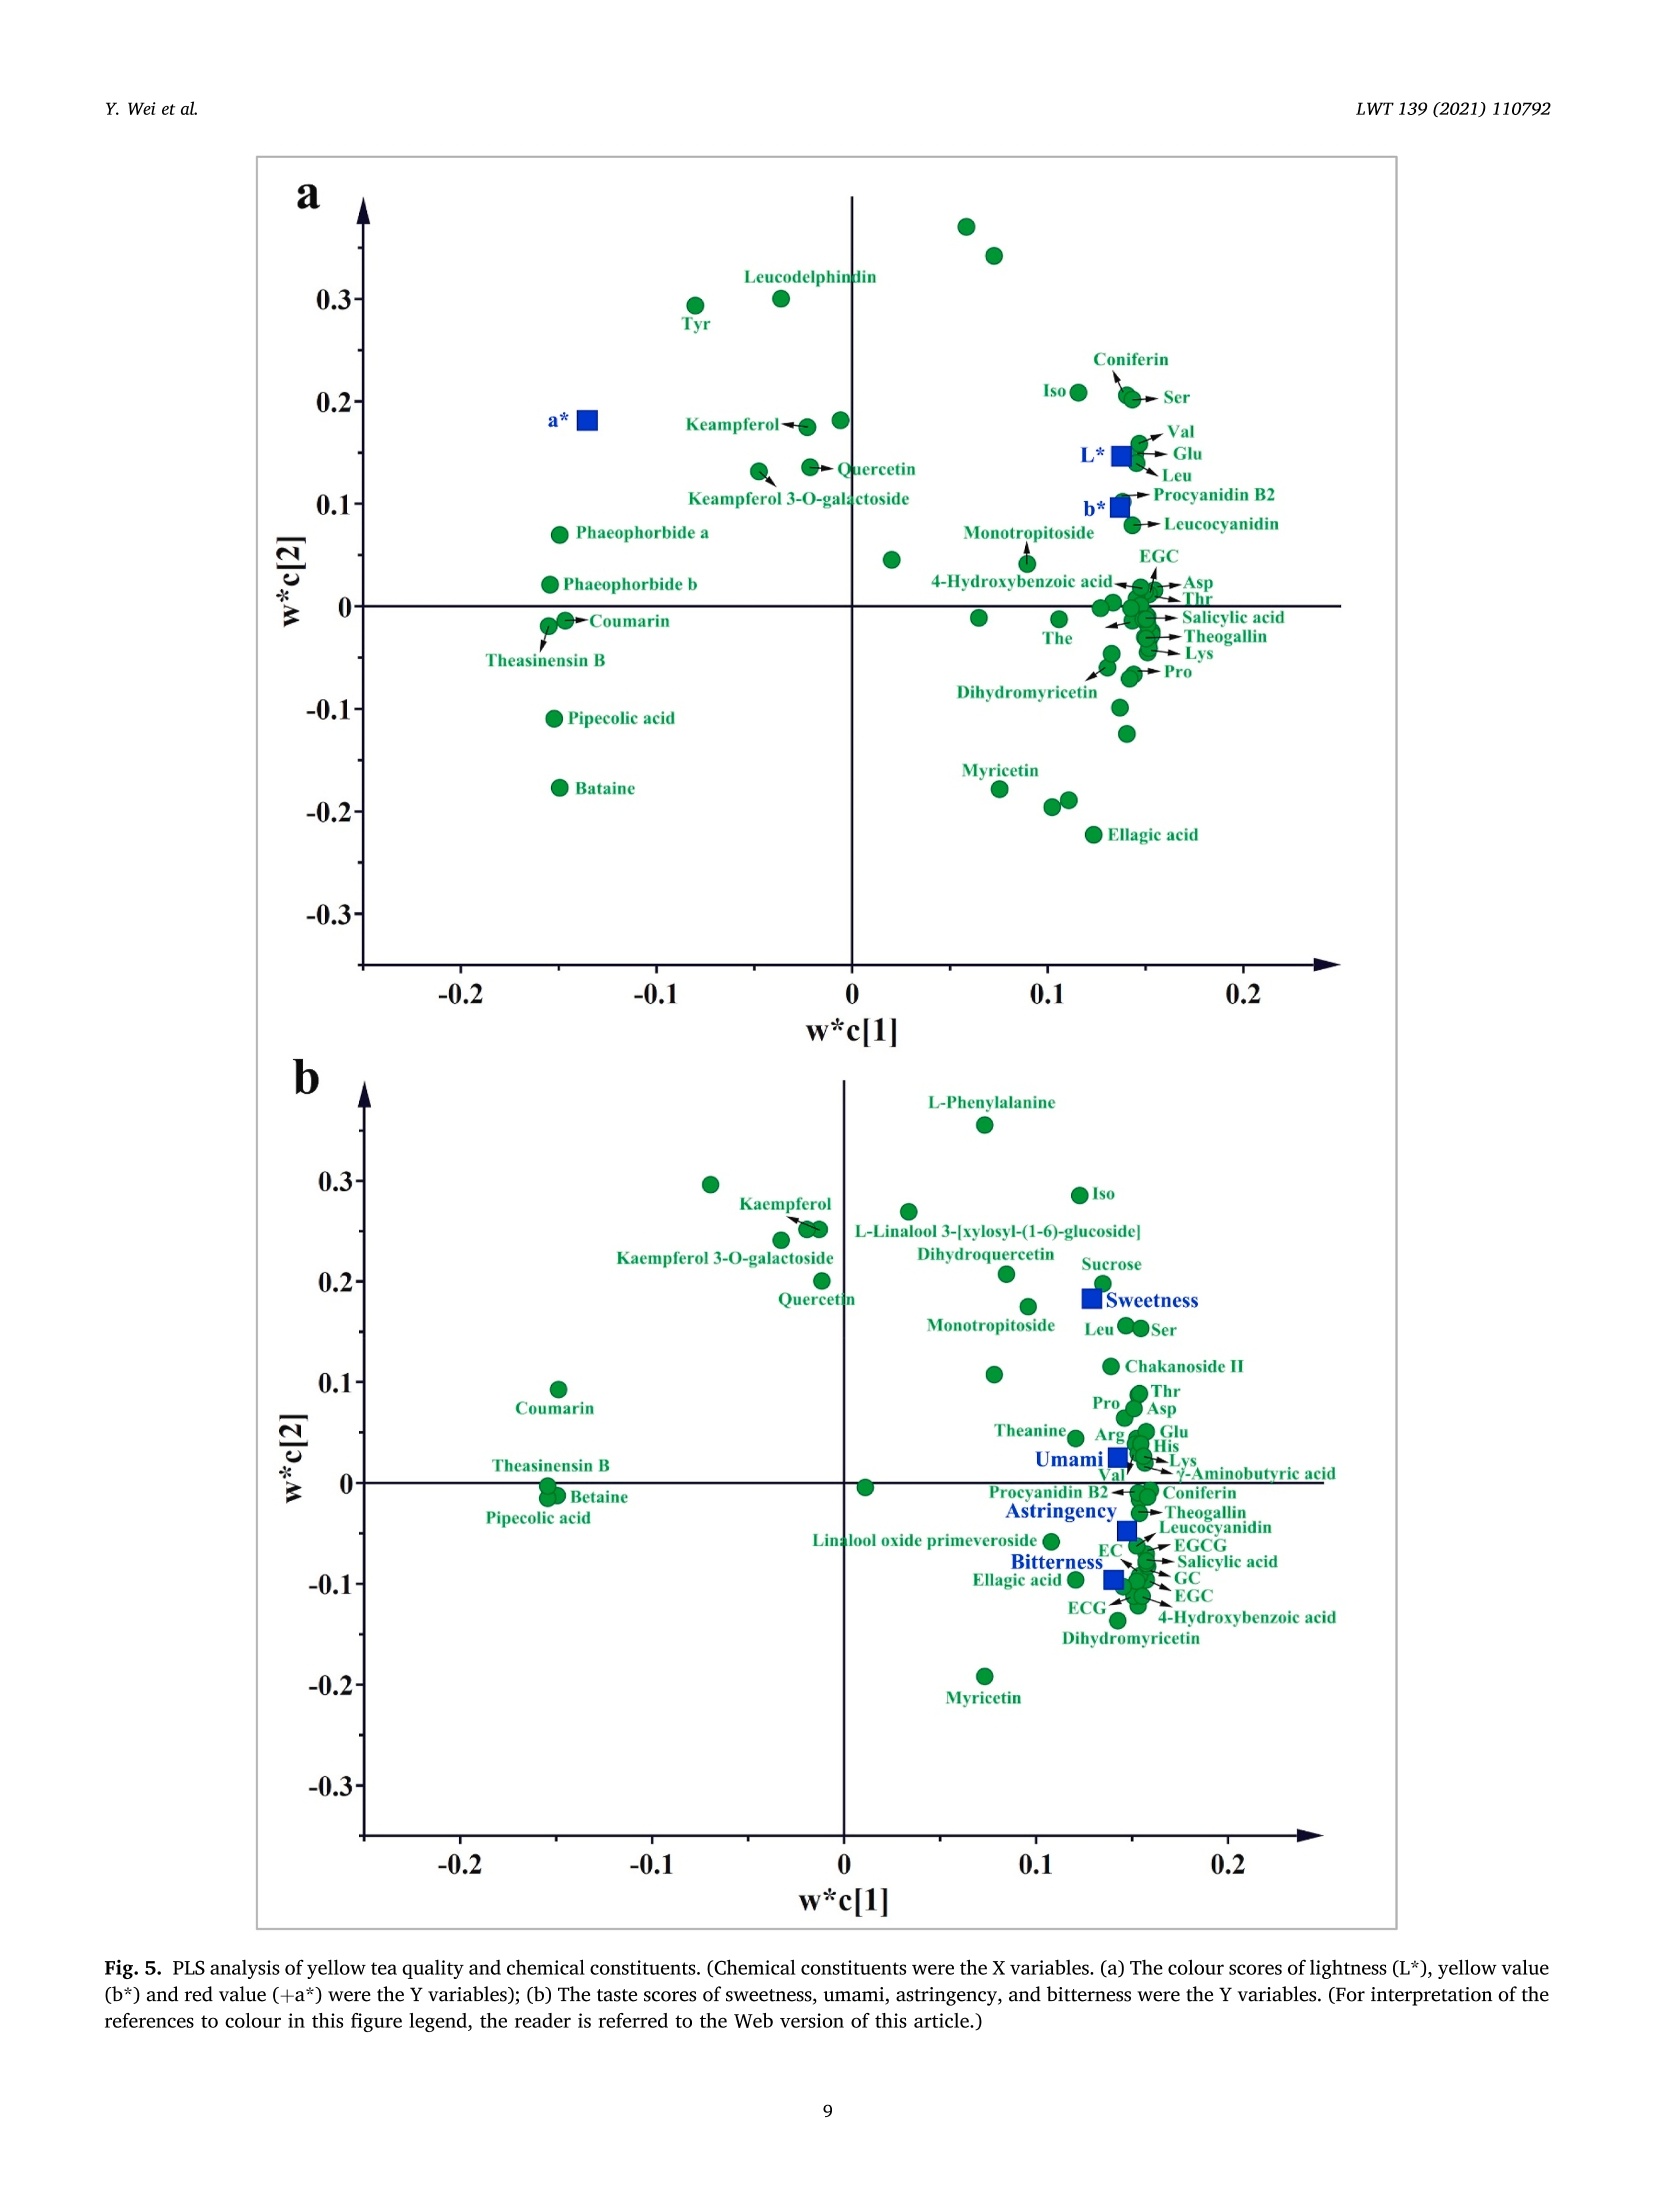
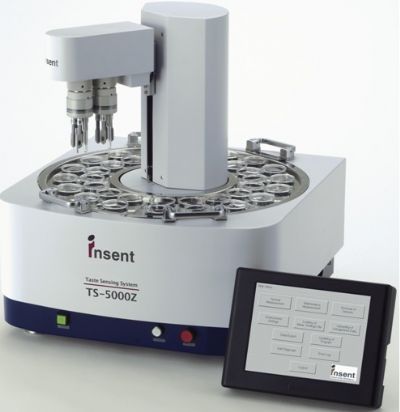
LWT-Food Science and Technology 139 (2021)110792Contents lists available at ScienceDirectLWT Y. Wei et al.LWT 139 (2021) 110792 journal homepage: www.elsevier.com/locate/lwt The profile of dynamic changes in yellow tea quality and chemicalcomposition during yellowing process Yuming Wei a,, Tiehan Lia,b, .SShhana:nshan XuaD, Tiancheng Nia,b, Wei-Wei Denga,bJingming Ninga,b,* State Key Laboratory of Tea Plant Biology and Utilization Anhui Agricultural University, 130 Changjiang West Road, Hefei, 230036, China"School of Tea and Food Science and Technology, Anhui Agricultural University, 130 Changjiang West Road, Hefei, 230036, China ARTICLEINFO A BSTRACT Keywords:Yellow teaYellowing processColourTaste qualityMetabolomics Yellowing is the key process used to produce the unique yellow tea, but the effect of the yellowing process on teaquality and chemical composition remains unclear. Here, electronic eye and tongue and metabolomics wereapplied to investigate dynamic changes in tea leaves during the yellowing process for the first time. During thefirst 18 h of yellowing, the colour of tea leaves was observed becoming yellowish. Compounds related to umamiand sweetness (amino acids, catechins, sucrose, phenolic acids, etc.) are at high levels. However, after 24 h ofyellowing, the colour of tea becomes darker, with richness of tea infusion decreasing significantly. The levels ofmost catechins, amino acids, phenolic acids, and glycosidically bound volatiles (GBVs) decreased significantly,whereas betaine, piperidine, theasinensin B, and lysophosphatidylcholines (LPCs) increased significantly.Meanwhile, according to partial least-squares (PLS) analysis, most amino acids and sucrose were positivelycorrelated with umami and sweetness; most catechins and phenolic acids had positively correlated withbitterness and astringency; phaeophorbides were positively correlated with red value (+a*) of tea leaves’colour.This work provides a comprehensive, novel knowledge on the quality and chemical changes of yellow tea duringthe yellowing process. Yellow tea, a unique Chinese tea, is mainly produced in Hunan,Anhui, Sichuan, Zhejiang, among other provinces (Xu et al., 2018). Inrecent years, Chinese yellow tea consumption has continued to increase,with sales of 0.83 million tonnes in 2019, up 40.68% compared to 0.59million tonnes in 2018. This indicates that it is becoming increasinglypopular among consumers. Yellow tea is a lightly fermented tea, and itsprocessing steps mainly include fixing, rolling, yellowing, and drying.Except for yellowing, these steps are similar to those for green tea pro-cessing (Wang et al., 2019). The yellowing process mainly refers to thethermochemical action on tea leaves under high temperature and hu-midity (Wang, Yue, & Tong, 2020; Xu et al., 2018). The combination ofmoist heat and exogenous enzymes during this process substantiallychanges the chemical composition of the tea, resulting in yellow teahaving a sweeter and mellower taste compared with green tea (Wang,Zhao, Qian, & Wang, 2013; Xu et al., 2018). To explore the reasons forthe unique sweet and mellow taste quality of yellow tea, many recent studies have compared the differences in the chemical composition be-tween yellow tea and other teas. Wang et al. (2019) used the same freshleaves (C. sinensis Longjing 43) processed into six major teas (green tea,yellow tea, white tea, oolong tea, black tea and dark tea) according todifferent processing methods. The results showed that yellow tea has thehighest theanine, glutamic and aspartic acid, and flavonoid levels. Bycomparing the differential metabolites of green,yellow, and white teas,Zhang et al. (2019) also found that the yellow tea had the highestflavonoid levels. Furthermore, Jiao et al. (2016) and Horzic, Jambrak,Belscak-Cvitanovic, Komes, and Lelas (2012) indicated that yellow teahas high levels of phenolic and amino acids, soluble sugars, vitamins,and other nutrients. Many studies have been reported on the chemicalcomposition of yellow tea; however, the effects of the yellowing processon the chemical composition of yellow tea remains unclear. Further-more, these chemical changes also have a direct effect on the sensoryquality of yellow tea. Therefore, combining sensory qualities withchemical characteristics is essential to comprehensively investigate dy-namic changes in yellow tea leaves during the yellowing process; this ( * Corresponding a uthor. 130 Changjiang West Road, Hefei, 230036, China. ) ( E -mail address : n in gjm1998009@ 1 63.com ( J . N ing). ) ( https: // doi.org / 10 . 1016/j . lwt.2020 . 110792 ) ( Received 11 November 2020; R eceived in revised form 17 December 2020; Accepted 17 December 2020 ) ( Available online 19 December 2020 ) ( 0023-6438/C 2020 Elsevier Ltd. Al l r i ghts reserved. ) can be achieved by combining electronic eye (e-eye), electronic tongue(e-tongue), and metabolomics. E-eye monitors and evaluates image information through digitaldetection and analysis. This technology extracts quantitative colour in-formation from selected areas of the digital image and effectively dealswith inhomogeneous shapes and colours through image processing.Thus, comprehensive, accurate, and non-contact colour measurement ofsamples can be performed (Huang, Zhao, Chen, & Zhang,2014; Korel,Luzuriaga, & Balaban, 2001). E-tongue has been widely used for theautomatic analysis of complex food products and their characteristictaste recognition. Moreover, it is straightforward, simple, rapid andaccurate, requiring only a small number of samples, which makes it animportant tool for monitoring food production processes in real time(Ciosek & Wroblewski, 2007; Di Rosa, Leone, & Chiofalo, 2020).Metabolomics is a powerful tool for the simultaneous measurement ofhundreds of secondary metabolites and has been widely used formetabolic profiling and quality assessment of foods and beverages(Cossignani et al., 2014; Jayaram et al., 2013; Le Gall, Colquhoun,&Defernez, 2004). The combined use of e-eye, e-tongue, and metab-olomics enables efficient and comprehensive detection of food qualityand chemical composition changes in the food production process. Our study on different yellowing durations revealed that secondyellowing (SY) improves the overall tea quality, compensating for thegreenish colour and bitter and astringent taste produced in the firstyellowing (FY) stage (Wei et al., 2020). Therefore, in this study, e-eyeand e-tongue were used to detect the dynamic changes in yellow teacolour and taste during SY, and liquid chromatography-mass spec-trometry (LC-MS) based nontargeted metabolomics were used to sys-tematically analyse the metabolic profile changes of secondarymetabolites during SY. Finally, the sensory qualities and chemicalchanges were analysed for correlation by partial least-squares (PLS)analysis. Therefore, this study aims to clarify the metabolite changes inthe yellowing process from the omics perspective and investigate theinfluence of yellowing process on yellow tea quality by combining thedynamic changes in sensory quality to provide the basis for furtheroptimisation of yellow tea processing. 2. Materials and methods 2.1. Chemicals Detailed information about chemicals is listed in Table S1 in thesupplementary materials. Theanine quercetin, rutin and theobrominewere isolated in our previous study (Luo et al., 2013). 2.2. Processing of yellow tea and sample collection Fresh tea leaves (one bud with two leaves, Jinjizhong, Camelliasinensis) were plucked from Huoshan in Lu’an City, Anhui, China on 19May 2020 and used for yellow tea manufacturing. The yellow teamanufacturing procedure and sample collection process are illustratedin Fig. 1. To characterise the entire SY process, a prolonged yellowingduration of 48 h was selected. The processed tea samples were sampledat 0, 6,12,18,24,30,36,42, and 48 h after yellowing was initiated. Thesamples for each yellowing duration were collected, immediately freeze-dried, and stored at -20 °C before analysis. 2.3. E-eye measurements for the tea leaves We used the same E-eye system and method as that reported in aprevious study (Wei et al., 2020), with some modifications. In brief, theimages were saved in the JPG format (3216×3264 pixels). The NikonD610 camera (Nikon, Tokyo, Japan) settings were as follows: no flash,focal length of 50 mm, ISO sensitivity of 500, operation in manual mode,Av aperture of F/9.0, and shutter speed of 1/100 s. White balance wasset to a colour temperature of 5000 K. These images of tea leaves werethen processed on computer to measure the L*a*b* parameters byImageJ (version 1.51). Three images were taken for each sample. 2.4. E-tongue measurements for the taste strength The E-tongue (TS-5000Z, INSENT, Tokyo, Japan) measurementsused in this study was previously presented methods (Xu et al., 2019).The tea infusions were extracted by GB/T 23 776-2018, and the tastestrength was determined using the method described in Table S2. Thesweetness, umami, bitterness, astringency and richness of the obtained 2.5. Sample preparation and LC-Orbitrap-MS analysis 2.6. Nontargeted metabolomics data processing Raw LC-MS datasets were successively converted to the mz/ML andanalysis base file (.abf) formats in software by using MS-Convert andAnalysis Base File Converter, respectively. Noise filtering, peak identi-fication, overlapped peak analysis, peak alignment, and peak fillingwere performed on the converted data by using MS-DIAL (version 3.82)to obtain the Ms and Ms’ feature tables, m/z values, retention dura-tion, ID, and relative MS intensity (Tsugawa et al., 2015). The filling rate(filling<11%, delete), signal-to-noise ratio (s/n < 10, delete), and ionswith relative standard deviation (RSD) < 30% in quality control (QC)sample analyses were subsequently used for further multivariate andunivariate statistics, followed by fragmentation for data preprocessing(Tan et al., 2016). The normalised data were subjected to principalcomponent analysis (PCA), hierarchical cluster analysis (HCA),and PLSdiscriminant analysis (PLS-DA) in SIMCA-P (version 14.1) after Paretoscaling to overview the metabolite pattern variations and identify thedifferential metabolites during SY of yellow tea. Heat-map analyses wereperformed using TBtools (version 1.046) to illustrate the dynamicchanges of differential metabolites during yellowing process after thedata were UV scaled. PLS regression analysis was also performed usingSIMCA-P (version 14.1) to illustrate the correlation between the tea tasteand key chemical composition. Analysis of Pearson and Spearman correlation coefficients for dif-ferential metabolites and SY duration using SPSS (version 25.0). One-way ANOVA was performed using Duncan’s test on SPSS (p < 0.05 in-dicates significant differences in the data). All data are expressed asmean ± standard deviation and were repeated three times for eachsample. 3. Result and discussion 3.1. Variations in the colour values and taste strength in SY Colour, as a key parameter for understanding images and describingobjects, is essential in areas such as food quality assessment and real-time monitoring of food processing. (Wu & Sun, 2012). As shown inFig. 2a, the colour of the tea leaves differed as the yellowing durationincreased. The specific differences are presented in Fig. 2b-d. In thecourse of the first 12 and 18 h, leaf lightness (L*) and yellow value (b*)demonstrated an increasing trend. In particular, L* increased from 17.03(0 h) to 20.84 (12h), and b* increased from 14.80 (0 h) to19.95 (18 h).However, after 24 h of yellowing, the L* and b* of the tea leaves begandecreasing sharply, eventually dropping to 6.68 and 3.87, respectively,after 48 h. The leaf green value (-a*) showed a decreasing trendthroughout the yellowing process. Taken together, the results indicatethat during the first 18 h of yellowing, the tea leaf colour becamesignificantly yellower and brighter than did the 0 h, which favoured theformation of the colour of yellow tea. However, after 24 h, the colour ofthe tea became less pleasant: the tea turned reddish brown, losing itslustre. Therefore, prolonging the yellowing process potentially inducesthe browning of the yellow tea. Xu et al. (2018) and Hua et al. (2015)also demonstrated that excessive yellowing can greatly affect the colourof yellow tea. Chlorophyll is the most important green pigment in tealeaves. Its content directly affects the greenness of tea leaves (Yu et al.,2019). However, during the manufacturing processes of tea, a hightemperature will lead to the conversion of chlorophylls to phaeo-phorbides and phaeophytins, which further affects the colour of the tealeaves (Ni & Chen, 1997). In our previous study (Wei et al., 2020), wefound that the chlorophyll content was significantly decreased after two Fig. 2. Variations of yellow tea leaves colour values [(b) lightness (L*), (c) green value (-a*), and (d) yellow value (b*)] during yellowing process. Differentlowercase letters indicate significant difference (p<0.05). (For interpretation of the references to colour in this figure legend, the reader is referred to the Webversion of this article.) yellowing processes. Meanwhile, Xu et al. (2018) pointed out that aseries of metabolic changes, such as the degradation of chlorophyll,were induced in tea leaves during the yellowing process due to heatingand microbial effects (similar to pile-fermented dark tea). Therefore, wespeculated that the main reason causing the colour of tea leaves tochange from green to yellow and finally brown might be due to thedegradation of chlorophyll into phaeophorbides and phaeophytins inyellowing process at high temperature and high humidity. Compared with the traditional sensory evaluation of tea qualityusing subjective words such as“strong",“hard", and"harsh"to describethe taste, the e-tongue technology quantifies the strength of the taste andis more efficient and convenient (Di et al., 2020; Scharbert & Hofmann,2005). Table 1 indicates that as the yellowing duration prolonged, thebitterness and astringent strength of the samples decreased significantlyfrom the initial values of 12.12 and 16.52, respectively, to 7.03 and10.94, respectively. The umami and sweetness increased significantlyduring the first 18 h of yellowing but began decreasing after 18 h.Moreover, the taste-related richness and strength reached a maximum of17.79 after 12h of yellowing. The results showed that the SY duration inthe first 18 h helped to enhance the umami and sweetness of the tea.With further prolongation of yellowing duration, the strength ofbitterness and astringency continued to decreased; however, the rich-ness of the flavour also decreased significantly, which is not conduciveto the formation of high-quality yellow tea. The significant change intaste is closely related to the chemical composition of the tea leaves.Wang et al. (2020) found that there were 22 compounds which were keyfactors affecting the taste of Chinese yellow tea, mainly includingcaffeine, catechins, flavonoids, free amino acids and soluble sugars.Among these compounds, the low content of gallated catechins werehighly correlated with the low bitterness and astringency of yellow teainfusion, and the accumulation of free amino acids and soluble sugarscontributed to umami and sweetness (Wei et al., 2020). These tastecompounds are susceptible to some chemical changes (polyphenolauto-oxidation and isomerization, starch hydrolysis, proteins decom-position, etc.) during the yellowing process due to the high temperatureand high humidity environment (Hua et al., 2015; Xu et al., 2018). Thesechanges would lead to the unique taste characteristics of yellow tea. 3.2. Metabolomic profiling and alterations during the SY process To explore the reasons for the changes in yellow tea quality duringthe yellowing process further, we performed nontarget metabolomicanalyses on samples from the SY process. After peak extraction andalignment, 3614 metabolite ion features were obtained by usingLC-Orbitrap-MS. Next, clean data (2610 ion features) was obtained byremoving ion features with relative standard deviations> 30%in the QCsample, and these ion features were analysed by multivariate statisticalanalysis. As shown in Fig S1, the QC samples are basically located in thecentre of the PCA score plot, which indicates that this metaboliteextraction and metabolomicssanalysishas goodstabilityyand reproducibility (Chen et al., 2020). Then, PCA and HCA analyses wereperformed to show the overall pattern of changes in the nonvolatilemetabolites of yellow tea during SY. The score plot demonstratedsignificantly changes and differences related to nonvolatile metabolitesfrom 0 to 48 h; this clustering could be divided into four categories at 0,6-18, 24, and 30-48 h, respectively (Fig. 3a and b). In other words,prolonging the SY period has a significant effect on tea quality, with thequality changing significantly after 24 h of yellowing. This observationcorroborates the results for the colour and taste strength. Next, a su-pervised PLS-DA loading plot was used to analyse the differential me-tabolites of VIP>1 and p <0.05 in the four categories of SY period(Fig. 3c). The cross-validation with 100 permutation tests indicated thatthis PLS-DA model was reliable (intercepts of R² and Q2=0.457 and-0.715, respectively; Fig. 3d). Finally, based on authentic standards,Ms spectra, metabolomic databases (MONA, Pubchem and TeaMetabolome database), and our previous study (Xu et al., 2019), 66characteristic metabolites were identified finally; these included 24amino acids and derivatives, 3 chlorins, 6 catechins, 6 flavonoids andflavone glycosides, 10 glycosidically bound volatiles (GBVs), 8 phenolicacids, and 9 other compounds (Table 2). A heat map was applied to visualise the dynamic changes in thecharacteristic metabolites during the SY process (Fig. 4). In Fig. 4, thecolumns represent tea samples and the rows represent metabolites;moreover, for a sample, a red box indicates that the level ofa metabolitewere higher than its mean level, whereas a blue box indicates that thelevel of a metabolite was lower than its mean level. For a metabolite, ayellow box indicates positive correlation with yellowing time, while ablack box indicates negative correlation with yellowing time. 3.2.1. Amino acids and their derivatives Although free amino acids only account for 1-4%of the dry weight oftea leaves, they have an important influence on the quality of tea(Harbowy, Balentine, Davies, & Cai, 1997). Xu et al. (2018) reportedthat proteins are hydrolysed to free amino acids by the action of heat andhumidity. Therefore, during the yellowing for large-leaf yellow tea, mostof the amino acid content accumulated at a level higher to that for freshleaves (Zhou et al., 2019). In the current study, we found similar results:the levels of most amino acids including theanine, glutamic acid,glutamine, valine, leucine, isoleucine, aspartic acid, and asparagineincreased during the first 18 h of yellowing process.However, after 18 h,the levels of all amino acids except tyrosine decreased significantly after18 h (Fig. 4), and the levels of most of the amino acids exhibited a sig-nificant negative correlation with the yellowing duration (Fig. 4,Table S4). Therefore, prolongation of the yellowing duration may bedetrimental to amino acid accumulation. The current results indicatethat the control of yellowing duration at approximately 18 h is beneficialfor the accumulation of most amino acids. With prolonged duration of yellowing (after 24 h), amino acid de-rivatives such as the betaine and pipecolic acid isomers began to in-crease considerably (Fig. 4). Betaine and pipecolic acid are present in Yellowing duration (h) Bitterness Astringency Umami Sweetness Richness 0 12.12±0.10 16.52±0.25 19.76±0.09 4.24±0.06 16.19±0.31 6 11.78±0.05 16.30±0.16 20.22±0.09 5.57±0.34 16.79±0.19 12 11.40±0.08 16.15±0.09 20.38±0.07 6.03±0.33 17.79±0.32 18 10.91±0.09 15.99±0.08 20.88±0.15 6.69±0.39 17.02±0.27 24 10.76±0.10 15.20±0.17 19.49±0.16 4.68±0.09 14.82±0.15 30 10.25±0.14 15.27±0.36 18.85±0.17 4.19±0.04 13.78±0.33 36 9.33±0.13 13.03±0.26 18.25±0.17 3.71±0.05 13.85±0.45 42 9.50±0.20 12.51±0.24 17.56±0.28 3.55±0.06 11.85±0.55 48 7.03±0.31 10.94±0.63 15.23±0.32 3.57±0.05 9.48±0.74 Fig. 3. Multivariate analysis of yellow tea duration yellowing process. (a) PCA score plot, Rx=0.724,Q2=0.610. (b) Dendrogram plot of tea samples. (c) PLS-DAscore plot, R’x=0.925,R’Y=0.975, Q2= 0.862. (d) Permutation plot of PLS-DA, with intercepts of R’ and Q"being 0.457 and -0.715, respectively. (Forinterpretation of the references to colour in this figure legend, the reader is referred to the Web version of this article.) large quantities in dark tea varieties; however, in yellow tea, theirpresence has rarely been reported. Wang et al. (2019) analysed thechemical composition of the same tea leaves after they were treatedusing six typical processing methods. The authors found that the betainecontent was significantly higher in the samples processed into dark teathan in those processed into other teas. Cheng et al. (2020) reported thatpile-fermented dark tea had significantly higher pipecolic acid contentthan did unfermented samples. Pile fermentation of dark tea is similar tothe yellowing process for yellow tea in that it must be conducted in anenvironment with high temperature and humidity; however, the pilefermentation process is longer than the yellowing process (Feng et al.,2020). Therefore, large betaine and pipecolic acid accumulation may berelated to the further degradation of serine and lysine by heat andhumidity-induced reactions after 24 h (Fig.S2). In addition, the betaineand pipecolic acid were significantly positively correlated with theyellowing duration (Fig. 4, Table S4), indicating that these amino acidderivatives may be potential marker metabolites for excessiveyellowing. 3.2.2. Chlorins Chlorins, including chlorophyll, pheophytin, pheophorbide and ca-rotenoids are essential plant pigments, indicating colour of fresh leaves(Wang, Park, Chung, Baik,& Park, 2010).During the yellowing period,chlorophylls starts being destroyed due to high temperature and hu-midity and gradually degrades into pheophytins and pheophorbides,causing the colour of the yellow tea to gradually change from green toyellow (Xu et al., 2018; Yu et al., 2019). In our study, chlorophyll con-tent gradually decreased, whereas pheophorbide content graduallyincreased as the yellowing duration increased (Fig. 4, Fig. S2).Furthermore, pheophorbide a and pheophorbide b levels were signifi-cantly positively correlated with the SY duration (Fig. 4, Table S4). Thisfurther suggests that the significant colour change of yellow tea at laterstages of the yellowing process is related to the accumulation of pheo-phorbide a and pheophorbide b. 3.2.3. Flavonoids Flavonoids, a class of secondary metabolites of polyphenols widelyfound in plants, have antioxidant, anti-inflammatory, antivirus, immunesystem regulation, and many other activities (Hollman & Arts, 2000).Flavone and flavanol glycosides also are important astringent com-pounds in tea infusion (Scharbert, Holzmann, & Hofmann, 2004). In thisstudy, dihydrokaempferol, myricetin 3-O-galloylhexoside, and aroma-dendrin levels decreased significantly as yellowing duration increased.By contrast, theasinensin B began to appear after 24 h of yellowing andits levels continued to increase (Fig.4). Moreover, they were signifi-cantly positively correlated with yellowing duration (Fig. 4, Table S4).Theasinensins B are easily formed by the oxidation of original catechins(EGCG and EGC) with help of polyphenol oxidase (Weerawatanakornet al., 2015). Meanwhile, microorganisms including Aspergillus niger,rhizopus, yeast and bacterium start to multiply with the prolongation ofyellowing time and produce various extracellular enzymes to decom-pose and transform macromolecular compounds (such as carbohydratesand protein) in tea leaves (Xu et al., 2018). Therefore, we speculatedthat it was the exogenous enzymes produced by the proliferation ofmicroorganisms in the late stage of yellowing which caused the oxida-tive polymerization of EGCG and EGC to form theasinensins B, whichwere increased in level. To sum up, theasinensin B may be also a markermetabolite for excessive yellowing. Catechin belongs to the flavanol family and is the main polyphenolsin tea, accounting for 60%-80% of all tea polyphenols. (Balentine,Wiseman, & Bouwens, 1998). Catechin can scavenge free radicals,thereby inhibiting oxidative stress, so it has attracted great interest(Yang et al., 2018). Yellow tea has slightly lower catechin levels thandoes green tea but significantly higher catechin levels than does dark tea(Xu et al., 2018; Wang et al., 2019). In our study, the levels of all cat-echins, particularly EGCG and ECG, decreased as yellowing durationincreased (Fig. 4, Fig. S2). These results, consistent with previousstudies, are attributable to gallyolated catechins in tea leaves graduallyhydrolysing into nongallyolated catechins and gallic acid, furtherdegrading into phenolic acids under prolonged exposure to moisture and Alignment Average Rt Average Adduct Formulas Name Fragments ID (min) m/z ion 1416 1.98 175.1077 [M+H]+ C7H14N2O3 L-Theanine° 851 1.32 147.0764 [M+H]+ C5H10N203 L-Glutamine" 54 1.30 104.1070 [M+H]+ C4H9NO2 Y-Aminobutyric acid 1204 4.40 166.0863 [M+H]+ C9H11NO2 L-Phenylalanine° 860 1.34 148.0604 [M+H]+ C5H9NO4 L-Glutamic acid 569 1.32 134.0447 [M+H]+ C4H7NO4 L-Aspartic acid 427 1.15 128.0193 [M+Na]+ C3H7NO3 L-Serine 269 1.41 116.0707 [M+H]+ C5H9NO2 L-Proline 1418 1.26 175.1190 [M+H]+ C6H14N402 L-Arginine" 552 2.97 132.1019 [M+H]+ C6H13NO2 L-Leucine 555 2.76 132.1020 [M+H]+ C6H13NO2 L-Isoleucine 560 1.31 133.0608 [M+H]+ C4H8N203 L-Asparagine 326 1.33 120.0655 [M+H]+ C4H9NO3 L-Threonine 295 1.48 118.0862 [M+H]+ C5H11NO2 L-Valine° 853 1.21 147.1128 [M+H1+ C6H14N2O2 L-Lysine° 1029 1.24 156.0768 [M+H]+ C6H9N302 L-Histidine 65 1.31 106.0499 [M+H]+ C3H7NO3 L-Serine Alignment Average Rt Average Adduct Formulas Name 59.19187 111.0918 129.10239 156.97342 84.04449 128.95084 58.0654 72.07928 79.05434 91.05421 103.05425 120.08083 56.04987 58.23394 84.04452 85.0283585.0477 97.00773 102.05507 116.01836118.74515130.05002 131.03391 65.6663871.0493 58.9983383.08572105.00345 54.06301 70.06532 74.02377 75.27244 88.0757392.61484 98.0965116.07076 67.41114 70.0653 112.08693 130.09758 58.91905 86.09653 68.04678 86.09658 70.0289474.02375116.03429 74.06017 84.04464 72.08093 94.89791 84.08094 114.97173 130.08643 81.04519 83.06044 110.0714 53.04695 56.82181 60.04477 60.08102 70.02899 88.03943 92.6132 106.04995 106.08659 Fragments ID (min) m/z ion 1520 2.39 182.0813 [M+H]+ C9H11NO3 L-Tyrosine 67.1468 91.05437 119.04929 136.07584 297 1.37 118.0863 [M+H]+ C5H11NO2 Betaine 56.34677 58.06547 59.07329 66.91786 92.6136695.41575 118.08631 551 3.57 132.1018 [M+H]+ C6H13NO2 Unknown 69.03362 108.95829 481 3.99 130.0864 [M+H]+ C6H11NO2 Pipecolic acid' 84.04443 480 6.03 130.0863 [M+H]+ C6H11NO2 Pipecolic acid 84.04469 479 3.32 130.0863 [M+H]+ C6H11NO2 Pipecolic acid 84.04448130.06525 694 1.36 140.0681 [M+Na]+ C5H11NO2 Unknown 74.09653116.96613 6506 18.69 607.2544 [M+H]+ C35H34N406 Phaeophorbide b' 229.38756 431.18375 445.20584 519.23688 6377 19.66 593.2751 [M+H]+ C35H36N405 Phaeophorbide a" 148.71544 403.19174 417.20801 431.18768 447.21741 461.23047 6376 19.87 593.2748 [M+H]+ C35H36N405 Phaeophorbide a" 66.03369361.15265460.22531 6273 6.03 579.1497 [M+H]+ C30H26012 Procyanidin B2° 92.61657127.03909 139.03891 5203 6.75 459.0923 [M+H]+ C22H18O11 Epigallocatechin gallate 56.56269 119.40257 121.02861 139.03922 3398 5.34 307.0812 [M+H]+ C15H1407 Epigallocatechin 65.03884 68.99732 133.02809 139.03909 151.03934 5265 10.02 465.0794 [M+Na]+ C22H18010 Epicatechin gallate 88.5245 139.03922 3156 5.77 291.0863 [M+H]+ C15H1406 Epicatechin" 55.0182891.05424111.04418 137.02371 139.03912 3399 4.63 307.0812 [M+H]+ C15H1407 ID (min) m/z ion Alignment Average Rt Average Adduct ID (min) m/z ion 651 5.34 139.0389 [M+H]+ C7H603 4-Hydroxybenzoic acid" 56.96514 97.02853 4198 3.49 367.0636 [M+Na]+ C14H16010 Theogallin" 84.15158 4141 6.94 361.0892 [M+Na]+ C16H1808 3-O-p-Coumaroylquinic acid" 66.1056780.5843 215.05249 4142 5.75 361.0892 [M+Na]+ C16H1808 5-O-p-Coumaroylquinic acid 57.03071 5805 17.85 520.3394 [M+H]+ C26H50NO7P LysoPC (18:2(9Z,12Z)) 60.08118 66.70422 86.09653 124.99995 5790 17.45 518.3242 [M+H]+ C26H48NO7P LysoPC (18:3(9Z,12Z,15Z))' 50.1712 60.08114 104.10711 111.88487 177.57857 5285 18.05 466.2926 [M+H]+ C22H44NO7P LysoPC (14:1(9Z))" 51.15383 68.13873256.58484 361 1.41 123.0553 [M+H]+ C6H6N2O Nicotinamide” 61.92234 71.37666 78.0338580.04961 2105 18.04 220.1119 [M+H]+ C16H13N N-Phenyl-1-naphthylamine” 52.47455 92.04961 107.27711115.05492 115.94289 128.06219 142.06502 142.71863 143.07292168.1385 220.11169 1227 17.52 167.0702 [M+H]+ C9H1003 Ethylparaben” 71.15762 95.04924 105.03703 121.02851 6826 5.62 657.0699 [M+Na]+ C27H22018 Strictinin 95.49248 361.01801 285 6.31 118.0651 [M+H]+ C8H7N Indole' 77.27355 91.05431 117.05723 609 2.00 137.0458 [M+H]+ C5H4N40 Hypoxanthine” 82.04014 91.05422 110.03485 137.02527 The compounds were identified using authentic standards. The compounds were searched for in the MONA, Tea Metabolome databases, and PubChem by Ms’spectra. heat (Cheng et al., 2020; Xu et al., 2018). 3.2.4. GBVs GBV is considered to be an aroma precursor that releases volatilearoma compounds during the tea process and helps to improve thearoma quality of the finished tea (Dai et al., 2017). In our study, thelevels of benzylethyl primeveroside, linalool primeverosides, geranylprimeveroside, and linalool oxide primeverosides decreased as yellow-ing duration increased (Fig. 4). 3.2.5. Phenolic acids Phenolic acids are aromatic compounds with carboxyl and hydroxylgroups. They and their derivatives also make an important contributionto the taste of tea and are one of the most important chemical compo-nents in the formation of the unique flavour of tea (Yang et al., 2018). Inour study, the levels of a majority of phenolic acids, including salicylicacid, theogallin, 4-hydroxybenzoic acid, and strictinin, graduallydecreased as the yellowing duration increased (Fig.4). However, the111levels of courmarin demonstrated a contrasting trend, showing asignificantly positive correlation with the yellowing duration (Fig. 4 &Table S4). 3.2.6. Other notable changes During the yellowing process, indole,ethylparaben, and nicotinaidelevels decreased gradually. Notably, lysophosphatidylcholines (LPCs)and hypoxanthine were newly produced during the late yellowing stage.In addition, LPC and hypoxanthine levels were significantly positivelycorrelated with the yellowing duration, making them potential markermetabolites of excessive yellowing (Fig. 4 and Table S4). Some disaccharides, such as sucrose and lactose, are considered to bethe main chemical components presenting a sweet taste of a tea (Zhang,Cao, Granato, Xu, & Ho,2020). In our study, sucrose levels decreasedafter 24 h of yellowing (Fig. 4). 3.3. Correlation between tea quality and chemical compositions PLS regression (PLSR) analysis was used to investigate the correla-tion between the taste and colour of yellow tea and its chemicalcomposition (as detected by metabolomics), with the mass intensity ofthe metabolite and the tea colour value and taste intensity set as Xand Yvariables, respectively. In the PLSR plot, if the two variables are in thesame quadrant, the correlation between them is positive; moreover, thelarger the distance of the metabolite from the original point, the strongerthe contribution of that metabolite to the taste and colour (Yang et al.,2018). As shown in Fig. 5, the umami and sweet taste, as well as lightness (L*) and yellow value (b*) of tea leaves’ color were in the firstquadrant; red value (+a*) was in the second quadrant; bitterness andastringency were in the fourth quadrant. Fig.5a showed the correlation between the colour values (L*a*b*)and the chemical compositions. The results showed that some aminoacids (valine, glutamate and leucine), procyanidin B2 and leucocyanidinwere positively correlated with lightness (L*) and yellowness (b*).Meanwhile, phaeophorbides were located in the same quadrant asredness (+a*) and showed positive correlation. This suggested that inaddition to chlorins, some amino acids and flavonoids might also havean effect on yellow tea’s colour. Previous study has shown that theexpression of some free amino acids and flavonoids was up-regulated inyellow rice compared to normal rice, correlating with yellowness (b*),and suggesting that it might be related to the response of rice to heatstress during storage (Liu et al., 2019). Meanwhile, the positive corre-lation between phaeophorbides and red value (+a*) further illustratedthat the increase of phaeophorbides might cause the colour of yellow teaturning to brown, which was not conducive to the formation of yellowtea colour. However, the yellowing of tea leaves is a complicated processduring the yellowing process, and the yellowing mechanism needs to befurther investigated in depth. In our study, most flavan-3-ols (mainly EGCG, ECG, GC, and pro-cyanidin B2) and phenolic acids (mainly salicylic acid, theogallin, con-iferin, and 4-hydroxybenzoic acid) were found to be strongly correlatedwith the bitter and astringent tastes (Fig. 5b). This result is consistentwith reported studies where flavan-3-ols, procyanidins, and alkaloidswere found to confer bitterness and gallated catechins were stronglycorrelated with the bitter and astringent tastes (Cao et al., 2019;Scharbert et al., 2004; Scharbert & Hofmann,2005). Moreover, EGCGand other catechins have the puckering astringent and bitter tastes,different from the mouth-drying or velvety-like astringent taste of fla-vanols glycosides (Zhang et al., 2020). By contrast, here, most aminoacids (particularly glutamate, glutamine, theanine, aspartic acid, andasparagine) and some sugars (particularly sucrose) were in the firstquadrant and positively correlated with both umami and sweetness(Fig.5b). A study reported that approximately 70% of the umami tasteintensity of green tea was associated with amino acids, particularlyglutamate (Zhang et al.,2020). In addition, theanine was reported as akey contributor to the umami taste of tea infusion because it accountedfor >50% of total amino acids in green tea leaves (Kaneko, Kumazawa,Masuda, Henze, & Hofmann,2006). Scharbert and Hofmann (2005)reported that sweet-tasting compounds, including glucose, sucrose,serine, alanine, glycine, ornithine, proline, and threonine are present inblack tea. These findings are generally consistent with our study.Therefore, we speculate that the reason that the bitterness, astringency, Indole (ID:285) umami, sweetness, and richness of the taste began to decrease signifi-cantly after 18 h of yellowing is related to the large decrease in therelevant flavour metabolites (e.g., amino acids, sugars, flavan-3-ols, andphenolic acids). 4. Conclusions In summary, we analysed and discussed the dynamic changes in thecolour and taste of yellow tea, and investigated the changes in differ-ential metabolite levels during the yellowing process. By comparing thevariations in colour and taste, we found that the quality of tea wasoptimal for a yellowing duration of 12-18 h under 40 °C, which wasdropped after 24 h of yellowing. By combining the 66 differential me-tabolites detected by non-targeted metabolomics techniques with PLSR analysis, it could be concluded that the significant changes in colour andtaste of yellow tea during yellowing process were associated withchlorophyll decomposition, amino acids level reduction and flavan-3-ols(EGCG, ECG, GC, and procyanidin B2) degradation. Notably, the levelsof betaine, pipecolic acid, LPCs, and theasinensin B were significantlypositively correlated with the yellowing duration, making them poten-tial marker metabolites for excessive yellowing. Our study provided anunderstanding of the dynamic changes of colour, taste, and chemicalcomposition of the yellowing process in yellow tea for the first time. Inaddition, we provided a new reference for further optimising the yel-lowing process and improving the quality of yellow tea. Further researchmay focus on exploring the effects of the yellowing process on the vol-atile aroma components of yellow tea, so as to comprehensively un-derstand the mechanism of the yellowing process on the formation of Fig. 5. PLS analysis of yellow tea quality and chemical constituents. (Chemical constituents were theX variables. (a) The colour scores of lightness (L*), yellow value(b*) and red value (+a*) were the Y variables); (b) The taste scores of sweetness, umami, astringency, and bitterness were the Y variables. (For interpretation of thereferences to colour in this figure legend,the reader is referred to the Web version of this article.) CRediT authorship contribution statement Yuming Wei: Conceptualization, Data curation, Formal analysis,Methodology, Software, Writing- original draft. Tiehan Li: Formalanalysis, Methodology, Software. Shanshan Xu: Visualization, Investi-gation, Supervision. Tiancheng Ni: Writing-review & editing, Vali-dation, Supervision. Wei-Wei Deng: Writing - review & editing,Validation, Supervision. Jingming Ning: Funding acquisition, Projectadministration, Resources. Declaration of competing interest The authors declare that they have no known competing financialinterests or personal relationships that could have appeared to influencethe work reported in this paper. Acknowledgements This work was financially supported by the National Key Researchand Development Plan (2017YFD0400800); Major science and tech-nology projects of Anhui Province (18030701153) and The UniversitySynergy Innovation Program of Anhui Province (GXXT-2019-012). Appendix A. Supplementary data Supplementary data to this article can be found online at https://doi.org/10.1016/j.lwt.2020.110792. References ( Balentine , D ., Wiseman, S . , & B o uwens, L. (1 9 98). Ch e mistry oftea flav o noids. Crit i cal Reviews i n Food Science and Nutrition , 37 , 693-704. http s: / /do i .or g /10 . 1080 / 10408399709527797 ) ( Cao, Q.-Q., Zou,C., Z h ang, Y.-H. , Du, Q.-Z., Yin, J.-F., Shi, J., et al. (2019). Improving t he t aste of autumn green tea with tannase. Food Chemistry, 277, 432-437. http s : // do i . o rg /1 0 . 1 01 6 / j. foodche m . 2018.10.14 6 ) ( Cheng, L . , Yang, Q., Chen, Z. , Zhang, J., Ch e n, Q., Wan g , Y., et al. ( 2020). Dist i nctchanges of metabolic profile a nd sensory quality during qingzhuan tea processing r evealed by LC-MS-based metabolomics. Jour n al of Agricultural and Food Chem i stry,68(17), 4 955-4 9 65. ht tps :/ / d o i . o r g /10 .1 0 2 1 /a c s . j a fc . 0 c 0 0 581 ) ( Chen, Q., Shi, J ., Mu, B . , Chen, Z ., Dai, W., & Lin, Z. (2020). Metabolomics combined Y with proteomics p r ovides a novel i n terpretation of the changes i n nonvolatilecompounds during white tea pro c essing. Food Chemistry, 332. http s: / /d o i . or g / 1 0.1016/ j . foodchem . 2020 . 127412 ) ( Ciosek, P ., & Wroblewski, W. (2007). Se n sor arrays for li q uid sensing-electronic tongue systems. Analyst, 132(10), 963 - 978. http s: / / d o i . o rg /10.1039 / b705 1 0 7g ) ( Cossignani, L . , Urbani,E., Simonetti, M. S., Maur i zi, A., Chiesi, C., & Blasi, F. (2 0 14 ) . C haracterisation of secondary met a bolites in s a ffron from central Italy (Casc i a, U mbria). Food Chemistry, 143, 446-45 1 . htt p s ://d oi . org/1 0.1 0 16 /j . f o odchem.2013 . 08.0 2 0 ) ( Dai, W ., Xie, D., L u, M., Li, P ., Lv, H., Yang, C ., et al. (2017). C haracterization o f whitetea metabolome: Comparison against green and b l ack tea by a nontargeted m etabolomics ap p roach. Foo d Research International, 96. htt ps : // d oi. o r g / 10 .10 16/j. f oodres . 201 7 .0 3 .028 ) ( D i R o s a, A. R . , L e one, F . , & C hiofa l o, V . ( 2020). E le c tronic nose s and t on gues. C h e m ica l analys i s o f foo d . I t a ly : Unive r si t y o f M es s i n a ( C hapt e r 7 ) . ) ( Feng, L., L iu, P ., Zheng, P., Zhang, L., Z h ou, J. , Gong, Z., et al . (2020). Chemical profilechanges during p i le fermentation o f Qingzhuan tea af f ect inhibition of alpha- amylase and l i pase. Scientific Reports, 10(1 ) ,3489. h t tps : / / doi.org / 10. 1 038/ s 4 15 98-0 2 0-60265 - 2 ) ( Harbowy, M. E. , Balentine, D. A., Davies, A. P., & Cai, Y.( 1 997). Tea chemistry. Cr i tical R eviews i n Plant Sciences, 16(5), 41 5 -480. http s:/ / d o i. or g /10. 1 080 / 0 7 352689709701956 ) ( Hollman, P . , & Arts, I . (2000). Flavonols, flavones and flavanols -nature, occurrence and dietary b urden. Journal of the Science of Food and Agriculture, 80, 1 081-1 09 3. htt ps:// doi . o r g / 10.10 0 2/( S ICI)1097 - 0 0 10(200005 1 5 ) 8 0:73 . 0. C O ;2- G ) ( Horzic, D ., Jambrak, A . R . , Belscak-Cvitanovic, A., Komes, D. , & Le l as,V. (2012). C omparison of conventional a n d u l trasound assisted extraction techniques of yellow tea and bioactive composition of obtained extracts. Foo d and Bioprocess Tech n ology, 5 (7 ) , 2858-2870. h ttps :/ /do i . or g / 10.100 7 /s 11 9 47-0 1 2 - 0791 - z ) ( H ua, J . , J i a ng , Y . , Yuan, H ., Y in, J . , Z h ong, W ., Y u , S . , et a l .( 2 015). R e vie w o n the c ha n ges o f b io c h emi c al comp o nents a n d t h e in f lue n c i n g fa c t or s i n pili n g pro c es s of y el l ow t ea, 00 0 (003 ) J o urnal o f T ea Sc i ence, 2 0 3 - 2 08 ( I n C h i ne se). ) ( H uang, L . , Zhao, J., Chen, Q., & Zhang, Y. (2014). Nondestructive me a surement of totalvolatile basic nitrogen (TVB-N) in pork meat b y integrating n ear infraredspectroscopy, computer v i sion and electronic nose t e chniques. Food C h emistry, 145, 228-236. h t t ps: // doi. o rg /1 0 . 10 1 6 / j .f o odche m. 201 3 .06.073 ) ( Jayaram,V. B., Cu y vers, S., Lagrain, B., Verstrepen, K. J., Delcour, J. A . , & Courtin, C. M.(2013). Mapping of Saccharomyces cerevisiae metabolites in fermenting wheatstraight-dough reveals succinic acid as pH-determining factor. Food Chemistry, 13 6 ( 2), 301-308. h tt p s :/ /d o i. o rg/ 1 0 . 1 0 1 6/ j .f ood che m . 2 0 12. 0 8. 0 3 9 ) ( Jiao, W ., X iao, Y., Q ian, X., Tong, M . , Hu, Y. , Ho u , R., et al. (2016). Optimizedcombination o f dilution and r efined QuEChERS to overcome mat r ix eff e cts of six t ypes of tea for determination eight neonicotinoid insecticides by ultra performance l iquid chromatography-electrospray tandem mass spectrometry. Food Chemistry, 210,26-3 4 . h tt p s : / /d o i. o rg/ 10.1016 / j . f ood c h e m . 2 01 6 .0 4 .097 ) Kaneko, S., Kumazawa, K., Masuda, H., Henze, & Hofmann, T. (2006). Molecular andsensory studies on the umami taste of Japanese green tea. Journal of Agricultural andFood Chemistry, 54, 2688-2694. https://doi.org/10.1021/jf0525232 Korel, F., Luzuriaga, D. A., & Balaban, M. O. (2001). Quality evaluation of raw andcooked catfish (Ictalurus punctatus) using electronic nose and machine vision. Journalof Aquatic Food Product Technology, 10(1), 3-18. https://doi.org/10.1300/J030v10n01_02 Le Gall, G.l., Colquhoun, I. J., & Defernez, M. (2004). Metabolite profiling using H NMRspectroscopy for quality assessment of green tea, Camellia sinensis (L.). Journal ofAgricultural and Food Chemistry, 52(4), 692-700. https://doi.org/10.1021/jf034828r Liu, Y., Liu, J., Liu, M., Liu, Y. Q., Strappe, P., Sun, H., et al. (2019). Comparative non-targeted metabolomic analysis reveals insights into the mechanism of rice yellowing.Food Chemistry, 308. https://doi.org/10.1016/j.foodchem.2019.125621 Luo, Z., Du, H., Li, L., An, M., Zhang, Z., Wan, X., et al. (2013). Fuzhuanins A and B: TheB-ring fission lactones of flavan-3-ols from fuzhuan brick-tea. Journal of Agriculturaland Food Chemistry, 61(28), 6982-6990. https://doi.org/10.1021/jf401724w ( N i , D. , & C hen, Y .( 1 99 7 ) . T he e ffec t o f pro c e ss ing t echn o l o gy o n th e c hlorophy l l c hanges i n f a mous gr e en t e a . Jou rnal o f F o od S c ience, 18, 14- 1 8. ) ( S charbert, S ., & Hofmann, T. (2005). Molecular d e finition o f black tea taste by means ofquantitative studies, taste reconstitution, an d omission experiments. Journal of Agricultural and Food Chemistry, 53(13), 5377-5384. https: // doi . org / 10. 1 021/ ) if050294d ( S charbert, S., H olzmann, N., & H ofmann, T. (2004). Ident i fication of th e a s tringent tastecompounds in b l ack tea infusions by combining instrumental analysis and human bioresponse. Journal of Agricultural and Food C hemistry, 52, 3498-3508. ht tps:/ /doi . o rg / 1 0 .1 021/ jf 049802u ) ( Tan, J., Dai, W., Lu, M., Lv , H., Guo, L ., Zhang, Y.,et al. (2016). Study of t he dynamicchanges in the non-volatile chemical constituents of black tea d u ring fermentation processing by a non-targeted metabolomics approach. F ood Research International, 7 9, 1 06-113. h t t ps ://d oi.org /1 0 . 10 16 / j .f oo dres. 2 0 1 5.11.01 8 ) ( T sugawa, H . , Cajka, T., Kind, T.,Ma, Y., Higgins, B., Ikeda, K., et al. (2015).MS-DIAL:Data-independent MS/MS deconvolution for comprehensive metabolome analysis. N ature Methods, 12(6), 5 23-526. h t tp s : / / d oi. o rg/ 10 .1 0 3 8/n m eth . 33 9 3 ) ( W ang, Y., Kan, Z., Thompson, H. J., Ling, T., Ho , C. T., Li , D., e t al. (2019). Impact of sixtypical processing methods on the chemical composition of tea leaves using a single Camellia sinensis cultivar, Longjing 43. Journal ofAgricultural and Food Chemistry, 67(19), 5 423-5436. h t t ps: / / doi . or g/ 10 . 102 1 / acs .j a f c .8b05 1 40 ) ( Wang, L . F.,P a rk, S. C ., Chung, J . O., Baik, J. H., & Park , S . K. (2010). Th e compounds contributing to the greenness of green te a . Journal of Food Science, 69 ( 8), 301-305. h t tps ://d oi . o rg / 10. 11 1 1 / j .1 3 65- 2 621 . 2004.t b 09894.x ) ( W ang, Z.-h., Yue, C.-n., & Tong, H . -r. (2020). Analysis of taste c haracteristics and i dentification of key chemical components of f i fteen C hinese yellow t e a samples. Journal of Food Science & Technology. h ttp s : // doi . o r g/ 10. 1 007 / s1 3 1 97-0 2 0 -04 6 49 - 2 ) ( Wang, Q., Zhao,X., Qian, Y., & Wang, R. (201 3 ). In vi t ro anti o xidative activity of yellow tea and its in vivo preventive effect on gastric injury. Experimental and TherapeuticMedicine, 6(2), 423-426. h t tps: / / doi . org / 1 0. 3 892/etm.2 0 13 .1 11 7 ) ( W eerawatanako r n , M., Hu ng , W., P an , M., L i , S ., Li , D. , W a n , X. , e t a l . ( 2 015 ). C h emi s t ry an d hea l t h b e n e fici al e f fe c t s o f o olong tea and t h e a s inens i n s . F o o d S c ie n c e a n d HumanWellne ss , 4(4) , 1 33 - 1 3 6 . ) ( Wei, Y., Fang, S., Jin, G., Ni, T., Hou, Z., Li, T . , et al. (2020). E f fects of two yellowingprocess o n colour, t aste and nonvolatile compounds of bud yellow te a . International Journal of Food Science and Technology , 55(8), 2931-2941.h t tps:/ /d oi. o r g/ 1 0.1 1 1 1 / i jf s .145 5 4 ) Wu, D., & Sun, D. W. (2012). Colour measurements by computer vision for food qualitycontrol- a Review. Trends in Food ence & Technology, 29(1), 5-20. https://doi.org/10.1016/j.tifs.2012.08.004 Xu, S., Wang, J. J., Wei, Y., Deng, W. W., Wan, X., Bao, G. H., et al. (2019). Metabolomicsbased on UHPLC-Orbitrap-MS and global natural product social molecularnetworking reveals effects of time scale and environment of storage on themetabolites and taste quality of raw Pu-erh Tea. Journal of Agricultural and FoodChemistry, 67(43),12084-12093. https://doi.org/10.1021/acs.jafc.9b05314 Xu, J., Wang, M., Zhao, J., Wang, Y. H., Tang, Q., & Khan, I. A. (2018). Yellow tea(Camellia sinensis L.), a promising Chinese tea: Processing, chemical constituents andhealth benefits. Food Research International, 107,567-577. https://doi.org/10.1016/i.foodres.2018.01.063 Yang, C., Hu, Z., Lu, M., Li, P., Tan, J., Chen, M., et al. (2018). Application ofmetabolomics profiling in the analysis of metabolites and taste quality in differentsubtypes of white tea. Food Research International, 106, 909-919. https://doi.org/10.1016/j.foodres.2018.01.069 Yu, X., Hu, S., He, C., Zhou, J., Qu, F., Ai, Z., et al. (2019). Chlorophyll metabolism inpostharvest tea (Camellia sinensis L.) leaves:Variations in colour values, chlorophyllderivatives, and gene expression levels under different withering treatments. Journal ( of Agricultural and Food Chemistry, 67(38), 1 0624-10 6 36. htt p s :// doi . o rg / 1 0 . 1 0 21/ ac s. jafc. 9 b 0 3477 ) ( Zhang, L., C ao, Q .-Q., Granato, D., Xu, Y.-Q., & Ho, C.-T. (2020). Association between chemistry a n d taste of tea: A review. T r ends i n Food Science & T e chnology, 10 1 , 139-14 9 . h tt p s : / /d oi. o r g/ 1 0 . 1 016 / j . ti fs . 20 2 0.0 5 .015 ) ( Zhang, Q . , W u , S., Li, Y., L iu, M., Ni, K. , Yi, X., et al. (2019). Characterization of threedifferent classes of non-fermented teas using untargeted m etabolomics. Food ) ( R esearch International, 1 21, 697-7 0 4. ht tps:/ /doi .org/ 1 0 . 1 0 1 6 /j . f o odres . 20 1 8 . 1 2 .04 2 ) ( Z hou, J., Wu, Y., Long, P ., Ho, C. T., Wang, Y., Kan, Z., et al. (2019). LC-MS-based m etabolomics r S e r veals t h e chemical changes of polyphenols du r ing hi g h-temperatureroasting of large-leaf y ellow tea. Journal of Agricultural and Food Chemistry, 67( 1 9), 5405-5412. h ttps: / / doi . org / 10 . 1021 /a c s. jafc. 8 b05062 ) 黄化是黄茶生产的关键工艺,但黄化过程对茶叶品质和化学成分的影响尚不清楚。本研究首次采用电子眼、舌及代谢组学研究茶叶黄变过程中的动态变化。在变黄的前18小时,茶叶的颜色逐渐变黄。与鲜味和甜味相关的化合物(氨基酸、儿茶素、蔗糖、酚酸等)含量很高。黄变24 h后,茶叶颜色变深,浸出度明显降低。大多数儿茶素、氨基酸、酚酸和糖苷结合挥发物(GBVs)水平显著降低,甜菜碱、哌啶、茶素B和溶血磷脂酰胆碱(LPCs)水平显著升高。同时,根据偏最小二乘(PLS)分析,大部分氨基酸和蔗糖与鲜味和甜味呈正相关;大多数儿茶素和酚酸与苦味和涩味呈正相关;褐藻酸与茶叶颜色红值(+a*)呈正相关。本研究为黄茶黄化过程中的品质和化学变化提供了全面、新颖的认识。
确定

还剩9页未读,是否继续阅读?

产品配置单

北京盈盛恒泰科技有限责任公司为您提供《黄茶中品质及化学成分检测方案(感官智能分析)》,该方案主要用于茶叶中营养成分检测,参考标准--,《黄茶中品质及化学成分检测方案(感官智能分析)》用到的仪器有日本INSENT味觉分析系统(电子舌)
推荐专场
感官智能分析系统(电子鼻/电子舌)

相关方案
更多
该厂商其他方案
更多