


方案详情
文
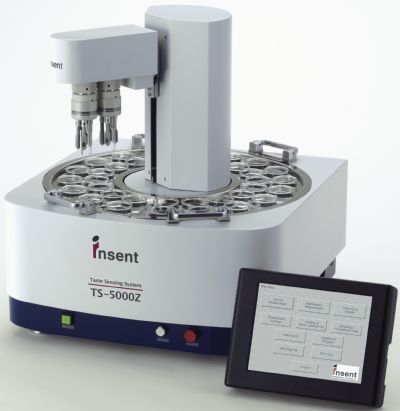
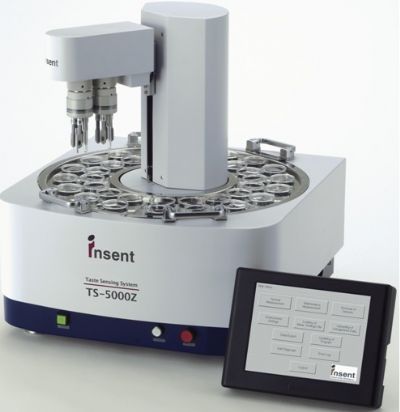
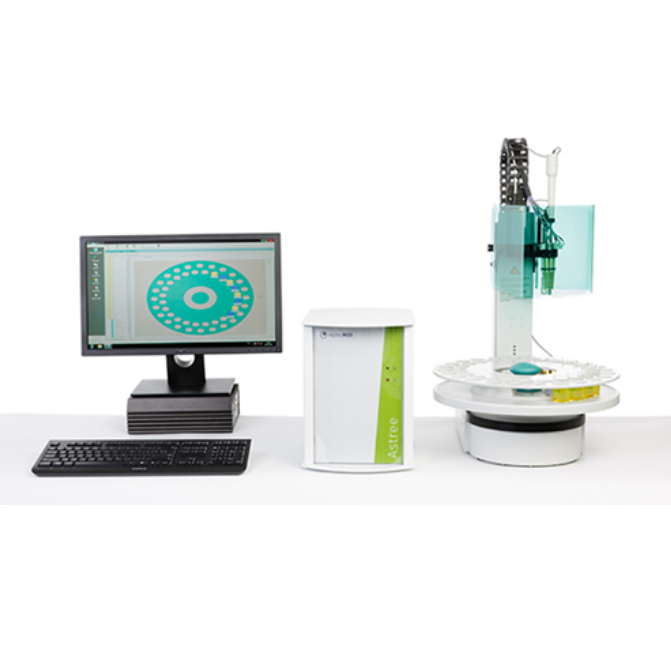
绿茶的苦度、涩度、以及持久性等味觉特征,一直是通过人工品尝的方式进行,传统方法缺乏客观、量化的标准,对品评人员的要求较高,人力成本很大。而TS-5000Z味觉分析系统,可以将绿茶的各种味觉特征清晰量化、其测量的阀值与人的感官相匹配,是目前世界上一款可以作为味觉分析标准的检测技术。
方案详情

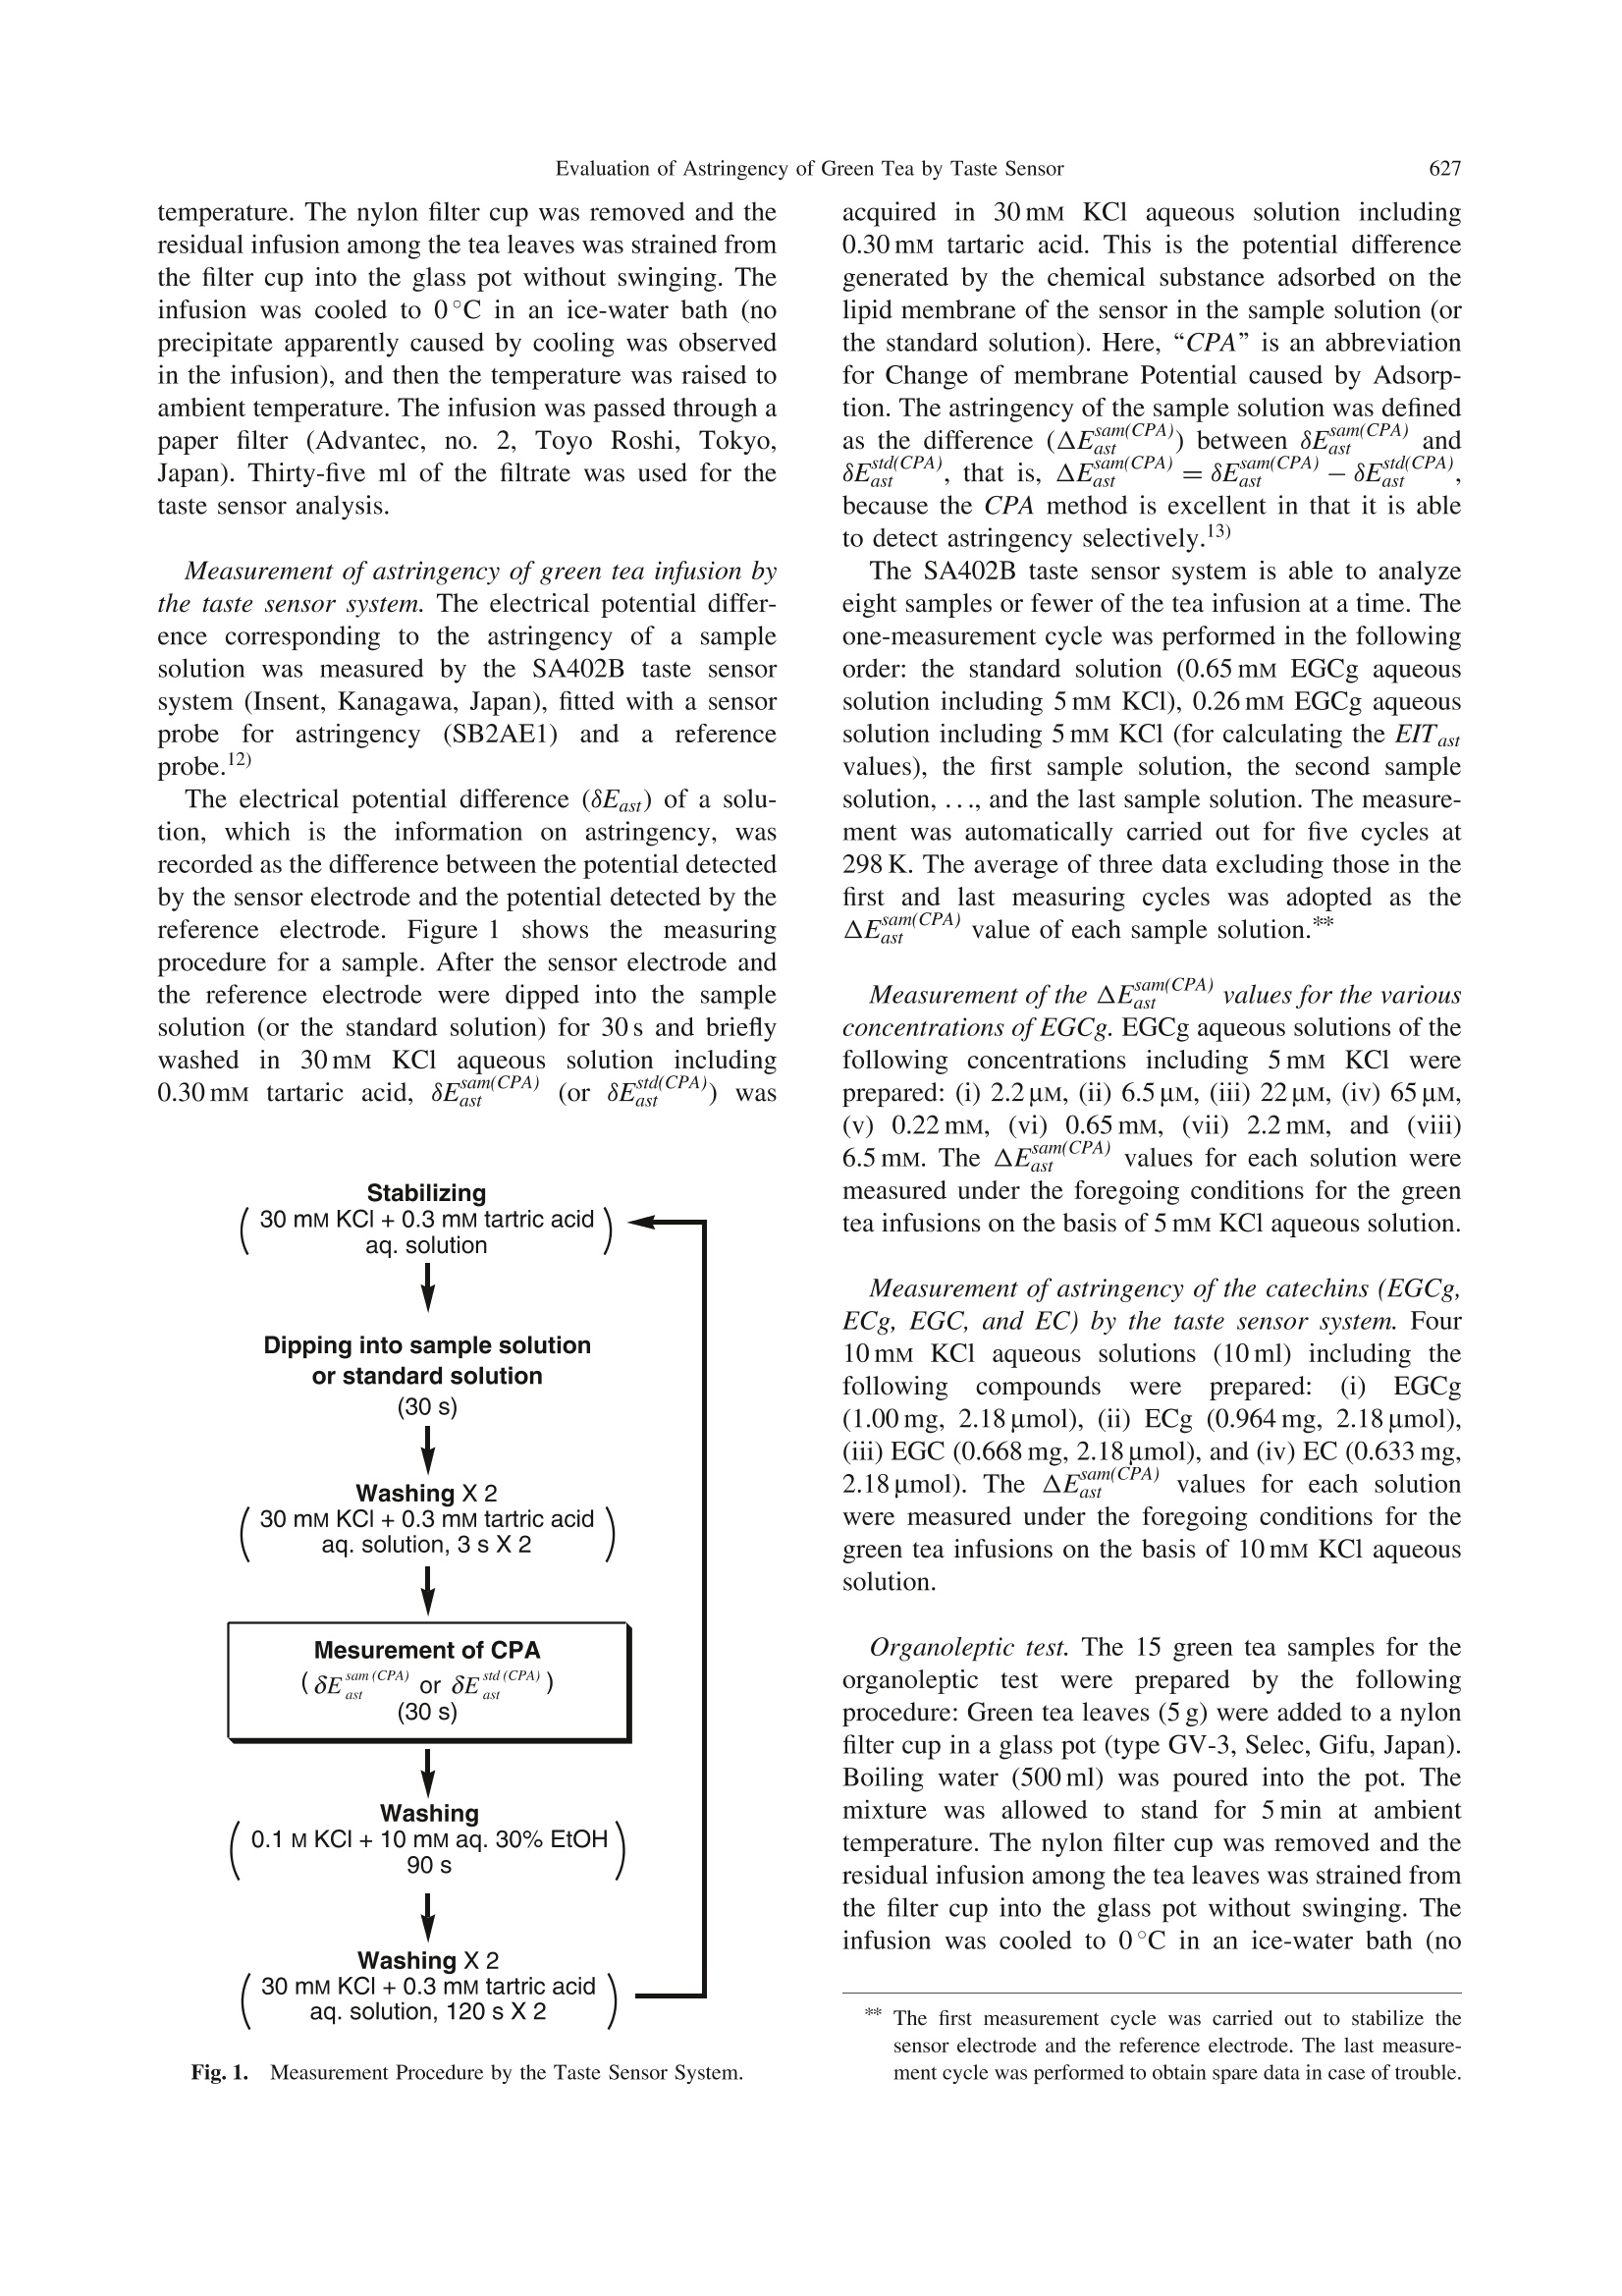
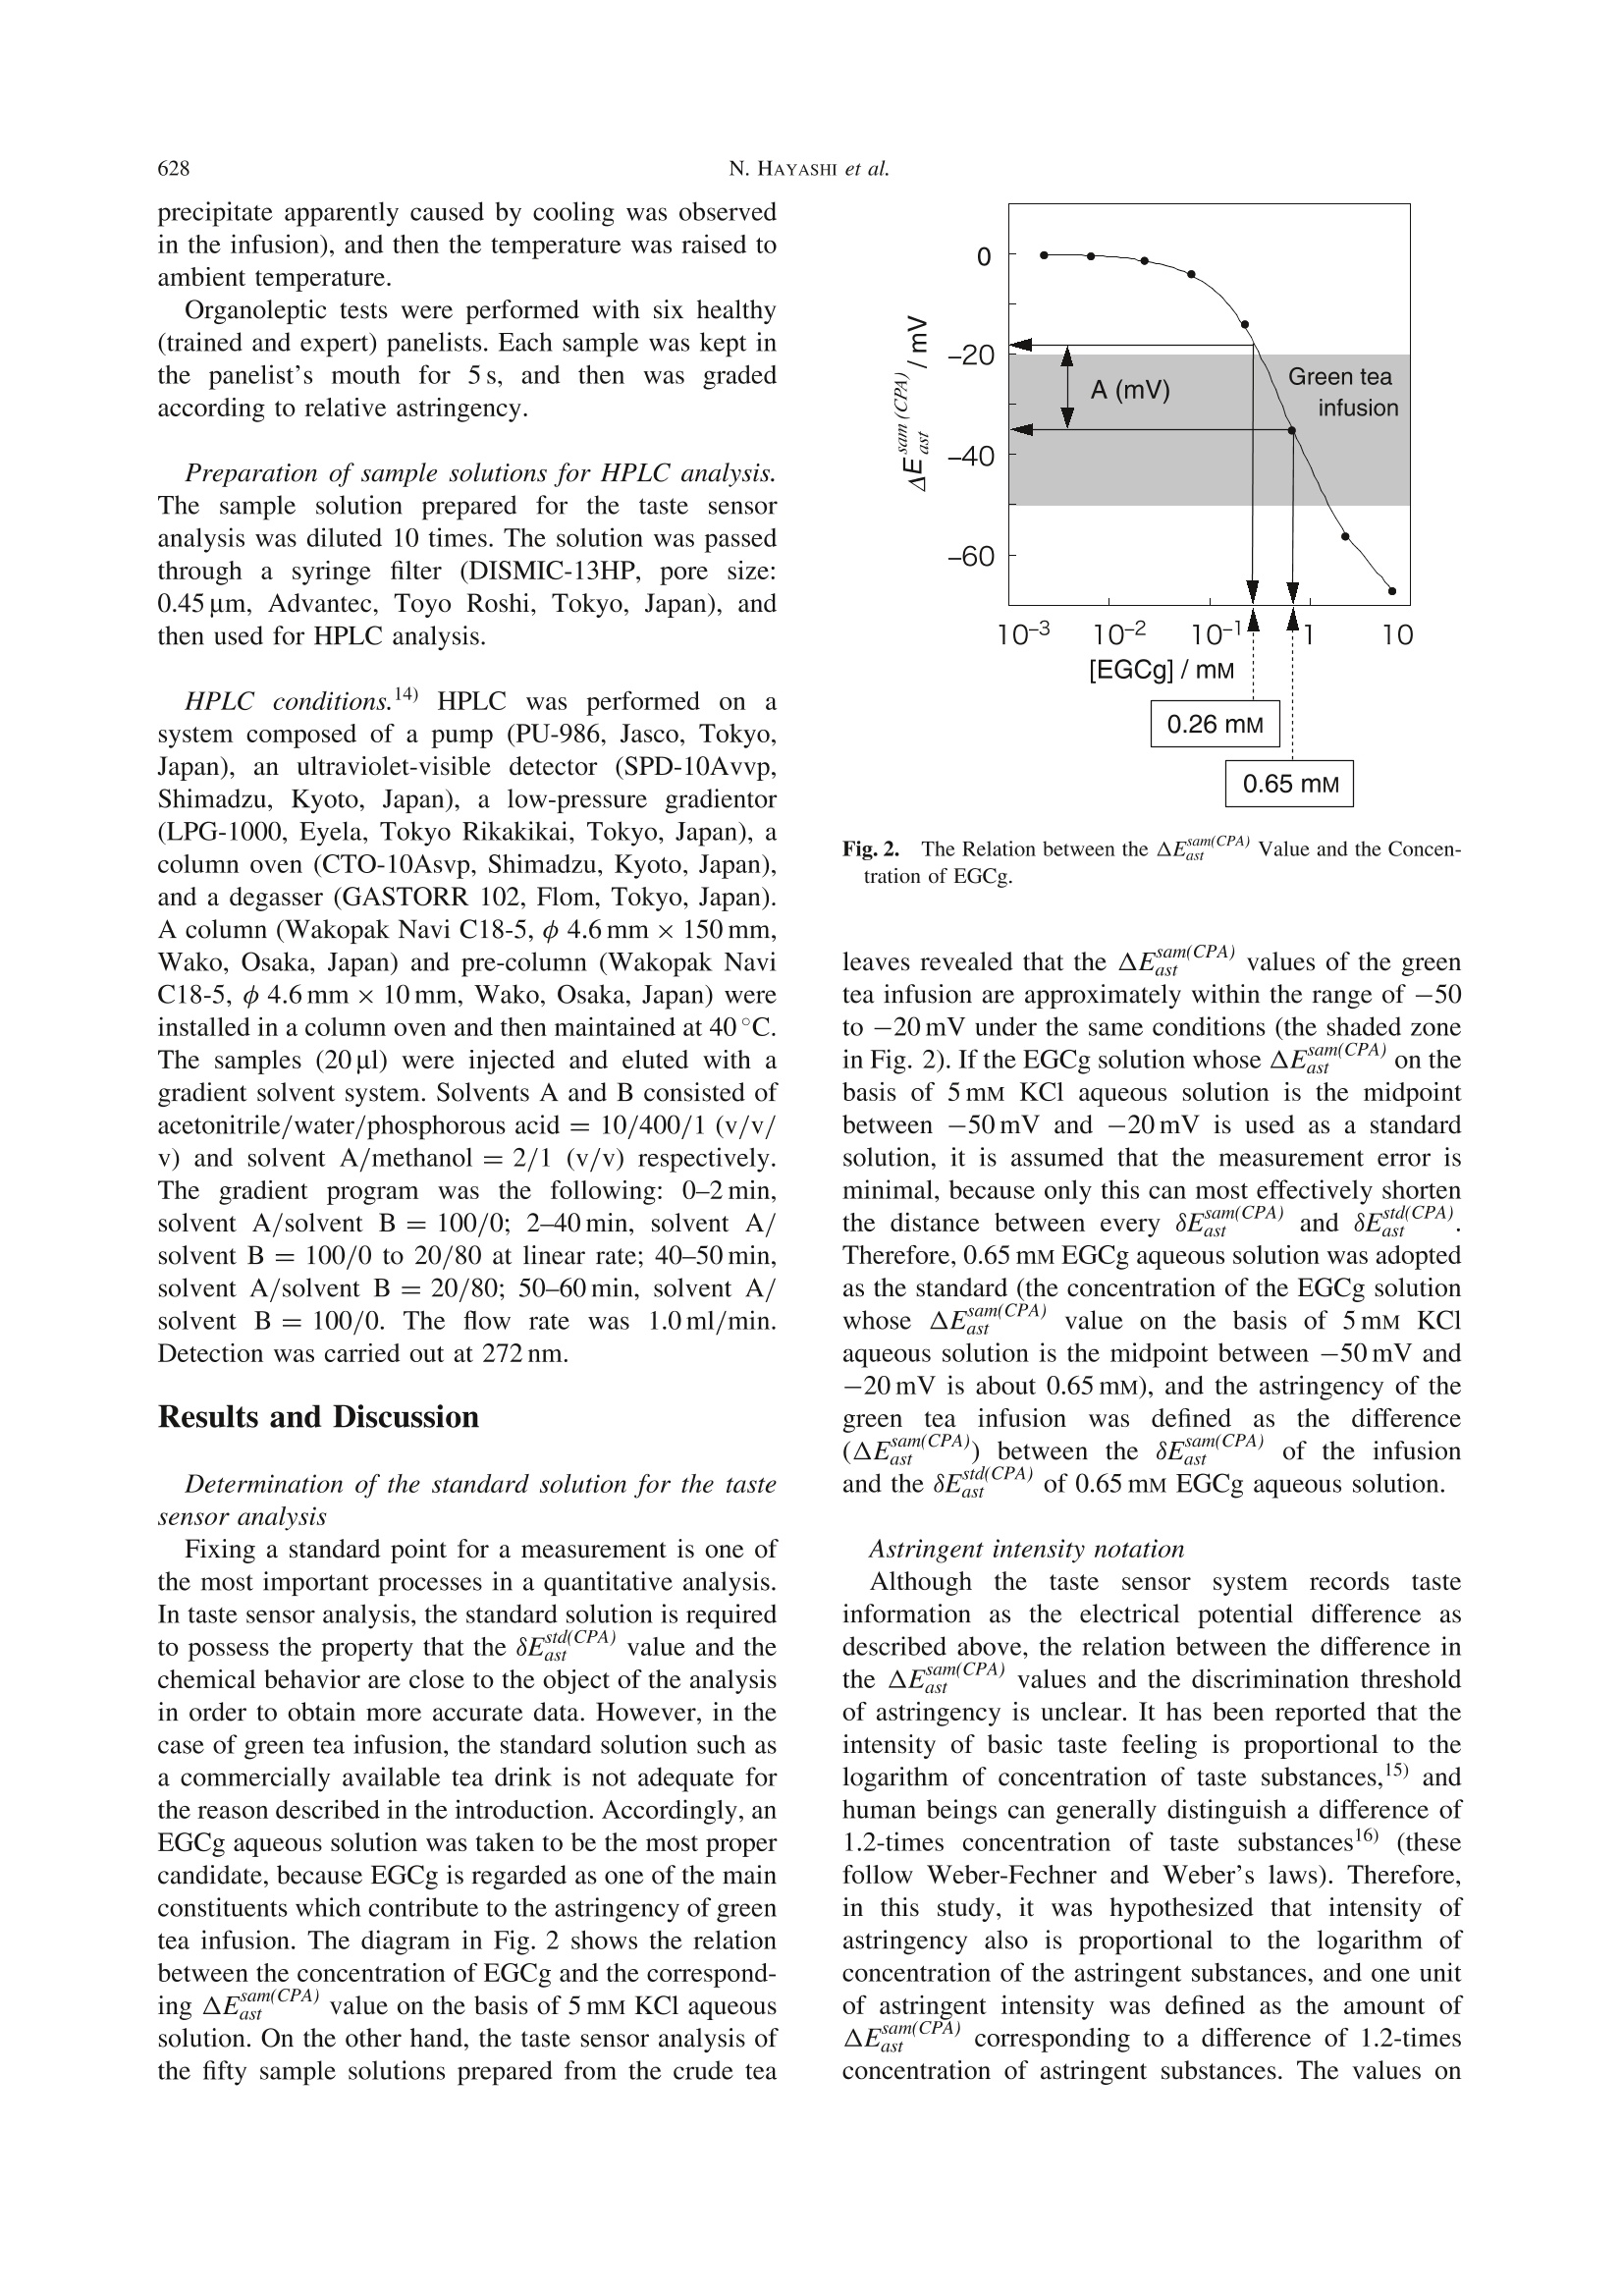
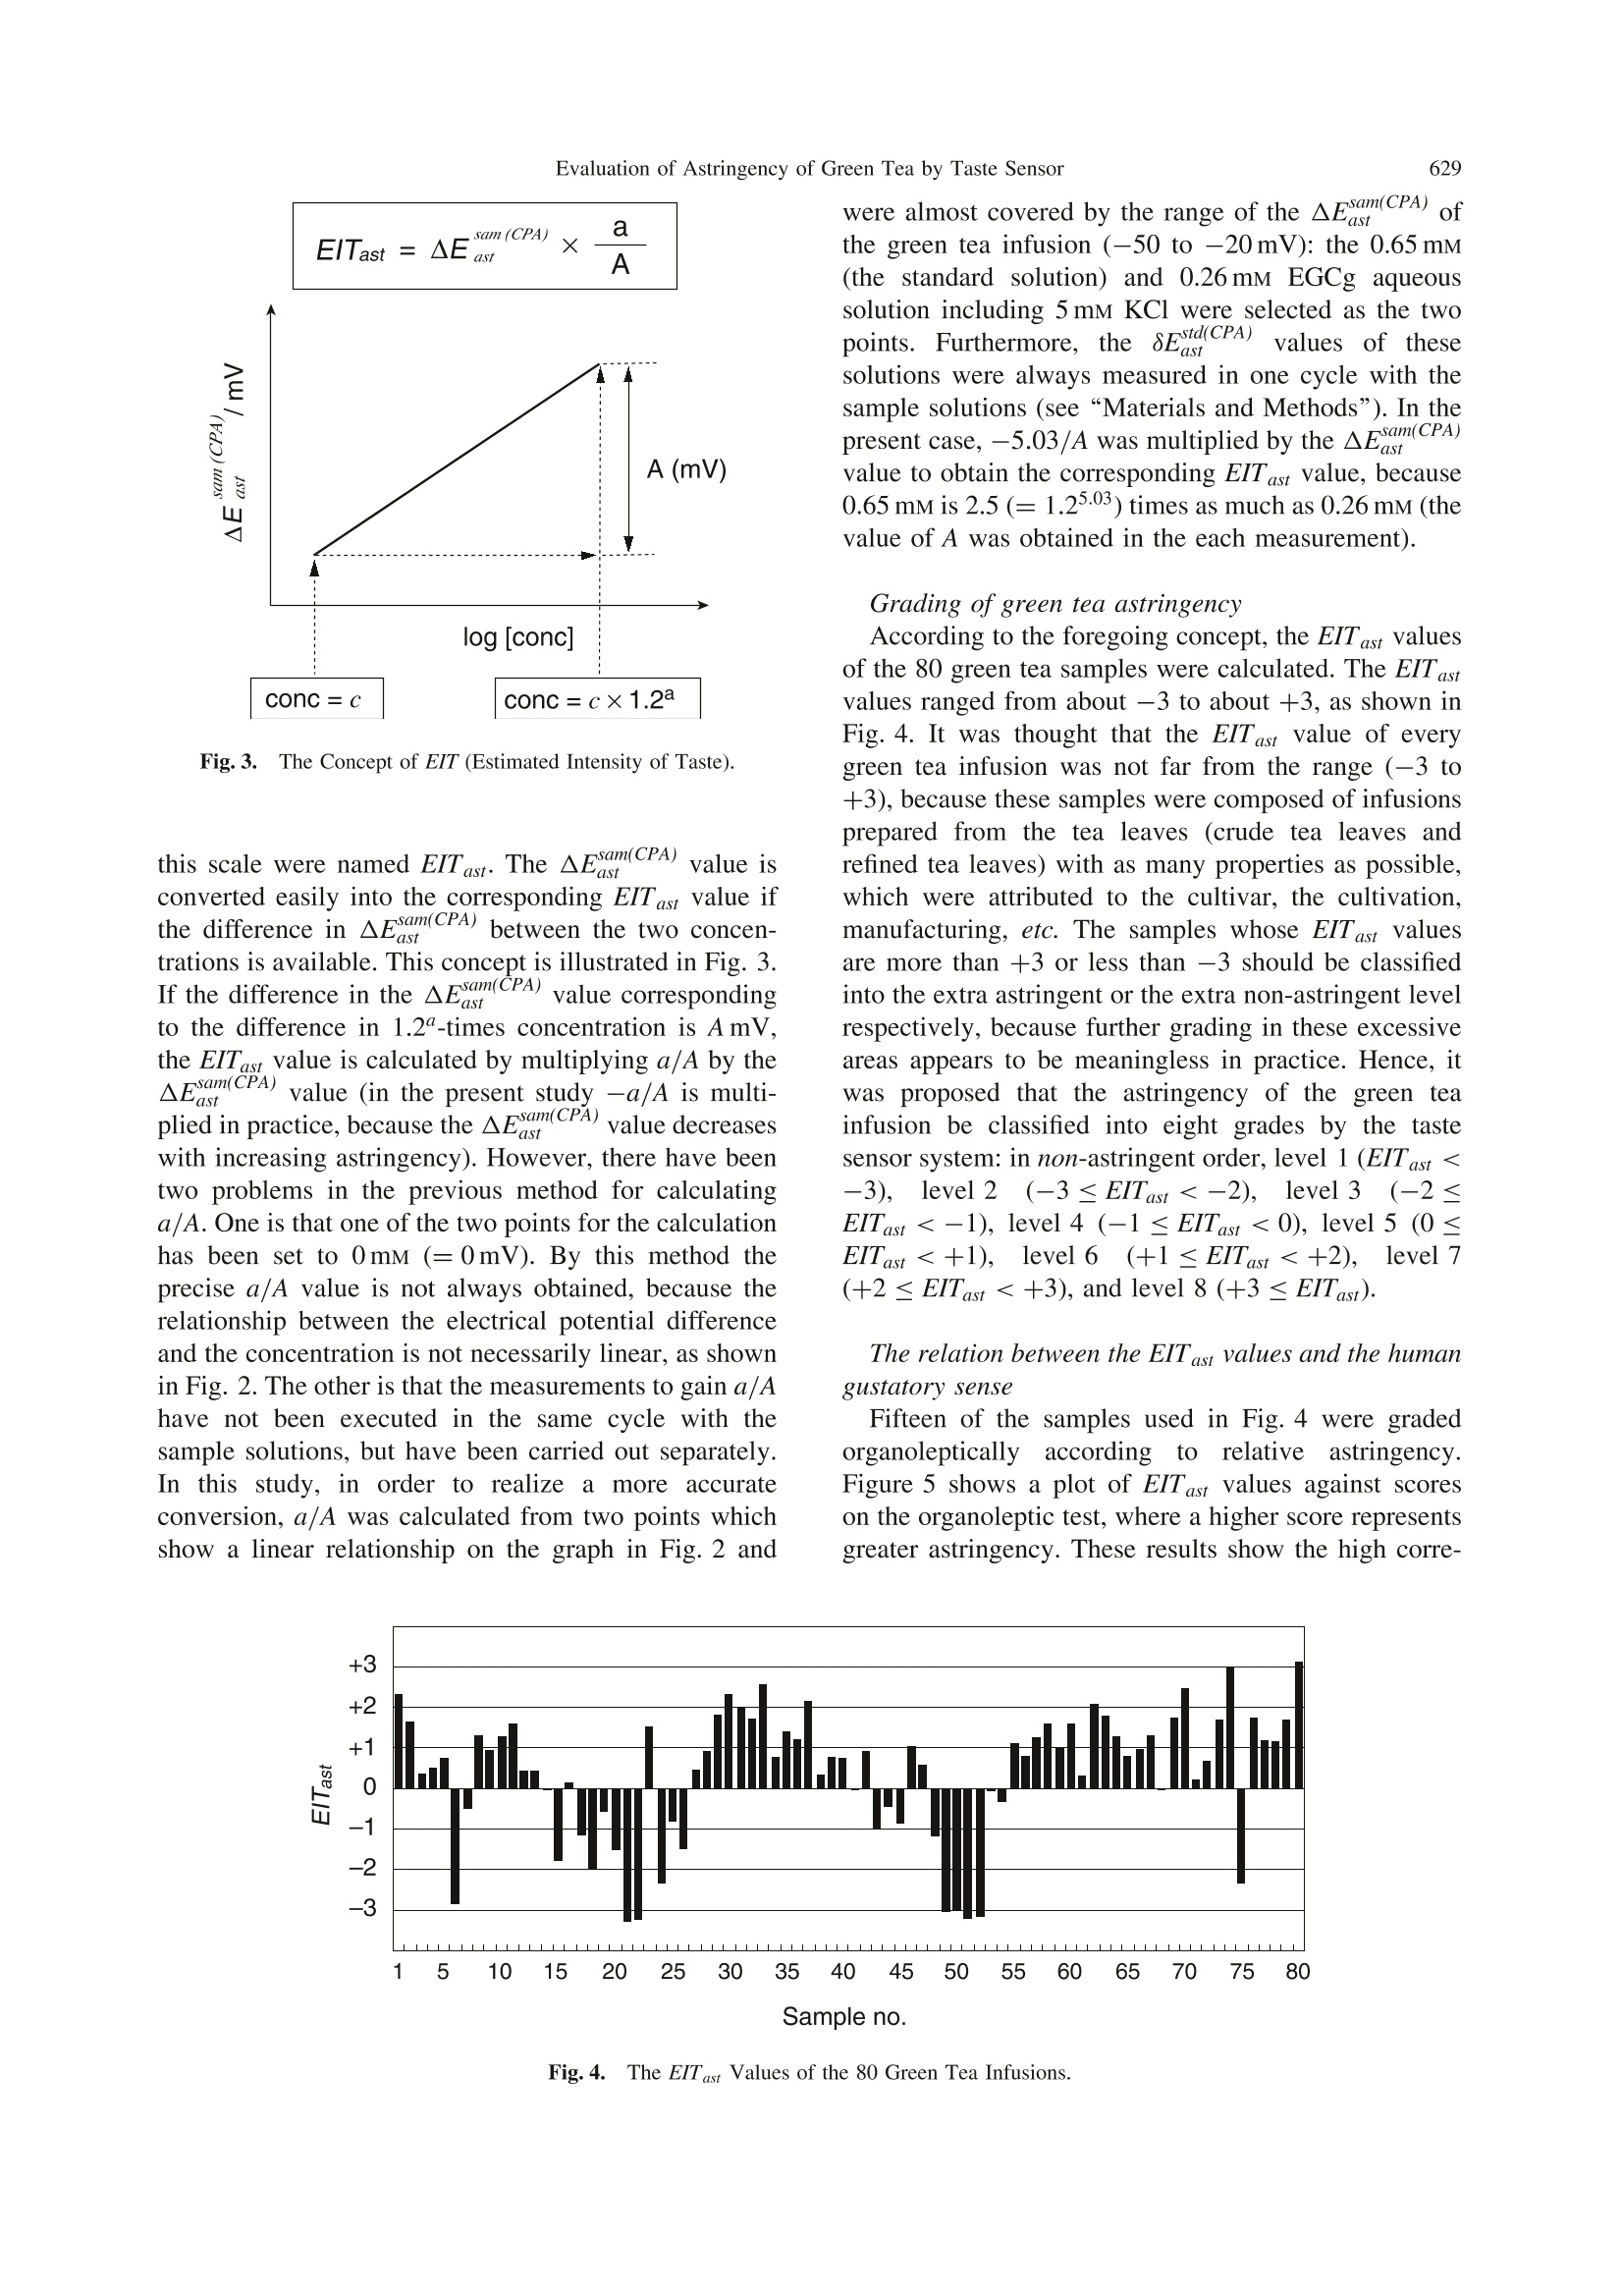
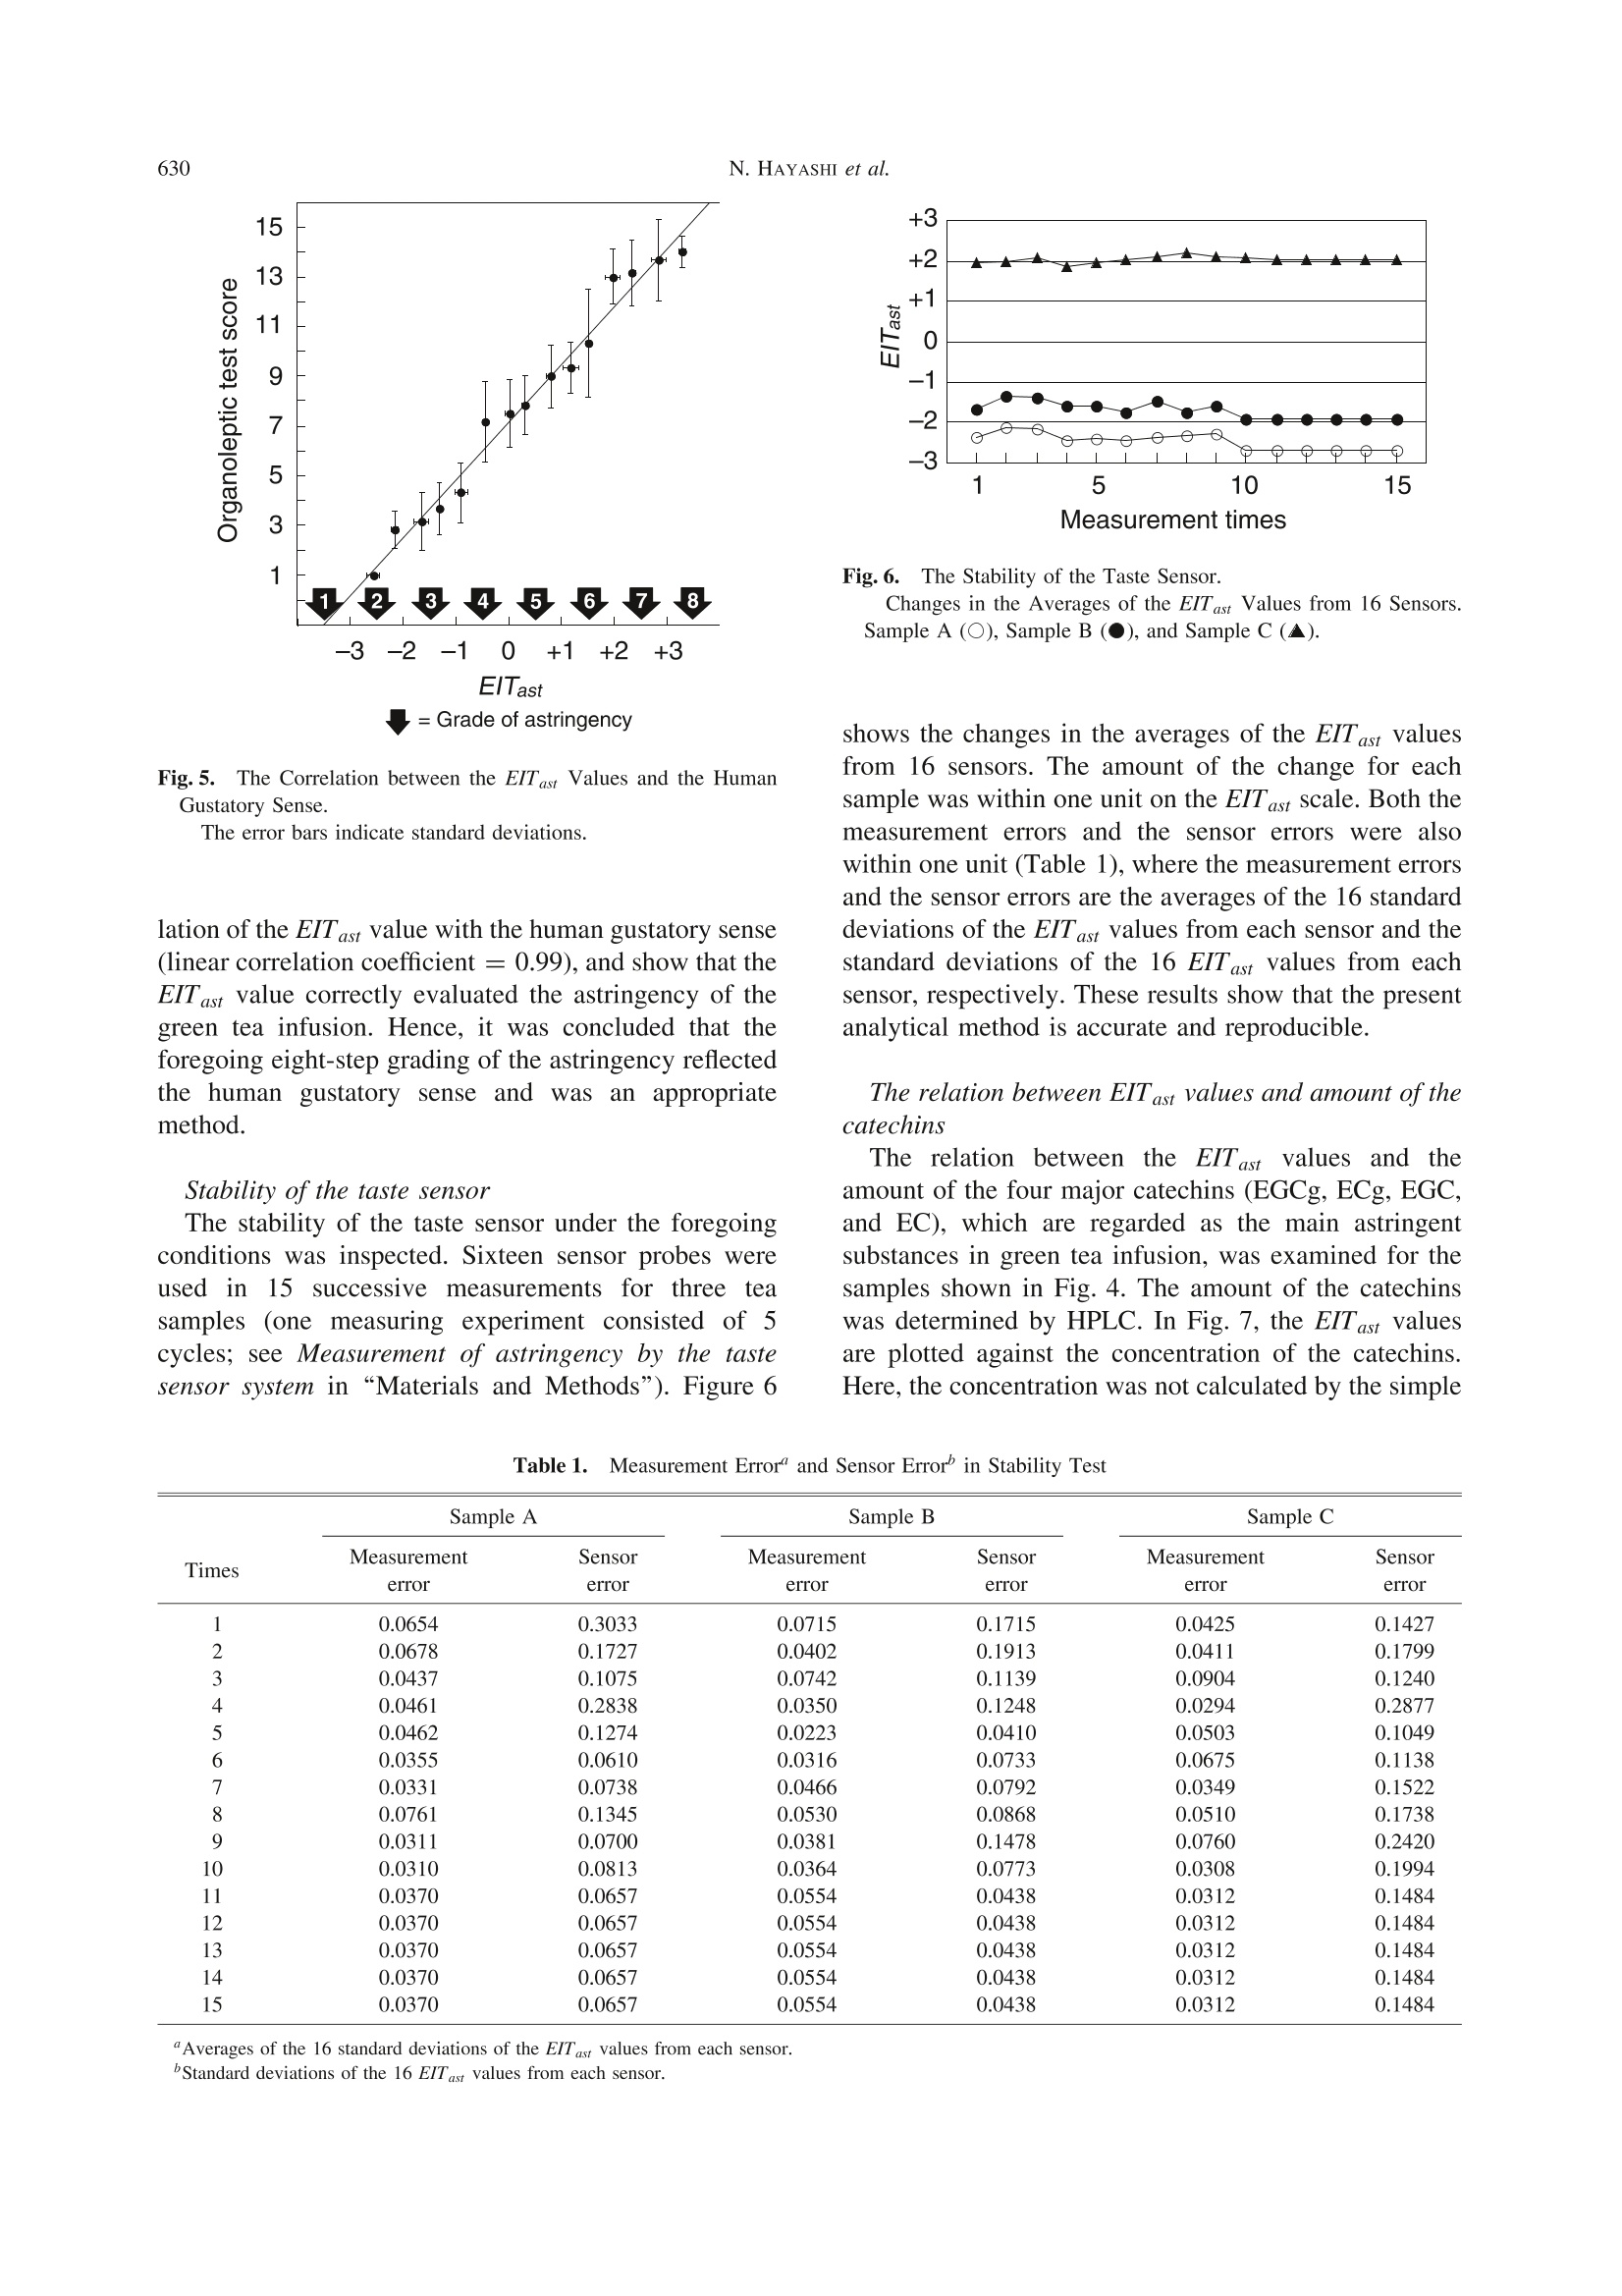
绿茶的苦度、涩度、以及持久性等味觉特征,一直是通过人工品尝的方式进行,传统方法缺乏客观、量化的标准,对品评人员的要求较高,人力成本很大。而TS-5000Z味觉分析系统,可以将绿茶的各种味觉特征清晰量化、其测量的阀值与人的感官相匹配,是目前世界上一款可以作为味觉分析标准的检测技术。JABiosci. Biotechnol. Biochem., 70 (3), 626-631,2006 627Evaluation of Astringency of Green Tea by Taste Sensor Techniques for Universal Evaluation of Astringency of Green TeaInfusion by the Use of a Taste Sensor System Nobuyuki HAYASHI,l.f Ronggang CHEN,’ Hidekazu IKEZAKI,’ Shinya YAMAGUCHI,Daisuke MARUYAMA, Yuichi YAMAGUCHI, Tomomi UJIHARA, and Katsunori KoHATAl IDepartment of Physiology and Quality Science, National Institute of Vegetable and Tea Science,2769 Kanaya, Shimada, Shizuoka 428-8501, Japan Intelligent Sensor Technology, Inc., 1800 Onna, Atsugi, Kanagawa 243-8555,Japan Received August 11, 2005; Accepted November 14, 2005 A practical method for universal evaluation of theastringency of green tea infusion by a taste sensorsystem was established. The use of EGCg aqueoussolution as2a standard enabled analysis with highaccuracy and reproducibility. The sensor output wasconverted into taste-intensity on the basis of Weber’sand Weber-Fechner laws. which WasInamed the“EITast” value (“EIT” and6“ast” are abbreviationsfor“Estimated Intensity of Taste” and“astringency”respectively). It was clarified that green tea infusion isto be classified into eight grades on the EITast scale.Furthermore, the high correlation of the EITast valuewith the human gustatory sense and the high stability ofthe taste sensor were proved. Key words: evaluation of astringency; tastesensor:green tea; EGCg The taste of green tea infusion is an important factorfor evaluating its quality. An organoleptic test has beenconsidered the only means of the evaluation, because thehuman tongue is able to recognize the subtle differencein the taste controlled by various factors such12assynergistic or inhibitory action among taste substances.However, it is not easy to obtain objectivity andreproducibility in the data by this classical methodbecause of the effects of the test conditions and personalpreferences of the panelists. Recently, a taste sensor system which mimics thehuman response to food taste has been developed as anobjective sensing technology by the Toko group incooperation with Insent (Intelligent Sensor Technology,Inc., Kanagawa, Japan).1-3)ThisnovelSsystemisequipped with several sensor probes corresponding tosaltiness, bitterness, sourness,andastringency, anddetects the intensity of eachh tasteeas an electricalpotential difference. It has been used in attempts toevaluate the taste of medicines4-6) and such foodstuffs asbeer.7 mineral water.8) coffee,9 and milk.10,11) However, although the results of these analyses are undoubtedlyobjective, it is difficult to regard them as universal data,because commercial foods have been used as a standardsolution for the taste sensor analysis. Commercialproducts always include the possibility that the qualityvaries among the lots, deliberately or accidentally. Inaddition, there was room for improvement in the methodfor converting the sensor output into the correspondingintensity of the taste in order to gain more precise data. In this study, a practicall method for universalevaluation of the astringency of green tea infusion bya taste sensor system was established. We report here thetechnique for the precise measurement and the gradingmethod of the astringency. Materials and Methods Materials. All chemicals were obtained from com-mercial suppliers and used without further purification.(-)-Epigallocatechin-3-O-gallate (EGCg) for the stand-ard solution in a taste sensor analysis was purchased asTEAVIGOTM from DSM Nutritional Products (Heerlen,Netherlands). EGCg, (-)-epicatecin-3-O-gallate (ECg),(-)-epigallocatecin (EGC), and (-)-epicatecin (EC) forthe samples in the taste sensor analysis and the standardsolution in HPLC analysis were purchased from Naka-hara Kagaku (Gifu, Japan). Crude tea leaves weremanufactured at the National Institute of Vegetable andTea Science (Shizuoka, Japan). Refined tea leaves wereobtained from commercial suppliers.* Preparation of green tea infusions for taste sensoranalysis. Green tea leaves (2g) were added to a nylonfilter cup in a glass pot (type GAV-2, Selec, Gifu,Japan). Boiling water (200ml) was poured into the pot.The mixture was allowed to stand for 5 min at ambient ( Crude tea is tea manufactured from fresh leaves by steaming,rolling, and drying. Refined tea is commercially available tea produced from crude tea by firing, sorting, blending, etc. ) temperature. The nylon filter cup was removed and theresidual infusion among the tea leaves was strained fromthe filter cup into the glass pot without swinging. Theinfusion was cooled to 0°C in an ice-water bath (noprecipitate apparently caused by cooling was observedin the infusion), and then the temperature was raised toambient temperature. The infusion was passed through apaper filter (Advantec, no. 2, Toyo Roshi, Tokyo,Japan). Thirty-five ml of the filtrate was used for thetaste sensor analysis. Measurement of astringency of green tea infusion bythe taste sensor system. The electrical potential differ-ence corresponding to the astringency ofa samplesolution was measured by the SA402B taste sensorsystem (Insent, Kanagawa, Japan), fitted with a sensorprobe for astringency (SB2AE1) and a referenceprobe 12) The electrical potential difference (8East) of a solu-tion, which is the information on astringency, wasrecorded as the difference between the potential detectedby the sensor electrode and the potential detected by thereference electrode. Figure 1 shows the measuringprocedure for a sample. After the sensor electrode andthe reference electrode were dipped into the samplesolution (or the standard solution) for 30s and brieflywashed in 30mM KCl aqueouIsSsolution including0.30 mM tartaric acid, 8Esam(CPA)(or 8Esatsdt(CPA)) was acquired in 30mM KCl aqueous solution including0.30mM tartaric acid. This is the potential differencegenerated by the chemical substance adsorbed on thelipid membrane of the sensor in the sample solution (orthe standard solution). Here,“CPA”is an abbreviationfor Change of membrane Potential caused by Adsorp-tion. The astringency of the sample solution was definedas the difference (AEsaaSim(CPA)) between 8ESam(CPAA))一andSEStd(CPPAA)), that is, AEam(CPA)=8Ecm(CPA)-8Ed(CPA),because the CPA method is excellent in that it is ableto detect astringency selectively.13) The SA402B taste sensor system is able to analyzeeight samples or fewer of the tea infusion at a time. Theone-measurement cycle was performed in the followingorder: the standard solution (0.65mM EGCg aqueoussolution including 5 mM KCl), 0.26 mM EGCg aqueoussolution including 5 mM KCl (for calculating the EITastvalues), the first sample solution, the second samplesolution,..., and the last sample solution. The measure-ment was automatically carried out for five cycles at298 K. The average of three data excluding those in thefirst and last measuring cycles was adopted as theAFsam(CPA) value of each sample solution.** Measurement ofthe ▲East(CPA) values for the variousconcentrations ofEGCg. EGCg aqueous solutions of thefollowing concentrations including 5mM KCl wereprepared: (i) 2.2 uM, (ii) 6.5 uM, (iii) 22 uM, (iv) 65 uM,(v) 0.22mM, (vi) 0.65mM, (vii) 2.2 mM, and (viii)6.5mM. The ▲Emn(CPA) values for each solution weremeasured under the foregoing conditions for the greentea infusions on the basis of 5 mM KCl aqueous solution. Measurement ofastringency of the catechins (EGCg,ECg, EGC, and EC) by the taste sensor system. Four10 mM KCl aqueous solutions (10 ml) including thefollowingcompounds wereprepared: (i)EGCg(1.00mg, 2.18 umol), (ii) ECg (0.964 mg, 2.18umol),(iii) EGC (0.668 mg, 2.18umol), and (iv) EC (0.633 mg,2.18umol). The AEsam(CPA)values for each solutionwere measured under the foregoing conditions for thegreen tea infusions on the basis of 10 mM KCl aqueoussolution. Organoleptic test. The 15 green tea samples for theorganoleptic testwere prepared by the followingprocedure: Green tea leaves (5g) were added to a nylonfilter cup in a glass pot (type GV-3, Selec, Gifu, Japan).Boiling water (500ml) was poured into the pot. Themixture was allowed to stand for 5 min at ambienttemperature. The nylon filter cup was removed and theresidual infusion among the tea leaves was strained fromthe filter cup into the glass pot without swinging. Theinfusion was cooled to 0°C in an ice-water bath (no ( * * The first measurement cycle was carried out to stabilize the sensor electrode and the reference electrode. The last measure-ment cycle was performed to obtain spare data in case of trouble. ) precipitate apparently caused by cooling was observedin the infusion), and then the temperature was raised toambient temperature. Organoleptic tests were performed with six healthy(trained and expert) panelists. Each sample was kept inthe panelist’s mouth for 5s, and then wasgradedaccording to relative astringency. Preparation of sample solutions for HPLC analysis.The sample solution prepared for the taste sensoranalysis was diluted 10 times. The solution was passedthrough a syringe filter (DISMIC-13HP, pore size:0.45 um, Advantec, Toyo Roshi, Tokyo, Japan), andthen used for HPLC analysis. HPLC conditions.14) HPLC was performed on asystem composed of a pump (PU-986, Jasco, Tokyo,Japan), an ultraviolet-visible detector (SPD-10Avvp,Shimadzu, Kyoto, Japan), a low-pressure gradientor(LPG-1000, Eyela, Tokyo Rikakikai, Tokyo, Japan), acolumn oven (CTO-10Asvp, Shimadzu, Kyoto, Japan),and a degasser (GASTORR 102, Flom, Tokyo, Japan).A column (Wakopak Navi C18-5, 中 4.6mm×150mm,Wako, Osaka, Japan) and pre-column (Wakopak NaviC18-5, 中 4.6mm x 10 mm, Wako, Osaka, Japan) wereinstalled in a column oven and then maintained at 40°C.The samples (20ul) were injected and eluted with agradient solvent system. Solvents A and B consisted ofacetonitrile/water/phosphorous acid=10/400/1(v/v/v) and solvent A/methanol=2/1 (v/v) respectively.The gradient program was the following: 0-2 min,solvent A/solvent B= 100/0; 2-40 min, solvent A/solvent B= 100/0 to 20/80 at linear rate; 40-50 min,solvent A/solvent B=20/80;50-60 min, solvent A/solvent B= 100/0. The flow rate was1.0ml/min.Detection was carried out at 272 nm. Results and Discussion Determination of the standard solution for the tastesensor analysis Fixing a standard point for a measurement is one ofthe most important processes in a quantitative analysis.In taste sensor analysis, the standard solution is requiredto possess the property that the 8Ed(cPA) value and thechemical behavior are close to the object of the analysisin order to obtain more accurate data. However, in thecase of green tea infusion, the standard solution such asa commercially available tea drink is not adequate forthe reason described in the introduction. Accordingly, anEGCg aqueous solution was taken to be the most propercandidate, because EGCg is regarded as one of the mainconstituents which contribute to the astringency of greentea infusion. The diagram in Fig. 2 shows the relationbetween the concentration of EGCg and the correspond-ing AEsam(CPA) value on the basis of 5 mM KCl aqueoussolution. On the other hand, the taste sensor analysis ofthe fifty sample solutions prepared from the crude tea Fig.2. The Relation between the AEsam(CPA) Value and the Concen-tration of EGCg. leaves revealed that the AEsam(CPA) values of the greentea infusion are approximately within the range of -50to -20 mV under the same conditions (the shaded zonein Fig. 2). If the EGCg solution whose AEam(CPA) on thebasis of 5 mM KCl aqueous solution is the midpointbetween -50mV and -20mV is used as a standardsolution, it is assumed that the measurement error isminimal, because only this can most effectively shortenthedistance between every 8Esam(CPA) and 8Etd(CPA)Therefore, 0.65 mM EGCg aqueous solution was adoptedas the standard (the concentration of the EGCg solutionwhose AEsam(CPA)value on the basis of 5mM KC1aqueous solution is the midpoint between -50mV and-20mV is about 0.65 mM), and the astringency of thegreenn tea infusionn was(defined asthe differenceFSamastn(CPA)) between the 8Esam(CPA) of the in sionand the 8Ed(CPA) of 0.65 mM EGCg aqueous solution. Astringent intensity notation Although the taste sensoorr system recordIsStasteinformation as the electrical potential difference asdescribed above, the relation between the difference inthe AEsam(CPA) values and the discrimination thresholdof astringency is unclear. It has been reported that theintensity of basic taste feeling is proportional to thelogarithm of concentration of taste substances,) andhuman beings can generally distinguish a difference of1.2-times concentration of taste substances16) (thesefollow Weber-Fechner and Weber’s laws). Therefore,in this study, it was hypothesized that intensity ofastringency also is proportional to the logarithm ofconcentration of the astringent substances, and one unitof astringent intensity was defined as the amount ofAEsam(CPA) corresponding to a difference of 1.2-timesconcentration of astringent substances. The values on Fig.3. The Concept of EIT (Estimated Intensity of Taste). this scale were named EIT ast. The AEam(CPA) value isconverted easily into the corresponding EITast value ifthe difference in AEsaSmt(CPA) between the two concen-trations is available. This concept is illustrated in Fig. 3.If thdifference in the AEsamm((CCPPAA)) vvaallue correspondingto the difference in 1.2"-times concentration is AmV.the EITast value is calculated by multiplying a/A by theAEvam(CPA) value (in the present study -a/A is multi-plied in practice, because the △Esam(CPA) value decreaseswith increasing astringency). However, there have beentwo problems in the previous method for calculatinga/A. One is that one of the two points for the calculationhas been set to 0mM (=0mV). By this method theprecise a/A value is not always obtained, because therelationship between the electrical potential differenceand the concentration is not necessarily linear, as shownin Fig. 2. The other is that the measurements to gain a/Ahave not been executed in the same cycle with thesample solutions, but have been carried out separately.In this study, in order to realize a more accurateconversion, a/A was calculated from two points whichshow a linear relationship on the graph in Fig. 2 and were most covered by the range of the AEam(CPA) ofthe green tea infusion (-50 to -20mV): the 0.65 mM(the standard solution) and 0.26mM EGCg aqueoussolution including 5 mM KCl were selected as the twoponts. Furthermore, the 8Etd(CPA) vvaalues of thesesolutions were always measured in one cycle with thesample solutions (see“Materials and Methods"). In thepresent case, -5.03/A was multiplied by the AEm(CPA)value to obtain the corresponding EITast value, because0.65 mM is 2.5(=1.25.03) times as much as 0.26 mM (thevalue of A was obtained in the each measurement). Grading of green tea astringency According to the foregoing concept, the EIT ast valuesof the 80 green tea samples were calculated. The EIT astvalues ranged from about -3 to about +3, as shown inFig. 4. It was thought that the EITast value of everygreen tea infusion was not far from the range (-3 to+3), because these samples were composed of infusionsprepared from the tea leaves (crude tea leaves andrefined tea leaves) with as many properties as possible,which were attributed to the cultivar, the cultivation,manufacturing, etc. The samples whose ElTast valuesare more than +3 or less than -3 should be classifiedinto the extra astringent or the extra non-astringent levelrespectively, because further grading in these excessiveareas appears to be meaningless in practice. Hence, itwas proposed that the astringency of the green teainfusion be classified into eight grades by the tastesensor system: in non-astringent order, level 1 (EIT ast <-3), level 2(-3≤EITast <-2),level 3 (-2≤EITast <-1), level 4 (-1≤ EITast <0), level 5 (0≤EITast <+1)),,1level 6(+1
确定
还剩4页未读,是否继续阅读?

产品配置单
北京盈盛恒泰科技有限责任公司为您提供《绿茶中风味品质分析检测方案(感官智能分析)》,该方案主要用于茶叶中营养成分检测,参考标准--,《绿茶中风味品质分析检测方案(感官智能分析)》用到的仪器有日本INSENT味觉分析系统(电子舌)
推荐专场
感官智能分析系统(电子鼻/电子舌)
相关方案
更多
该厂商其他方案
更多