


方案详情
文
拉曼光谱与激光诱导击穿光谱(LIBS)相结合的优点是将两种互补的分析方法耦合起来:利用 LIBS 可以获得样品在检测点的元素组成信息,而拉曼光谱则可以揭示分子、晶体或矿物学结构。将 Raman/LIBS 测量结合起来的另一个好处是有机会获得深度信息。也就是说,在同一点重复激光烧蚀穿透表面时,样品的结构特征。LIBS 或 Raman/LIBS 实验的这种特殊优势已经在厚度为 1μm 到 30μm 的薄膜上得到了广泛的证明,例如对钢上的铝层的分析、涂料层的地层调查和聚合物涂层金属的分析。
方案详情

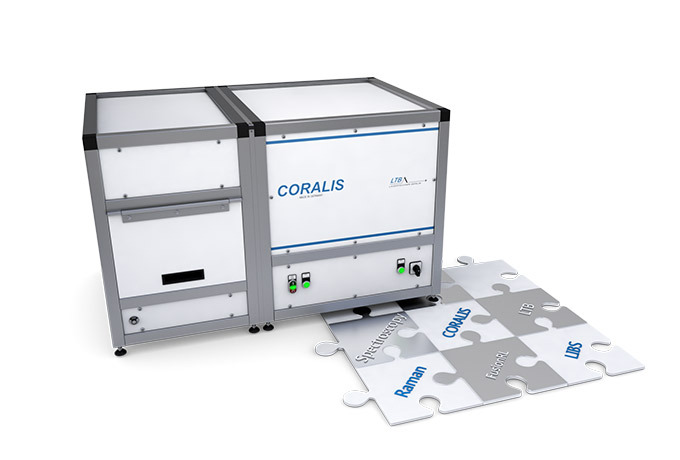
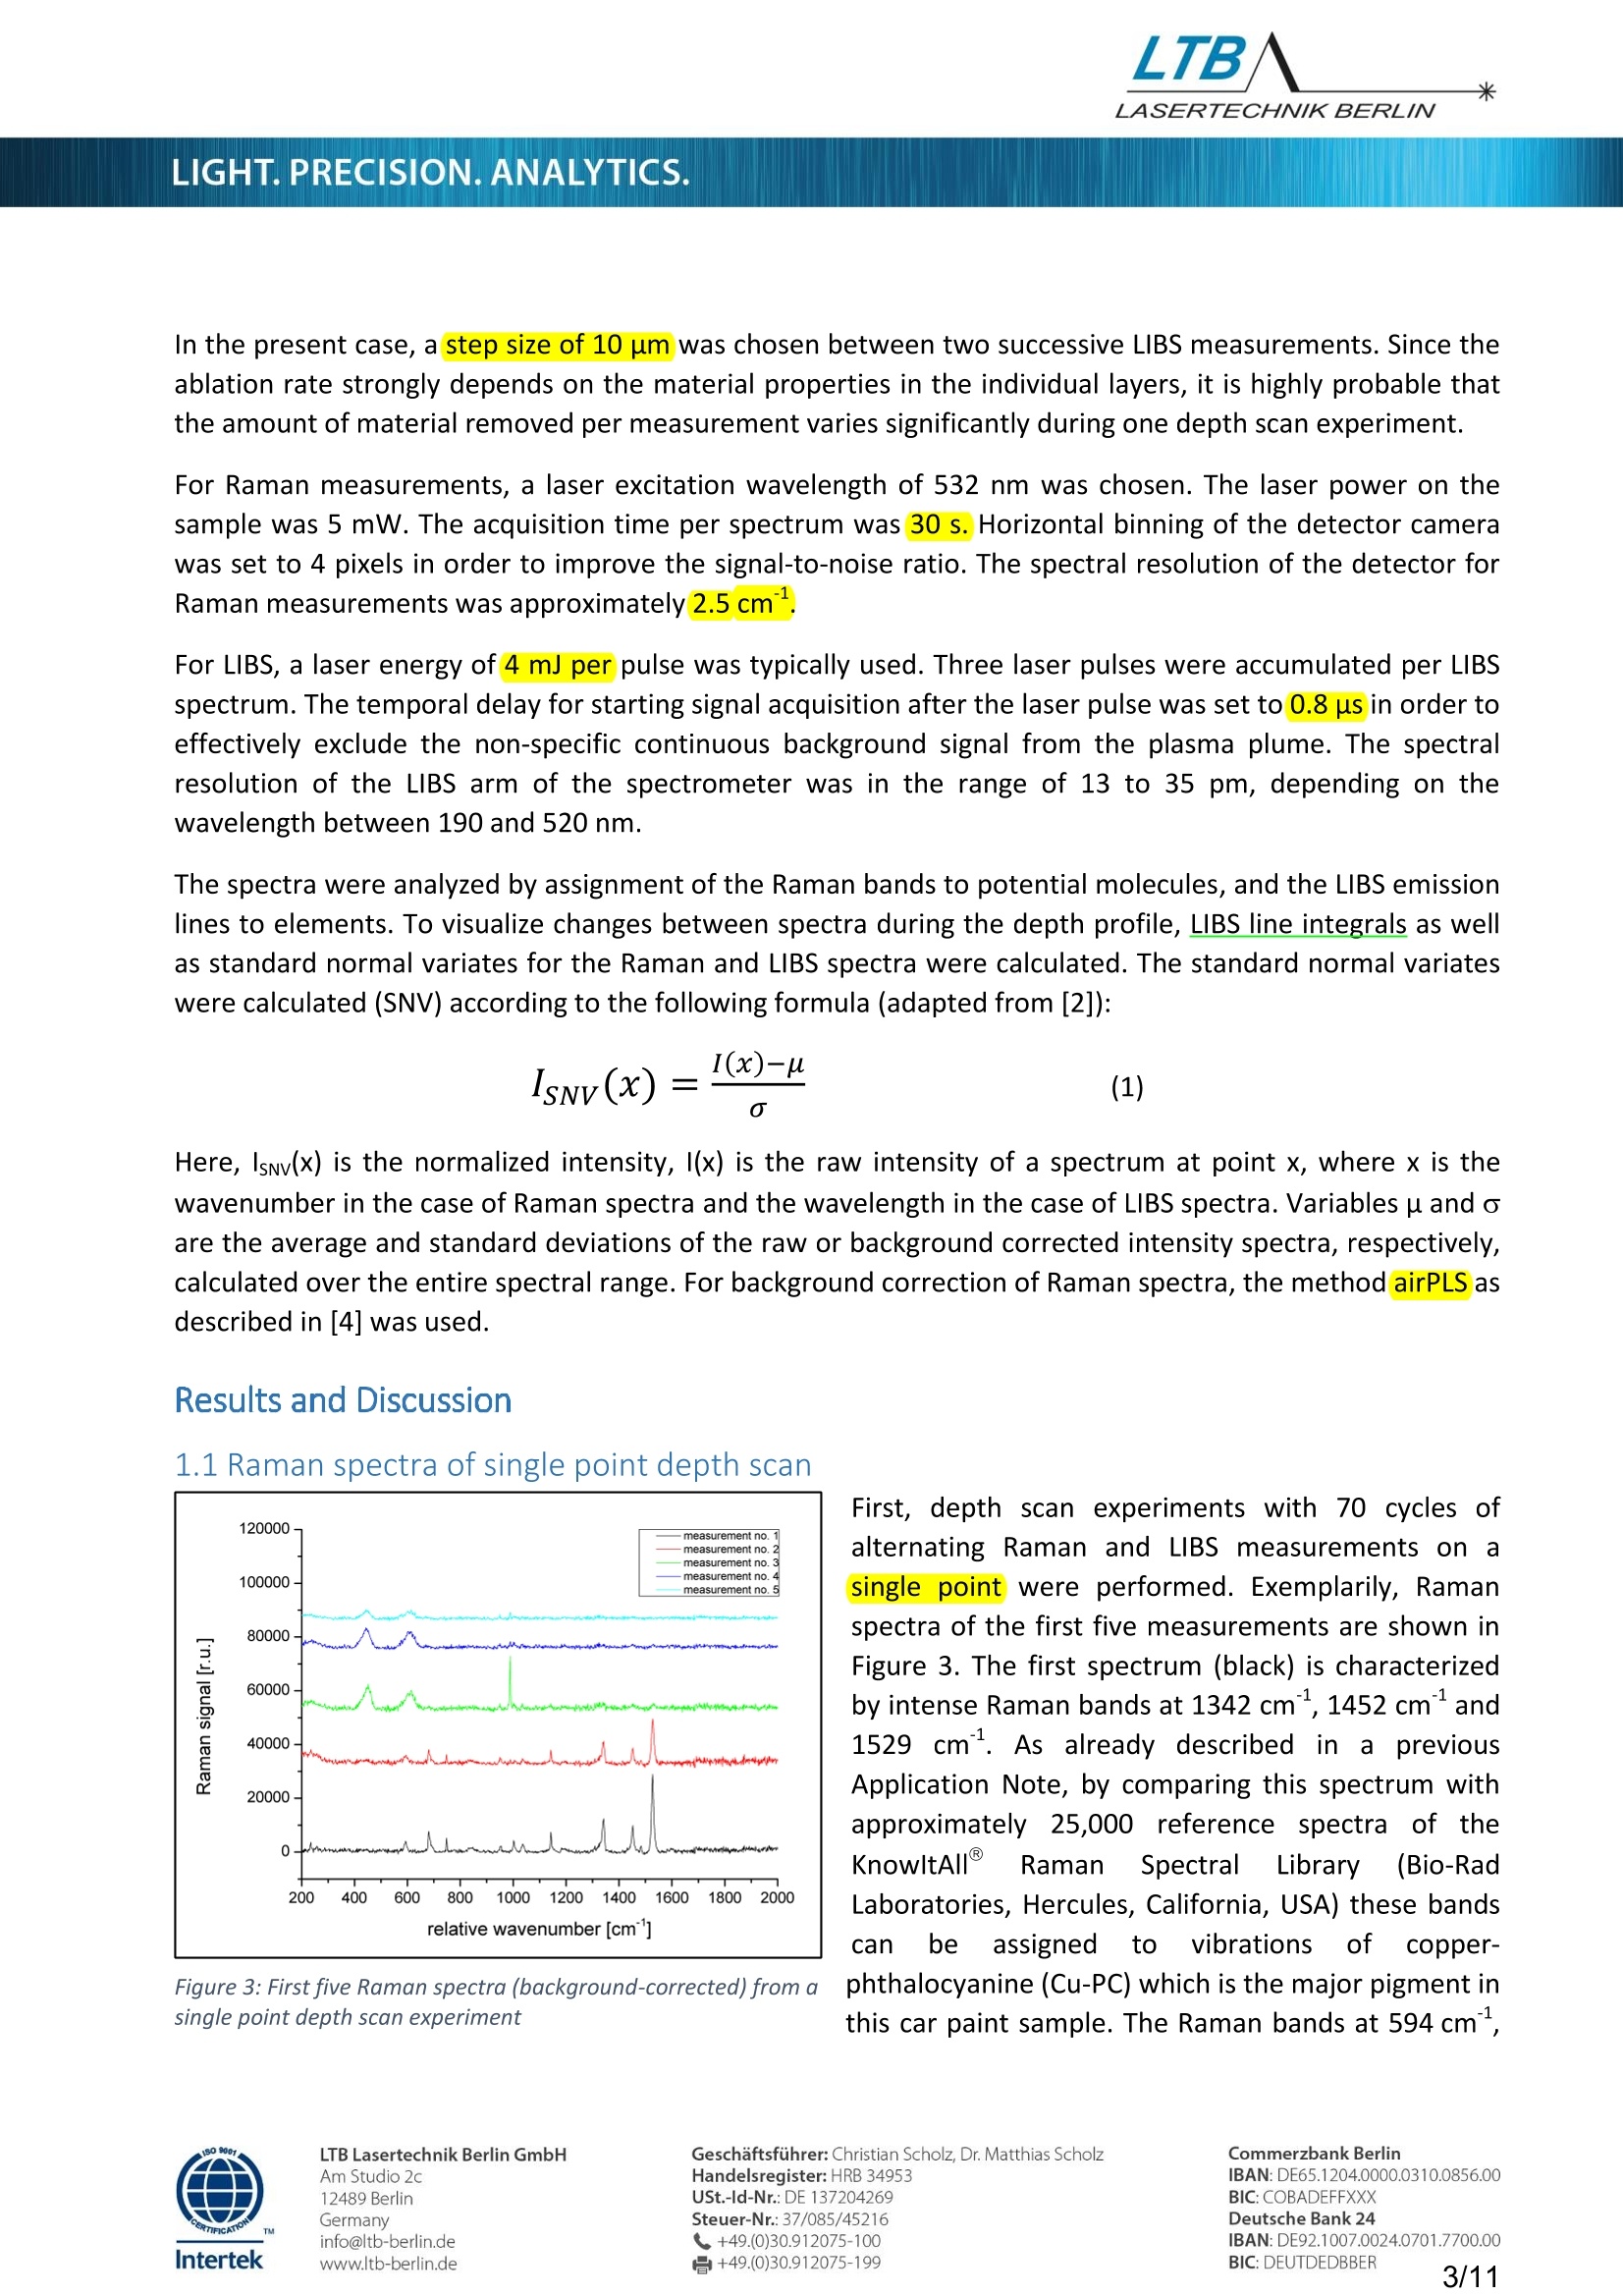
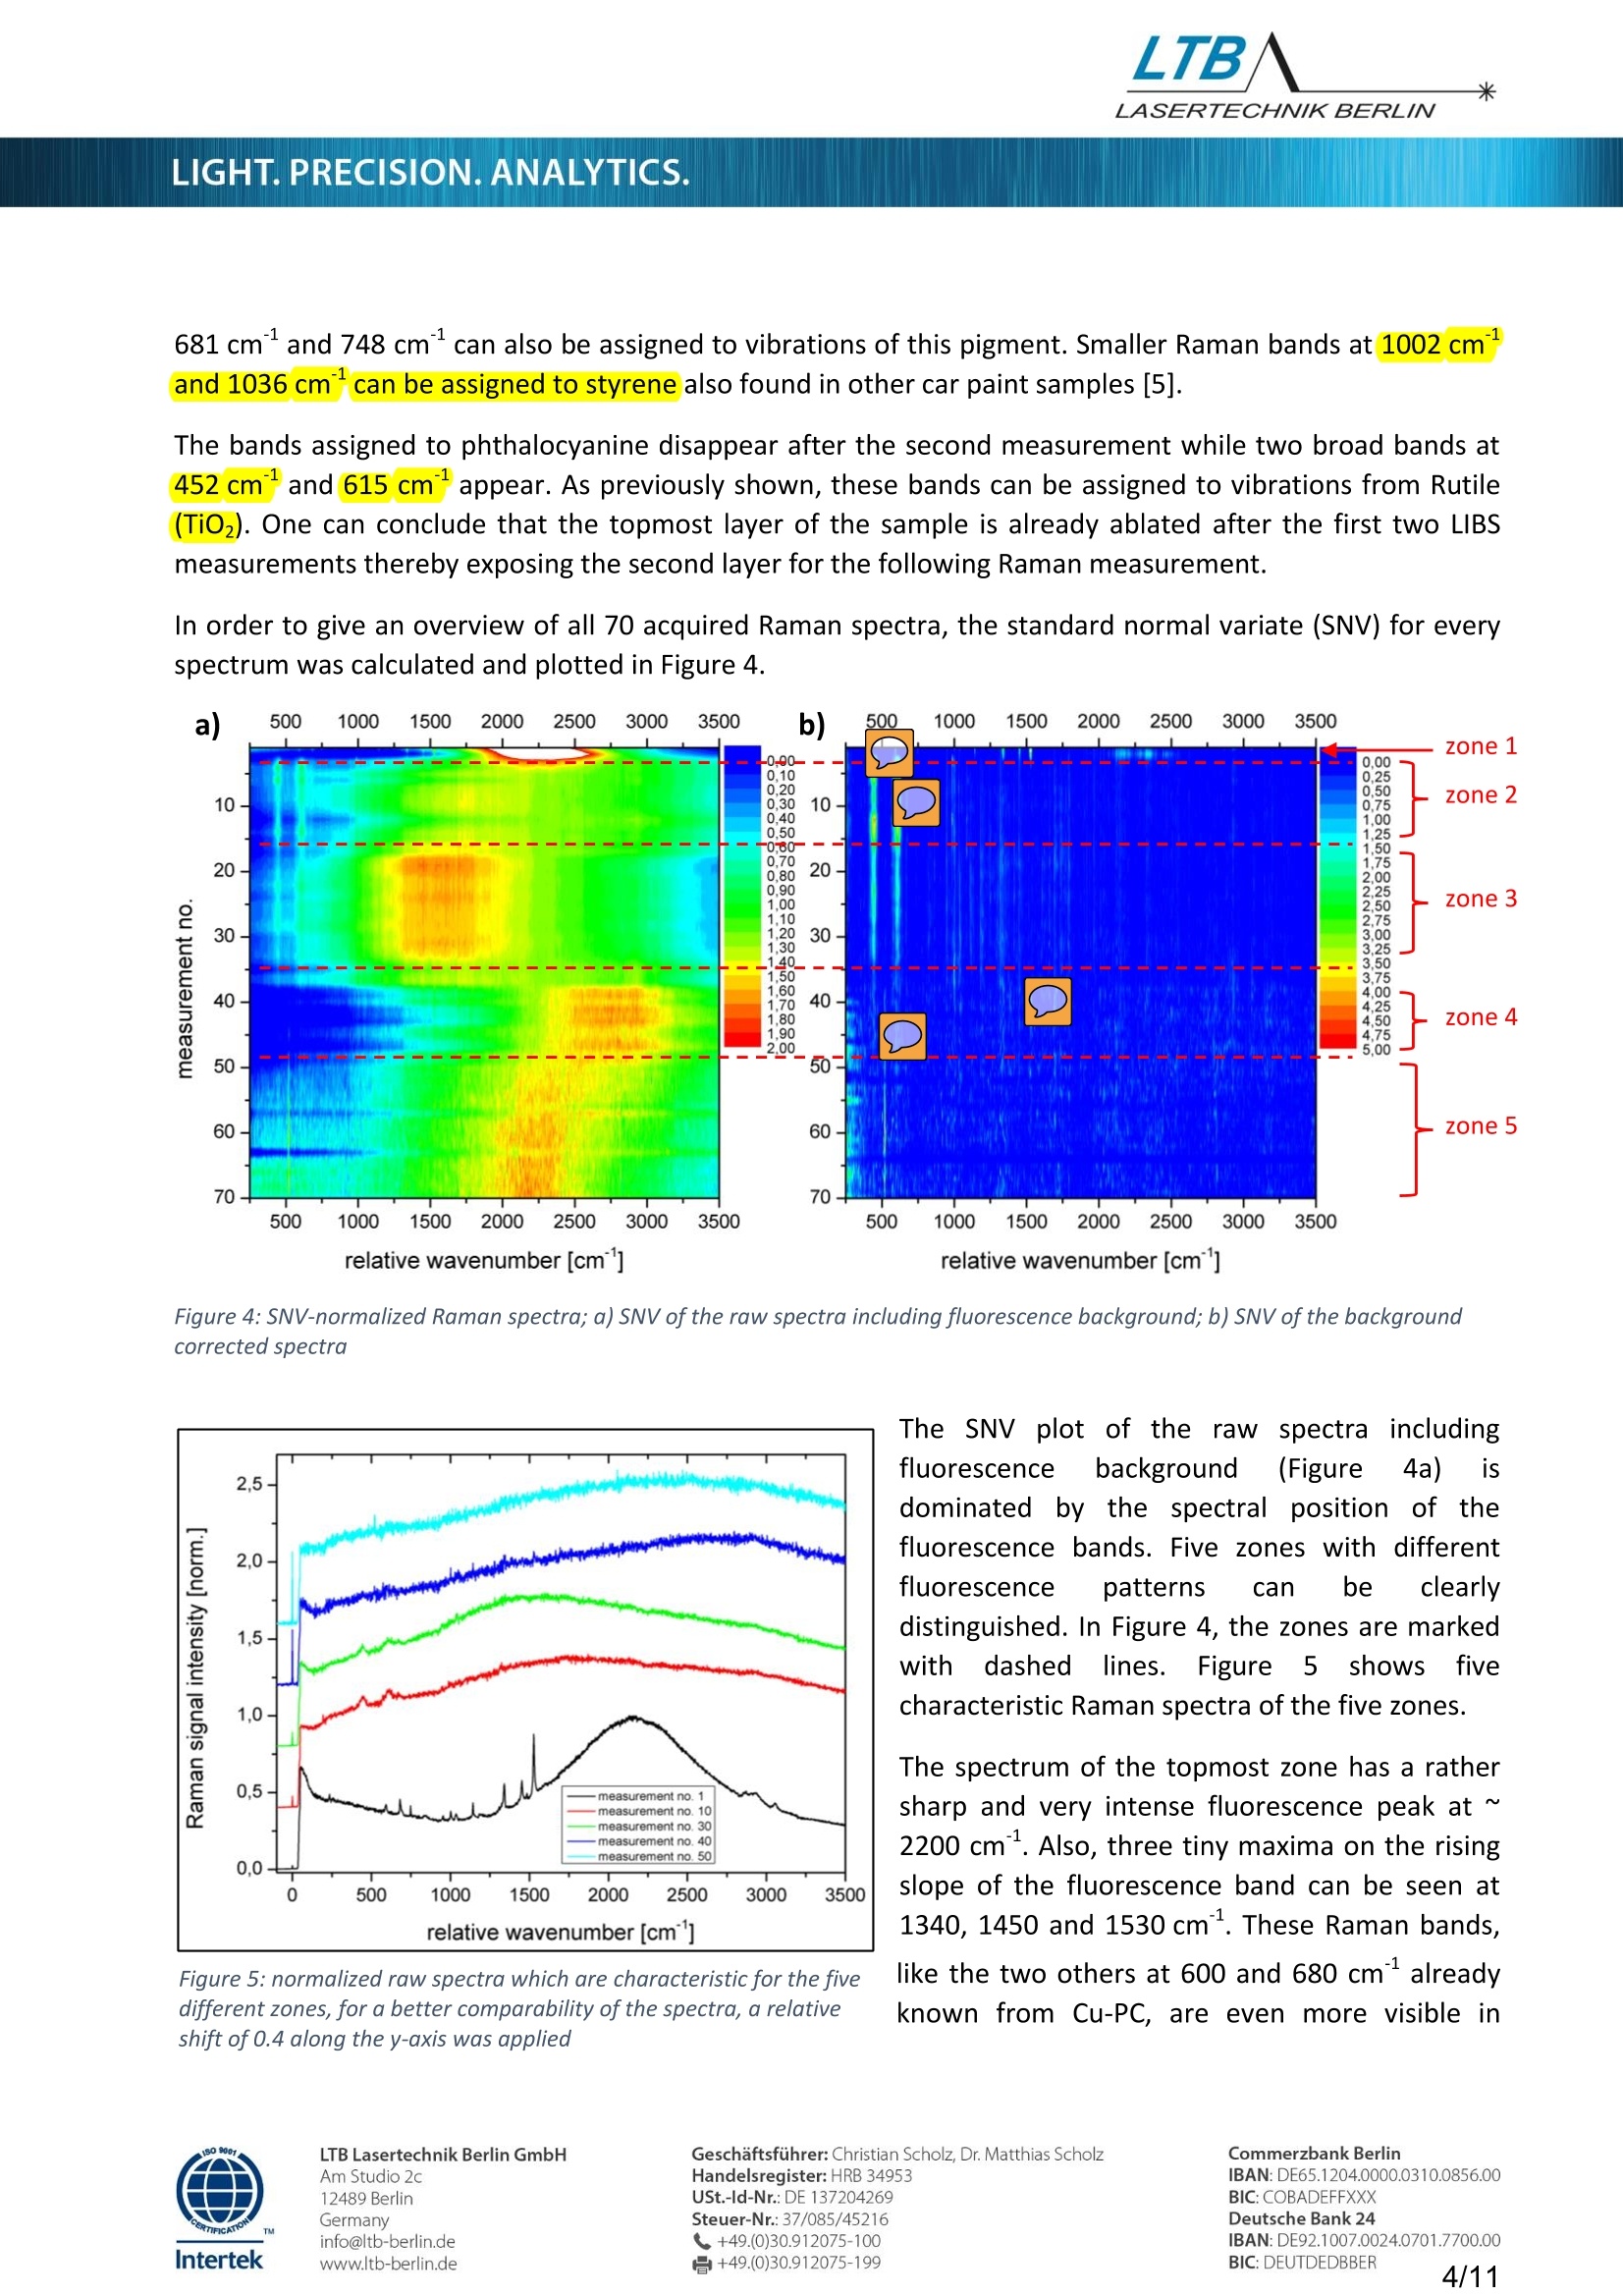
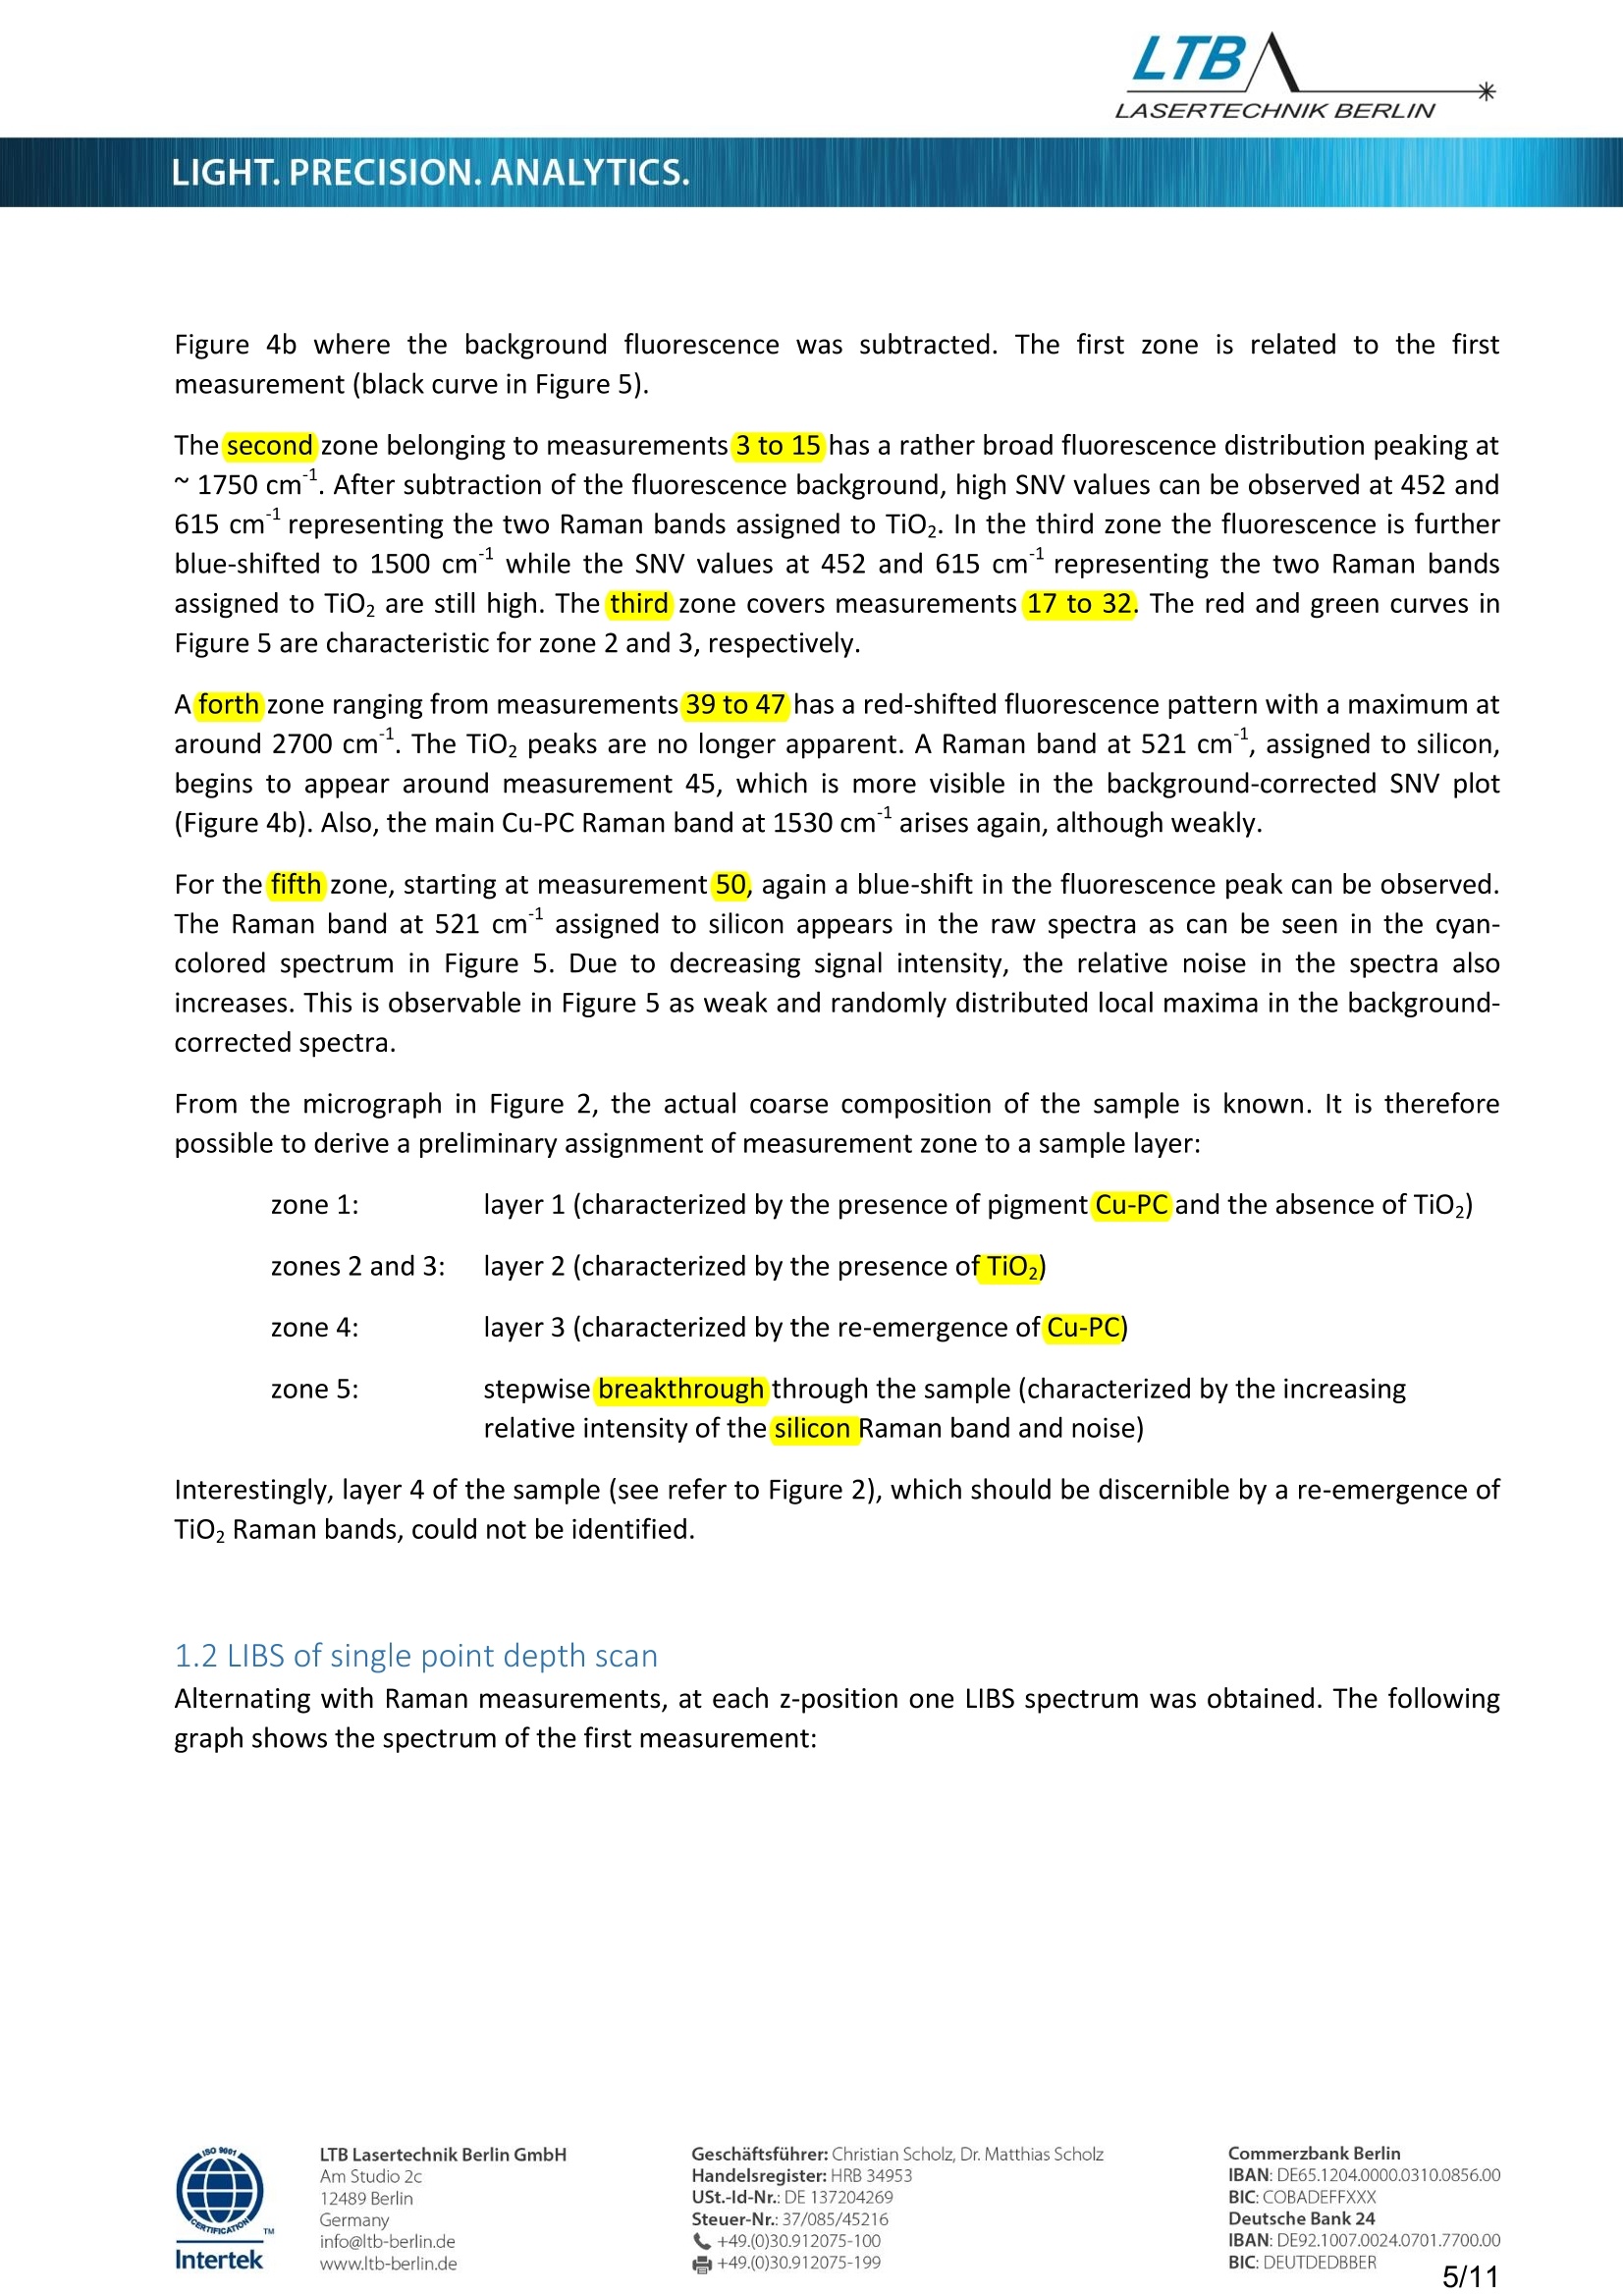
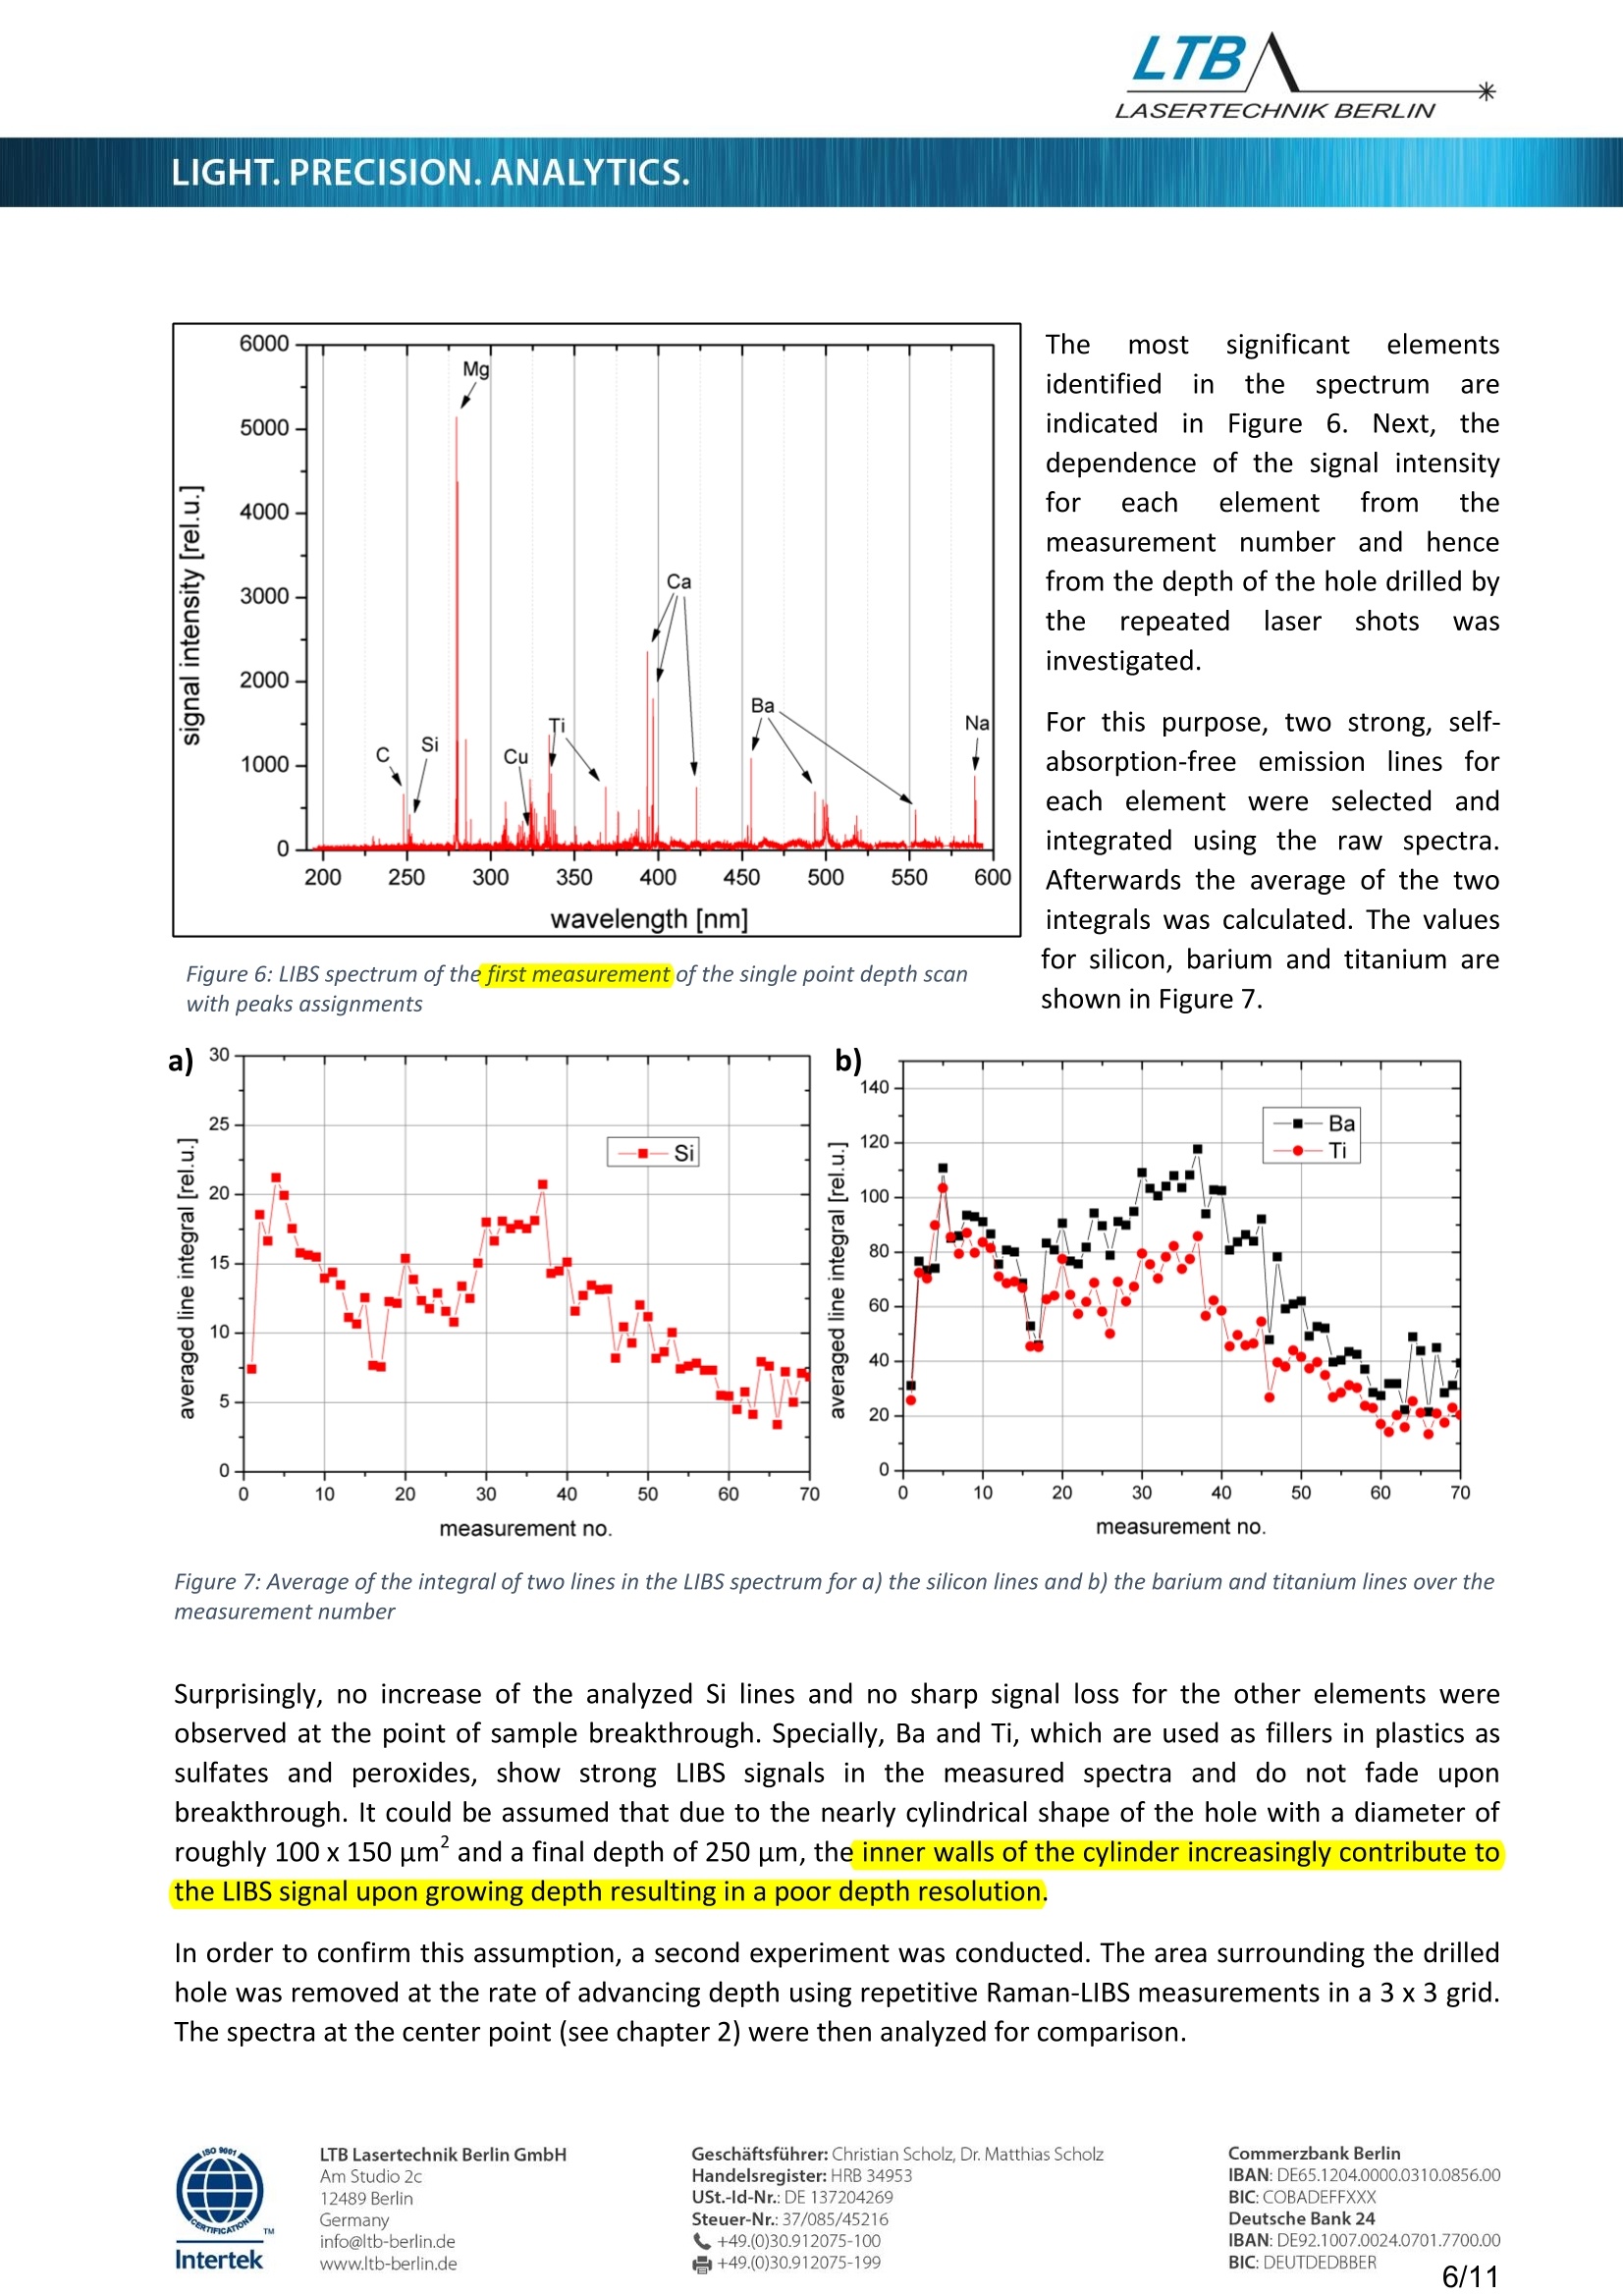
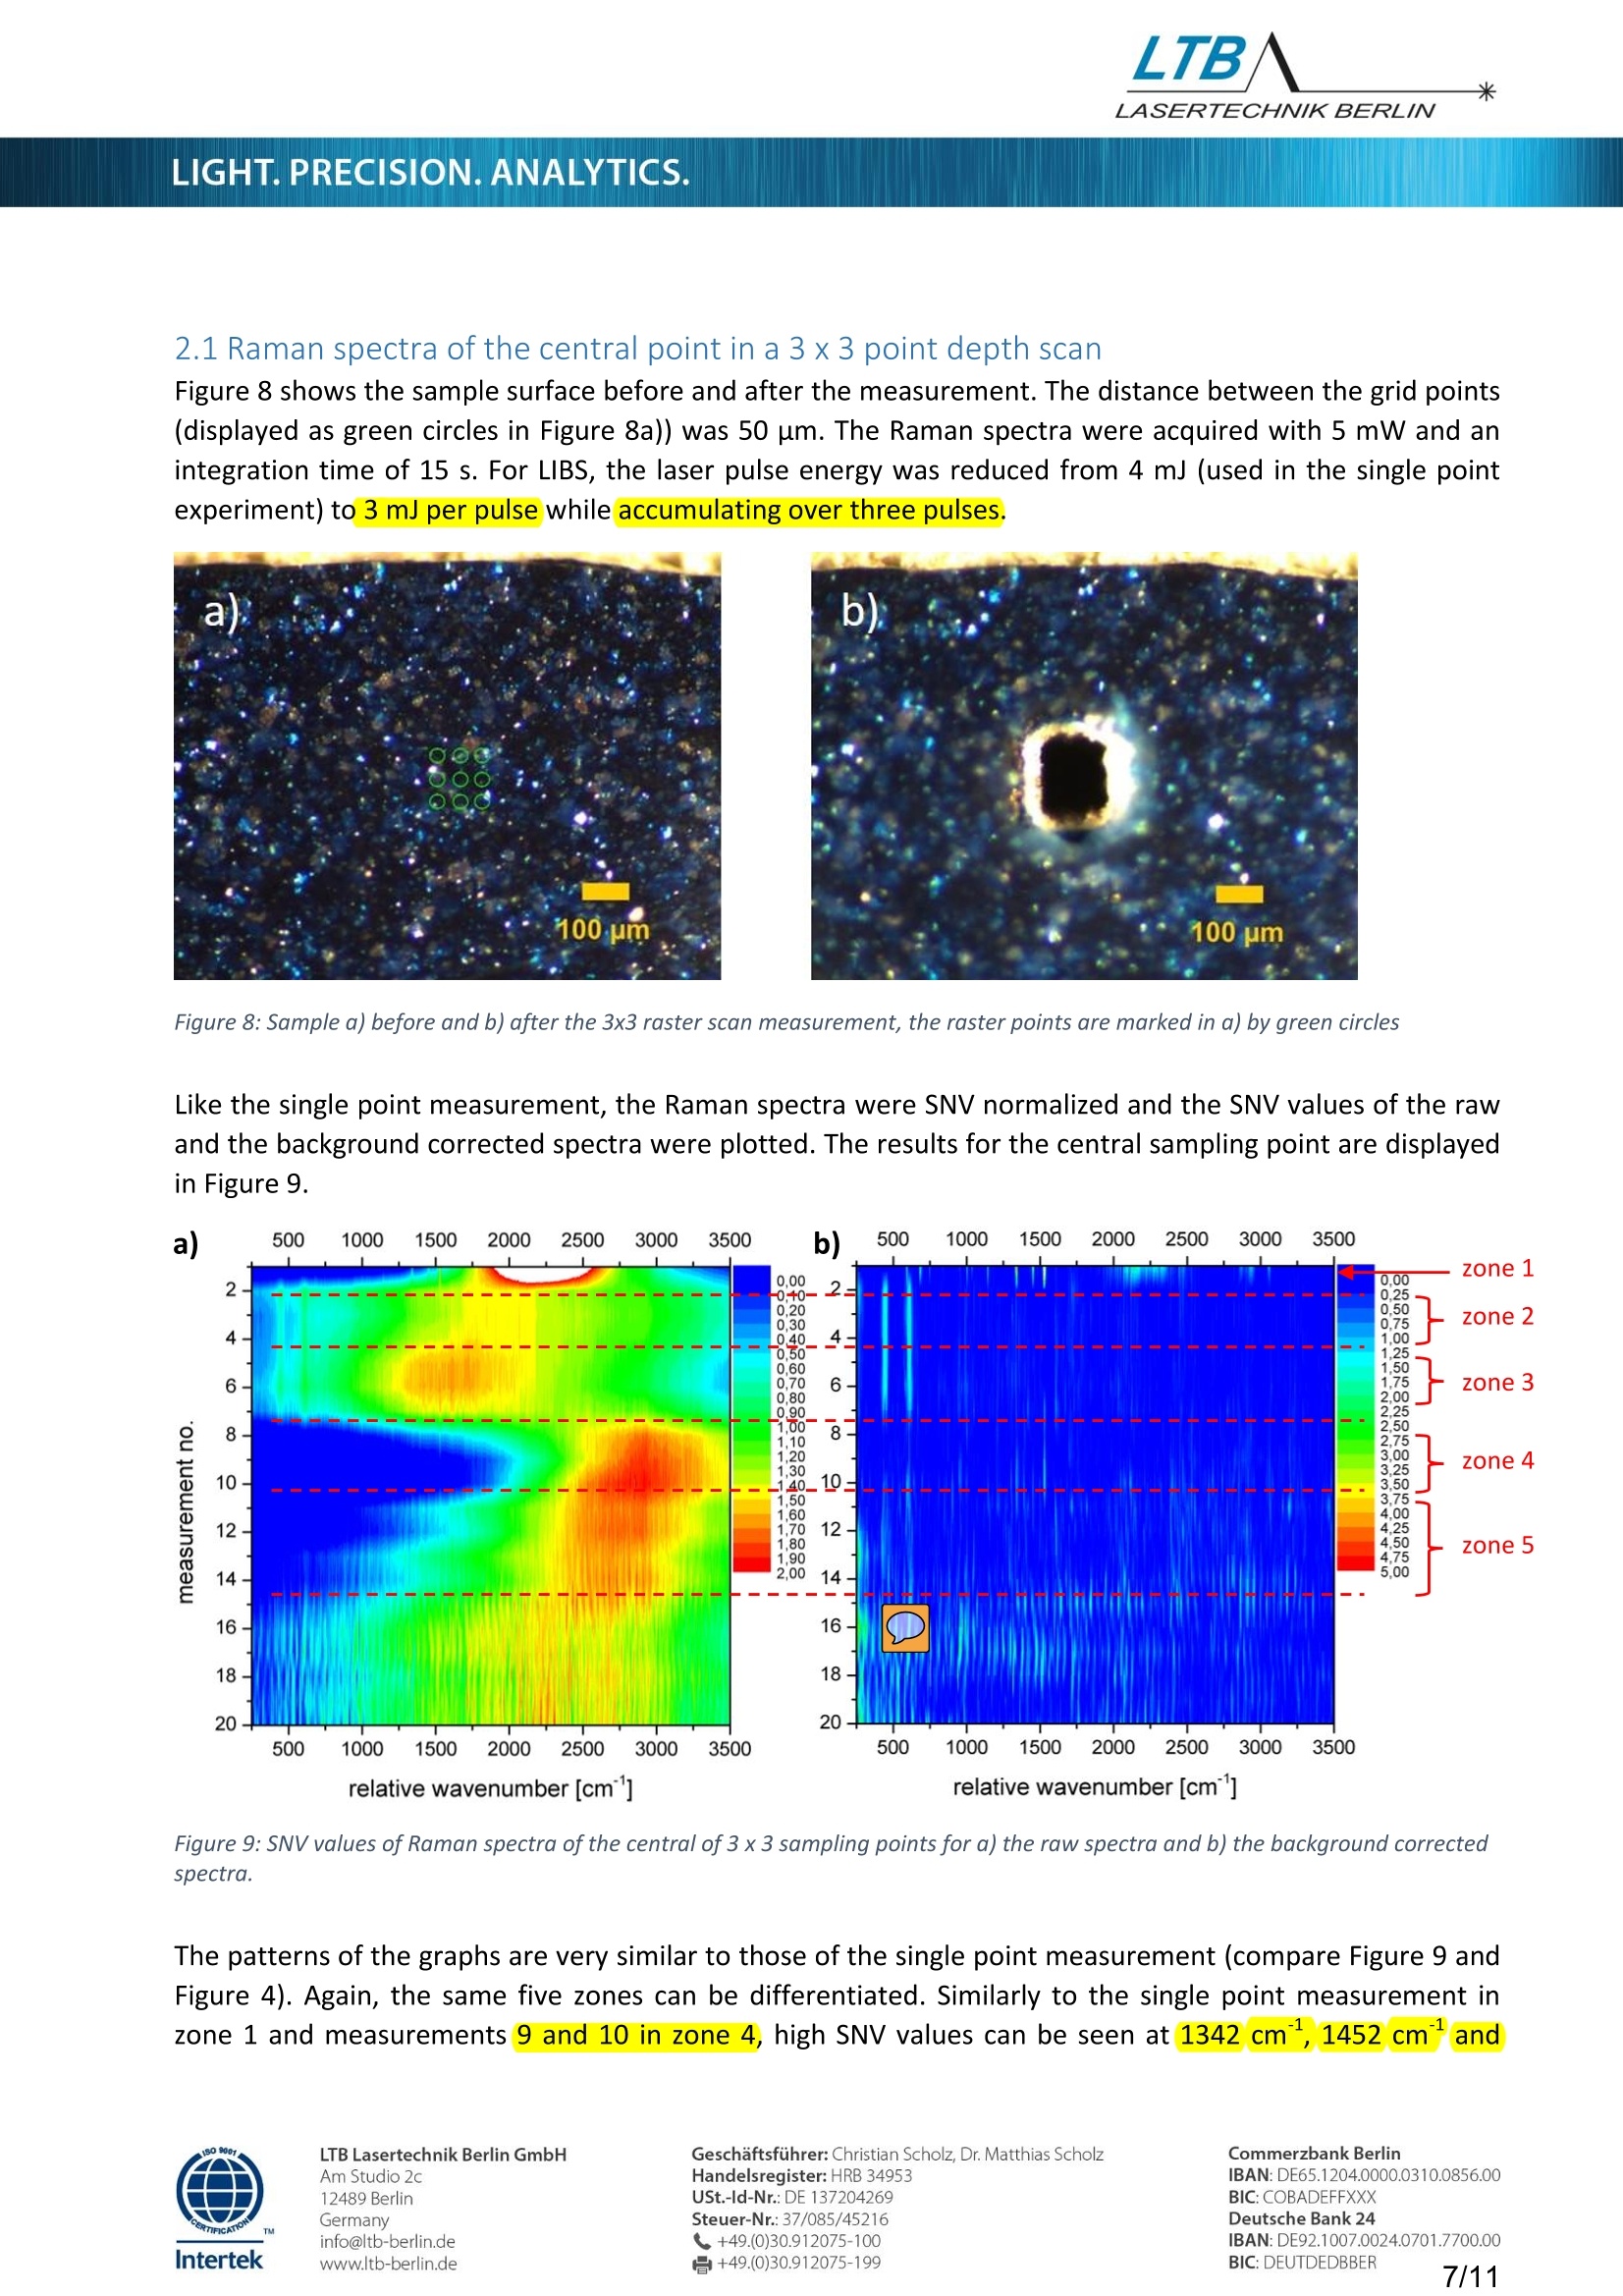
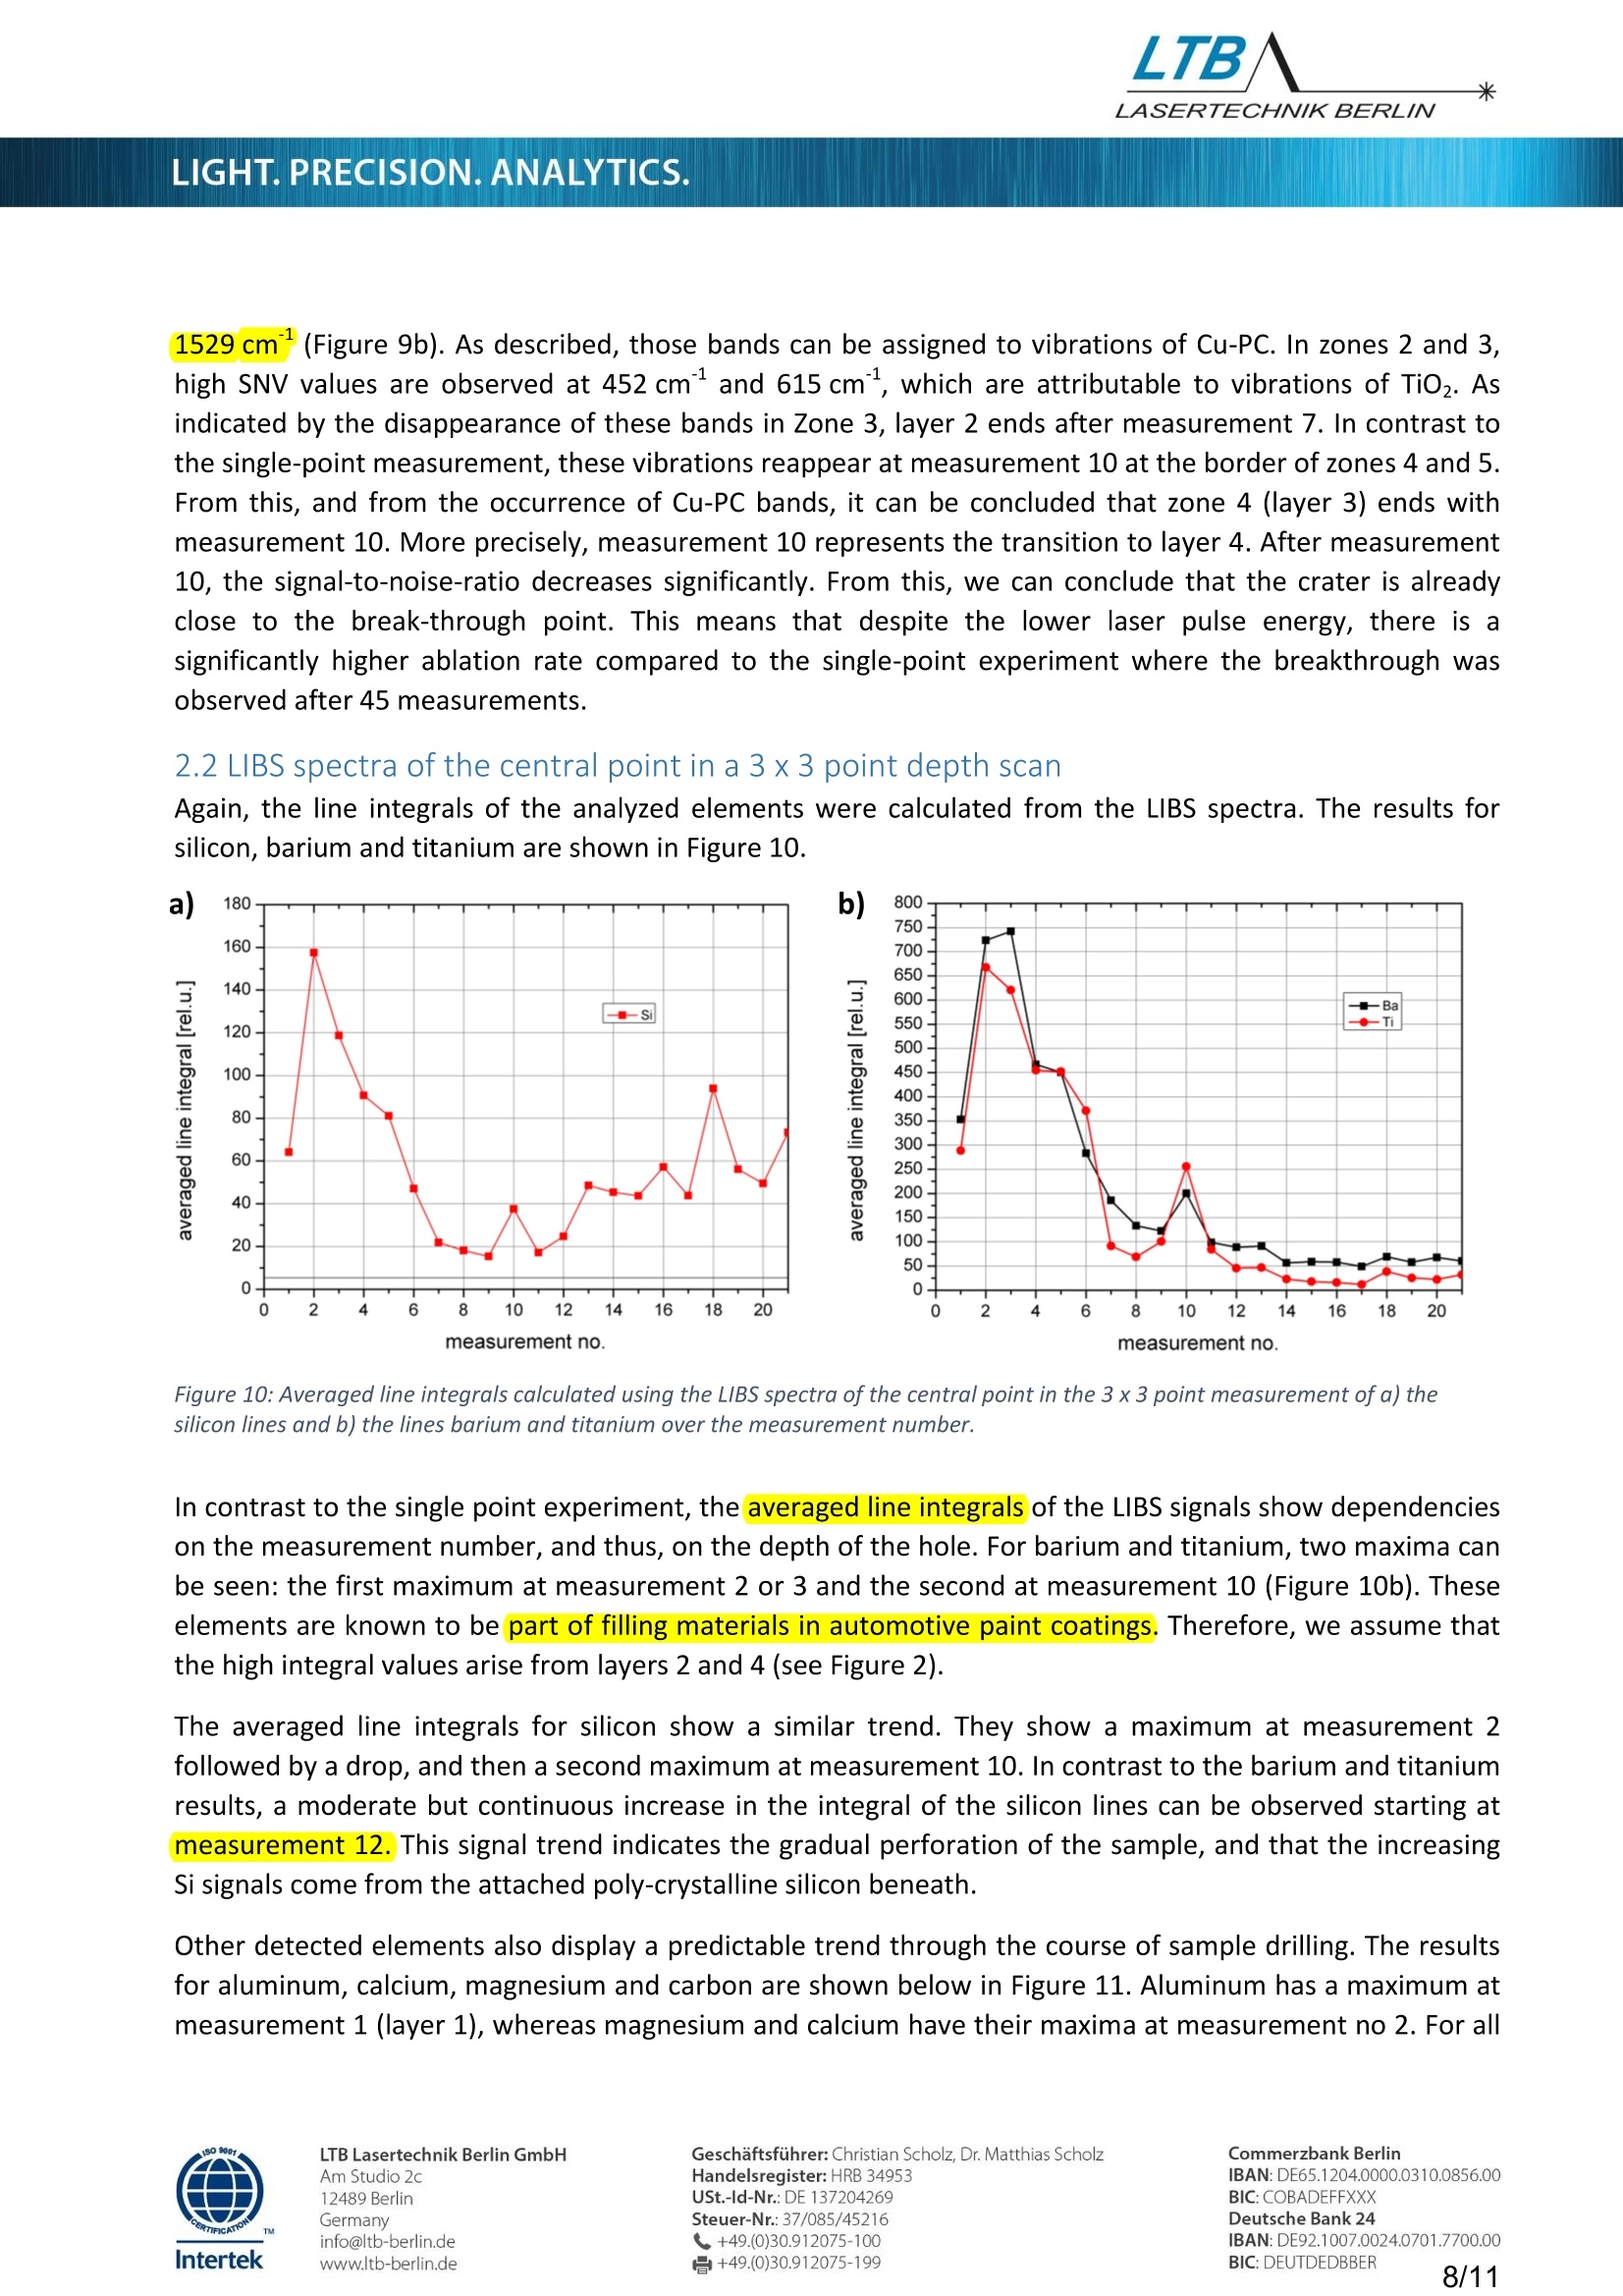
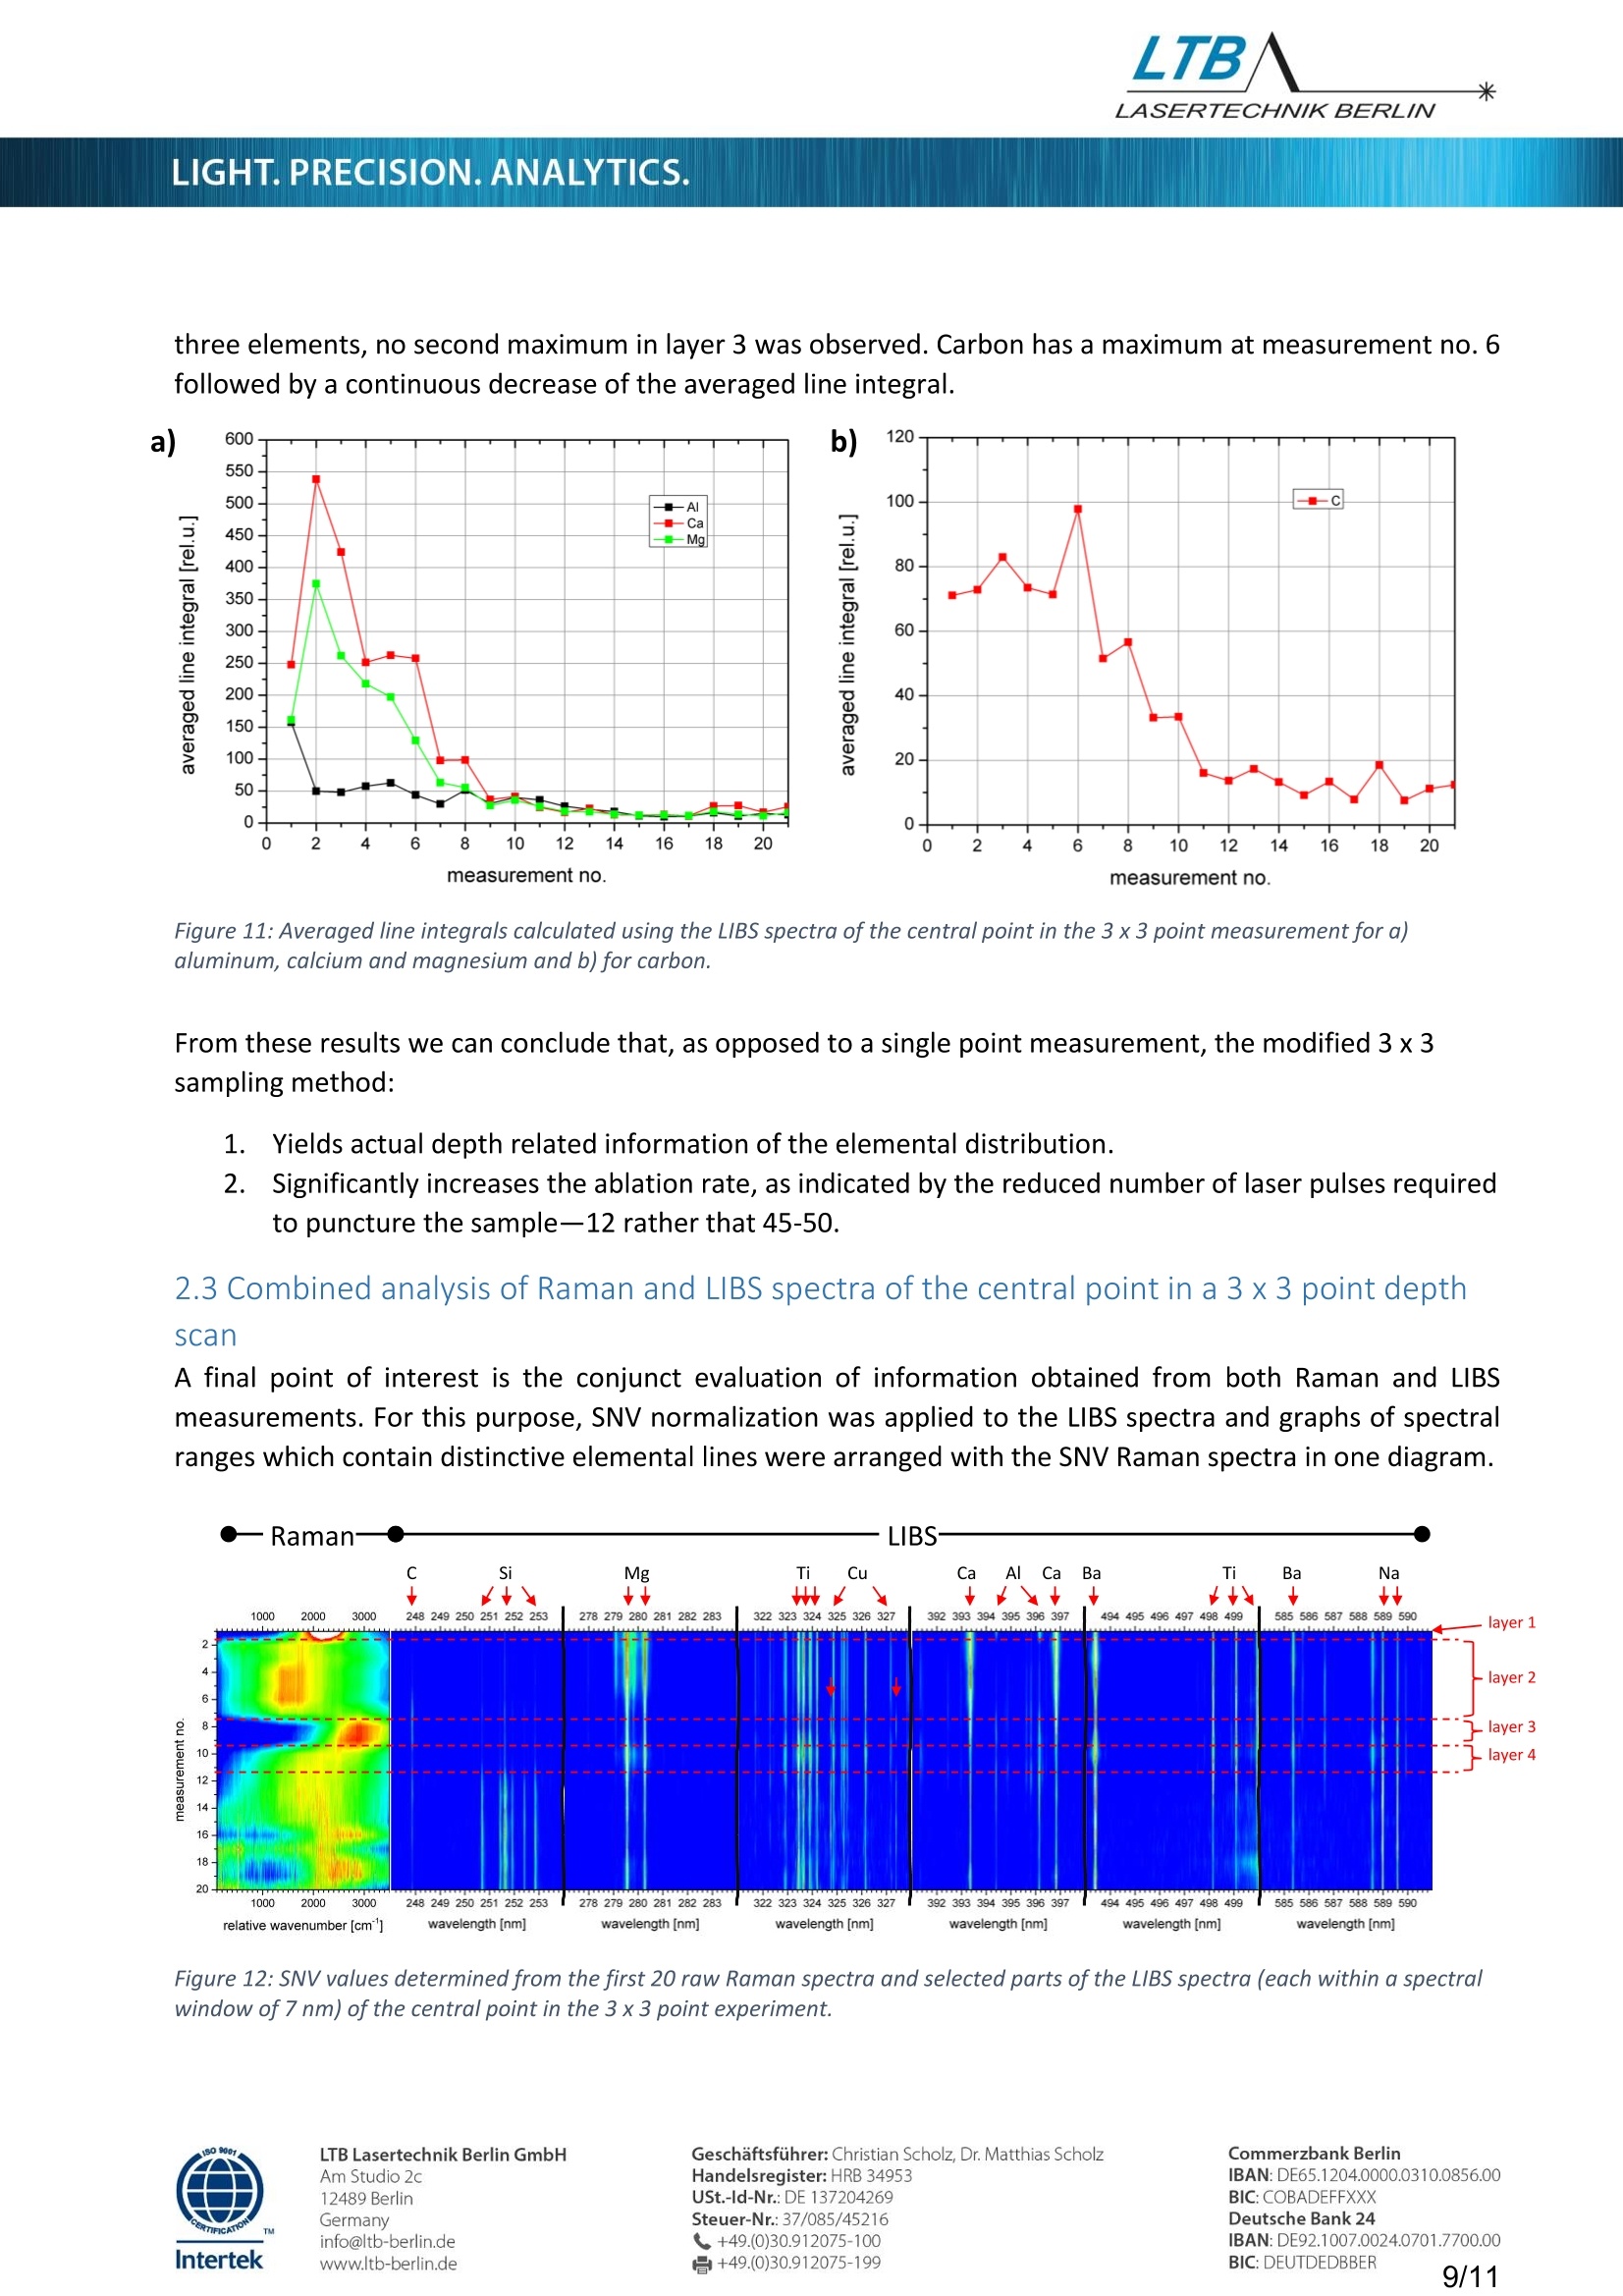
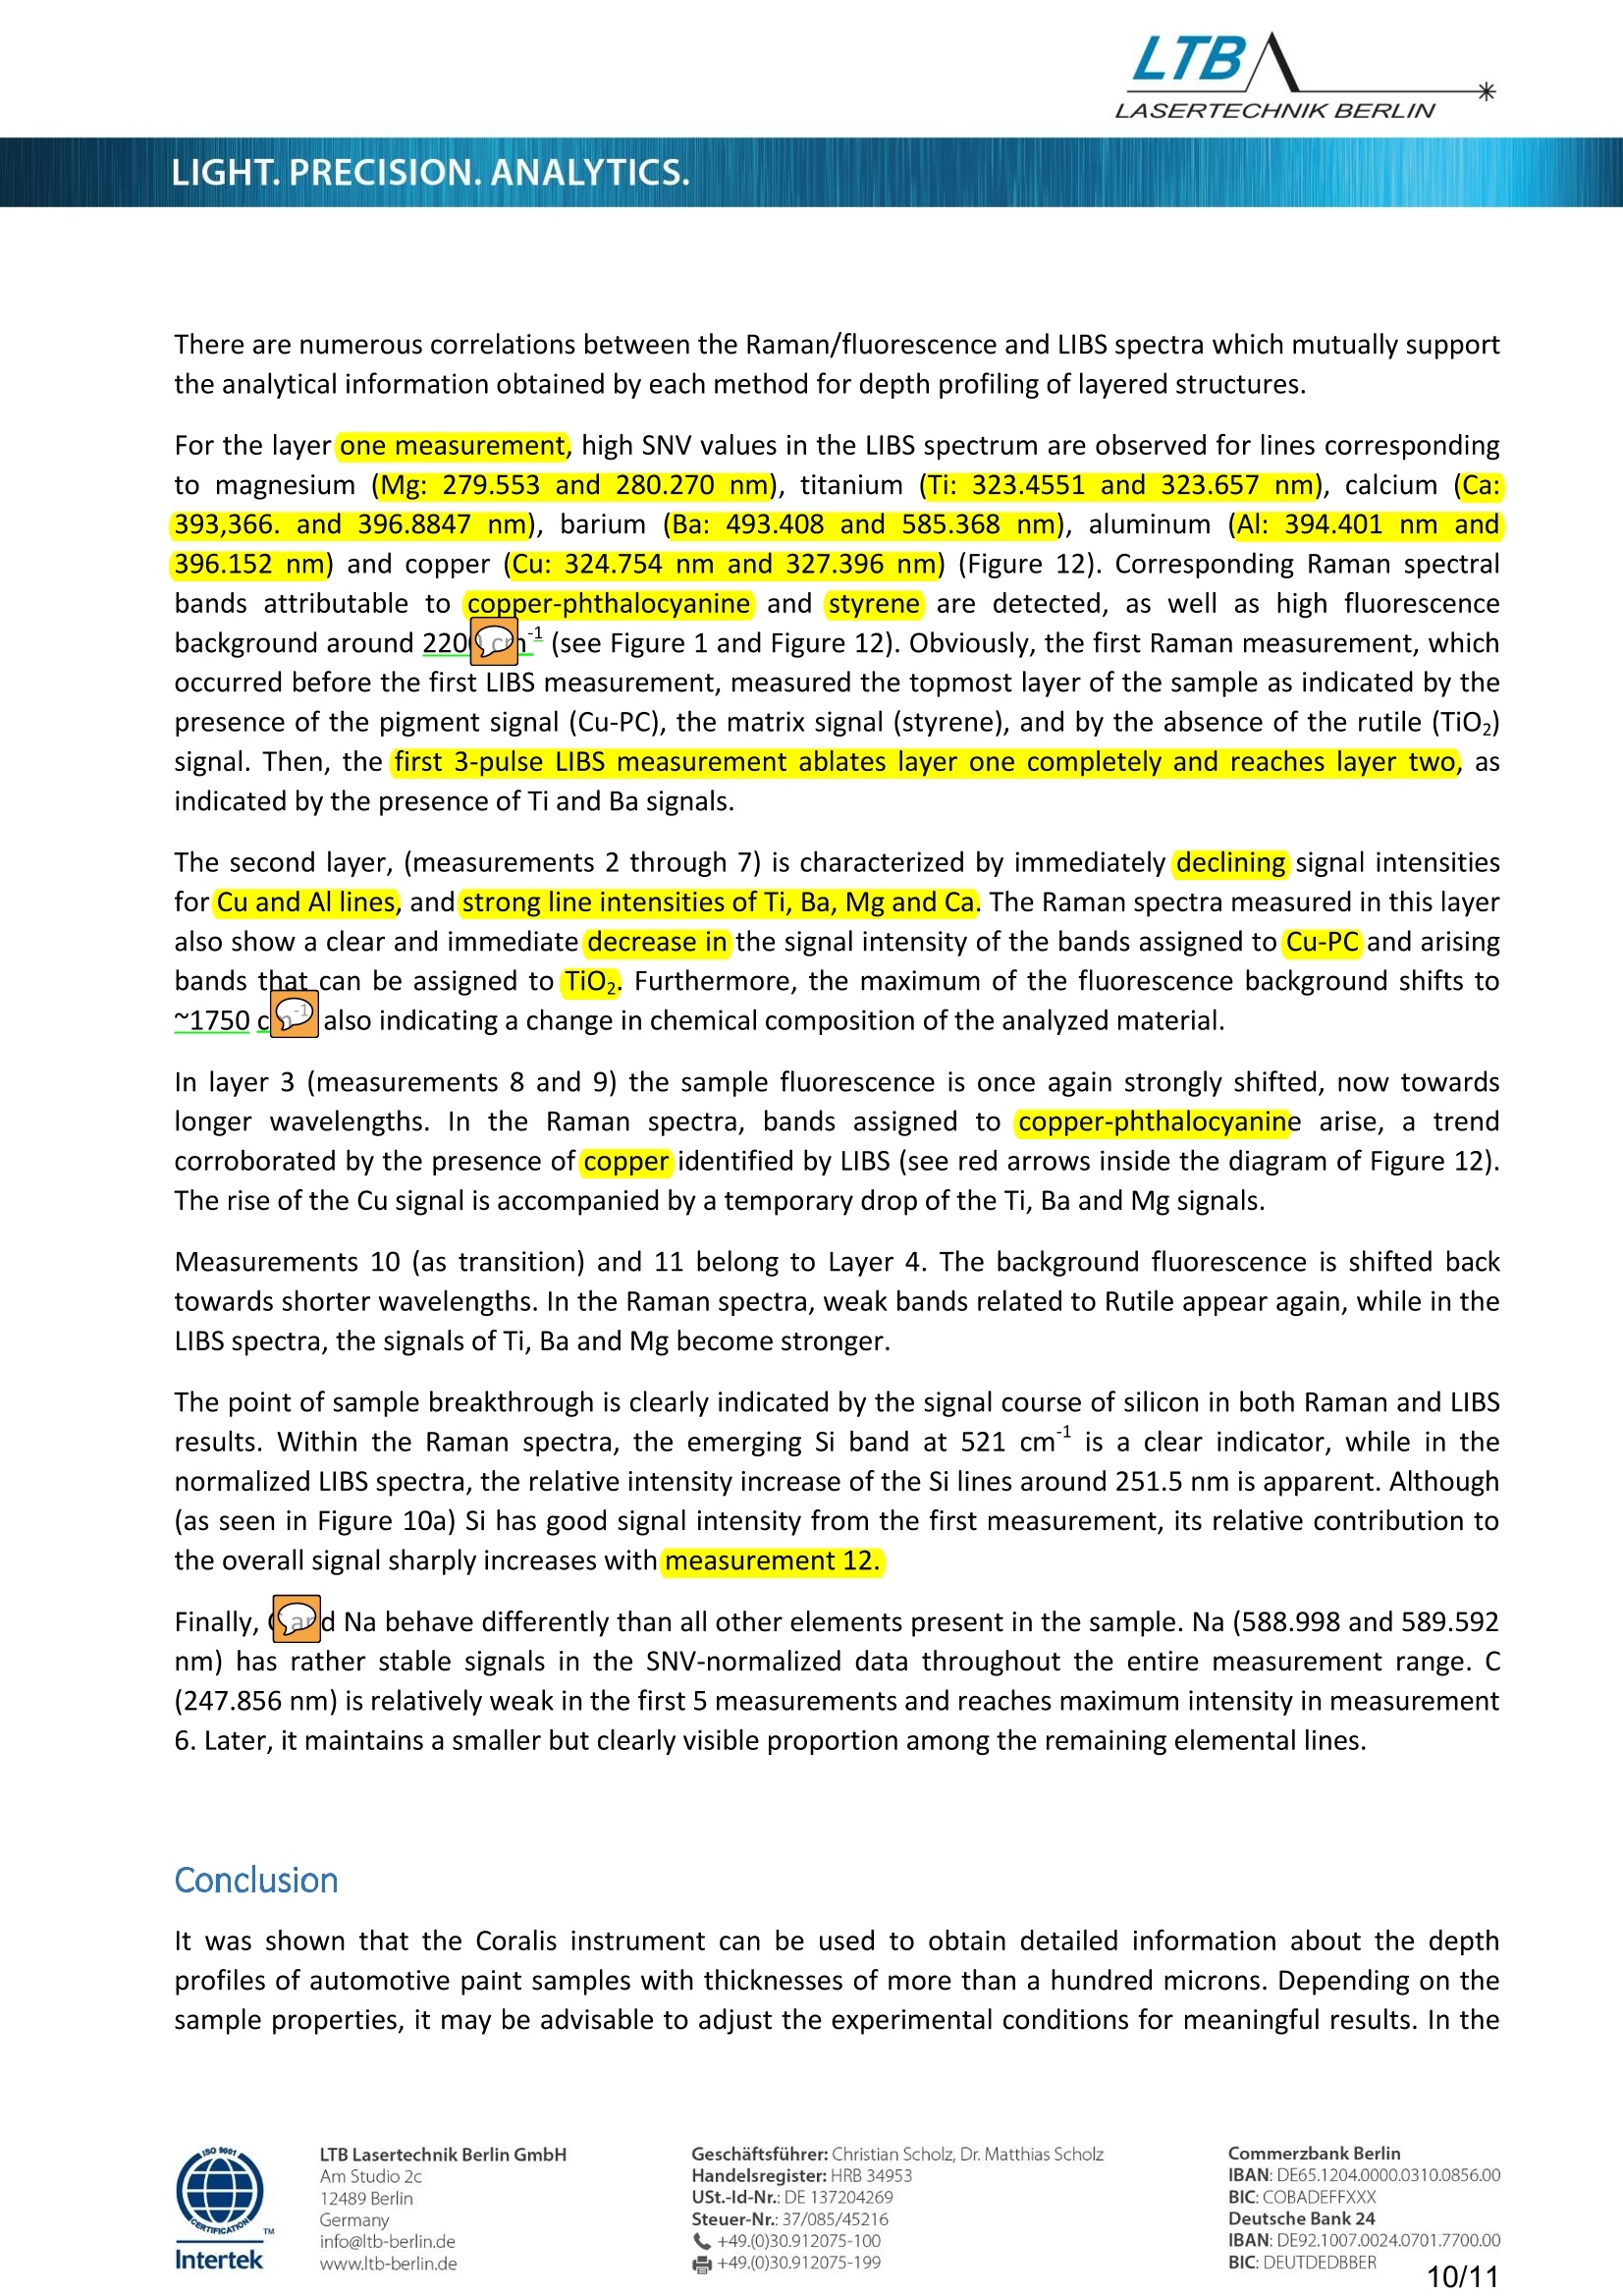
LTB,LASERTECHNIK BERLINLIGHT.PRECISION.ANALYTICS. 米LIGHT.PRECISION.ANALYTICS. Geschaftsfuhrer: Christian Scholz, Dr. Matthias ScholzHandelsregister: HRB 34953USt.-Id-Nr.: DE 137204269Steuer-Nr.: 37/085/45216\+49.(0)30.912075-100号+49.(0)30.912075-199 Application Note - Forensics 2 Depth scans on car paint samples with Raman spectroscopyand LIBS Lutz Pfeifer, Saskia Damaske, Wolfgang Werncke and Virginia MerkLTB Lasertechnik Berlin Introduction The combination of Raman spectroscopy with laser-induced breakdown spectroscopy (LIBS) has theadvantage of coupling two complementary analytical methods: with LIBS it is possible to obtain informationabout the elemental composition of a sample at the examination point, while Raman spectroscopy revealsthe molecular, crystalline or mineralogical structure. Another benefit of combining Raman/LIBSmeasurements is the opportunity to achieve depth information. Namely, characterization of a sample’sconstitutionw hwehn penetrating the surface with repeated laser ablations at the same point. This specifidadvantage of LIBS or Raman/LIBS experiments has already been extensively demonstrated for thin films withthicknesses ranging from 1 um up to 30 um, with examples including the analysis of aluminum layers onsteel[1], the stratigraphic investigation of paint layers[2] and for polymer-coated metals[[E3]. The aim of this technical paper is to demonstrate the suitability of the CORALIS instrument for depthprofiling of forensic samples. Here we focus on investigation of a car paint sample consisting ofseveraldifferent layers with an overall thickness of 250 um. Instrument Measurements were done with the CORALIS instrument -- adevice capable of performing Raman or LIBS measurements on asingle or on a multitude of sampling points. The CORALIS is alsocapable of acquiring consecutive Raman and LIBS spectra and todo this during depth scans of specified sampling points. The CORALIS contains a pulsed Nd:YAG laserr (1064nm)) for LIBSwith variable laser energy and two continuously operating lasersfor Raman(532 and 785 nm). The spot diameter of the laser focuson the sample is appr. 10 um for Raman and 20 um for LIBS. The analysis of Raman spectra can be performed with the integrated, peak finding algorithm, or via spectracomparison using a comprehensive database(KnowltAll", Bio-Rad, USA). Furthermore, varioussbbaselinecorrection methods are also integrated into the software and can be applied to the spectra. For the analysisof LIBS spectra, the software provides an element finding algorithm, spectral classification with PCA and PLS-DA,.andl multivariate quantification methods. LTB Lasertechnik Berlin GmbHGeschaftsfuhrer: Christian Scholz, Dr. Matthias ScholzCommerzbank BerlinAm Studio 2cHandelsregister: HRB 34953IBAN: DE65.1204.0000.0310.0856.0012489 BerlinUSt.-ld-Nr.: DE 137204269BIC:COBADEFFXXXGermanySteuer-Nr.:37/085/45216Deutsche Bank 24info@ltb-berlin.de+49.(0)30.912075-100IBAN:DE92.1007.0024.0701.7700.00Intertekwww.ltb-berlin.de号+49.(0)30.912075-199BIC: DEUTDEDBBER1/11 Material and Methods lnvestigation samples - in this case, paint flecks-were collected on the street from the remnants of autoaccidents. The samples were used as foundwithout any further treatment(e.g. cleaning, grinding orpolishing). An example is shown in Figure 1. This sample was fixed onto a piece of poly-crystalline siliconinorder to determine the point at which the LIBS laser breaks through. Using consecutive Raman and LIBSmeasurements and ablations,, the characteristic Raman band of Si at 521 cm -rshould appear as soon as thesample is fully penetrated. 1 00 um 100 pm Figure 1: Car accident sample (car model: Renault Megane, collected 28.5.2019) top-view before (left) and after (right) a depth scanexperiment, sample thickness is appr. 250 um The side-on view (Figure2) shows the sequence of layers of the sample. On top there is a first dark layer of40 to 50 um thickness; the second layer appears whitish and is about 110 um thick; the third layer againappears dark; and the fourth layer has a yellowish hue. Layers 3 and 4 are about 50 um thick.The overallsample thickness is about 250 um. Figure 2: Breaking edge ofa car paint sample seen from the side Depth scan measurements were performed in the Raman-LIBS mode wherein the sample was measured at asingle point or multiple points first with Raman and then with LIBS. After the LIBS measurement, the samplewas moved upward to compensate for the loss of material before the next Raman measurement. LTB Lasertechnik Berlin GmbHGeschaftsfuhrer: Christian Scholz, Dr. Matthias ScholzCommerzbank BerlinAm Studio 2cHandelsregister: HRB 34953IBAN: DE65.1204.0000.0310.0856.0012489 BerlinUSt.-Id-Nr.: DE 137204269BIC: COBADEFFXXXGermanySteuer-Nr.:37/085/45216Deutsche Bank 24info@ltb-berlin.de\+49.(0)30.912075-100IBAN: DE92.1007.0024.0701.7700.00Intertekwww.ltb-berlin.de+49.(0)30.912075-199BIC: DEUTDEDBBER2/1 In the present case, asstep size of 10 um was chosen between two successive LIBS measurements. Since theablation rate strongly depends on the material properties in the individual layers, it is highly probable thatthe amount of material removed per measurement varies significantly during one depth scan experiment. For Raman measurements, a laser excitation wavelength of 532 nm was chosen. The laser power on thesample was 5 mW. The acquisition time per spectrum was 30 s. Horizontal binning of the detector camerawas set to 4 pixels in order to improve the signal-to-noise ratio. The spectral resolution of the detector forRaman measurements was approximately2.5 cm²11 For LIBS, a laser energy of 4 mJ per pulse was typically used. Three laser pulses were accumulated per LIBSspectrum. The temporal delay for starting signal acquisition after the laser pulse was set to 0.8 ps in order toeffectively exclude the non-specific continuous background signal from the plasma plume. The spectralresolution of the LIBS arm of the spectrometer was in the range of 13 to 35 pm, depending on thewavelength between 190 and 520 nm. The spectra were analyzed by assignment of the Raman bands to potential molecules,and the LIBS emissionlines to elements. To visualize changes between spectra during the depth profile, LIBS line integrals as wellas standard normal variates for the Raman and LIBS spectra were calculated. The standard normal variateswere calculated (SNV) according to the following formula (adapted from [2]): Here, Isnv(x) is the normalized intensity,l(x) is the raw intensity of a spectrum at point x, where x is thewavenumber in the case of Raman spectra and the wavelength in the case of LIBS spectra. Variables u and oare the average and standard deviations of the raw or background corrected intensity spectra, respectively,calculated over the entire spectral range. For background correction of Raman spectra, the method airPLSasdescribed in [4] was used. First, depth scan experiments with 70 cycles ofalternating Raman and LIBS measurements on asingle ipoin:twere performed. Exemplarily, Ramanspectra of the first five measurements are shown inFigure 3. The first spectrum (black) is characterizedby intense Raman bands at 1342 cm, 1452 cm°and1529 cm. As already describedin aa previousApplication Note, by comparing this spectrum withapproximately 25,000 referencespectra of theKnowltAll RamanSpectral Library (Bio-RadLaboratories, Hercules, California, USA) these bandscan beeassigneddto vibrationss ofcopper-phthalocyanine (Cu-PC) which is the major pigment inthis car paint sample. The Raman bands at 594 cm, Geschaftsfuhrer: Christian Scholz, Dr. Matthias Scholz Handelsregister: HRB 34953 USt.-Id-Nr.: DE 137204269 Steuer-Nr.:37/085/45216 \+49.(0)30.912075-100 号+49.(0)30.912075-199 Commerzbank Berlin IBAN: DE65.1204.0000.0310.0856.00 BIC:COBADEFFXXX Deutsche Bank 24 IBAN:DE92.1007.0024.0701.7700.00 BIC: DEUTDEDBBER 3/11 681cm°and 748 cmcan also be assigned to vibrations of this pigment. Smaller Raman bands at 1002 cml-1and 1036 cmcan be assigned to styrenealso found in other car paint samples [5]. The bands assigned to phthalocyanine disappear after the second measurement while two broad bands at452 cmand (615 cmn1appear. As previously shown, these bands can be assigned to vibrations from Rutile(TiO2). One can conclude that the topmost layer of the sample is already ablated after the first two LIBSmeasurements thereby exposing the second layer for the following Raman measurement. In order to give an overview of all 70 acquired Raman spectra, the standard normal variate (SNV) for everyspectrum was calculated and plotted in Figure 4. Figure 4:SNV-normalized Raman spectra; a) SNV of the raw spectra including fluorescence background; b) SNV of the backgroundcorrected spectra Figure 5: normalized raw spectra which are characteristic for the fivedifferent zones, for a better comparability of the spectra, a relativeshift of 0.4 along the y-axis was applied The SNV pplot of the rawV:spectra includingfluorescence background (Figure 4a) ISdominated bby the spectral position of thefluorescence bands. Five zones with differentfluorescence patterns can be clearlydistinguished. In Figure 4, the zones are markedwith dashedlines.FFigure 5 shows fivecharacteristic Raman spectra of the five zones. The spectrum of the topmost zone has a rathersharp and very intense fluorescence peak at ~2200 cm. Also, three tiny maxima on the risingslope of the fluorescence band can be seen at1340, 1450 and 1530 cm. These Raman bands,like the two others at 600 and 680 cmalreadyknown from Cu-PC, are even more visible in Commerzbank Berlin IBAN: DE65.1204.0000.0310.0856.00 BIC: COBADEFFXXX Deutsche Bank 24 IBAN:DE92.1007.0024.0701.7700.00 BIC: DEUTDEDBBER 4/11 Figure 4b where the background fluorescence was subtracted. The first zone is related to the firstmeasurement (black curve in Figure 5). The second zone belonging to measurements 3 to 15 has a rather broad fluorescence distribution peaking at~ 1750 cm. After subtraction of the fluorescence background, high SNV values can be observed at 452 and615 cmrepresenting the two Raman bands assigned to TiO2. In the third zone the fluorescence is furtherblue-shifted to 1500 cmwhile the SNV values at 452 and 615 cmrepresenting the two Raman bandsassigned to TiO2 are still high. The third zone covers measurements.17 to 32..The red and green curves inFigure 5 are characteristic for zone 2 and 3,respectively. Afforth zone ranging from measurements 39 to 47 Ihas a red-shifted fluorescence pattern with a maximum ataround 2700 cm. The TiO peaks are no longer apparent. A Raman band at 521 cm", assigned to silicon,begins to appear around measurement 45, which is more visible in the background-corrected SNV plot(Figure 4b). Also, the main Cu-PC Raman band at 1530 cmarises again, although weakly. For the fifth zone, starting at measurement 50,, again a blue-shift in the fluorescence peak can be observed.The Raman band at 521 cmassigned to silicon appears in the raw spectra as can be seen in the cyan-colored spectrum in Figure 5. Due to decreasing signal intensity, the relative noise in the spectra alsoincreases. This is observable in Figure 5 as weak and randomly distributed local maxima in the background-corrected spectra. From the micrograph in Figure 2, the actual coarse composition of the sample is known. It is thereforepossible to derive a preliminary assignment of measurement zone to a sample layer: zone 1: layer 1 (characterized by the presence of pigment Cu-PC and the absence of TiO2) zones 2 and 3: layer 2 (characterized by the presence of 1TiO2) zone 4: layer 3 (characterized by the re-emergence of Cu-PC) zone 5: stepwisebreakthrough through the sample (characterized by the increasingrelative intensity of the silicon Raman band and noise) Interestingly, layer 4 of the sample (see refer to Figure 2),which should be discernible by a re-emergence ofTiO2 Raman bands, could not be identified. 1.2 LIBS of single point depth scan Alternating with Raman measurements, at each z-position one LIBS spectrum was obtained. The followinggraph shows the spectrum of the first measurement: LTB Lasertechnik Berlin GmbH Am Studio 2c 12489 Berlin Germany info@ltb-berlin.de Intertek www.ltb-berlin.de Commerzbank Berlin IBAN:DE65.1204.0000.0310.0856.00 BIC:COBADEFFXXX Deutsche Bank 24 IBAN:DE92.1007.0024.0701.7700.00 BIC: DEUTDEDBBER 5/11 The most significant elementsidentifiedin thespectrum areindicated in Figure 6. Next,thedependence of the signal intensityfor each element trom11themeasurement number and hencefrom the depth of the hole drilled bytherepeated laser shots wasinvestigated. For this purpose, two strong, self-absorption-free emission lines foreach element were selectedandintegrated using the raw spectra.Afterwards the average of the twointegrals was calculated. The valuesfor silicon, barium and titanium areshown in Figure 7. a) 30- 25 -Si| 20· 15 10- 5 0 0 10 20 30 40 50 60 70 measurement no. Figure 7: Average of the integral of two lines in the LIBS spectrum for a) the silicon lines and b) the barium and titanium lines over themeasurement number Surprisingly, no increase of the analyzed Si lines and no sharp signal loss for the other elements wereobserved at the point of sample breakthrough. Specially, Ba and Ti, which are used as fillers in plastics assulfates and peroxides, show strong LIBS signals in the measured spectra and do not fade uponbreakthrough. It could be assumed that due to the nearly cylindrical shape of the hole with a diameter ofroughly 100 x 150 umand a final depth of 250 um, the inner walls of the cylinder increasingly contribute tothe LIBS signal upon growing depth resulting in a poor depth resolution. In order to confirm this assumption, a second experiment was conducted. The area surrounding the drilledhole was removed at the rate of advancing depth using repetitive Raman-LIBS measurements in a 3 x3 grid.The spectra at the center point (see chapter 2) were then analyzed for comparison. LTB Lasertechnik Berlin GmbHGeschaftsfuhrer: Christian Scholz, Dr. Matthias ScholzCommerzbank BerlinAm Studio 2cHandelsregister: HRB 34953IBAN: DE65.1204.0000.0310.0856.0012489 BerlinUSt.-ld-Nr.: DE 137204269BIC: COBADEFFXXXGermanySteuer-Nr.:37/085/45216Deutsche Bank 24info@ltb-berlin.de+49.(0)30.912075-100IBAN:DE92.1007.0024.0701.7700.00Intertekwww.ltb-berlin.de号+49.(0)30.912075-199BIC: DEUTDEDBBER6/11 2.1 Raman spectra of the central point in a 3 x 3 point depth scan Figure 8 shows the sample surface before and after the measurement.The distance between the grid points(displayed as green circles in Figure 8a)) was 50 um. The Raman spectra were acquired with 5 mW and anintegration time of 15 s. For LIBS, the laser pulse energy was reduced from 4 mJ (used in the single pointexperiment) to 3 mJ per pulseewhilealccumulating over three pulses. Figure 8: Sample a) before and b) after the 3x3 raster scan measurement, the raster points are marked in a) by green circles Like the single point measurement, the Raman spectra were SNV normalized and the SNV values of the rawand the background corrected spectra were plotted. The results for the central sampling point are displayedin Figure 9. Figure 9:SNV values of Raman spectra of the central of 3 x3 sampling points for a) the raw spectra and b) the background correctedspectra. The patterns of the graphs are very similar to those of the single point measurement (compare Figure 9 andFigure 4). Again, the same five zones can be differentiated. Similarly to the single point measurement inzone 1 and measurementss9and10 in zone 44,lhigh SNV values can be seen at 13422 cm 1452 cmand LTB Lasertechnik Berlin GmbHGeschaftsfuhrer: Christian Scholz, Dr. Matthias ScholzCommerzbank BerlinAm Studio 2cHandelsregister: HRB 34953IBAN: DE65.1204.0000.0310.0856.0012489 BerlinUSt.-Id-Nr.:DE 137204269BIC:COBADEFFXXXGermanySteuer-Nr.:37/085/45216Deutsche Bank 24info@ltb-berlin.de\+49.(0)30.912075-100IBAN:DE92.1007.0024.0701.7700.00Intertekwww.ltb-berlin.de号+49.(0)30.912075-199. BIC: DEUTDEDBBER7/11 1529 cm(Figure 9b). As described, those bands can be assigned to vibrations of Cu-PC. In zones 2 and 3,high SNV values are observed at 452 cm° and 615 cm, which are attributable to vibrations of TiO2. Asindicated by the disappearance of these bands in Zone 3, layer 2 ends after measurement 7. In contrast tothe single-point measurement, these vibrations reappear at measurement 10 at the border of zones 4 and 5.From this, and from the occurrence of Cu-PC bands, it can be concluded that zone 4 (layer 3) ends withmeasurement 10. More precisely, measurement 10 represents the transition to layer 4. After measurement10, the signal-to-noise-ratio decreases significantly. From this, we can conclude that the crater is alreadyclose to the break-through point. This means that despite the lower laser pulse energy, there is asignificantly higher ablation rate compared to the single-point experiment where the breakthrough wasobserved after 45 measurements. 2.2 LIBS spectra of the central point in a 3 x 3 point depth scan Again, the line integrals of the analyzed elements were calculated from the LIBS spectra. The results forsilicon, barium and titanium are shown in Figure 10. Figure 10: Averaged line integrals calculated using the LIBS spectra of the central point in the 3 x 3 point measurement of a) thesilicon lines and b) the lines barium and titanium over the measurement number. In contrast to the single point experiment, the averaged line integrals of the LIBS signals show dependencieson the measurement number, and thus, on the depth of the hole. For barium and titanium, two maxima canbe seen: the first maximum at measurement 2 or 3 and the second at measurement 10 (Figure 10b). Theseelements are known to be: part of filling materials in automotive paint coatings.Therefore, we assume thatthe high integral values arise from layers 2 and 4 (see Figure 2) The averaged line integrals for silicon show a similar trend. They show a maximum at measurement 2followed by a drop, and then a second maximum at measurement 10. In contrast to the barium and titaniumresults, a moderate but continuous increase in the integral of the silicon lines can be observed starting atmeasurement 12. This signal trend indicates the gradual perforation of the sample, and that the increasingSi signals come from the attached poly-crystalline silicon beneath. Other detected elements also display a predictable trend through the course of sample drilling. The resultsfor aluminum, calcium, magnesium and carbon are shown below in Figure 11. Aluminum has a maximum atmeasurement 1 (layer 1), whereas magnesium and calcium have their maxima at measurement no 2. For all LTB Lasertechnik Berlin GmbHGeschaftsfuhrer: Christian Scholz, Dr. Matthias ScholzCommerzbank BerlinAm Studio 2cHandelsregister: HRB 34953IBAN: DE65.1204.0000.0310.0856.0012489 BerlinUSt.-Id-Nr.: DE 137204269BIC:COBADEFFXXXGermanySteuer-Nr.:37/085/45216Deutsche Bank 24info@ltb-berlin.de+49.(0)30.912075-100IBAN:DE92.1007.0024.0701.7700.00Intertekwww.ltb-berlin.de号+49.(0)30.912075-199BIC:DEUTDEDBBER8/11 three elements, no second maximum in layer 3 was observed. Carbon has a maximum at measurement no. 6followed by a continuous decrease of the averaged line integral. Figure 11: Averaged line integrals calculated using the LIBS spectra of the central point in the 3 x3 point measurement for a)aluminum, calcium and magnesium and b)for carbon. From these results we can conclude that, as opposed to a single point measurement, the modified 3 x 3sampling method: 1. Yields actual depth related information of the elemental distribution. 2. SSignificantly increases the ablation rate, as indicated by the reduced number of laser pulses requiredto puncture the sample-12 rather that 45-50. 2.3 Combined analysis of Raman and LIBS spectra of the central point in a 3 x 3 point depthscan A final point of interest is the conjunct evaluation of information obtained from both Raman and LIBSmeasurements. For this purpose, SNV normalization was applied to the LIBS spectra and graphs of spectralranges which contain distinctive elemental lines were arranged with the SNV Raman spectra in one diagram. Figure 12: SNV values determined from the first 20 raw Raman spectra and selected parts of the LIBS spectra (each within a spectralwindow of7 nm) of the central point in the 3 x3 point experiment. LTB Lasertechnik Berlin GmbHGeschaftsfuhrer: Christian Scholz, Dr. Matthias ScholzCommerzbank BerlinAm Studio 2cHandelsregister: HRB 34953IBAN: DE65.1204.0000.0310.0856.0012489 BerlinUSt.-Id-Nr.: DE 137204269BIC:COBADEFFXXXGermanySteuer-Nr.:37/085/45216Deutsche Bank 24info@ltb-berlin.de\+49.(0)30.912075-100IBAN: DE92.1007.0024.0701.7700.00Intertekwww.ltb-berlin.de号+49.(0)30.912075-199BIC:DEUTDEDBBER9/11 There are numerous correlations between the Raman/fluorescence and LIBS spectra which mutually supportthe analytical information obtained by each method for depth profiling of layered structures. For the layer one measurement,, high SNV values in the LIBS spectrum are observed for lines correspondingto magnesium(Mg: 279.553 and 280.270 nm), titanium(Ti: 323.4551 and 323.657 nm), calcium(Ca:393,366. and 3396.8847 nm),barium(Ba: 493.408 and !585.368) nm), aluminum (AI:394.401 nm and396.152 nmh)and copperr(Cu: 324.754 nm and 327.396 nmn)(Figure 12). Corresponding Raman spectralbands attributable tocopper-phthalocyanineandstyreneare detected, as well as high fluorescencebackground around 220 (see Figure 1 and Figure 12). Obviously, the first Raman measurement, whichoccurred before the first LIBS measurement, measured the topmost layer of the sample as indicated by thepresence of the pigment signal (Cu-PC), the matrix signal (styrene), and by the absence of the rutile (TiO2)signal. Then, the fifirst 3-pulse LIBS measurement ablates layer one completelyand reaches; layer two,asindicated by the presence of Ti and Ba signals. The second layer, (measurements 2 through 7) is characterized by immediatelyr declining signal intensitiesfor Cu and Al lines, andd strong line intensities of Ti, Ba, Mg and Ca. The Raman spectra measured in this layeralso show a clear and immediate decrease in the signal intensity of the bands assigned tobCou-PC and arisingbands that can be assigned toTiO2.Furthermore, the maximum of the fluorescence background shifts to~1750 c also indicating a change in chemical composition of the analyzed material. ln layer 3 (measurements 8 and 9) the sample fluorescence is once again strongly shifted, now towardslonger wavelengths. In the Raman spectra, bands assigned tocopper-phthalocyanine arise, a trendcorroborated by the presence of copper identified by LIBS (see red arrows inside the diagram of Figure 12).The rise of the Cu signal is accompanied by a temporary drop of the Ti, Ba and Mg signals. Measurements 10 (as transition) and 11 belong to Layer 4. The background fluorescence is shifted backtowards shorter wavelengths. In the Raman spectra,weak bands related to Rutile appear again,while in theLIBS spectra,the signals of Ti, Ba and Mg become stronger. The point of sample breakthrough is clearly indicated by the signal course of silicon in both Raman and LIBSresults. Within the Raman spectra, the emerging Si band at 521 cmis a clear indicator, while in thenormalized LIBS spectra, the relative intensity increase of the Si lines around 251.5 nm is apparent. Although(as seen in Figure 10a) Si has good signal intensity from the first measurement, its relative contribution tothe overall signal sharply increases with rmeasurement 12. Finally, d Na behave differently than all other elements present in the sample. Na (588.998 and 589.592nm) has rather stable signals in the SNV-normalized data throughout the entire measurement range. C(247.856 nm) is relatively weak in the first 5 measurements and reaches maximum intensity in measurement6. Later, it maintains a smaller but clearly visible proportion among the remaining elemental lines. Conclusion lt was shown that the Coralis instrument can be used to obtain detailed information about the depthprofiles of automotive paint samples with thicknesses of more than a hundred microns. Depending on thesample properties, it may be advisable to adjust the experimental conditions for meaningful results. In the presented case, when drilling a hole at a single sample point, only Raman spectra produced depth-resolvedresults. Due to an unfavorable ratio of crater diameter and depth, the LIBS plasma plume continuouslyablated material from the walls of the developing crater, blurring the depth dependence of the individualelements. By alsoablating the immediate surrounding area of the desired sample point, as done in the 3 by 3measurement,LIBS produces information indicating the distribution of different elements depending on thedepth. However, even in this arrangement, there is still a minor contribution from the inner walls of thedeveloping crater. This can be seen by the not completely disappearing signals of most of the detectableelements. In all cases, placing the sample on a substrate whose Raman and LIBS spectra explicitly differsfrom that of the sample (e.g. on poly-crystalline silicon) enables the clear detection of sample breakthrough. The combination of Ramam and LIBS indeed enables a chemical depth profiling of automotive paint samples.It is also important to emphasize that the flufolrueoscreeiscence backgroundmeasured simultaneously with theRaman spectra gives valuable information and supports the characterization and differentiation ofautomotive paint. As shown, the Raman spectra yield characteristic spectra for every sample layer. Thebuilt-in database, the KnowltAll Raman Spectral Library, and analysis using Bio-Rad’s software KnowltAll@Raman Identification Proenable the detailed analysis of materials and pigments. The elemental distribution revealed by LIBS may give additional information about materials not visible withRaman,or about trace elements or impurities which may be characteristic for samples of differentmanufacturers. The presentation of the SNV-normalized data in a pseudo color image as shown above is an interestingmethod of visualizing these data. At a glance, an entire set of spectra with largely differing intensities can bedisplayed, while significant changes between the spectra attributed to different sample zones becomeobvious. This kind of data presentation will be further tested in studies comparing depth profiles of variousdifferent samples. References [1] Balzer H, Hoehne M, Noll R, Strum V. New approach to online monitoring of the Al depth profile ofthe hot-dip galvanised sheet steel using LIBS. Anal Bioanal Chem (2006) 385:225-233 [21 Syvilay D,Wilkie-Chancellier N, Tricherau B, Texier A, Martinez A, Serfaty S, Detalle V. Evaluation ofthe standard normal variate method for Laser-Induced Breakdown Spectroscopy data treatmentapplied to the discrimination of painting layers. Spectrochim. Acta Part B 114 (2015):38-45. [3] Glaus R, Hahn DW. Fiber-coupled laser-induced breakdown and Raman spectroscopy for flexiblesample characterization with depth profiling capabilities. Spectrochim. Acta Part B 100 (2014): 116-122. [4] Zhang ZM, Chen S, Liang YZ. Baseline correction using adaptive iteratively reweighted penalized leastsquares. Analyst, 135(5)(2010):1138-1146. 51 Ferreira,KB, Oliveira AGG, Gomes JA. Raman spectroscopy of automotive paints: Forensic analysis ofvariability and spectral quality. Spectrosc. Lett. 50 (2017): 102-110. ( KnowltAll is a trademark of Bio-Rad La b oratories, Inc. in certain j u risdictions ) 拉曼光谱与激光诱导击穿光谱(LIBS)相结合的优点是将两种互补的分析方法耦合起来:利用 LIBS 可以获得样品在检测点的元素组成信息,而拉曼光谱则可以揭示分子、晶体或矿物学结构。将 Raman/LIBS 测量结合起来的另一个好处是有机会获得深度信息。也就是说,在同一点重复激光烧蚀穿透表面时,样品的结构特征。LIBS 或 Raman/LIBS 实验的这种特殊优势已经在厚度为 1μm 到 30μm 的薄膜上得到了广泛的证明,例如对钢上的铝层的分析、涂料层的地层调查和聚合物涂层金属的。
确定
还剩9页未读,是否继续阅读?

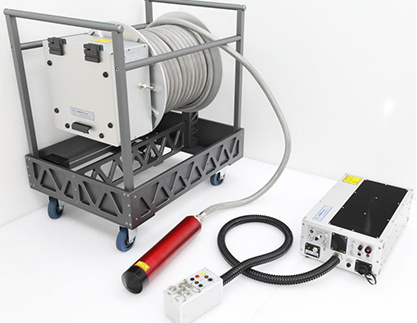
产品配置单
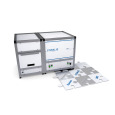
埃德比光子科技(中国)有限公司为您提供《汽车油漆涂层中RAMAN和LIBS联用深度扫描检测方案(激光诱导击穿)》,该方案主要用于汽车涂层和镀层中涂层和镀层性能检测,参考标准--,《汽车油漆涂层中RAMAN和LIBS联用深度扫描检测方案(激光诱导击穿)》用到的仪器有LTB CORALIS系列 LIBS&RAMAN联用系统
推荐专场
相关方案
更多