


方案详情
文
依据Aqualog A-TEEM技术,消除内滤效应,准确获得荧光有机物的三维指纹图谱(激发波长-发射波长-荧光强度)信息,结合化学计量学分析,鉴别原油组份。基于荧光强度与物质浓度呈线性关系,反应出组分分布,弥补了COD和BOD测试时间长,原油有机物种类信息缺失的问题
方案详情

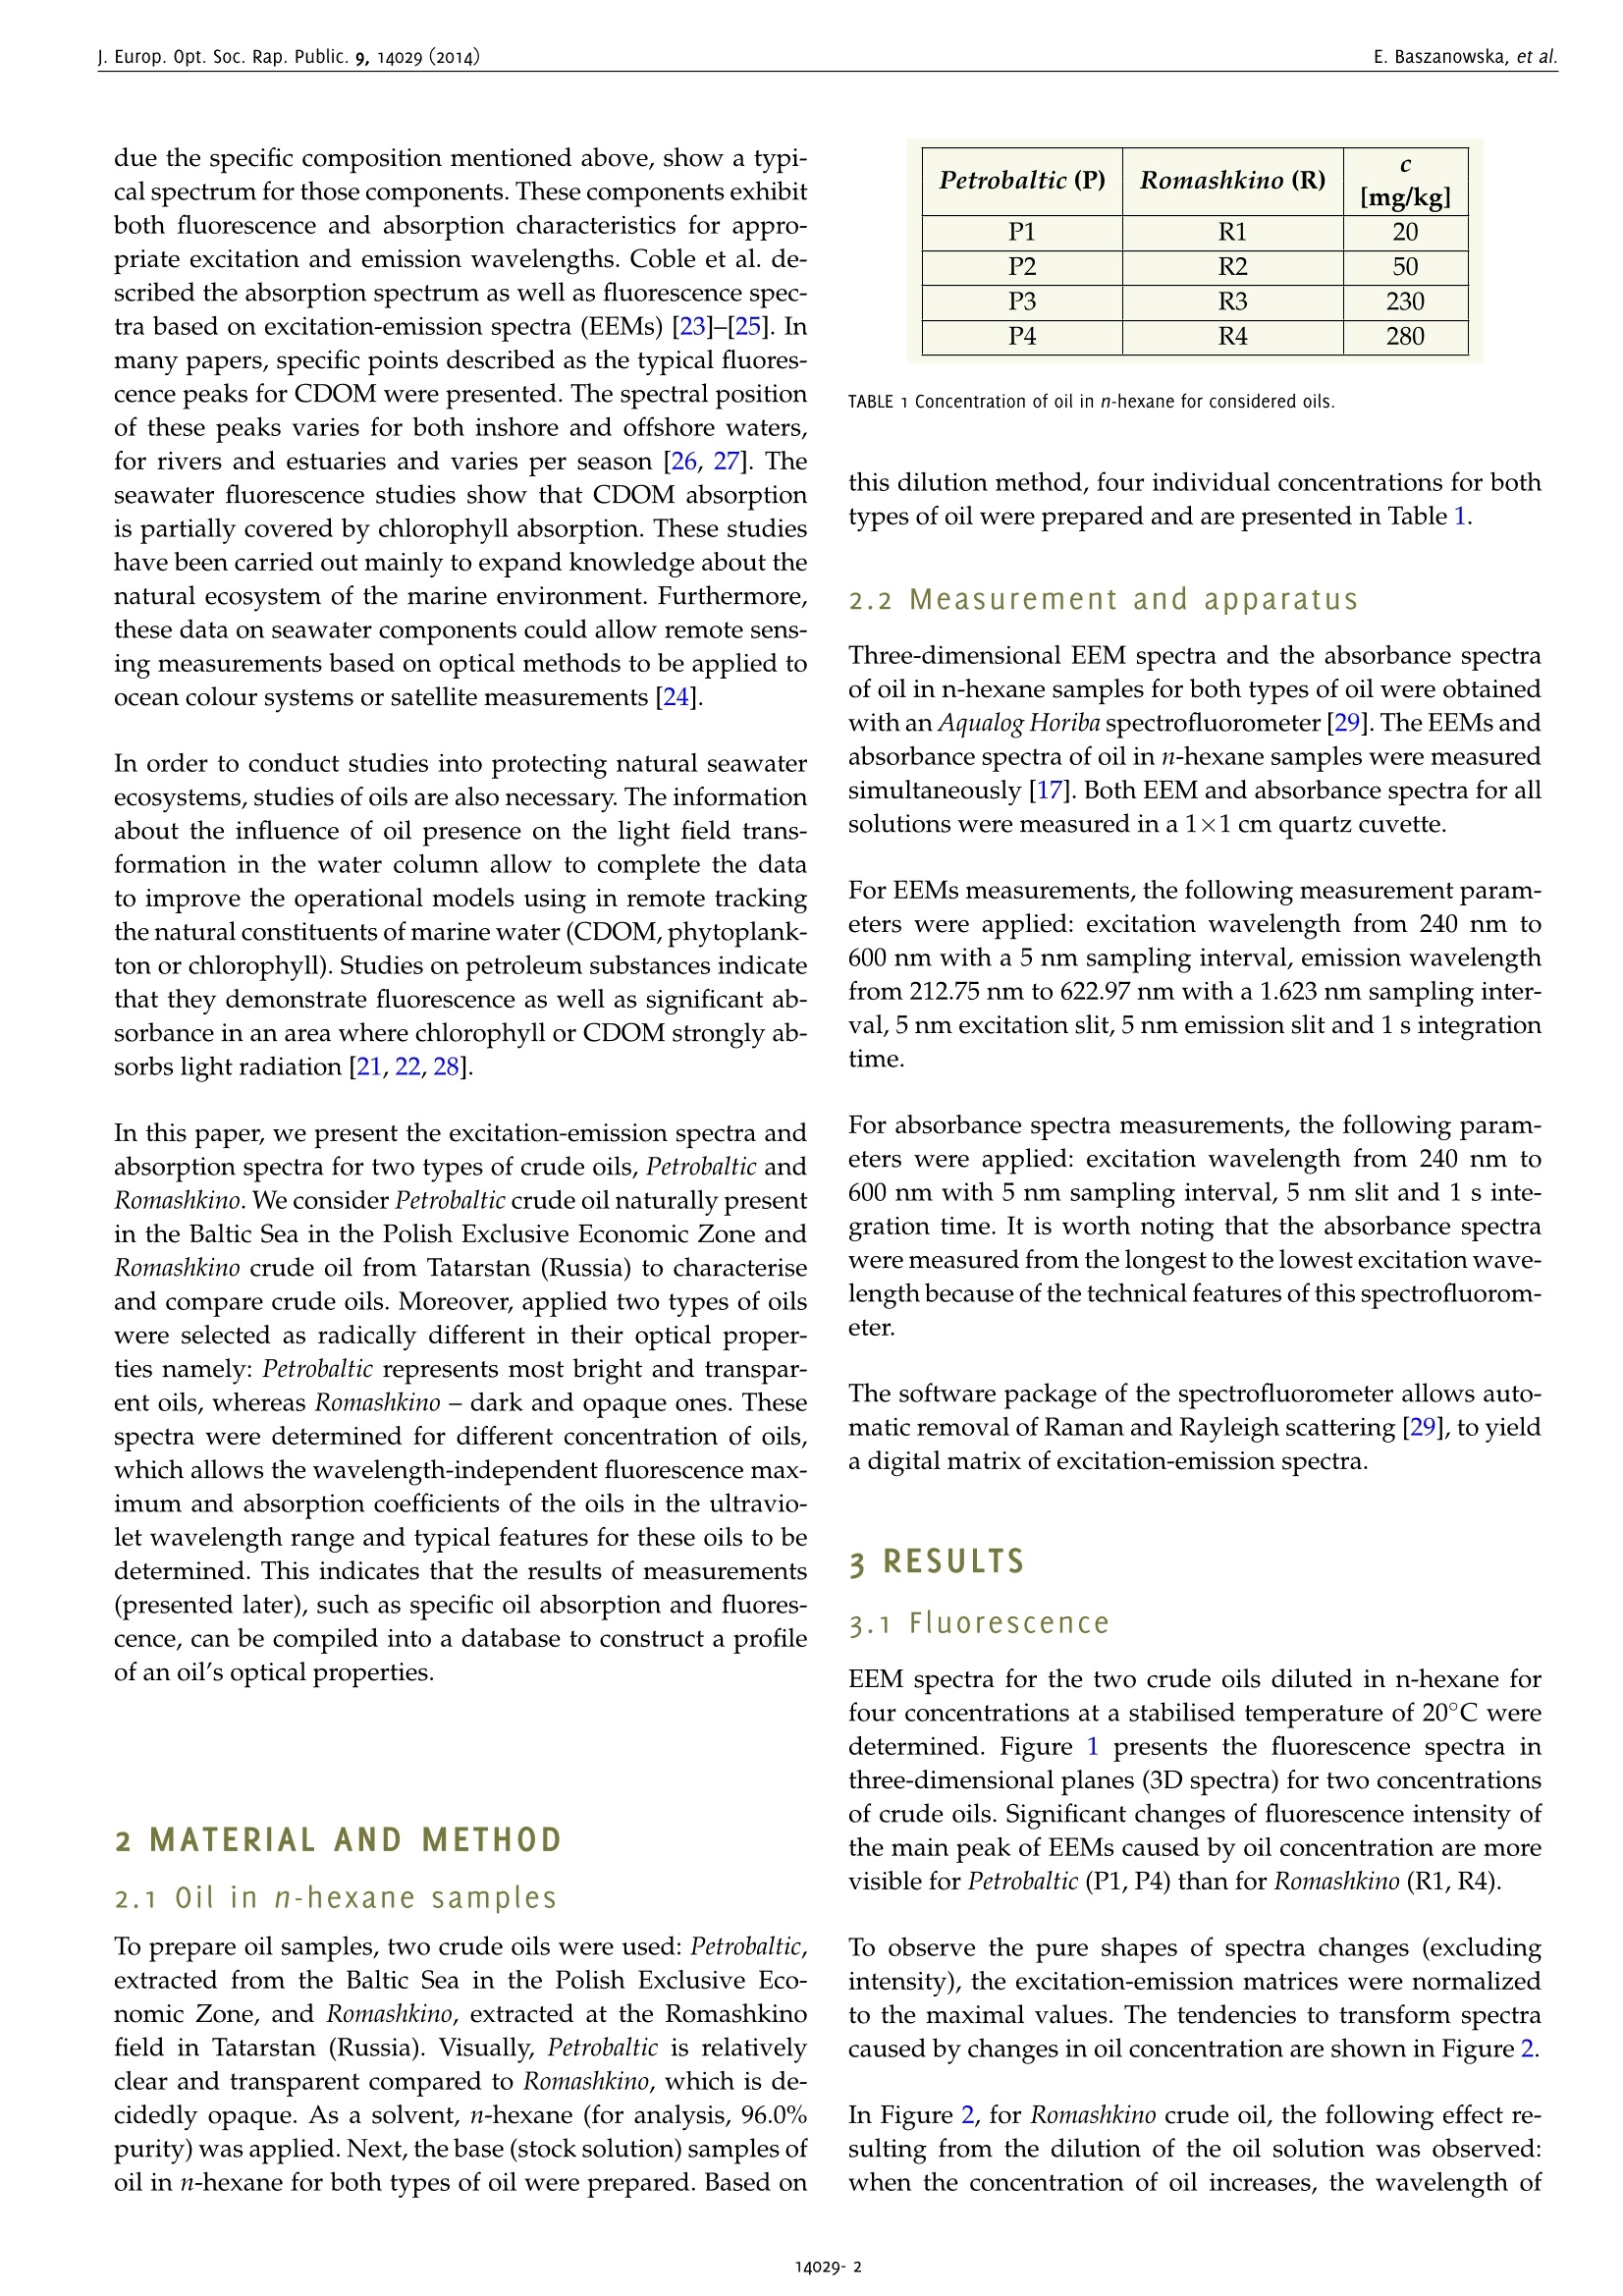
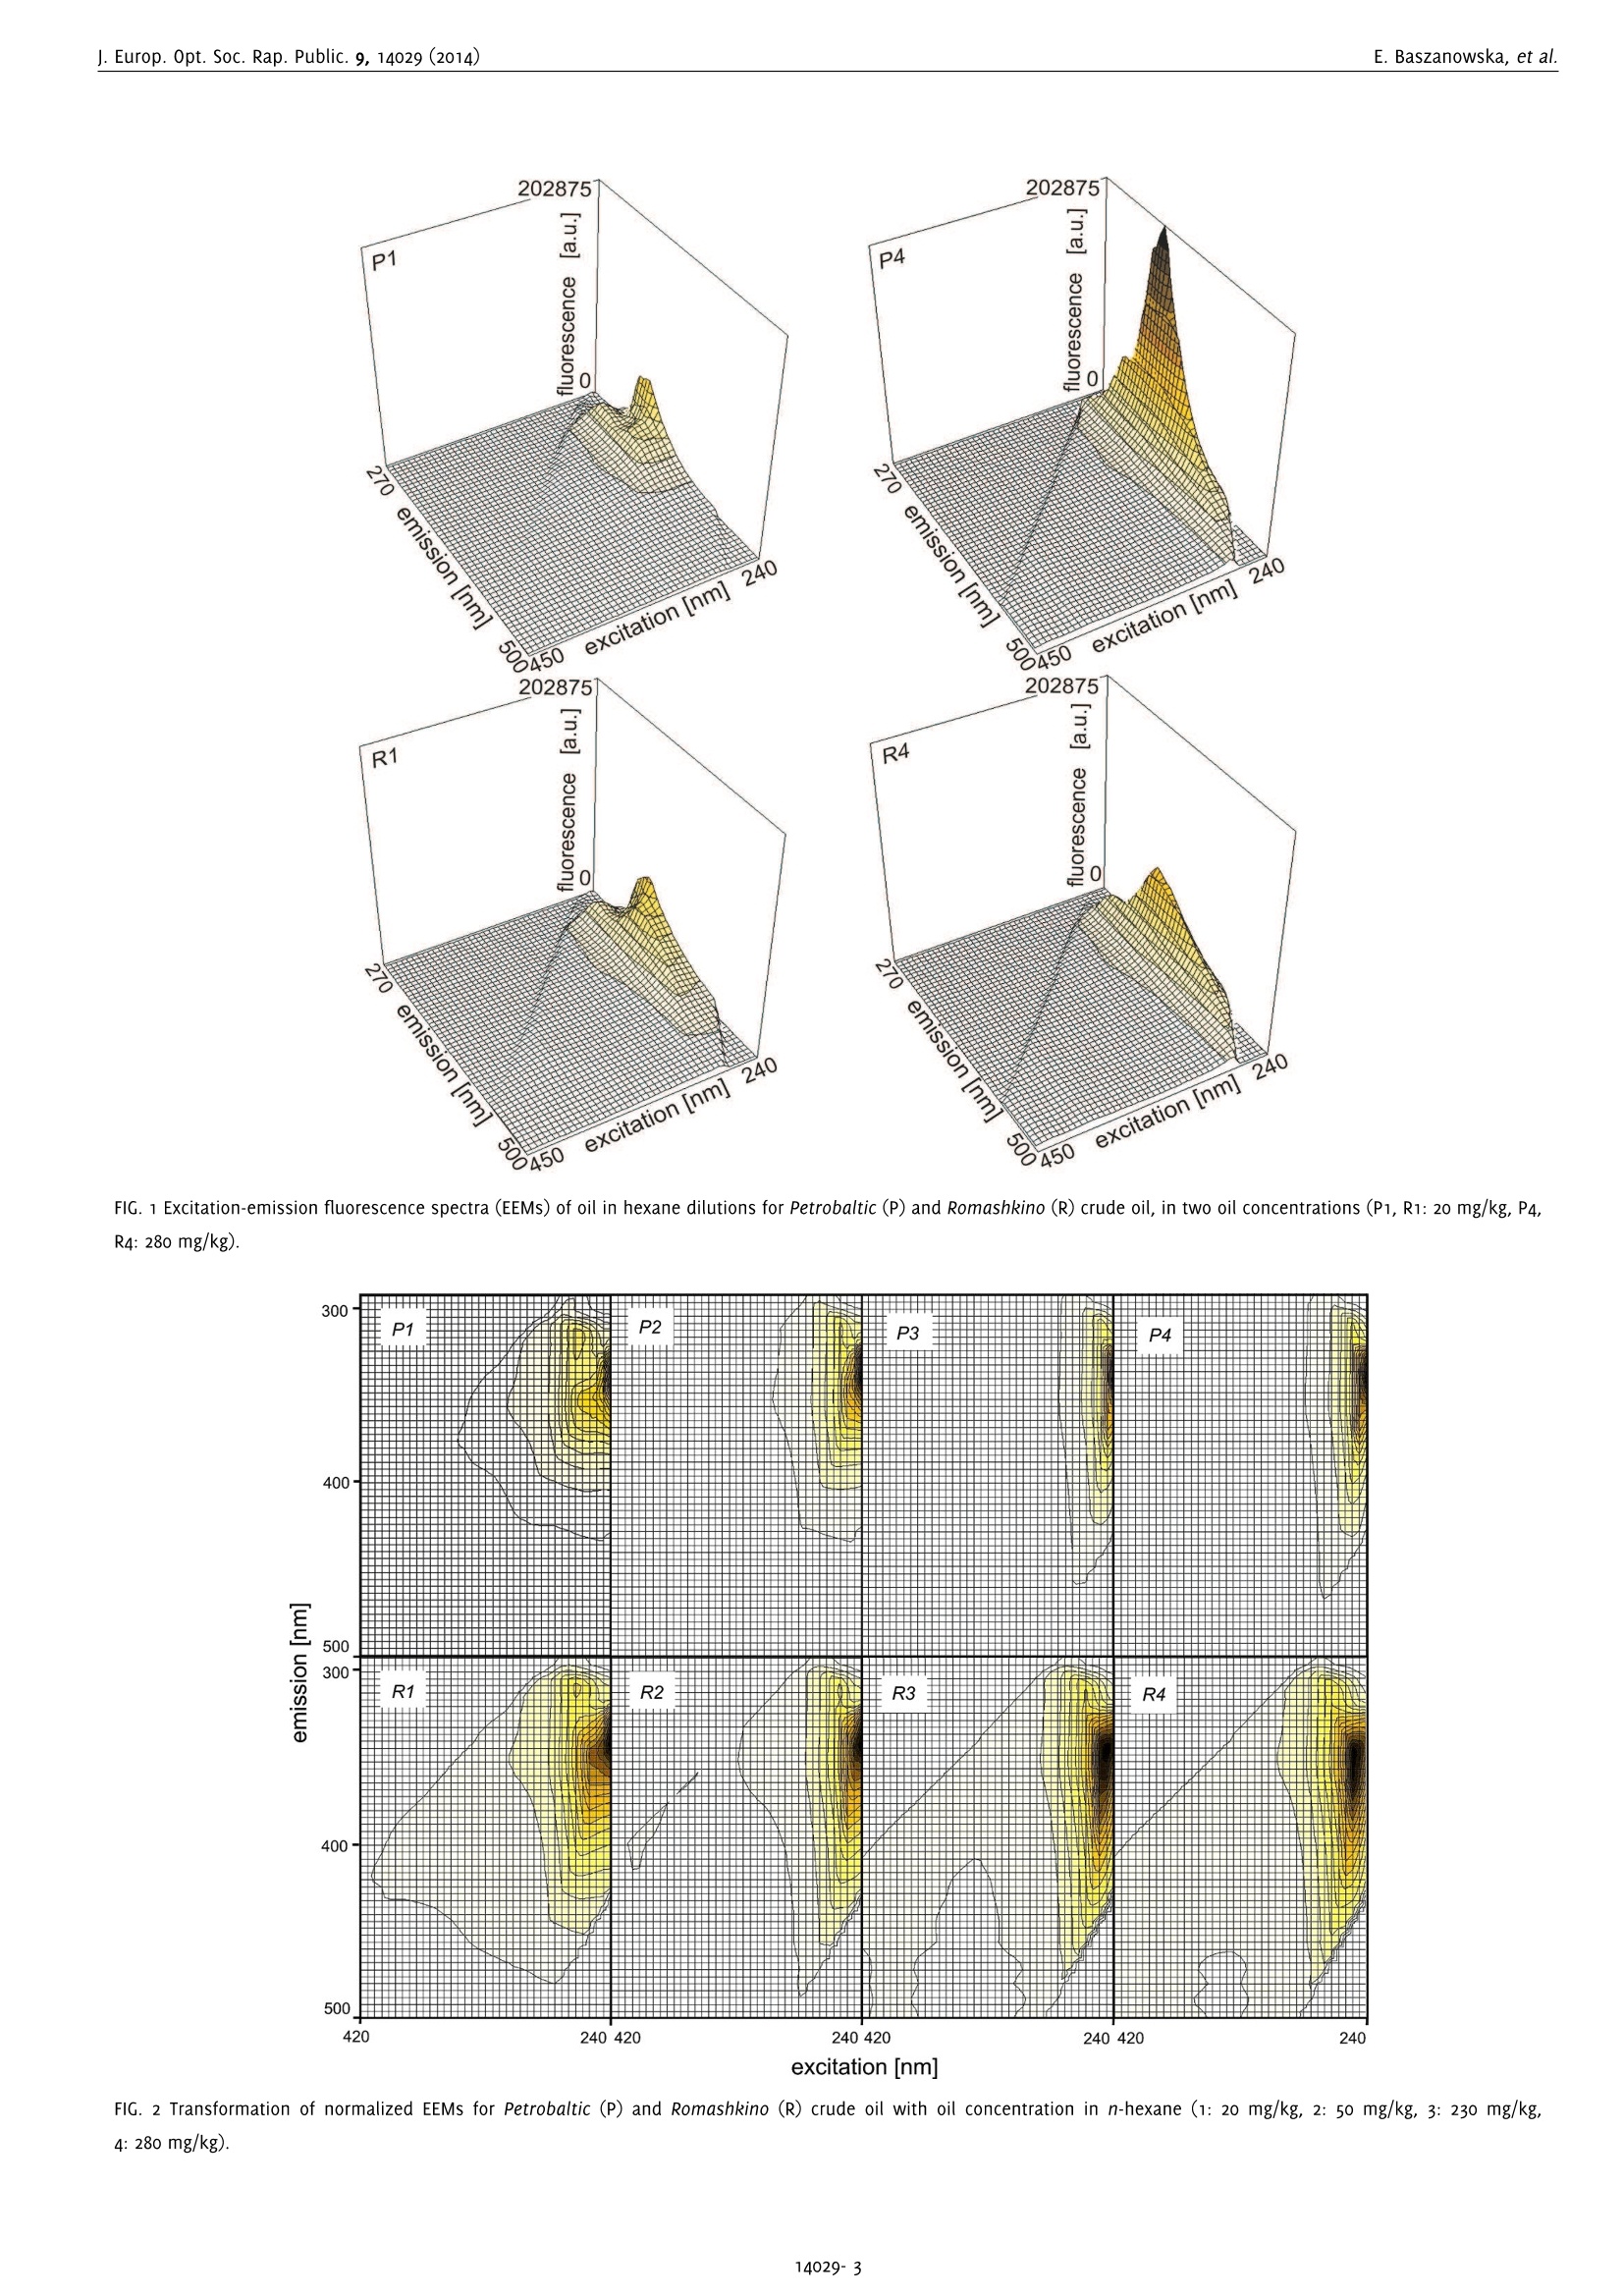
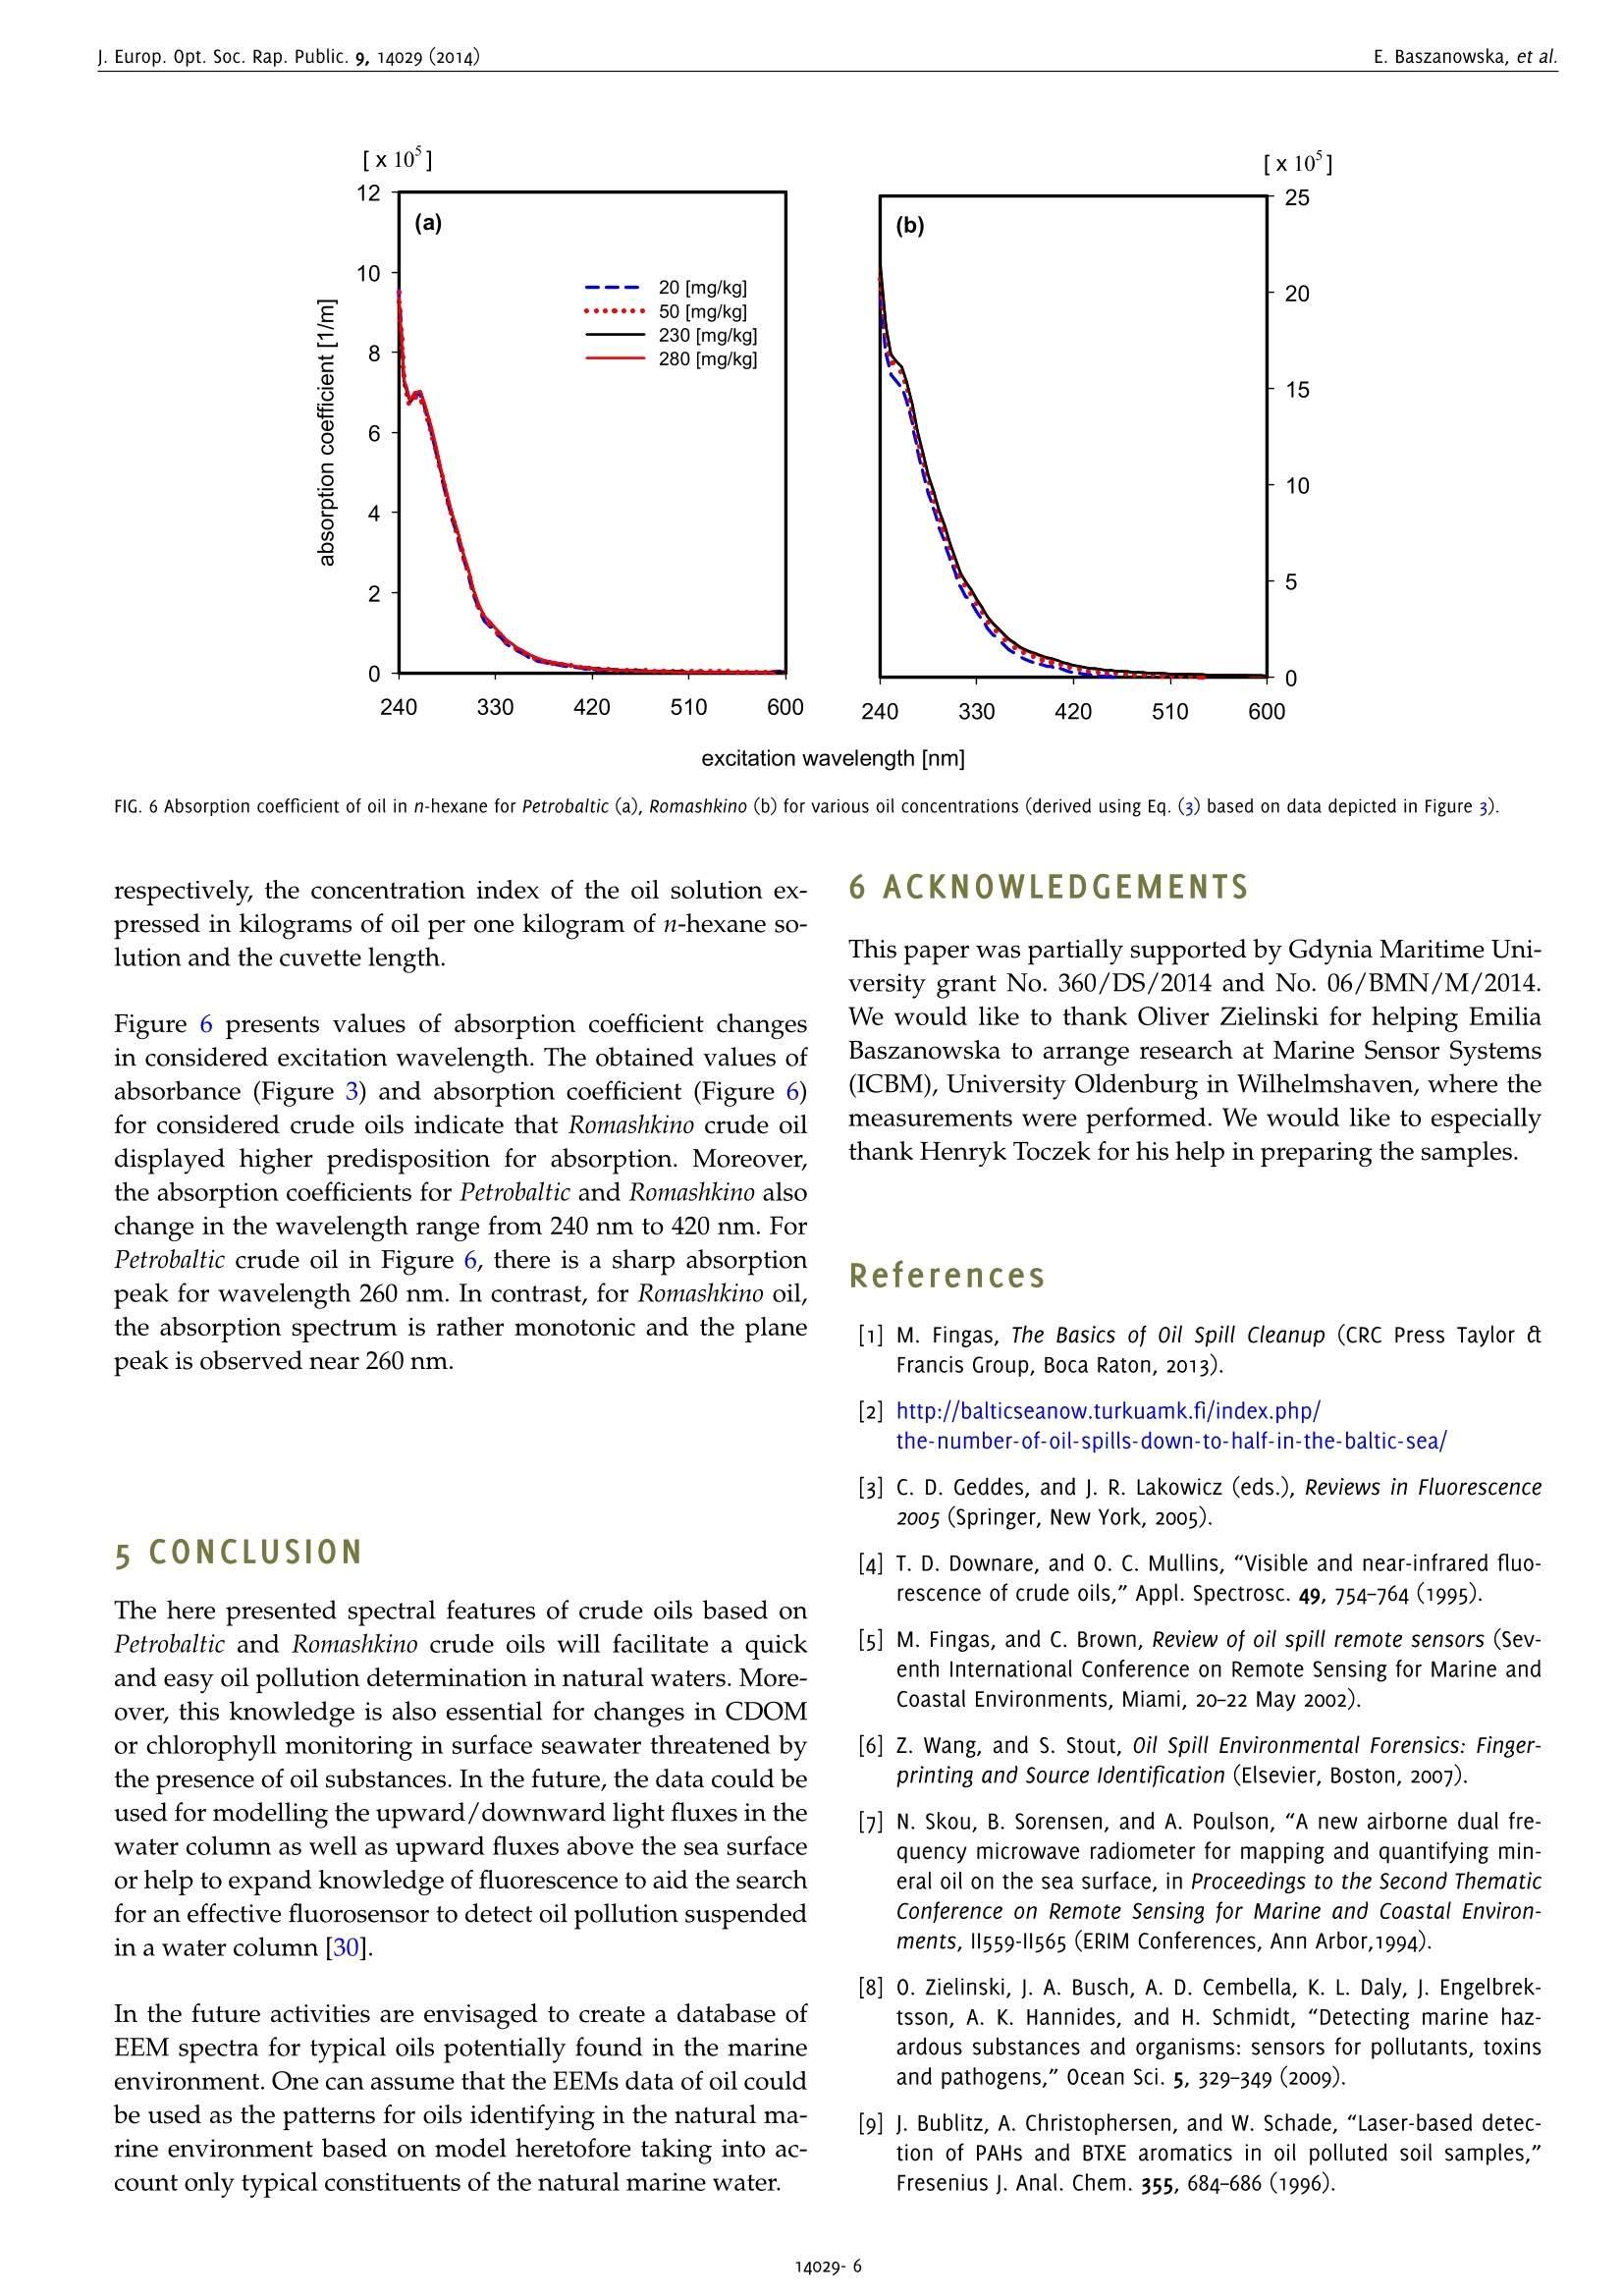
www.ieos.orgj. Europ. Opt. Soc. Rap. Public. 9, 14029 (2014) E. Baszanowska, et al.j. Europ. Opt. Soc. Rap. Public. 9, 14029 (2014) Spectral signatures of fluorescence and light absorptionto identify crude oils found in the marine environment E.Baszanowskaeba@am.gdynia.pl Gdynia Maritime University, Physics Department, Gdynia,81225,Poland Z.Otremba Gdynia Maritime University, Physics Department, Gdynia,81225,Poland To protect the natural marine ecosystem, it is necessary to continuously enhance knowledge of environmental contamination, including oilpollution. Therefore, to properly track the qualitative and quantitative changes in the natural components of seawater, a description of theessential spectral features describing petroleum products is necessary. This study characterises two optically-different types of crude oils (Petrobaltic and Romashkino)-substances belonging to multi-fluorophoricsystems. To obtain the spectral features of crude oils, the excitation-emission spectroscopy technique was applied. The fluorescence andlight absorption properties for various concentrations of oils at a stabilised temperature are described. Both excitation-emission spectra(EEMs) and absorption spectra of crude oils are discussed. Based on the EEM spectra, both excitation end emission peaks for the wavelength-independent fluorescence maximum (Exmax/Emmax)-characteristic points for each type of oil - were identified and compared with theliterature data concerning typical marine chemical structures. [DOI: http://dx.doi.org/10.2971/jeos.2014.14029] Keywords: Excitation-emission spectra, fluorescence spectroscopy,absorption spectra, oil pollution, seawater The implementation of sanctions for oil spills to meet the re-quirements of the protection of the marine environment hasled to a significant decrease in registered oil spills [1]. For ex-ample, as the Baltic Sea Now Info reported, since 2006 the num-ber of oil spills in the Baltic Sea has been reduced by half [2].Moreover, in recent times there has been a significant increasein the intensity of maritime transport, which has led to an in-creased risk of an oil spill as a consequence of possible ma-rine accidents. Therefore, it is worth broadening the scope ofrapid detection to determine the source of the oil leak as wellas identify the perpetrator. Crude oil and petroleum products are highly complex mix-tures of mainly hydrocarbon compounds [3]. The complexstructure of petroleum products requires the application ofthe most sensitive techniques possible. To expand the knowl-edge of petroleum products, various techniques based on UV-visible, Infrared, Raman spectroscopy or chromatography havebeen used [4]-[8]. However, from among the various tech-niques, the most efficient method for highly complex struc-tures seems to be fluorescence [9, 10] due to its high sensitiv-ity. Initially, petroleum products were studied based on fluores-cence by Franck [11]. Since that time, there has been increasedinterest in the study of oils based on fluorescence methods forsatellite,laboratory and in situ measurements [12]-[17].How-ever, the difficulty of the task lies in identifying the oil spillwith the lowest concentration of oil. Many of these techniques, particularly satellite remote sensing measurements, allow oilpollution to be detected with large oil spills. In contrast, re-mote sensing techniques based on laser fluorescence (denotedas the LIDAR technique) which allow oil detection for lowconcentrations, are burdened by many technical problemswhich appear as limitations [18]-[20]. The problems of oil de-tection when the concentration of hydrocarbon compoundsis low were reported by Dolenko et al. [15]. They noted thedifficulty of separating an oil's fluorescence from humic com-pound fluorescence for concentrations of oil in the order ofmicrograms per kilogram. When detecting oil in low concen-trations, excitation-emission fluorescence, synchronous fluo-rescence as well as fluorescence for single wavelength excita-tion can be considered. Work to expand the knowledge of thefluorescence of petroleum substances is still ongoing. For ex-ample, our studies are focused on collecting the shapes of flu-orescence spectra for different types of oil in various oil-watersystems [21,22]. In order to protect the marine environment ecosystem, it isnecessary keep track of the periodic dynamic changes in thepresence of long-time natural components of seawater, suchas chlorophyll, phytoplankton or coloured dissolved organicmatter denoted as CDOM. A description of particular seawa-ter component properties has been sought for many years.To solve this problem, many techniques were developed todetect and identify the changes of natural seawater compo-nents. Many of these techniques were based on fluorescencespectroscopy. It is well-known that natural surface waters, due the specific composition mentioned above, show a typi-cal spectrum for those components. These components exhibitboth fluorescence and absorption characteristics for appro-priate excitation and emission wavelengths. Coble et al. de-scribed the absorption spectrum as well as fluorescence spec-tra based on excitation-emission spectra (EEMs) [23]-[25]. Inmany papers, specific points described as the typical fluores-cence peaks for CDOM were presented. The spectral positionof these peaks varies for both inshore and offshore waters,for rivers and estuaries and varies per season [26, 27]. Theseawater fluorescence studies show that CDOM absorptionis partially covered by chlorophyll absorption. These studieshave been carried out mainly to expand knowledge about thenatural ecosystem of the marine environment. Furthermore,these data on seawater components could allow remote sens-ing measurements based on optical methods to be applied toocean colour systems or satellite measurements [24]. In order to conduct studies into protecting natural seawaterecosystems, studies of oils are also necessary. The informationabout the influence of oil presence on the light field trans-formation in the water column allow to complete the datato improve the operational models using in remote trackingthe natural constituents of marine water (CDOM, phytoplank-ton or chlorophyll). Studies on petroleum substances indicatethat they demonstrate fluorescence as well as significant ab-sorbance in an area where chlorophyll or CDOM strongly ab-sorbs light radiation [21, 22, 28]. In this paper, we present the excitation-emission spectra andabsorption spectra for two types of crude oils, Petrobaltic andRomashkino. We consider Petrobaltic crude oil naturally presentin the Baltic Sea in the Polish Exclusive Economic Zone andRomashkino crude oil from Tatarstan (Russia) to characteriseand compare crude oils. Moreover, applied two types ofoilswere selected as radically different in their optical proper-ties namely: Petrobaltic represents most bright and transpar-ent oils, whereas Romashkino- dark and opaque ones. Thesespectra were determined for different concentration of oils,which allows the wavelength-independent fluorescence max-imum and absorption coefficients of the oils in the ultravio-let wavelength range and typical features for these oils to bedetermined. This indicates that the results of measurements(presented later), such as specific oil absorption and fluores-cence, can be compiled into a database to construct a profileof an oil's optical properties. 2 MATERIAL AND METHOD 2.1 Oil in n-hexane samples To prepare oil samples, two crude oils were used: Petrobaltic,extracted from the Baltic Sea in the Polish Exclusive Eco-nomic Zone, and Romashkino, extracted at the Romashkinofield in Tatarstan (Russia). Visually, Petrobaltic is relativelyclear and transparent compared to Romashkino, which is de-cidedly opaque. As a solvent, n-hexane (for analysis, 96.0%purity) was applied. Next, the base (stock solution) samples ofoil in n-hexane for both types of oil were prepared. Based on Petrobaltic (P) Romashkino (R) C [mg/kg] P1 R1 20 P2 R2 50 P3 R3 230 P4 R4 280 TABLE 1 Concentration of oil in n-hexane for considered oils. this dilution method, four individual concentrations for bothtypes of oil were prepared and are presented in Table 1. 2.2 Measurement and apparatus Three-dimensional EEM spectra and the absorbance spectraof oil in n-hexane samples for both types of oil were obtainedwith an Aqualog Horiba spectrofluorometer [29]. The EEMs andabsorbance spectra of oil in n-hexane samples were measuredsimultaneously [17]. Both EEM and absorbance spectra for allsolutions were measured in a 1×1 cm quartz cuvette. For EEMs measurements, the following measurement param-eters were applied: excitation wavelength from 240 nm to600 nm with a 5 nm sampling interval, emission wavelengthfrom 212.75 nm to 622.97 nm with a 1.623 nm sampling inter-val, 5 nm excitation slit, 5 nm emission slit and 1 s integrationtime. For absorbance spectra measurements, the following param-eters were applied: excitation wavelength from 240 nm to600 nm with 5 nm sampling interval, 5 nm slit and 1 s inte-gration time. It is worth noting that the absorbance spectrawere measured from the longest to the lowest excitation wave-length because of the technical features of this spectrofluorom-eter. The software package of the spectrofluorometer allows auto-matic removal of Raman and Rayleigh scattering [29], to yielda digital matrix of excitation-emission spectra. 3 RESULTS 3.1 Fluorescence EEM spectra for the two crude oils diluted in n-hexane forfour concentrations at a stabilised temperature of 20°C weredetermined. Figure 1 presents the fluorescence spectra inthree-dimensional planes (3D spectra) for two concentrationsof crude oils. Significant changes of fluorescence intensity ofthe main peak of EEMs caused by oil concentration are morevisible for Petrobaltic (P1, P4) than for Romashkino (R1, R4). To observe the pure shapes of spectra changes (excludingintensity), the excitation-emission matrices were normalizedto the maximal values. The tendencies to transform spectracaused by changes in oil concentration are shown in Figure 2. In Figure 2, for Romashkino crude oil, the following effect re-sulting from the dilution of the oil solution was observed:when the concentration of oil increases, the wavelength of 450 FIG. 1 Excitation-emission fluorescence spectra (EEMs) of oil in hexane dilutions for Petrobaltic (P) and Romashkino (R) crude oil, in two oil concentrations (P1, R1: 20 mg/kg, P4,R4: 280 mg/kg). excitation [nm] co excitation wavelength [nm] FIG. 3 Absorption spectra of oil in n-hexane for Petrobaltic (a), Romashkino (b) for various oil concentrations. Petrobaltic Romashkino Exmax ±5[nm]/Emmax ±5 [nm] Exmax ±5[nm]/Emmax ±5[nm] P1 240/350 R1 240/350 P2 240/350 R2 240/350 P3 240/350 R3 245/358 P4 240/ 350 R4 250/360 TABLE 2 The values for wavelength-independent fluorescence properties of oil fluorescence peak: excitation maximum (Exmax), emission maximum (Emmax). maximum fluorescence intensity starts from near 350 nm andmoves to 360 nm, while the excitation wavelength relatedto the maximum fluorescence intensity starts from 240 nmand increases to the 250 nm. The results indicate that forRomashkino with dilution there are shifts to longer emissionwavelengths (red shift). However, for Petrobaltic crude oil, theintensity of maximum fluorescence increases when the con-centration of oil increases, although excitation and emissionwavelengths related to fluorescence maximum remain con-stant. The shape of fluorescence spectra demonstrates the presenceof peaks, typical for two kinds of crude oil. Based on EEMs,the peaks typical for both oils can be described by the spe-cific wavelengths: excitation and emission- described as thepeak position of wavelength-independent fluorescence maxi-mum, written as Exmax/Emmax. The specific peaks describedas wavelength-independent were determined for both kindsof oil for various oil concentrations. The values of wavelength-independent fluorescence maximum are presented in Table 2.The permanent value of this parameter was observed for dif-ferent concentrations for Petrobaltic oil. In contrast, for Ro-mashkino oil,a shift in the wavelength-independent fluores-cence maximum to the longer wavelengths was observed withan increase in oil concentration. Taking into account the varia-tions of the wavelength-independent fluorescence maximum,the range of changes of these parameters for both types of oilwas determined. Table 3 presents the range of wavelength-independent fluorescence maximums for the studied oils. Exmax ±5[nm]/ Emmax ±5[nm] Petrobaltic 240/350 Romashkino 240-250/350-360 TABLE 3 The range of values for wavelength-independent fluorescence properties of oilfluorescence peak: excitation maximum (Exmax), emission maximum (Emmax). The results of EEMs for Petrobaltic and Romashkino show thatthese oils display fluorescence in the ultraviolet range andthe maximum fluorescence of oils depends on the type of oil.The maximum excitation wavelength changes from 240 nmto 250 nm and the maximum emission wavelengths changesfrom 350 nm to 360 nm. 3.2 Absorbance Absorbance spectra A() were registered simultaneouslyto the excitation-emission spectra (EEMs) using an AqualogHoriba spectrofluorometer. The measurement principle isbased on the following rule (Eq. (1))[14]: and Io(A),I(A) describe,respectively, the intensity of the lightthat has passed through the reference sample (n-hexane) andthe intensity of the light that has passed through the oil in n-hexane sample. Figure 3 presents the absorbance spectra registered for crudeoils Petrobaltic and Romashkino, for various oil concentrations (the same as in EEMs measurements). The absorbance spec-tra achieved higher values for crude oil Romashkino. The ab-sorbance spectra show strong changes in the wavelengthrange from 240 nm to 420 nm, while for the longer wave-lengths remain at the same level and takes relatively low val-ues. 41DISCUSSION The solution to the problem of recognising the individual con-stituents of seawater which influence the excitation-emissionspectra plays an important role in the process of finding theeasiest and most efficient method for detection and quantifi-cation of natural and alien substances in the seawater. In thispaper, a potential component of the seawater -crude oil -is considered. Since crude oils and their derivatives containfluorescence compounds (mainly cyclic and polycyclic hy-drocarbons), they may disturb methods of determining var-ious seawater constituents and,conversely, various naturalseawater constituents may disturb the detection of oil sub-stances in the sea environment. Coble [24] revealed character-istic indices extracted from EEMs that are assigned to definegroups of compounds typical for the aquatic environment.The mentioned author describes the peaks of EEM spectratypical for CDOM [23]-[25]. These peaks were described forparticular components of CDOM, such as aminoacid-like hu-mic acids and fulvic acids. Taking into account the EEM spec-tra presented in this paper, as well as the determined valueof independent-wavelength of fluorescence maximum of oils,it can be seen that the maximum excitation wavelength of oilcan be located in the region of the excitation wavelength forCDOM-especially for tryptophan-like or protein-like, as wellas humic-like. At the same time, the author noted the role ofthe origin of particular types of compounds. All of the above indicates that oil pollution in the marine envi-ronment can strongly disturb the possibility of florescence andabsorption of typical components of natural seawater. In con-sequence, it leads to the variations in EEMs or the absorptionspectra of natural seawater. In the future, it would be inter-esting to track the excitation-emission spectra and absorptionspectra of oils belonging to other groups of oils (i.e. lubricateoils, fuels) to expand knowledge about the spectral propertiesof oils. A comparison of the wavelength-independent fluores- FIG. 4 Juxtaposition of crude oils with various marine constituents (described in pa-per [24]) in respect of Exmax/Emmax- cence Exmax/Emmax of crude oils (Table 2) with various ma-rine constituents [24] is given in Figure 4. This diagram showsthat the highest points indicating Emmmaaxs are located at wave-lengths longer than for oils. At the same time, points indicat-ing Exmax correspond to the longer wavelengths in every case.This observation can be treated as an advantage for distin-guishing the oil-origin part of EEMs from other areas of EEMsconnected with the natural seawater constituents. The otheradvantage is that the indexes Exmax/Emmax for oil almost donot depend on the concentration or type of oil. On the other hand, if the entire area of EEMs are consideredin respect to their similarities, the concentration of oil influ-ences the similarity ratio Sab (Eq. (2)) in low concentrations,whereas in higher concentrations the similarity ratio is inde-pendent of oil concentration (Figure 5). The similarity ratioSab between the fluorescence spectra of the two oil solutionsfor the considered concentration of oils is given by Eq. (2) (asused in the paper [17]). In this formula, the indexes “ij"referto relative columns and rows in tables representing spectra"a" and "b", the quantities w., w?refer, respectively, to nor-malised elements of EEM matrix of reference oil solution“a”and compared solution“b". It is possible that supporting measurements using the samedevice (as for fluorescence), i.e. absorbance spectra, will im-prove the methodology of spectral measurements of seawa-ter constituents. Based on measured absorbance A(A), the ab-sorption coefficients a(入) for considered concentrations of oilswere determined as follows: where A(A)- above-mentioned absorbance and c,d describe, excitation wavelength [nm] respectively, the concentration index of the oil solution ex-pressed in kilograms of oil per one kilogram of n-hexane so-lution and the cuvette length. Figure 6 presents values of absorption coefficient changesin considered excitation wavelength. The obtained values ofabsorbance (Figure 3) and absorption coefficient (Figure 6)for considered crude oils indicate that Romashkino crude oildisplayed higher predisposition for absorption. Moreover,the absor)prtpito1no coefficients for Petrobaltic and Romashkino alsochange in the wavelength range from 240 nm to 420 nm. ForPetrobaltic crude oil in Figure 6, there is a sharp absorptionpeak for wavelength 260 nm. In contrast, for Romashkino oil,the absorption spectrum is rather monotonic and the planepeak is observed near 260 nm. 5 CONCLUSION The here presented spectral features of crude oils based onPetrobaltic and Romashkino crude oils will facilitate a quickand easy oil pollution determination in natural waters. More-over, this knowledge is also essential for changes in CDOMor chlorophyll monitoring in surface seawater threatened bythe presence of oil substances. In the future, the data could beused for modelling the upward/downward light fluxes in thewater column as well as upward fluxes above the sea surfaceor help to expand knowledge of fluorescence to aid the searchfor an effective fluorosensor to detect oil pollution suspendedin a water column [30]. In the future activities are envisaged to create a database ofEEM spectra for typical oils potentially found in the marineenvironment. One can assume that the EEMs data of oil couldbe used as the patterns for oils identifying in the natural ma-rine environment based on model heretofore taking into ac-count only typical constituents of the natural marine water. 6 ACKNOWLEDGEMENTS This paper was partially supported by Gdynia Maritime Uni-versity grant No. 360/DS/2014 and No.06/BMN/M/2014.We would like to thank Oliver Zielinski for helping EmiliaBaszanowska to arrange research at Marine Sensor Systems(ICBM), University Oldenburg in Wilhelmshaven, where themeasurements were performed. We would like to especiallythank Henryk Toczek for his help in preparing the samples. ( References ) [1] M. Fingas, The Basics of Oil Spill Cleanup (CRC Press Taylor atFrancis Group, Boca Raton, 2013). ( .[2 ] h h ttp: / /balticseanow.turkuamk . f i /index. p h p / ) ( the-n u m b er-of-oil-s p ills-down-to-h a lf - in-t h e-baltic-sea/ ) ( [3] C. D. Geddes, a nd J. R. Lakowicz ( eds.), Reviews i n F luorescence2005 ( Springer, New York, 2005). ) ( [4] T. D. Downare, and O. C. M u llins,“V i sible an d nea r -infrared flu o - rescence of c rude oils,"Appl. Spectrosc. 49, 754-764(1995). ) ( [5] M. F ingas, a nd C. Brown, Review of oil spill remote sensors (Sev-enth I nternational Conference o n Remote Sensing for Marine an d Coastal Environments, Miami, 2 0 -22 May 2002). ) ( [6] Z. Wang, a n d S. S to ut, Oi l Sp i ll Environmental Fore n sics: Fing e r-printing a nd Source Identification (Elsevier, B o ston, 2007). ) ( [7] N . S kou, B . S orensen, a nd A. P oulson,“ A new ai r borne du a l fr e -quency microwave radiometer for m a pping an d quantifying mi n -eral oil on the sea surface, in Proceedings to the Second ThematicConference o n Remote Sensing for Marine an d Coastal Environ- ments, ll559-1I565 (ERIM Conferences, A n n Arbor,1994). ) ( [8] 0. Z ielinski, j. A. Busch, A. D . C e mbella, K. L . D al y , J. Eng e lbrek-tsson, A. K. Hannides, and H . S chmidt, “Detecting marine h a z-ardous s ubstances and o r ganisms: s e nsors f o r pollutants, toxinsand pathogens," 0cean Sci. 5, 329-349 (2 0 09). ) ( [9] J. Bublitz , A . Christophersen, and W. S chade,“Laser-based detec- tion of PAHs and BTXE ar o matics in oil po l luted so i l samples," Fresenius j. Anal . Chem. 355, 684-686(1996). ) ( [10] J. Bublitz , and W. Schade,“ M ultiwavelength la s er-induced flu o -rescence s pectroscopy f o r quantitative classification of aromatic hydrocarbons," P r oc. SPIE 2504, 2 6 5-277(1995). ) ( [11]U. Frank, “ A review o f fluorescence spectroscopic m e thod for oi l spill source identification," Toxicol. Environ. Chem. Rev. 2 , 163-185 (1978). ) ( [12] S. Patsayeva, " Fluorescent remote diagnostics of oil pollutions: oil in films and oi l dispersed in the water body, " EARSeL Adv. Remote Sens. 3 , 170-178 ( 1995). ) ( [13] L. Poryvkina, S . Babichenko,and 0 . Davydova,“ S FS c h aracterisa- tion of oil pollution in natural water," i n P r oceedings to 5 th Inter- national Conference on R emote Sensing for Marine and Coastal En- vironments, 520-524(Michican Tech Research Inst i tute, San Diego, 1 998). ) ( [14] E. Baszanowska, and Z. Otremba,“Spectroscopic m ethods in ap-plication to oil pollution detection i n the s ea,"j. KONES 19 , 15 - 20(2012). ) ( [15] T . A. Dolenko, V. V. Fadeev, I . V. Gerdova, S. A. Dolenko, andR. Reuter,“Fluorescence diagnostics of oil p ollution in coastal ma- rine waters b y u s e of artificial neural n etworks," A p pl. Opt. 41, 5155-5166(2002). ) ( [ 1 6] H. Visser, “ Teledetection o f the thickness of oil films on pollutedwater b ased o n the oi l f l uorescence properties," A p pl. O p t. 18, 1 746-1749(1979). ) ( [ 1 7] E. Baszanowska, 0 . Zielinski, Z. Otremba, and H. T oczek, “Influenceof oil-in-water emulsions o n fluorescence properties as observed by e xcitation-emission spectra,"J. Europ. Opt. Soc. R ap. Public. 8 , 13069(2013). ) ( [ 1 8] R. K arpicz, A . D ementjev, Z . K u prionis, S . P a kalnis, R . W e stphal,R. Reuter, andV. Gulbinas,"0 i l spill fluorosensing lidar for inclined onshore or shipboard operation,"Appl. Opt. 45, 6 6 20-6625(2006). ) ( [19] J . Vasilescu, L . Marmureanu, E. Carstea, and C . P . C ristescu,"0il spills detection from fluorescence lidar measurements," U. P. B. Sci. Bull., Series A 72, 149-154(2010). ) ( [20] A. G. Abroskin, S . E. Nol’de, V. V. F adeev, a nd V . V . C h ubarov,“Laser fluorimetry determination of e mulsified-dissolved oil in wa- ter," Sov. Phys. D okl. 3 3, 2 15-217(1 9 88). ) ( [21 ] E. Baszanowska, Z. O tremba, H. Toczek, a nd P. R ohde, "Fluores-cence spectra of oil after i t contacts with aquatic environment," J. K ONES 20, 29-34 (2013). ) ( [22] Z. Otremba, E . Baszanowska, H. T oczek, a nd P. Rohde,“Spectroflu-orymetry i n application to oil-in-water emulsion ch a racterization," J. KONES 18, 317-321(2011). ) ( [23] P. G. Coble, “Characterization of m arine a n d terrestrial D OM in 1 s S eawater using e xcitation-emission matrix s pectroscopy," Mar. Chem.51,325-346,(1996). ) ( [24] P. G. Coble,“Marine optical b i ogeochemistry: th e chemistry of ocean color," Chem. Rev. 107, 402-418(2007). ) ( [25] P. G. Coble, “ Colored d issolved organic matter i n s eawater," i n Subsea Optics a n d Imaging, J. W a tson, and 0. Z ielinski, eds., 98-118 (1st edition, Woodhead Publishing, Cambridge, 2013). ) ( [26] V . Drozdowska, W . F reda, E. B aszanowska, K . R u dz, M . D a recki,J. Heldt, and H . T oczek, “ S pectral properties of natural and oil pol - luted Baltic seawate r - results o f measurements and modelling,"Eur. Phys. j. Special Topics 222, 2157-2170(2013). ) ( [27] P. Kowalczuk, J . Ston-Egiert, W. J. Cooper, R. F. Whitehead, a ndM. j. Durako, "Characterization of chromophoric dissolved organic matter ( CDOM) in t h e Baltic Sea b y excitation e m ission m a trixfluorescence spectroscopy," M ar. Chem. 9 6 , 273-292(2 0 05). ) ( [28] J. H. Christensen , A . B. Hansen , j. Mortensen , and 0. Andersen,“Characterization and matching of oil samples u sing fluorescencespectroscopy and parallel factor analysis," Anal. Chem. 77, 2210- 221 7 (2005). ) ( [29] O peration manual, Aq u alog Horiba, rev. A ( H o r iba Scientific, 20 1 1). ) ( [30] R . N. Conmy, P . G. C oble, j. Farr, A. M. Wood, K . Lee, W. S. Pegau, 1 . D. Walsh, et al.,“Submersible optica l sensors exposed to chem-ically dispersed c rude oil: wave t a nk simulations for im p roved oil spill monitoring," E nviron. Sci. T echnol. 48, 1803-1810(2014). ) Received May revised ms. received july published August SSN 同步吸收-三维荧光光谱,快速三维荧光测试,一键校正内滤效应,水拉曼/硫酸奎宁定量,结合化学计量学分析,实现不同组分定性定量分析依据Aqualog专利 A-TEEM技术,消除内滤效应,准确获得荧光有机物的三维指纹图谱(激发波长-发射波长-荧光强度)信息,结合化学计量学分析,鉴别原油组份。基于荧光强度与物质浓度呈线性关系,反应出组分分布,弥补了COD和BOD测试时间长,原油有机物种类信息缺失的问题
确定

还剩5页未读,是否继续阅读?

产品配置单
HORIBA(中国)为您提供《原油、石油污染水体、石化废水、炼油废水中多聚芳烃,多环芳烃化合物等检测方案(分子荧光光谱)》,该方案主要用于废水中有机污染物检测,参考标准--,《原油、石油污染水体、石化废水、炼油废水中多聚芳烃,多环芳烃化合物等检测方案(分子荧光光谱)》用到的仪器有HORIBA Aqualog®同步吸收-三维荧光光谱仪
推荐专场
相关方案
更多
该厂商其他方案
更多