


方案详情
文
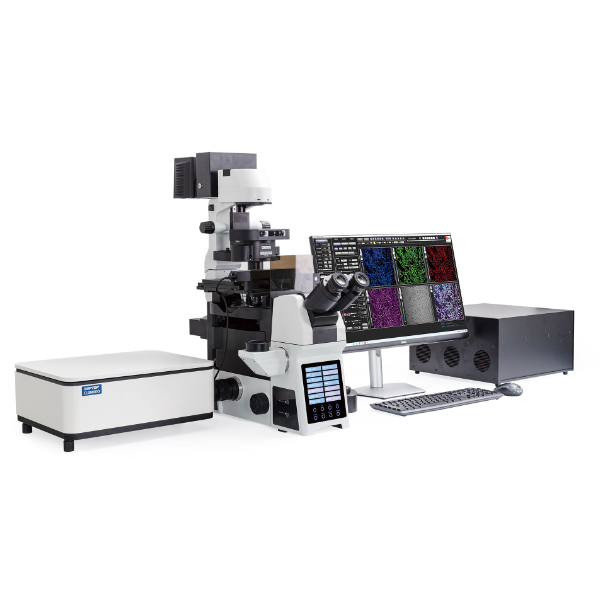
耦合ISS的SMT系统到奥林巴斯共焦显微镜,激光扫描成像基于反馈算法,在扫描期间,根据要成像的物体的形状,连续地调整和确定激光束跟随的路径。该算法将激光光斑移动到离物体表面一定距离的位置,由于激光光斑的位置和离物体表面的距离是已知的参数,所以利用这些参数来重建物体的形状。三维细胞结构可以在几秒钟内分辨率达到20-40纳米,精度为2纳米。
方案详情

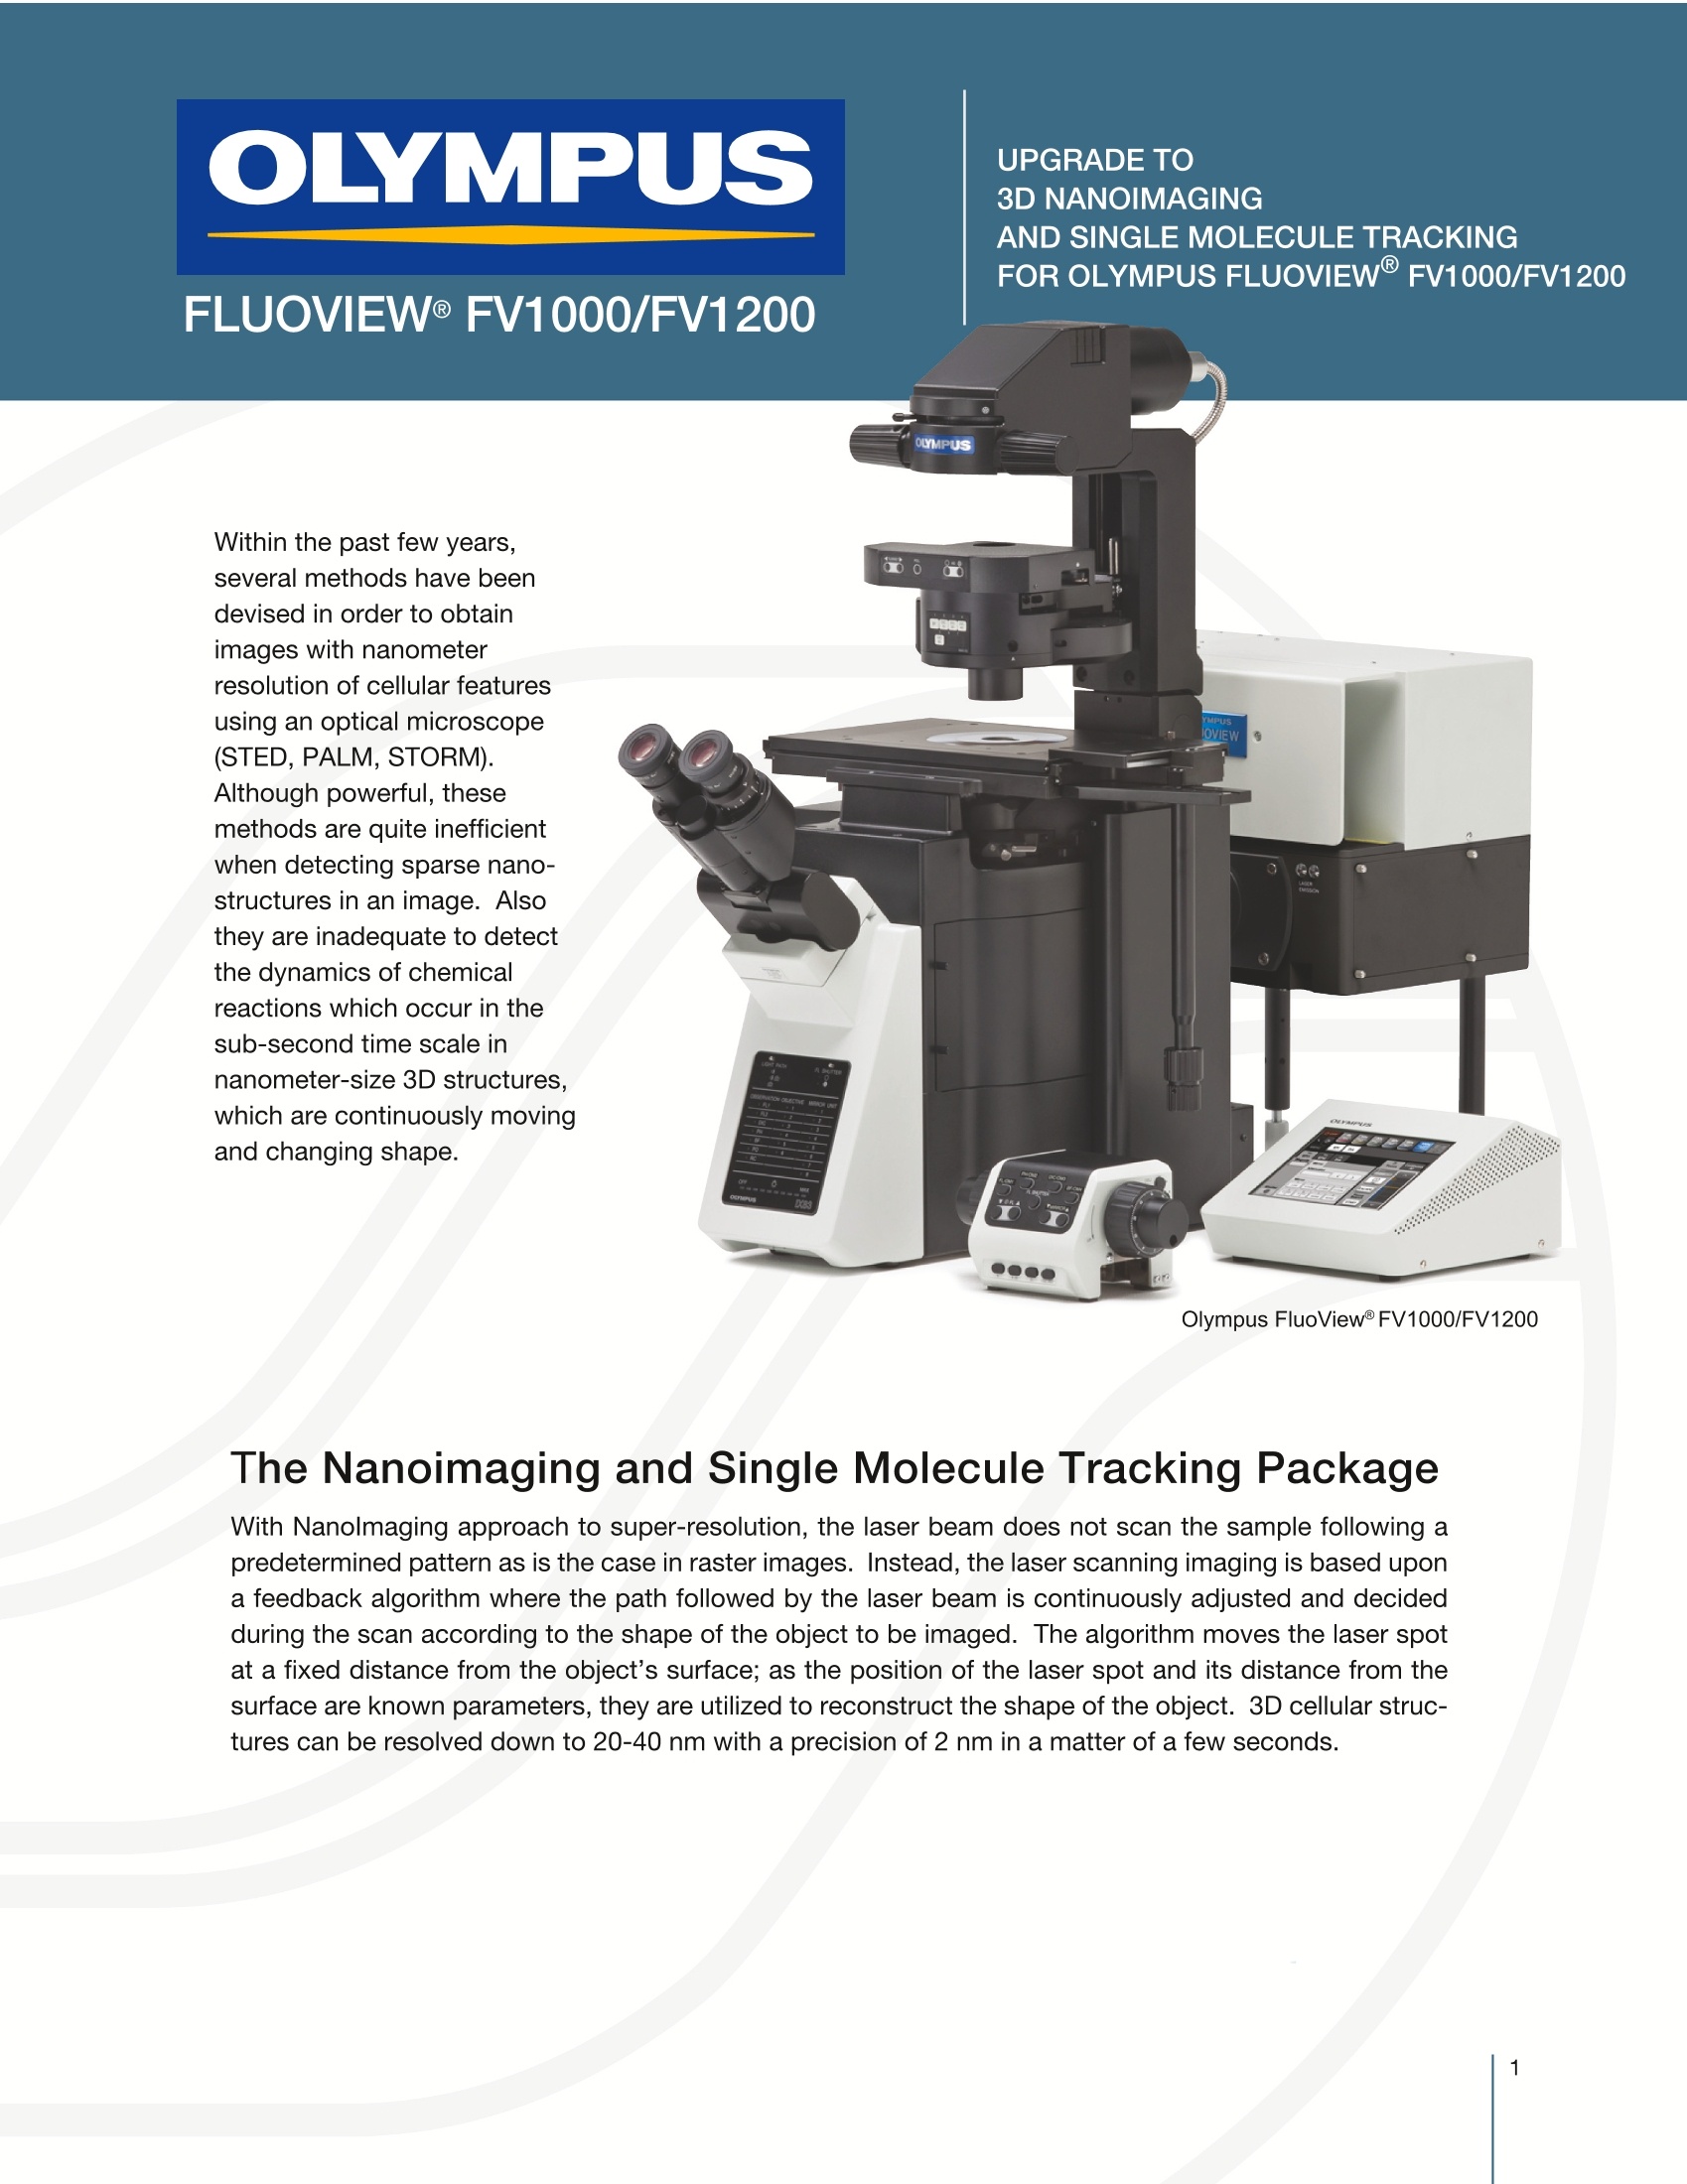
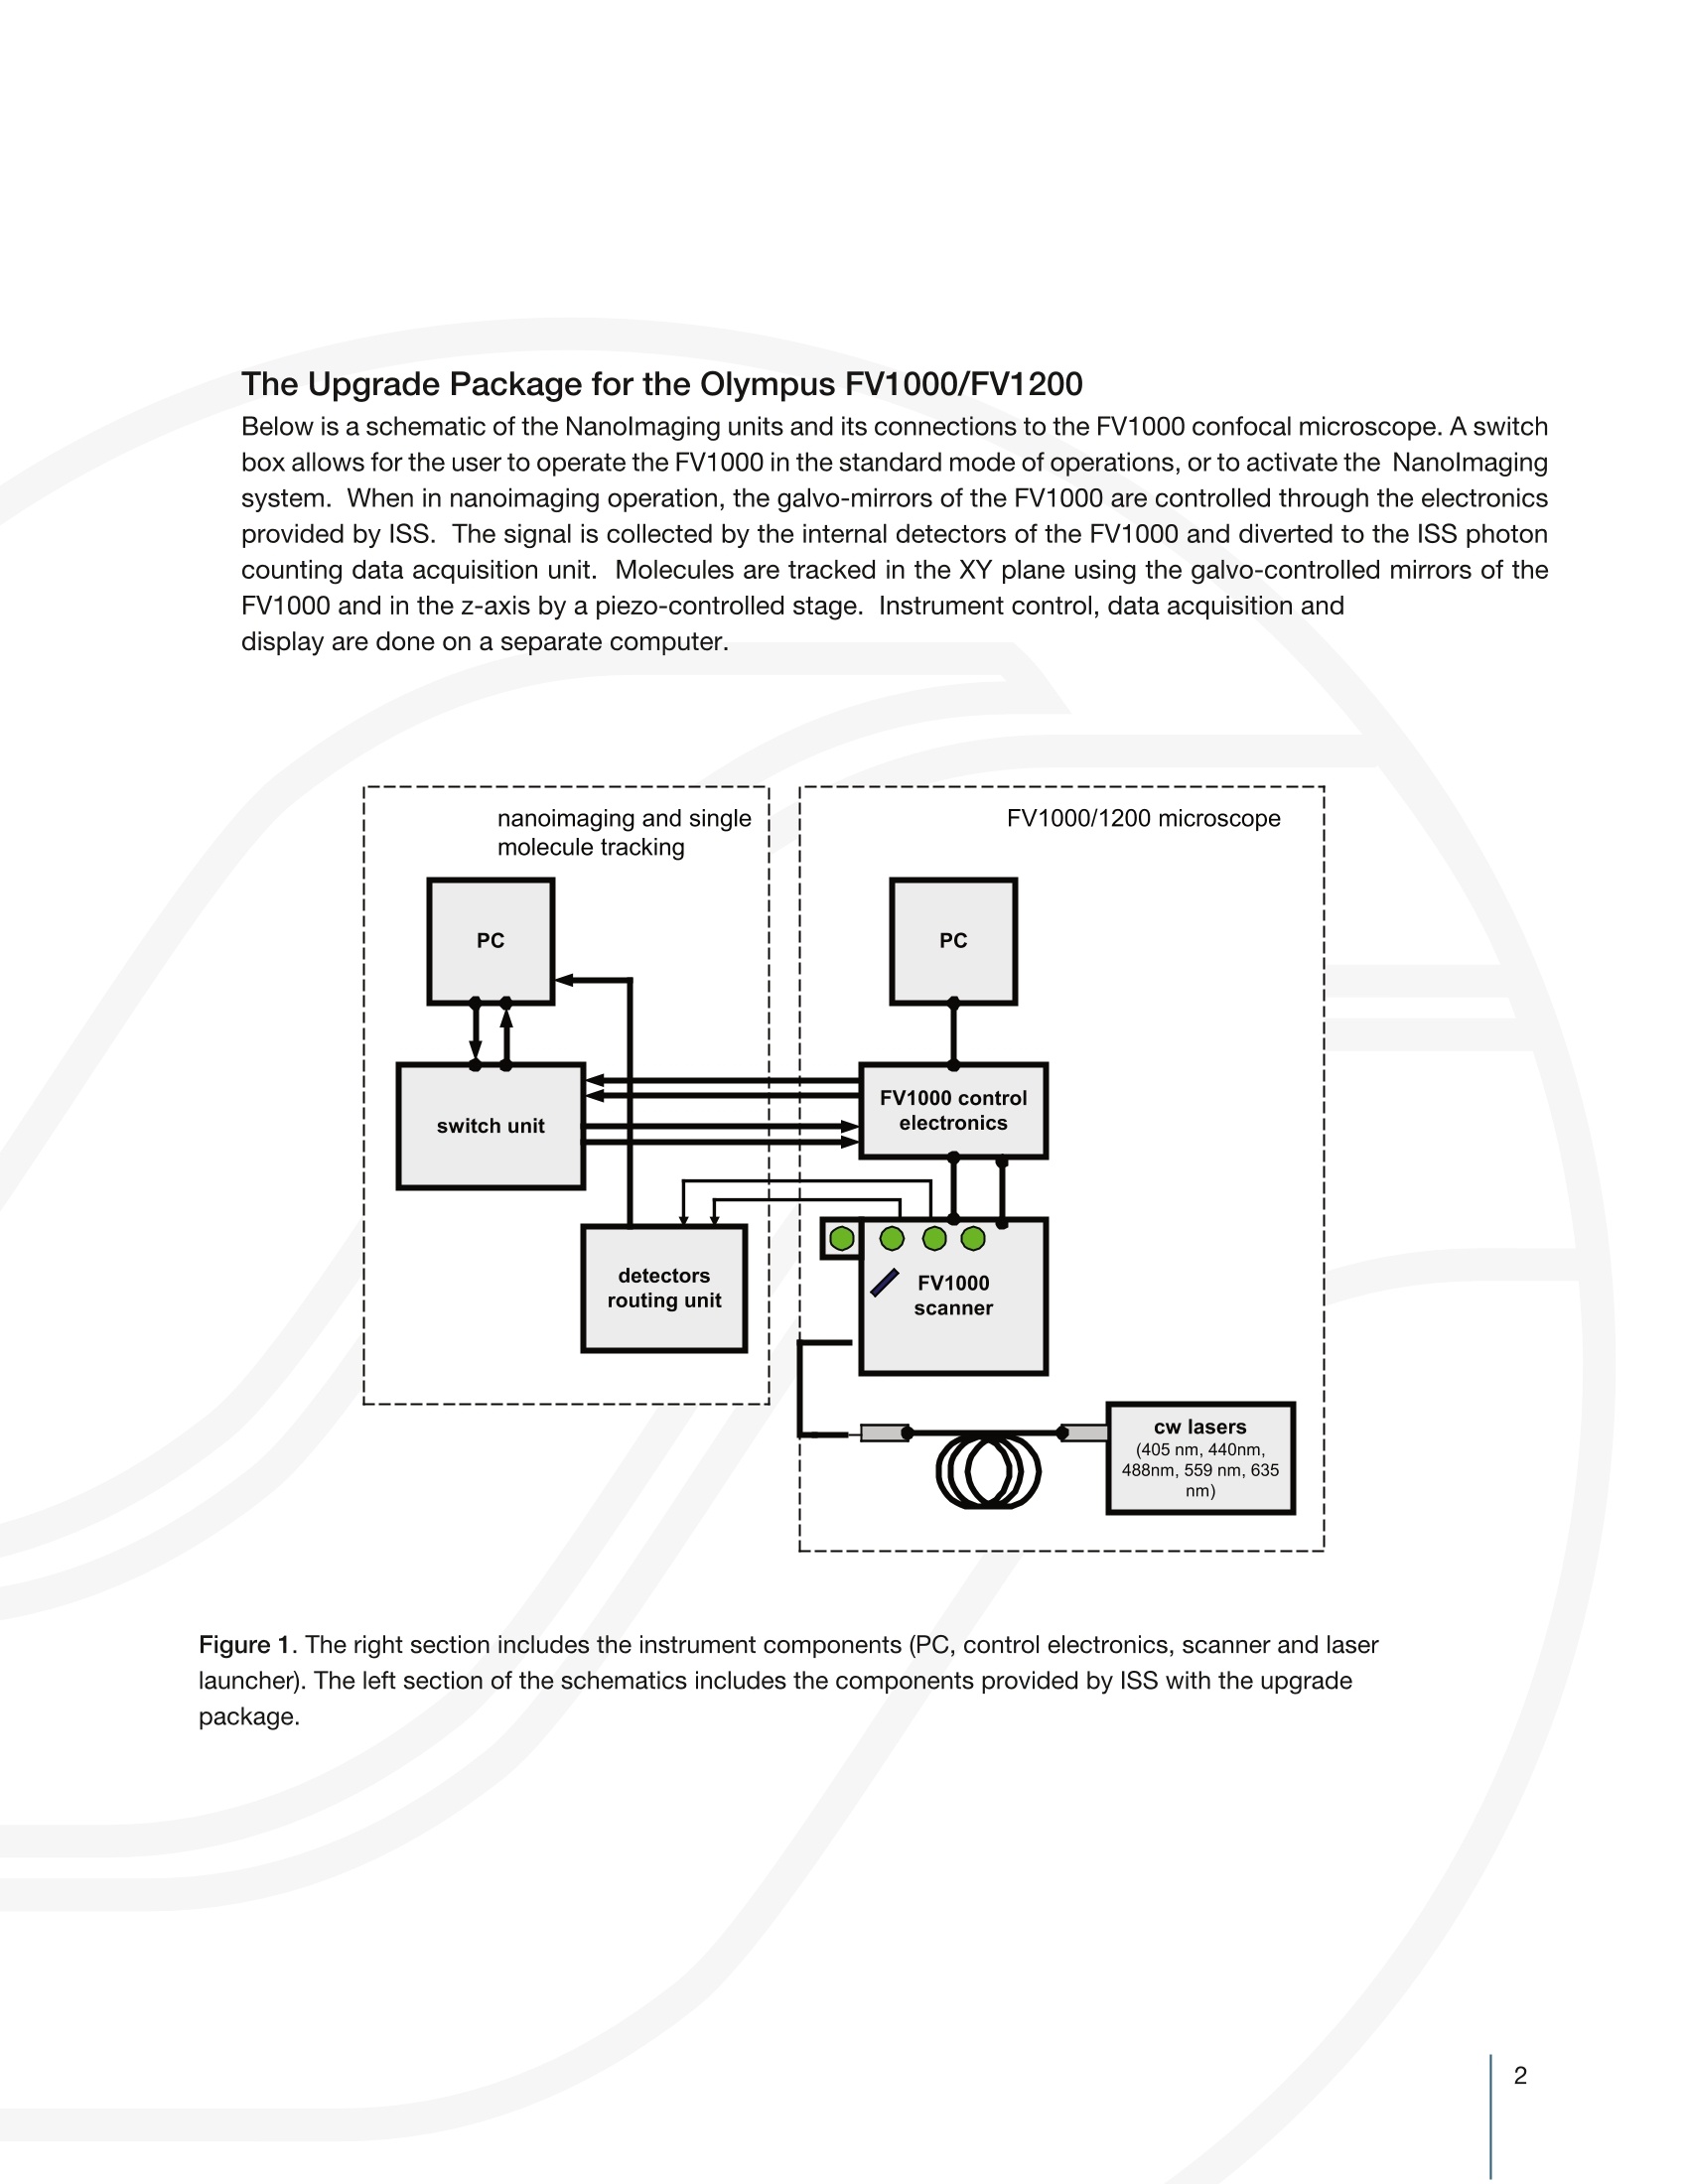
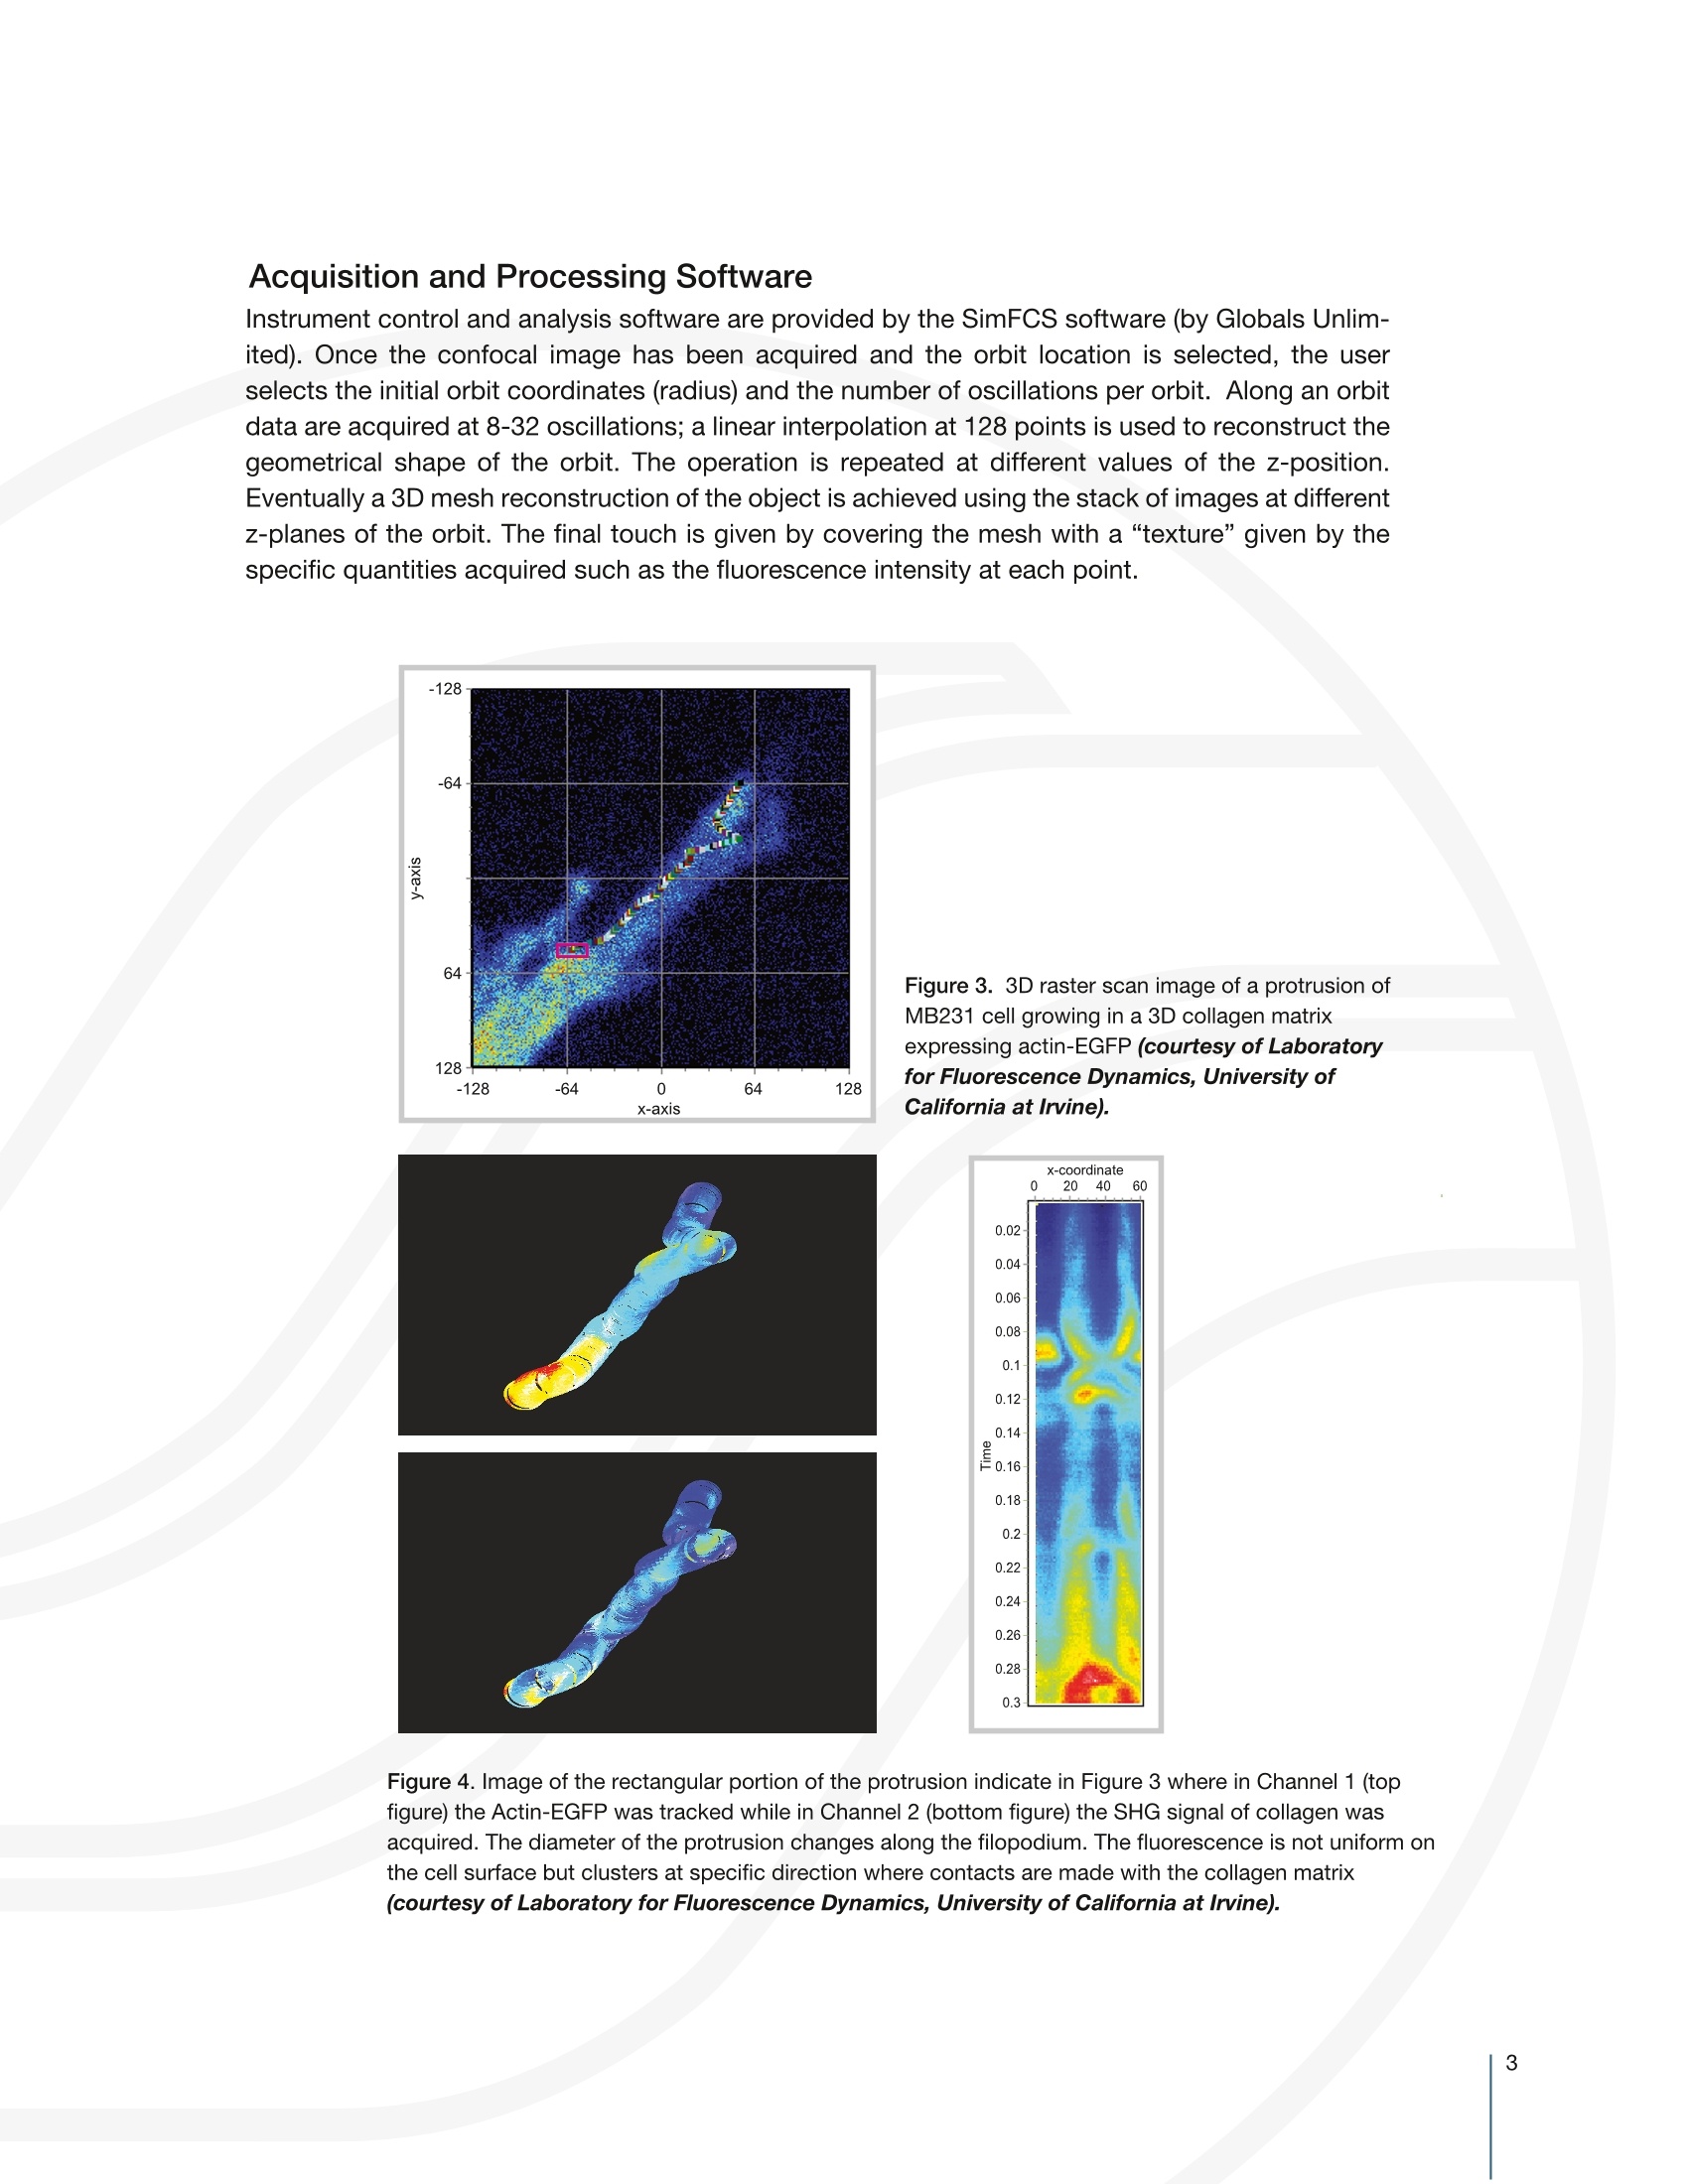
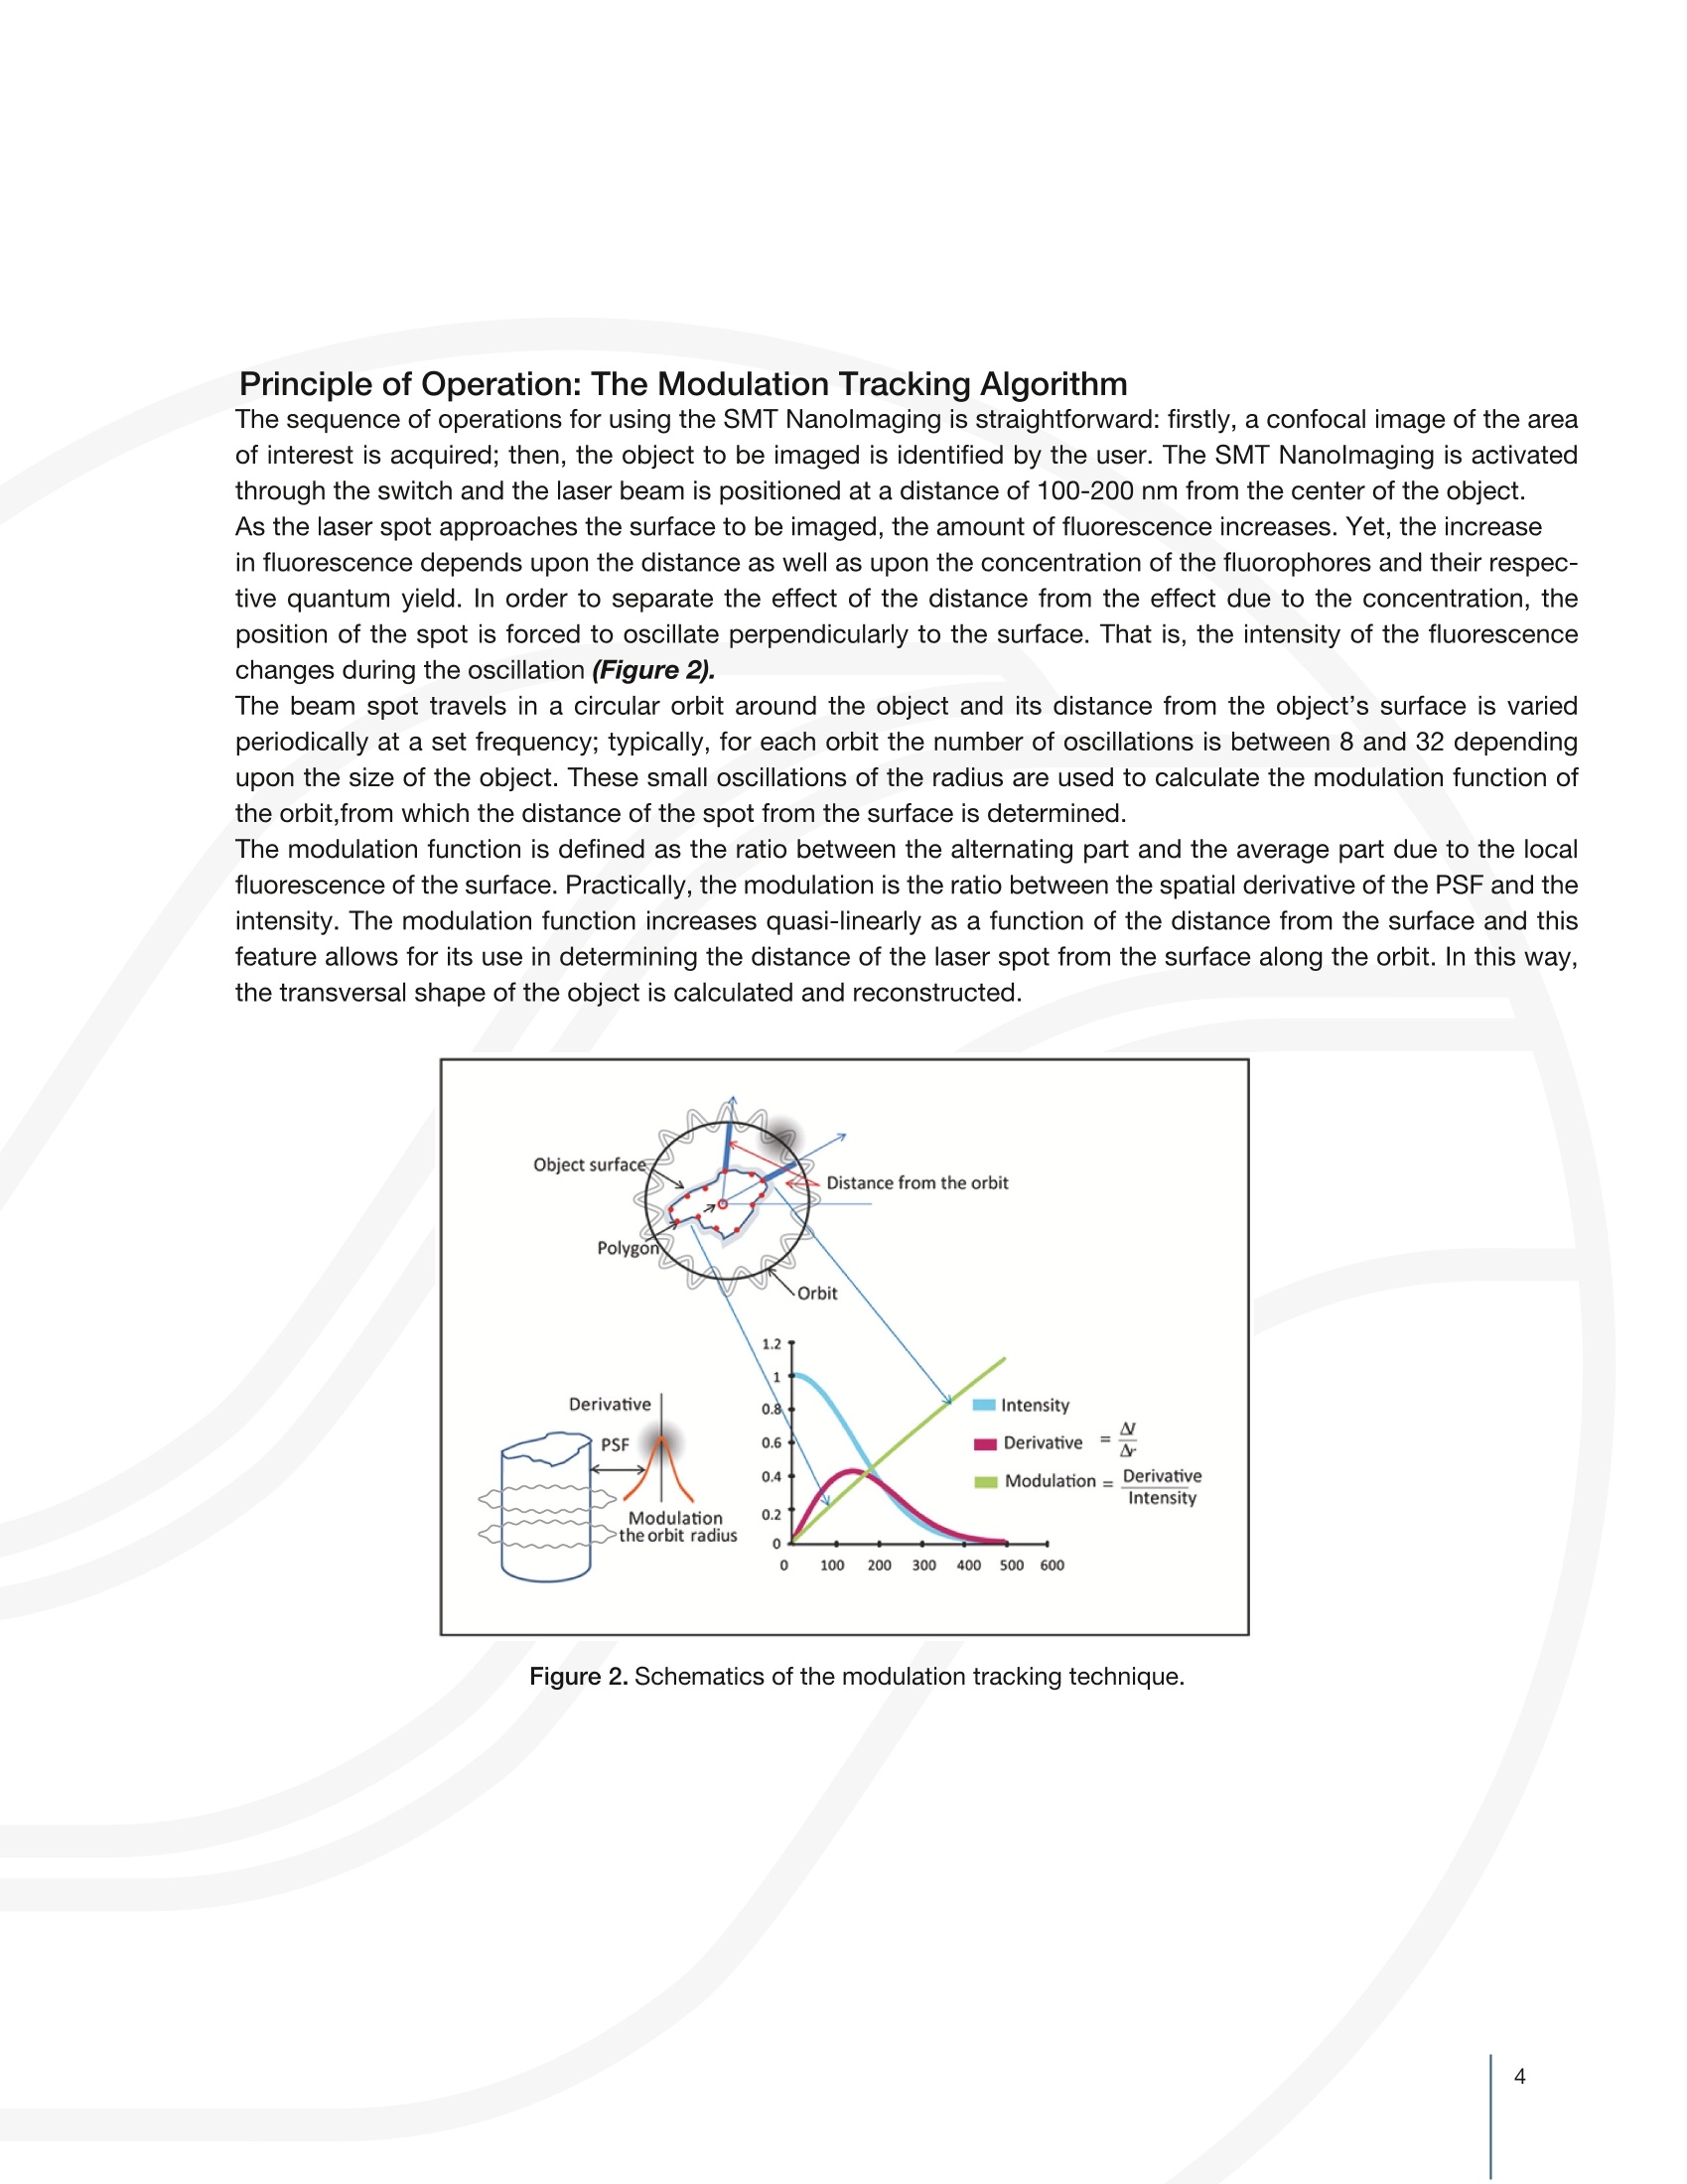
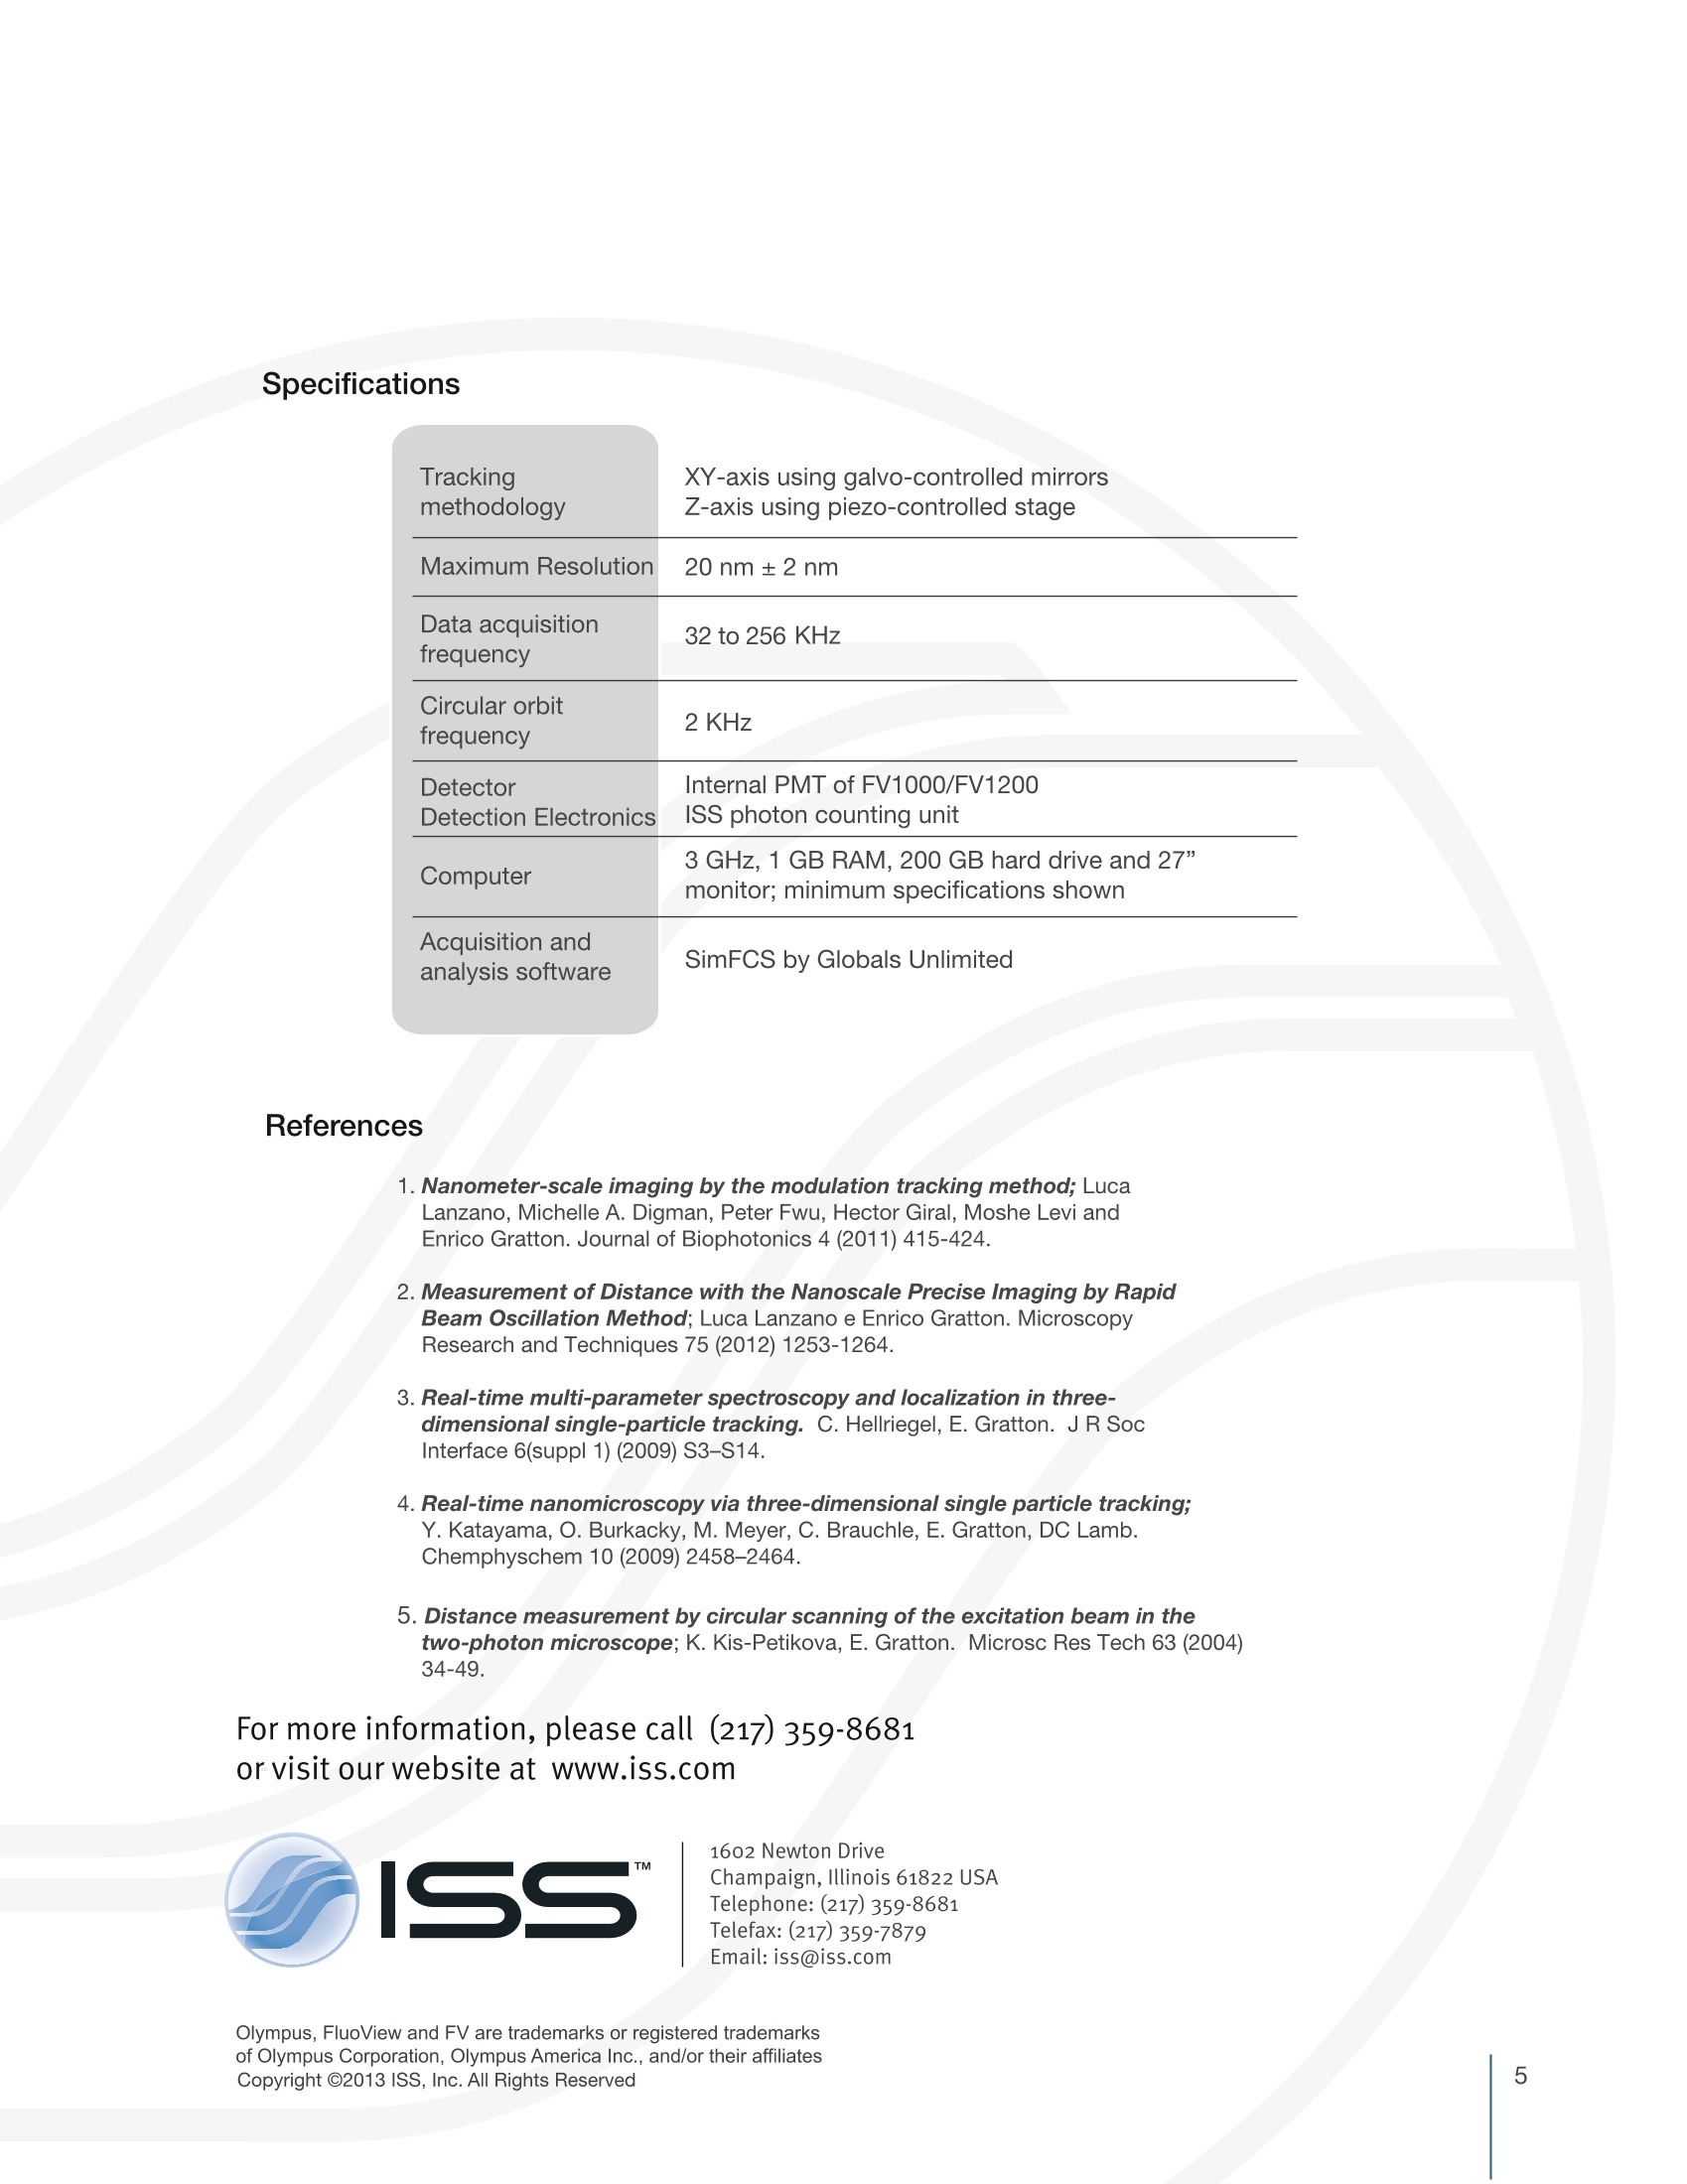
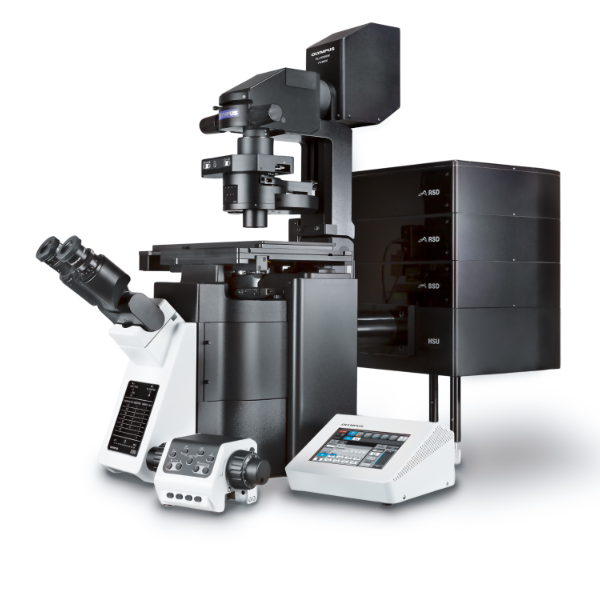
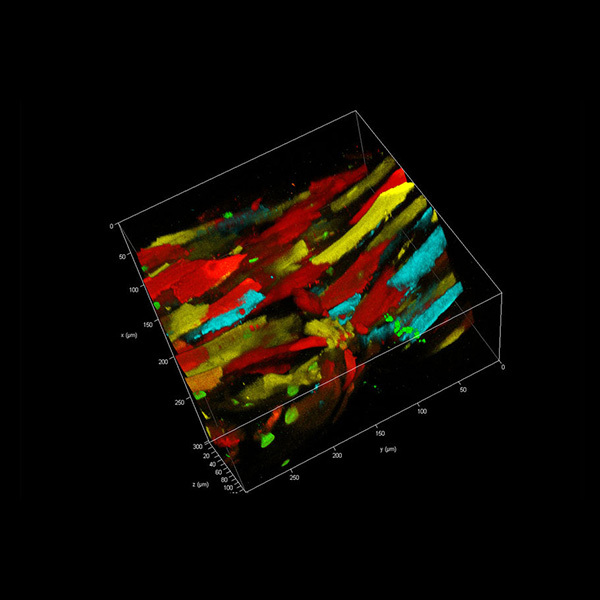
OLYMPUS FLUOVIEW@ FV1000/FV1200 Within the past few years,several methods have beendevised in order to obtainimages with nanometerresolution of cellular featuresusing an optical microscope(STED, PALM, STORM).Although powerful, thesemethods are quite inefficientwhen detecting sparse nano-structures in an image. Alsothey are inadequate to detectthe dynamics of chemicalreactions which occur in thesub-second time scale innanometer-size 3D structures,which are continuously movingand changing shape. The Nanoimaging and Single Molecule Tracking Package With Nanolmaging approach to super-resolution, the laser beam does not scan the sample following apredetermined pattern as is the case in raster images. Instead, the laser scanning imaging is based upona feedback algorithm where the path followed by the laser beam is continuously adjusted and decidedduring the scan according to the shape of the object to be imaged. The algorithm moves the laser spotat a fixed distance from the object’s surface; as the position of the laser spot and its distance from thesurface are known parameters, they are utilized to reconstruct the shape of the object. 3D cellular struc-tures can be resolved down to 20-40 nm with a precision of 2 nm in a matter of a few seconds. The Upgrade Package for the Olympus FV1000/FV1200 Below is a schematic of the Nanolmaging units and its connections to the FV1000 confocal microscope. A switchbox allows for the user to operate the FV1000 in the standard mode of operations, or to activate the Nanolmagingsystem. When in nanoimaging operation, the galvo-mirrors of the FV1000 are controlled through the electronicsprovided by ISS. The signal is collected by the internal detectors of the FV1000 and diverted to the ISS photoncounting data acquisition unit. Molecules are tracked in the XY plane using the galvo-controlled mirrors of theFV1000 and in the z-axis by a piezo-controlled stage. Instrument control, data acquisition anddisplay are done on a separate computer. Figure 1. The right section includes the instrument components (PC, control electronics, scanner and laserlauncher). The left section of the schematics includes the components provided by ISS with the upgradepackage. Acquisition and Processing Software Instrument control and analysis software are provided by the SimFCS software (by Globals Unlim-ited). Once the confocal image has been acquired and the orbit location is selected, the userselects the initial orbit coordinates (radius) and the number of oscillations per orbit. Along an orbitdata are acquired at 8-32 oscillations; a linear interpolation at 128 points is used to reconstruct thegeometrical shape of the orbit. The operation is repeated at different values of the z-position.Eventually a 3D mesh reconstruction of the object is achieved using the stack of images at differentz-planes of the orbit. The final touch is given by covering the mesh with a“texture”given by thespecific quantities acquired such as the fluorescence intensity at each point. Figure 3. 3D raster scan image of a protrusion ofMB231 cell growing in a 3D collagen matrixexpressing actin-EGFP (courtesy of Laboratoryfor Fluorescence Dynamics, University ofCalifornia at Irvine). Figure 4. Image of the rectangular portion of the protrusion indicate in Figure 3 where in Channel 1 (topfigure) the Actin-EGFP was tracked while in Channel 2 (bottom figure) the SHG signal of collagen wasacquired. The diameter of the protrusion changes along the filopodium. The fluorescence is not uniform onthe cell surface but clusters at specific direction where contacts are made with the collagen matrix(courtesy of Laboratory for Fluorescence Dynamics, University of California at Irvine). Principle of Operation: The Modulation Tracking Algorithm The sequence of operations for using the SMT Nanolmaging is straightforward: firstly, a confocal image of the areaof interest is acquired; then, the object to be imaged is identified by the user. The SMT Nanolmaging is activatedthrough the switch and the laser beam is positioned at a distance of 100-200 nm from the center of the object. As the laser spot approaches the surface to be imaged, the amount of fluorescence increases. Yet, the increase in fluorescence depends upon the distance as well as upon the concentration of the fluorophores and their respec-tive quantum yield. In order to separate the effect of the distance from the effect due to the concentration, theposition of the spot is forced to oscillate perpendicularly to the surface. That is, the intensity of the fluorescencechanges during the oscillation (Figure 2). The beam spot travels in a circular orbit around the object and its distance from the object’s surface is variedperiodically at a set frequency; typically, for each orbit the number of oscillations is between 8 and 32 dependingupon the size of the object. These small oscillations of the radius are used to calculate the modulation function ofthe orbit,from which the distance of the spot from the surface is determined. The modulation function is defined as the ratio between the alternating part and the average part due to the localfluorescence of the surface. Practically, the modulation is the ratio between the spatial derivative of the PSF and theintensity. The modulation function increases quasi-linearly as a function of the distance from the surface and thisfeature allows for its use in determining the distance of the laser spot from the surface along the orbit. In this way,the transversal shape of the object is calculated and reconstructed. Figure 2. Schematics of the modulation tracking technique. Specifications Tracking methodology XY-axis using galvo-controlled mirrors Z-axis using piezo-controlled stage Maximum Resolution 20 nm ±2 nm Data acquisitionfrequency 32 to 256 KHz Circular orbittrequency 2 KHz DetectorDetection Electronics Internal PMT of FV1000/FV1200ISS photon counting unit Computer 3 GHz, 1 GB RAM, 200 GB hard drive and 27” monitor; minimum specifications shown Acquisition andanalysis software References 1. Nanometer-scale imaging by the modulation tracking method; LucaLanzano, Michelle A. Digman, Peter Fwu, Hector Giral, Moshe Levi andEnrico Gratton. Journal of Biophotonics 4 (2011)415-424. 2. Measurement of Distance with the Nanoscale Precise Imaging by RapidBeam Oscillation Method; Luca Lanzano e Enrico Gratton. MicroscopyResearch and Techniques 75 (201) 1253-1264. 3. Real-time multi-parameter spectroscopy and localization in three-dimensional single-particle tracking. C. Hellriegel, E. Gratton. J R SocInterface 6(suppl 1) (2009) S3-S14. 4. Real-time nanomicroscopy via three-dimensional single particle tracking;Y. Katayama, O. Burkacky, M. Meyer, C. Brauchle, E. Gratton, DC Lamb.Chemphyschem 10 (2009) 2458-2464. 5. Distance measurement by circular scanning of the excitation beam in thetwo-photon microscope; K. Kis-Petikova, E. Gratton. Microsc Res Tech 63 (2004)34-49. For more information, please call (217) 359-8681or visit our website at www.iss.com 1602 Newton DriveChampaign, Illinois 61822 USATelephone: (217) 359-8681Telefax: (217) 359-7879 Email: iss@iss.com Olympus, FluoView and FV are trademarks or registered trademarksof Olympus Corporation, Olympus America Inc., and/or their affiliatesCopyright C2013 ISS, Inc. All Rights Reserved 在过去的几年里,人们已经设计了几种方法来使用光学显微镜(STED,PALM,STORM)获得具有纳米分辨率的细胞特征图像。这些方法虽然功能强大,但在检测图像中稀疏的纳米结构时却相当缺乏效率。同时,它们也不足以探测纳米级三维结构中亚秒级的化学反应动力学,这些结构是不断移动和改变形状的,激光束不会像光栅图像那样按照预定模式扫描样品。相反,激光扫描成像基于反馈算法,在扫描期间,根据要成像的物体的形状,连续地调整和确定激光束跟随的路径。该算法将激光光斑移动到离物体表面一定距离的位置,由于激光光斑的位置和离物体表面的距离是已知的参数,所以利用这些参数来重建物体的形状。三维细胞结构可以在几秒钟内分辨率达到20-40纳米,精度为2纳米。采集和处理软件仪器控制和分析软件由SimFCS软件(Globals Unlimited)提供。一旦获得共焦图像并选择了轨道位置,用户就可以选择初始轨道坐标(半径)和每个轨道的振荡次数。沿轨道的数据是在8-32次振荡时获得的;在128个点处使用线性插值来重建轨道的几何形状。在z位置的不同值处重复该操作。利用轨道不同z面上的图像叠加,实现了目标的三维网格重建。通过在网格上覆盖一个由特定数量(如每个点的荧光强度)给出的“纹理”(texture)来实现鳍部接触。
确定
还剩3页未读,是否继续阅读?

产品配置单
天津东方科捷科技有限公司为您提供《细胞及微结构中荧光,FCS检测方案 》,该方案主要用于其他中生化检验检测,参考标准--,《细胞及微结构中荧光,FCS检测方案 》用到的仪器有ISS 三维纳米成像及单分子跟踪套件
推荐专场
相关方案
更多