


N2O是一种重要的温室气体,其全球增温潜势是CO2的300倍。农田生态系统是大气的主要来源。此时,氮元素的来源就成为了非常有意义的参数,通过同位素分馏的现象来判断来源成为了热门分析手段。研究表明N同位素在各类土壤和水体中存在重合的情况,那么引入O同位素就显得尤为重要。目前,国内外主要的研究方法是细菌反硝化方法,他们是怎么通过Elementar元素分析仪+气体浓缩仪+同位素质谱联用系统实现的呢?详细请查阅附件内容
方案详情

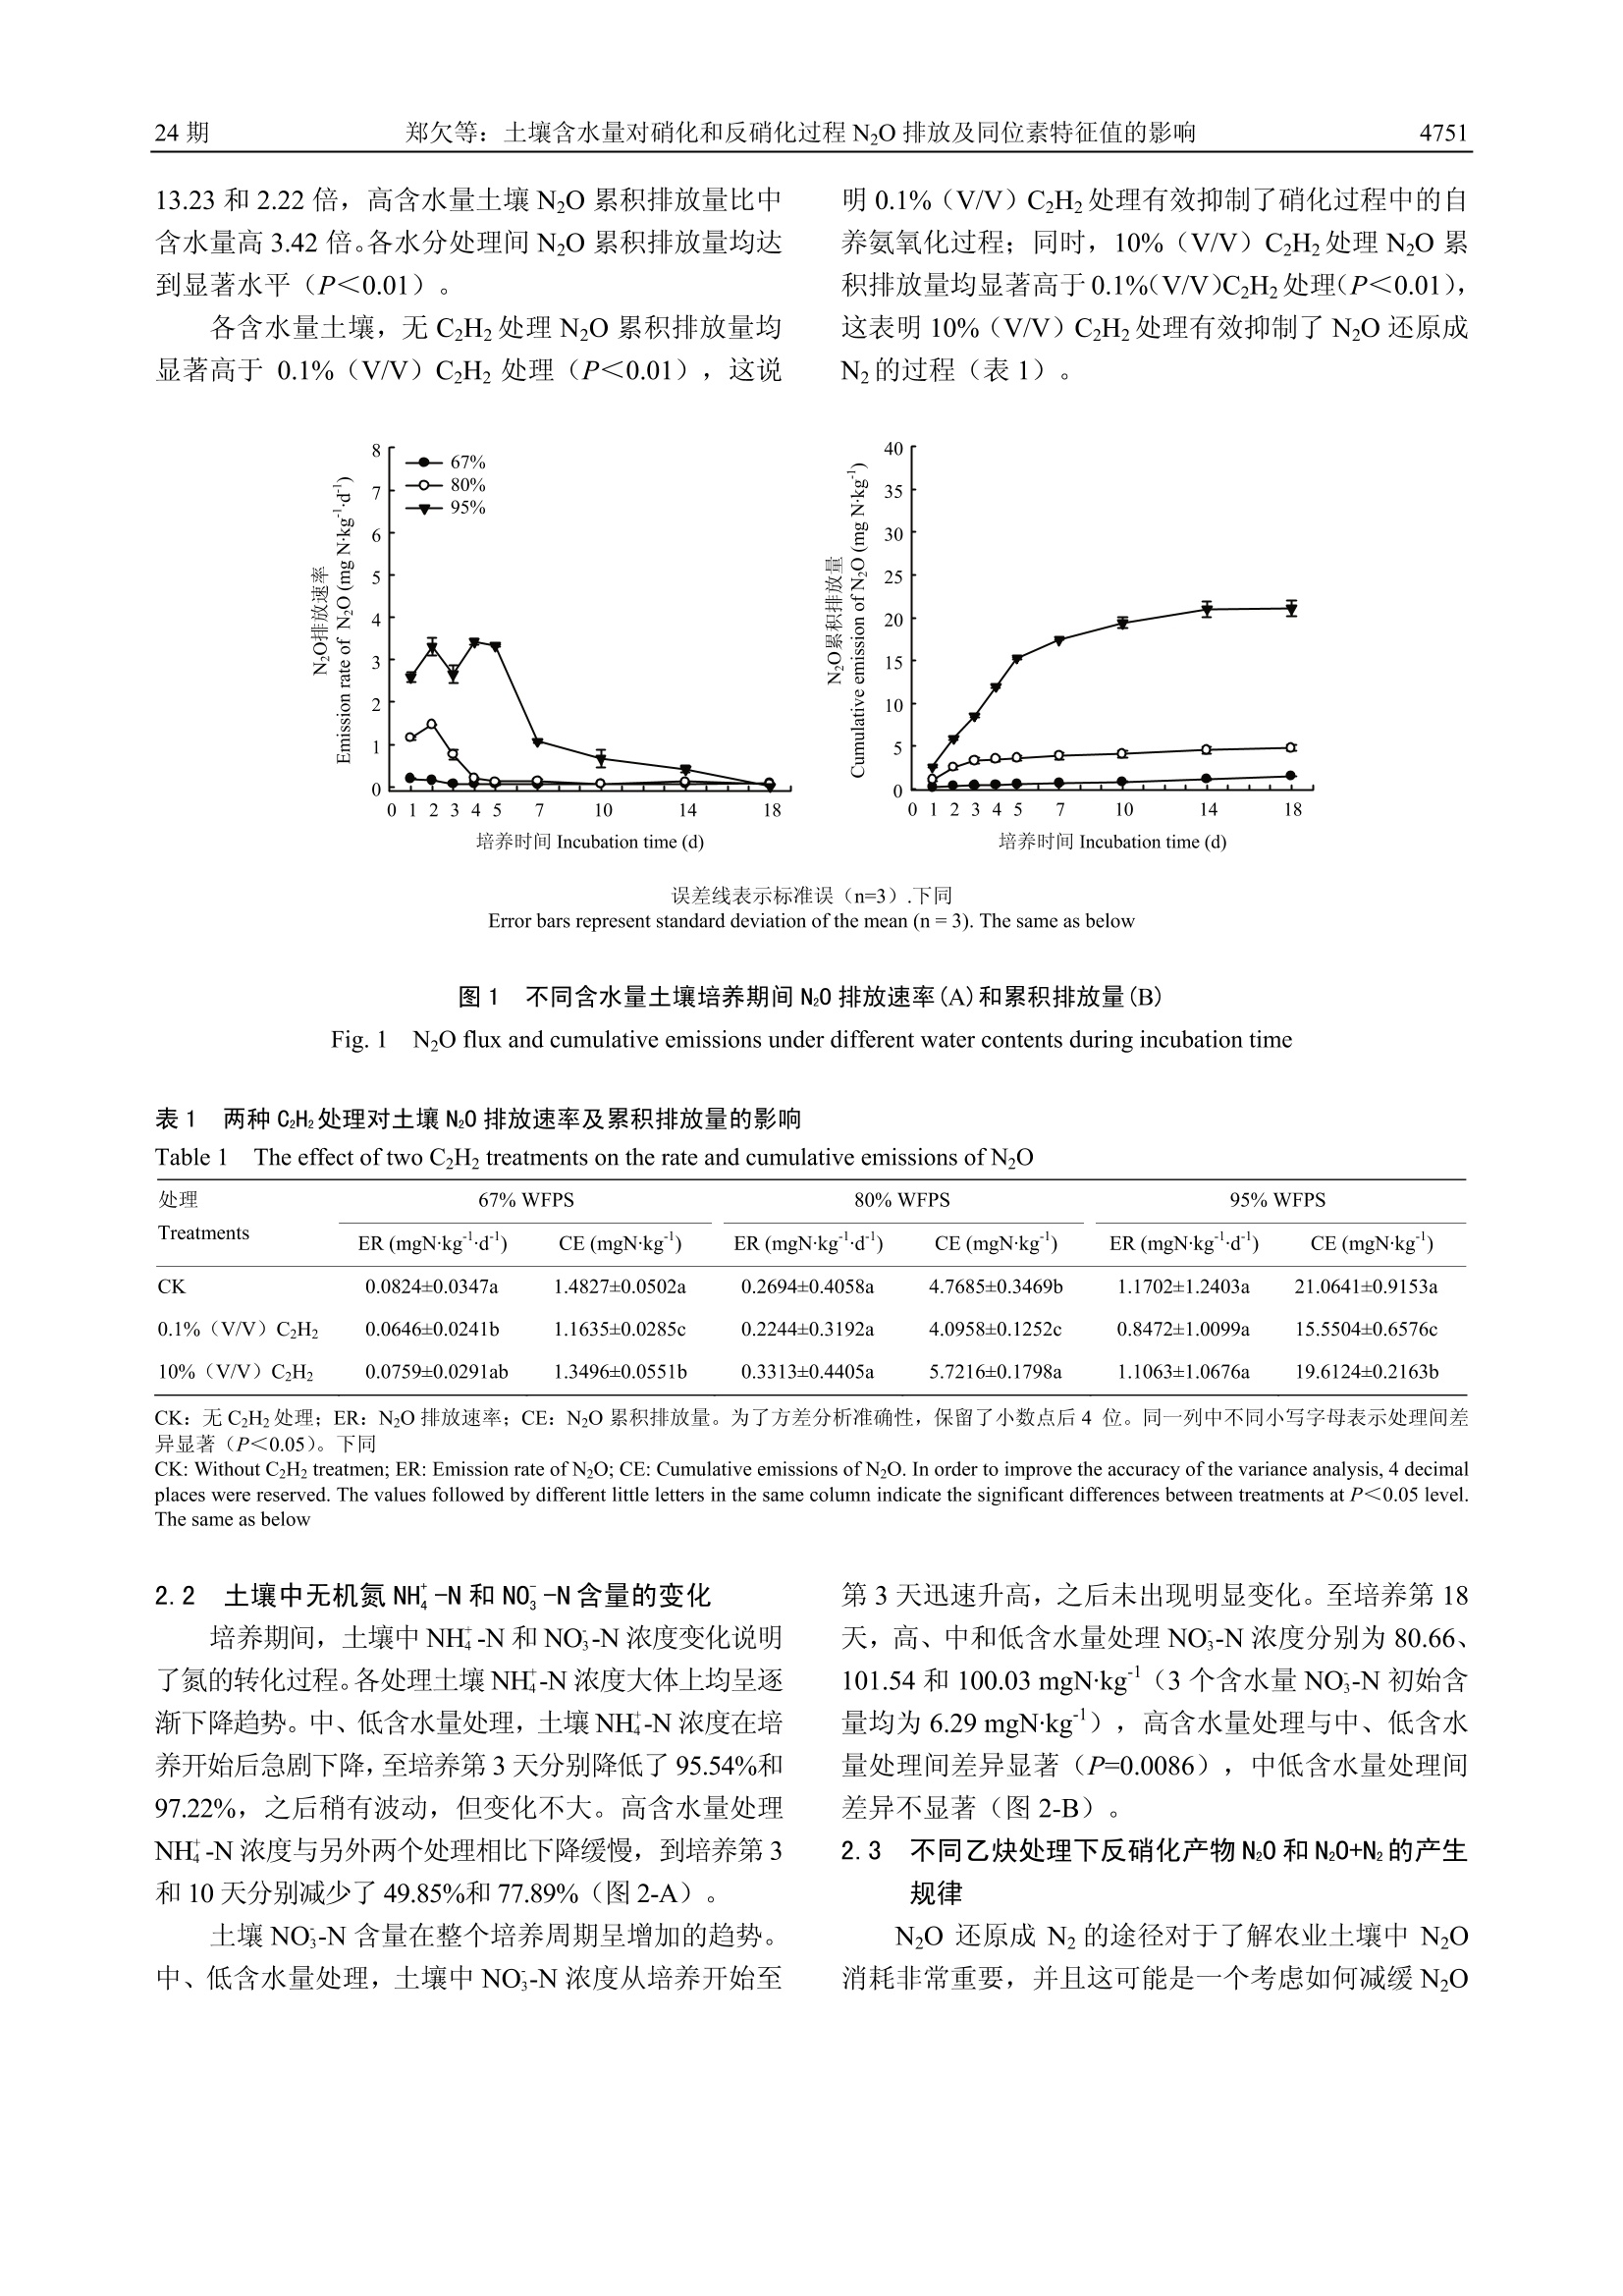
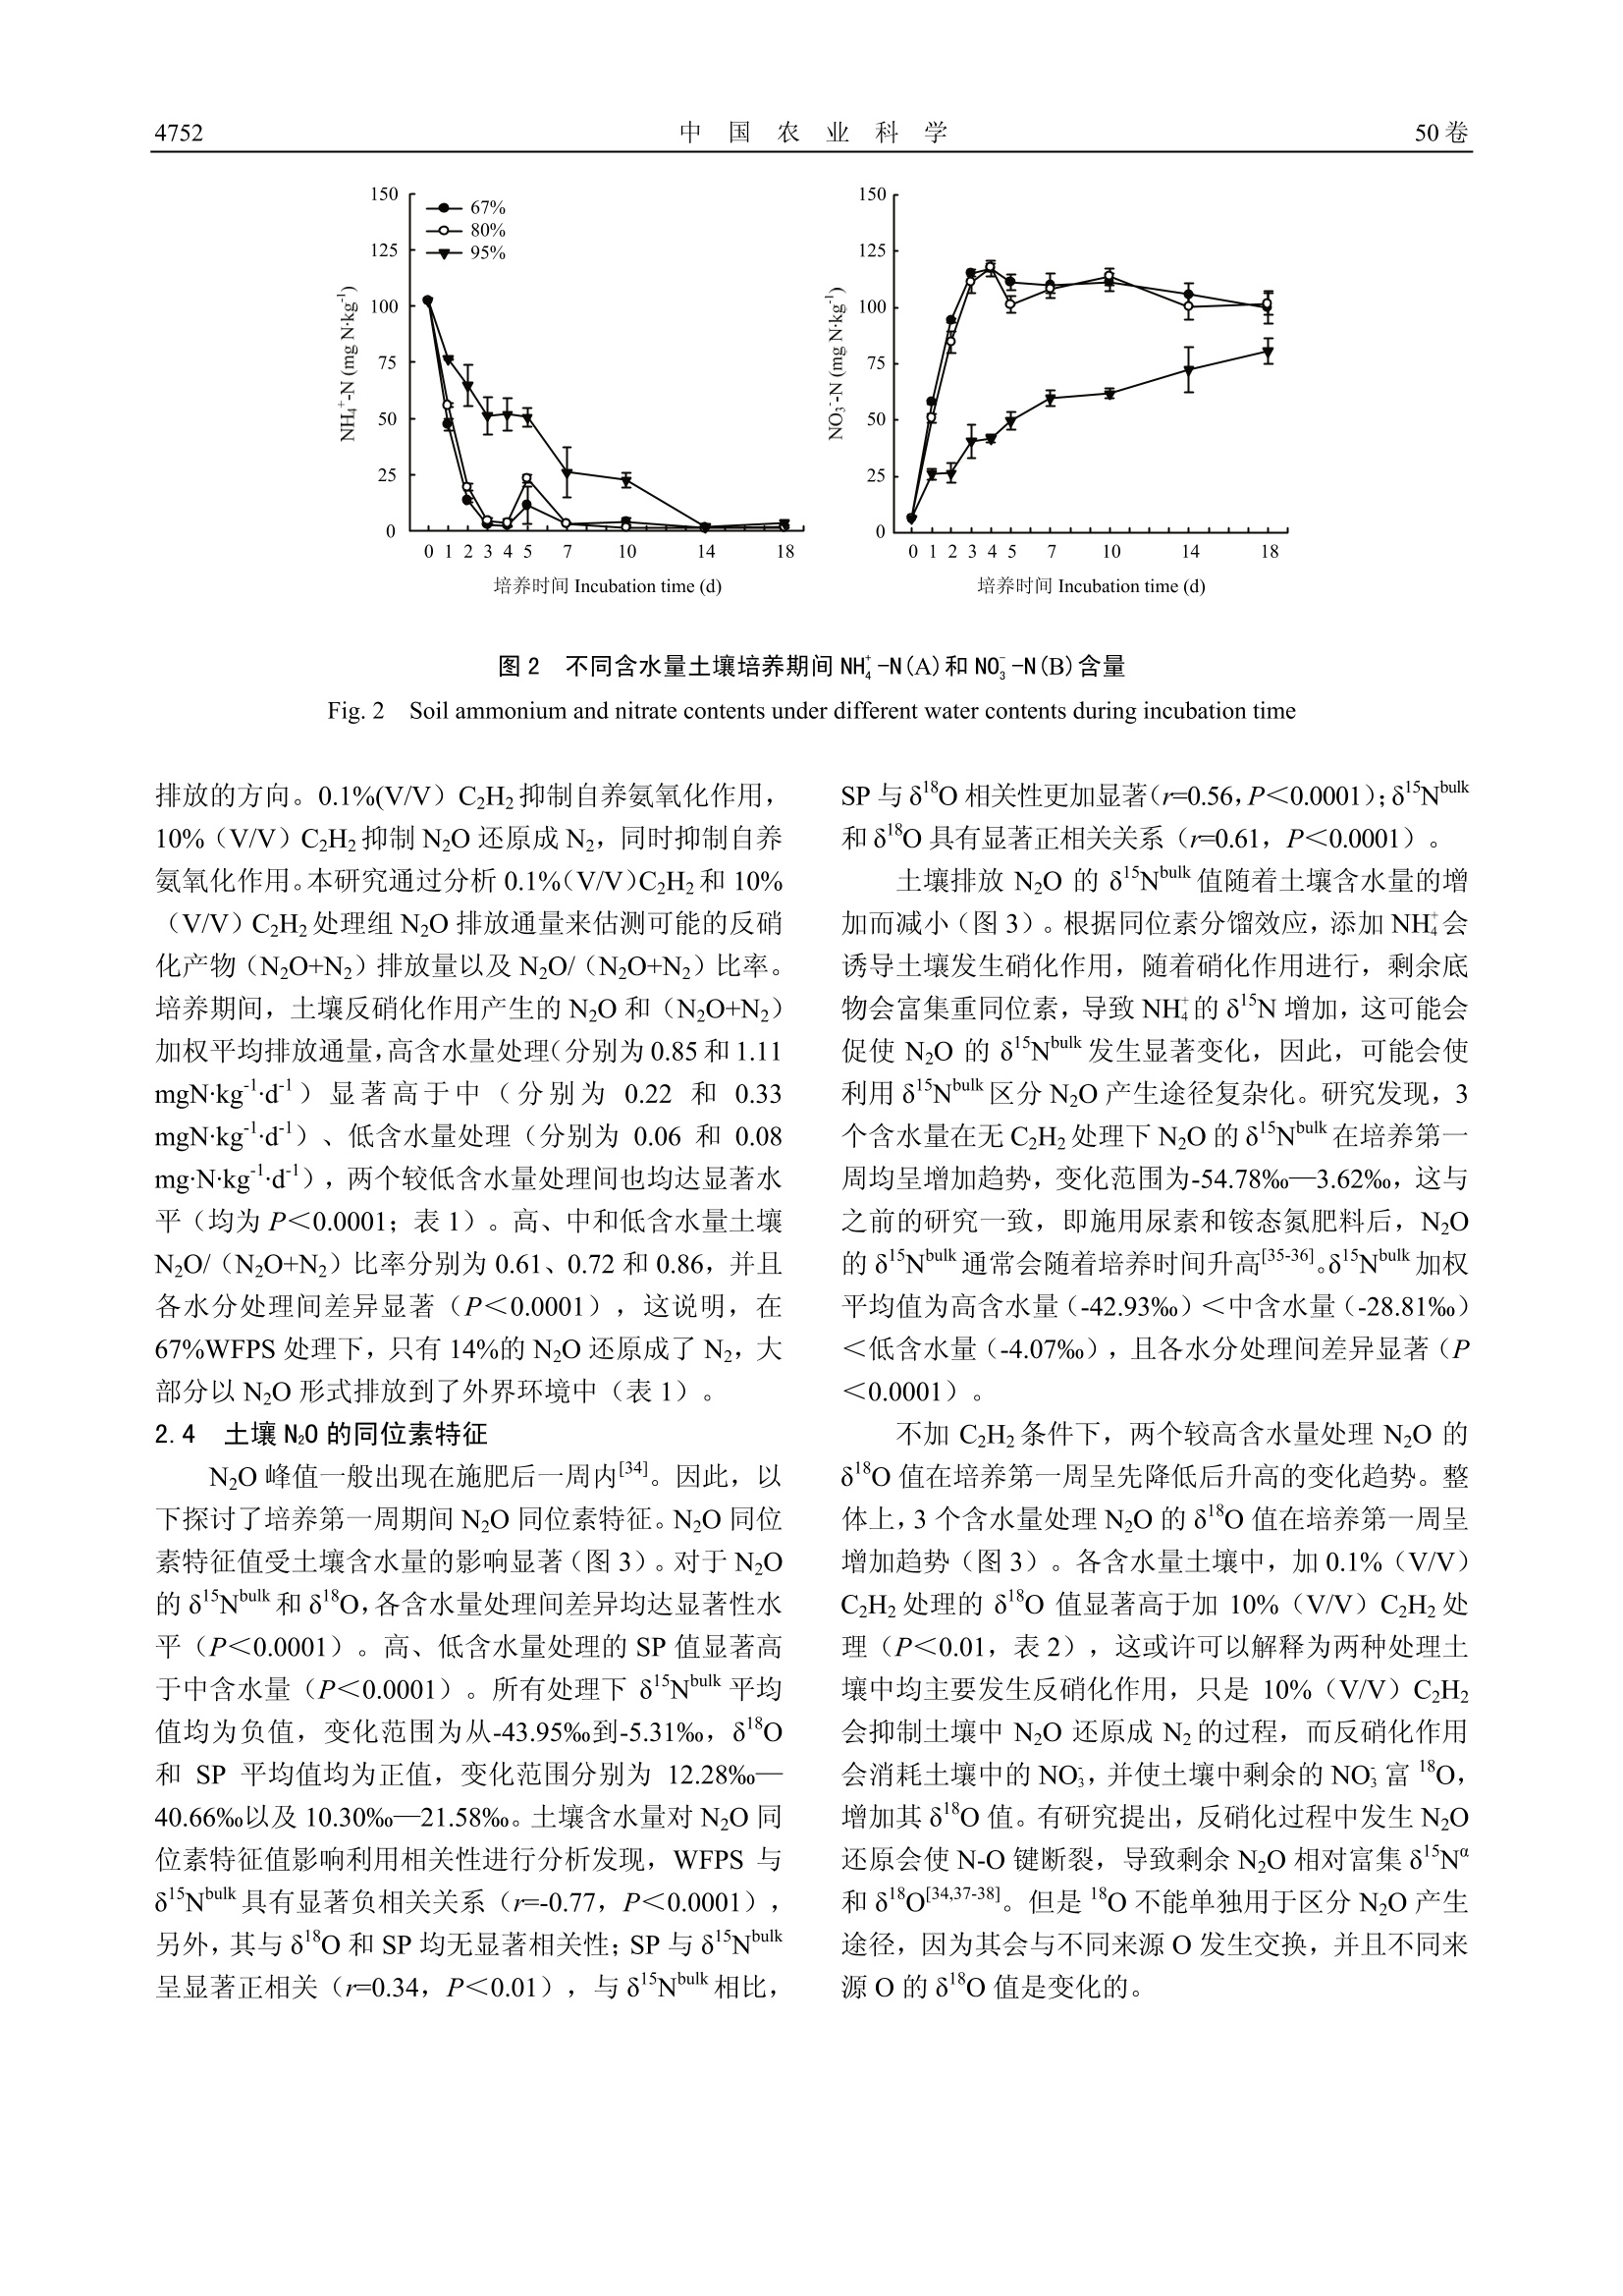
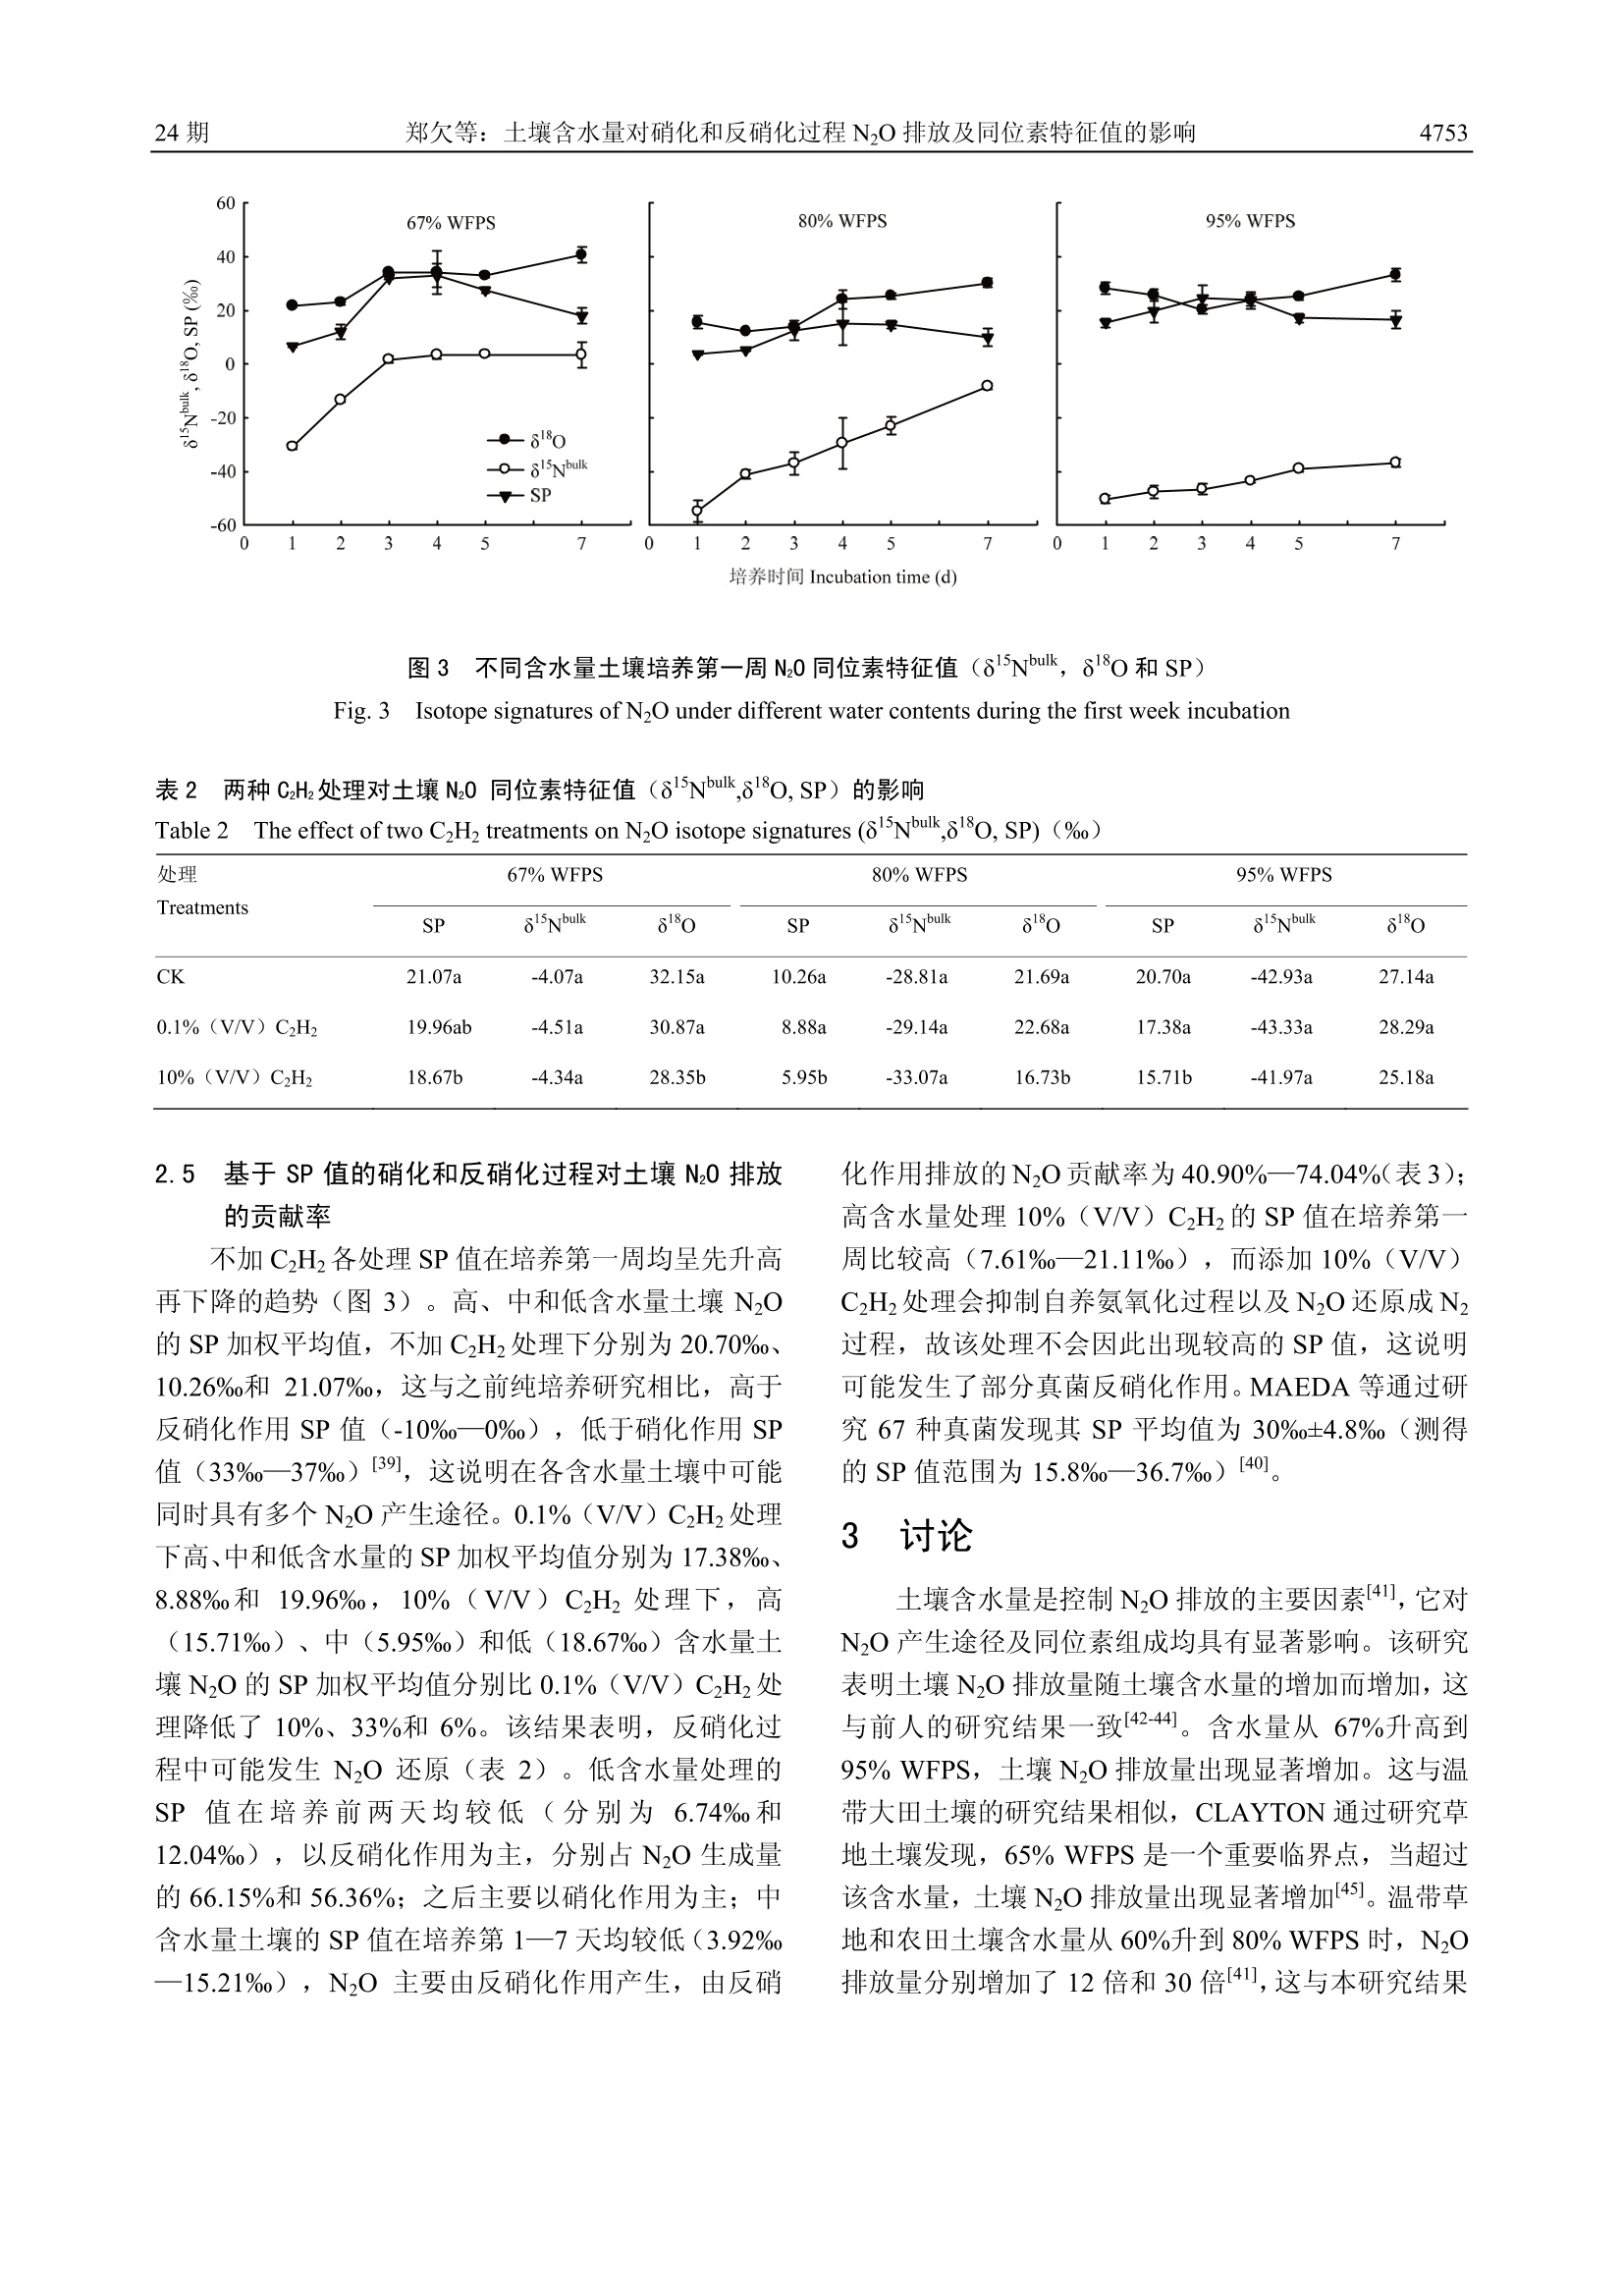
中国农业科学2.2017,50(24):4747-4758Scientia Agricultura Sinicadoi: 10.3864/j.issn.0578-1752.2017.24.008 中 国 农 业 科学50卷4748 土壤含水量对硝化和反硝化过程 N20 排放及同位素特征值的影响 郑欠; 丁军军',李玉中12,林伟,徐春英,李巧珍,毛丽丽 (中国农业科学院农业环境与可持续发展研究所/农业部旱地节水农业重点实验室,北京100081;2中国农业科学院环境稳定同位素实验室,北京100081) 摘要:【目的】通过室内培养试验,研究不同含水量对北京顺义潮褐土 N20 排放及同位素特征值(8Nbulk,810和 nitrogen isotopomer site preference of N0, 简称 SP)的影响,以期获得不同水分条件下土壤N20产生途径及变化规律,为农田土壤 N20 减排提供理论依据。【方法】结合稳定同位素技术与乙炔抑制法,以北京顺义潮褐土为试材,设置3个含水量梯度:67%、80%和 95% WFPS(土壤体积含水量与总孔隙度的百分比或实际重量含水量与饱和含水量的百分比,简称 WFPS), 在此基础上设置无 CHz, 0.1%(V/V) CHz和10%(V/V)CzHz处理。将土壤装入培养瓶中培养2h,之后收集培养瓶中的气体测定 N20 浓度及同位素特征值,并采集土样测定其 NH*-N 和 NO, -N的含量。利用同位素二源混合模型计算硝化和反硝化作用对土壤 N20 排放的贡献率,对 N20 产生途径进行量化分析。【结果】根据室内土壤培养测定结果,高(95%WFPS)、中(80%WFPS)和低(67% WFPS)含水量土壤 N20 加权平均排放通量分别为1.17、0.27和 0.08 mgNkgd,高含水量土壤N20排放量均显著高于中、低含水量处理,中含水量处理显著高于低含水量;整个培养周期,高、中和低含水量土壤 N20+Nz累积排放量分别为培养初期总的无机氮含量的18.05%、5.27%和1.24%(N20+Nz累积排放量分别为19.61、5.72和1.35mgNkg;各处理 NH*-N+NO,-N初始含量均为108.62 mgN.kg);与低含水量处理相比,高、中含水量土壤的 N20+Nz累积排放量分别增加了13.53倍和3.24倍,高含水量土壤 N20+Nz累积排放量比中含水量高2.43倍,表现为随着含水量的增加,土壤无机氮(NH*-N+NO,-N)以气态氮(N0+Nz)形式的损失量逐渐增加。3个含水量处理 N20的8Nbulk加权平均值变化范围为-42.93%0-4.07%,且较高含水量处理显著低于较低含水量处理;10%(V/V) CzHz抑制土壤中 N20还原成Nz的过程,各含水量土壤中, 10%(V/V)CzHz处理组其 N20的80值显著低于 0.1%(V/V) CzHz处理组, 且N20/(N20+Nz)比率随土壤含水量增加而降低;各处理土壤中同时存在多个N20产生过程,对于培养第一周,土壤产生的 N20 的 SP值于培养前4d呈逐逐增加的趋势,之后又逐渐降低,低含水量土壤在第1襄2天产生的 N20 的 SP值为6.74%12.04%,反硝化作用对土壤 N20 排放的贡献率为56.36%一66.15%,此培养阶段表现为土壤主要通过反硝化作用产生Nz0,之后,硝化作用贡献率(55.78%一100%)增强;中含水量土壤N20的SP加权平均值为10.26%,该土壤中反硝化作用(40.90%-74.04%)占据主导地位;加10%(V/V) CzHz的高含水量处理,在整个培养第一周均具有较高的 SP值,变化范围为7.61%21.11%;与0.1% (V/V) CzHz处理组相比,10%(V/V) CzHz处理的高、中和低含水量土壤排放 N20 的 SP加权平均值分别降低了0.10倍、0.33倍和0.06倍。【结论】土壤含水量增加促进N2O排放,高含水量处理中 N20 排放量最高。67%WFPS 处理中, N0 排放前期以反硝化作用为主,后期以硝化作用为主; 80%WFPS 处理中, N20主要由反硝化过程产生;95% WFPS处理中,N20排放以硝化作用为主。 关键词:土壤孔隙含水量;Nz0;硝化作用;反硝化作用;稳定同位素;同位素位嗜值 ( 收稿日期:2017-06-06; 接 受日期:2017-08-15 ) ( 基金项目:国家自然科学基金(41473004)、国家自然科学青年 基 金(41301553) ) ( 联系方式:郑欠, T el: 1 3273 2 30892; E-mail: 132 7 3230892@163 . com。通信作 者 李玉中, T e l : 1 88108716 2 9; E-mail: l iyuzho n g@caas.cn ) The Effects of Soil Water Content on N2O Emissions and IsotopicSignature of Nitrification and Denitrification ZHENG Qian, DING JunJun, LIYuZhong,LIN Wei, XU ChunYing, LI QiaoZhen,MAO LiLi ('Institue ofEnvironment and Sustainable Development in Agriculture, Chinese Academy of Agricultural Sciences/Key Laboratory ofDryland Farming Agriculture, Ministry of Agriculture, Beijing 100081;Environmental Stable Isotope Laboratory, Chinese AcademyofAgricultural Sciences, Beijing 100081) Abstract: 【Objective】 The objective of this paper is to understand the contribution of microbial processes to N20 productionand its changing rules under different water contents to provide a theoretical basis for reducing agricultural N2O emissions.【Method】A microcosm experiment was performed to investigate the effects of different water-filled pore space on N20 emissionsand isotopic signatures (81nibulk, 818o and nitrogen isotopomer site preference of N20) of soil at Shunyi district, Beijing. The studycombined stable isotope technique and gas inhibitor method to analyze N20 flux and its isotope signatures that emitted from soil. Theexperiment was set up three different water content levels, including 67%, 80% and 95% WFPS, and with three inhibitor levels,(without C2H2, with 0.1%(V/V) C2H2 and with 10%(V/V) C2H2). After two hours incubation, the soil samples were collected todetermine the concentrations of NH-N and NO,-N. The gas samples were collected to determine the isotope signatures, and the twoend-members mixing model was applied to quantify the respective contributions of microbial processes to N20 production. 【Result】According to the incubation of the soil, the weighted average NO flux of 95%, 80% and 67% WFPS were 1.17, 0.27 and 0.08mgN·kg d, respectively, and the N20 emissions of 95% WFPS were significantly higher than that of both 80% and 67%WFPS, aswell as the N20 emissions of 80% WFPS were significantly higher than that of 67% WFPS. The cumulative emissions of (N2O+N2)in 95%, 80% and 67% WFPS were 18.05%, 5.27%, and 1.24% of initial mineral nitrogen, respectively, over the entire incubationperiod. The cumulative emissions of (N2O+N2) were 19.61, 5.72 and 1.35 mgNkg,respectively; the initial content of NH-N+NO,-N was 108.62 mgNkg. Compared with 67% WFPS, the cumulative (N2O+N2) emissions of 95% and 80% WFPS increased 13.53and 3.24 times, respectively. The cumulative emissions of (N2O+N2) in 95% WFPS was 2.43 times greater than that of 80% WFPS.The values of reduced NH-N+NO,-N as gaseous nitrogen increased with the increase of the water content. The weighted average8nbulk values varied from -42.93%o to -4.07%o, and the higher level of soil water content showed significantly higher N,Oemissions. 10%(V/V) C2H would inhibit the reduction of N0 to N2. The 80 values with 10% (V/V) C2H2 were significantlysmaller than that of with 0.1% (V/V) C2H2 in three water content levels. And the ratio ofN2O/(N2O+N2) reduced with the increaseof soil moisture. Multiple N2O processes occurred simultaneously in all treatments. The values of SP increased during the initialfour days and then decreased gradually with incubation time. The SP values of 67%WFPS treatment at the first two days rangedfrom 6.74%o to 12.04%o, and the contribution of denitrification to N20 production was from 56.36% to 66.15%, suggesting thatdenitrification was the dominant microbial process, then the contribution of nitrification (55.78%-100%) to N20 production becamegreater. The weighted average SP value was 10.26%o in 80% WFPS treatment, indicating denitrification (40.90%-74.04%) was themajor N20 production process. There were larger SP values in 95% WFPS treatment with 10% (V/V) C2H2 in the first sevenincubation days, ranged from 7.61%o to 21.11%o. Compared with 0.1% (V/V) C2H2, the weighted average SP values of N20 under95%,80% and 67% WFPS treatments with 10% (V/V) C2H2 produced from soil reduced by 0.10, 0.33 and 0.06 times respectively.【Conclusion】 The increase of soil water content promotes N2O emission, and the 95% WFPS treatment showed the highest N20emissions. In the 67% WFPS treatment, the initial stage of N20 emission was dominated by denitrification, followed bynitrification. Denitrification was the dominate process in 80% WFPS treatment and nitrification was the dominate process in 95% WFPS treatment. Key words: water-filled pore space (WFPS); N2O; nitrification; denitrification; stable isotope; site preference value (SP value) 0 引言 【研究意义】NzO是一种重要的温室气体,其全球增温潜势是 COz的300倍。农田生态系统是大气 N2O 的主要来源,对全球 NzO 排放(17.7Tg N20-Na)的贡献为 6.2 Tg NO-N a,约占全球 N2O 排放量的1/32。微生物的硝化作用和反硝化作用是土壤主要的NzO产生途径,这些过程受土壤含水量、温度、通气 性、铵态氮和硝态氮浓度、可矿化碳的含量以及 pH 的影响B3-4,5],其中,土壤水分含量是 N O 排放来源的 主要控制因素I6],不同含水量下,这些过程可能会在同一土壤中的不同微区同时发生,但是对于土壤中NzO的主要产生途径仍具有不确定性。因此,不同湿度土壤 N O 溯源研究对于 NO 减排具有重要指导意义。【前人研究进展】土壤含水量为84%86%WFPS时, NzO 排放量最强;低于这个范围时,土壤含水量与 NzO排放量呈正相关,反之,则呈负相关关系。施加氮肥后,土壤 N2O 排放量随着土壤含水量的增加而增加,通常当土壤含水量低于 70%WFPS时,硝化作用成为主要的 NzO来源17,9-10]。用1N标记NO,的研究发现,当土壤含水量大于 70%WFPS时,其产生的 NzO 主要由反硝化作用产生[10-11,12]。也有研究指出,只有当含水量超过 80%WFPS时,反硝化作用才会成为主要的 NzO 产生途径[3]。乙炔 (Acetylene,CH)是一种常用的自养硝化抑制剂,较低的乙炔浓度(1—100Pa)可以抑制土壤的自养硝化作用,较高的乙炔浓度(10kPa)可以抑制 N2O 还原成N2, 同时也能抑制硝化作用,而异养硝化作用在较大的乙炔浓度范围(110kPa)不受抑制[14-15]。以往研究,主要利用乙炔抑制技术和同位素标记技术区分N2O产生和消耗过程,但是这些技术存在局限性[16-18]。目前,国外将同位素位嗜值(site preference, SP), 作为 N2O溯源研究的重要工具。理论上,参与硝化和反硝化过程产生的NO 的 NO还原酶类型不同,会导致两个N原子位置15N 的富集程度不同19-20], NzO 还原过程中N-O键断裂会导致剩余 N O 中间位置氮原子富集1N(I5N")[19,21-23],这些均可以作为利用SP 值区分Nz0来源的理论基础。除此之外, SP值可以弥补8N和80受前体同位素值干扰的不足,且对样品干扰小124-261。与细菌反硝化作用相比,由真菌反硝化作用和硝化作用产生 NO过程具有更高的 SP 值27。与肖化作用相比,一般土壤反硝化过程产生的 N,O 有较高的8N和80值281。国外研究发现,在 55% WFPS处理中,有一多半的NzO来自于硝化作用,75%和 85%WFPS土壤中反硝化作用是主要的 N2O 产生途径[29]。【本研究切入点】国内很少利用自然丰度的稳定同位素特征值对参与NzO排放的硝化和反硝化过程贡献率进行量化研究,本研究利用该技术结合乙炔抑制法探索不同土壤含水量下NO 的溯源问题。【拟解决的关键问题】本研究将同位素自然丰度法与乙炔抑制技术相结合,通过室内培养试验,研究不同含水量(WFPS)对北京顺义 潮土 NzO 排放及同位素特征值(8Nbulk, 818o和SP)的影响,以期获得不同土壤含水量条件下施用铵态氮肥后,其NO产生途径及变化规律。 材料与方法 试验于2016年10—11月在中国农业科学院农业环境与可持续发展研究所环境稳定同位素实验室进行。 1.1 试验材料 供试土壤来自中国农业科学院农业环境与可持续发展研究所北京顺义试验基地,为连续10年以上小麦与玉米一年两熟种植制度的潮褐土,其玉米和小麦的产量分别约为8250和6000 kghm²。玉米收获后的0一20 cm 表层土壤的主要理化性质为:容重1.48 g.cmpH 7.87、有机质 15.40 gkg、NH*-N 2.33 mgkg、NO,-N6.33 mgkg°。采用蛇形五点法收集土样,土壤取回后,过4mm筛,稍微风干后,混匀,便开始进行培养。CH购自北京氦普北分气体工业有限公司(纯度≥99.6%)。 1.2 试验方法 试验设置3个含水量梯度,分别为67%、80%和95%WFPS(土壤体积含水量与总孔隙度的百分比或实际重量含水量与饱和含水量的百分比,简称WFPS),每个含水量梯度设置不加CH(CK)、加0.1%(V/V) CH和加10%(V/V)CH, 共9个处理,每个处理均设有3次重复。 向土壤中添加肥料用量为 100 mgN.kg烘干土的(NH4)2SO4,拌匀。土壤初始含水量为 67% WFPS,根据重量法通过加蒸馏水调成80%和95% WFPS, 得到3个含水量梯度,将土样装于无盖的塑料盒子里,表面覆膜,并扎若干个6mm的小孔,以减缓水分蒸发,培养过程中根据重量法每3天补加一次蒸馏水,使土壤含水量与培养初期保持一致,于25℃培养箱进行黑暗培养。在培养第1、2、3、4、5、7、10、14和18天进行气体和土壤样品收集。具体采样过程为:称取高(95%WFPS)、中(80%WFPS) 和低(67%WFPS)含水量的土壤样品分别为51.6、49.6和48.0 g(均相当于40g烘干土)于280 mL培养瓶中,培养瓶盖上胶塞,并用铝盖压紧密紧。0.1%(V/V) C2H处理用注射器注入0.3 mL CH2, 并并匀;10%(V/V) C2H2处理用注射器从培养瓶中抽出30mL空气,再注入30mL CH, 并混匀。将处理好的培养瓶于25℃培养箱中黑暗培养2h,从培养瓶中用注射器抽取 20 mL气体(加C2Hz的处理采气前要将培养瓶中的气体混 匀),注入20 mL 提前抽成真空状态的顶空瓶中用于测定 NzO 浓度及同位素值(8Nbulk和8N"),同时收集培养瓶中的土样,于-20℃冷冻,用于测定土壤氮素含量。 无CH处理的土壤 NzO 由硝化和反硝化作用共同产生; 0.1%(V/V)CH处理的土壤 N2O均由反硝化作用产生; 10%(V/V)CH处理的土壤 NzO是反硝化作用产生的NO与N之和。 1.3 测定项目与方法 1.3.1 N0排放通量及同位素特征值的测定利用稳定同位素质谱仪(IRMS, Isoprime100, Isoprime ,Cheadle, UK) 配合痕量气体浓缩系统(Trace Gas,UK)测定 NO 峰面积(m/z=44, 具体参照文献中提到的方法[30-31],根据样品 NzO 和采样时空气中 N2O 峰面积比值算出样品中N2O浓度。NzO 排放通量计算公式32为 式中,F表示 N2O 排放速率, ugkg d;p表示标准状况下NzO的密度,1.25kgm;V为培养瓶内有效体积, 0.24 L; AC 表示测定的 N2O 浓度, ppbv; At表示每次取样培养时间,2h; m为干土重量,40×10~kg; T表示培养时的平均温度,25℃;24表示一天24h;NzO 累积排放量为不同培养时间段气体排放量的加权求和, ugkg。 NzO同位素特征值(8Nbuk和8N")利用 1.3.1中提到的 IRMS 进行测定得到。 NzO分子是不对称的直线型结构,根据中间和末端氮原子的不同,分别称为α原子和β原子[23],微生物对NzO分子内不同位置N的嗜好性差异产生的值称为位嗜值,简 SP.NO 同位素特征值相关公式130]如下 式中, R=15N/N,180/0,R的下角标分别表示样品和标准样品。 NzO 的同位素位置嗜值 SP 的计算公式130为 式中,8N“和8N分别表示N20分子内α和β位氮原子的同位素值。 1.3.2 基于 SP的N0来源评估 假设土壤排放的NzO 全部来自于硝化作用和反硝化作用,利用同位素二源混合模型计算硝化和反硝化作用各自的贡献率, 公式1291如下 式中,SPg 和 SPN、SPp分别表示环境样品的 SP 值以及纯细菌培养条件下硝化和反硝化作用各自的 SP 值(33%和0),f和f分别表示来自硝化和反硝化作用的NzO占总量的比例。 1.3.3 土壤无机氮含量的测定 QuikChem 8000 流动注射全自动分析仪 (LACHAT, USA) 测NH-N 和NO;-N体积含量(mgL),并计算出质量含量(mgkg),测定方法和公式参照《土壤农化分析》33J。 1.4 数据处理及分析 采用 Microsoft Excel 2013 和 SAS 9.2软件进行数据分析和处理,采用 Sigmaplot 12.5进行数据的统计和作图,利用LSD (P=0.05)法对处理间差异进行显著性分析。 2 结果 2.1 N20排放速率与累积排放量 本研究结果表明,土壤 NzO 排放速率随着土壤含水量升高而增加(图1-A)。在 80%、95% WFPS条件下,各处理间土壤 NzO 排放速率在培养第2一4天出现排放高峰,并且其最大排放速率分别为 1.46和3.30mgN·kg d, 随后 N2O 排放速率逐渐降低。67% WFPS土壤N2O整体排放水平比较低(低于0.20mgNkg d),在培养第1一2天出现较高的 N2O排放量。高、中和低含水量土壤 N2O 加权平均排放通量分别为1.17、0.27和0.08 mgNkg d。其中,高、中含水量土壤在培养前 7—10 d具有较高的N O排放速率,之后排放速率较低且变化不大。低含水量各处理间 N2O 排放速率差异显著,且无CHz处理>10%(V/V) C2H2处理>0.1%(V/V)C2H处理(表1). 整个培养周期,高、中和低含水量土壤 N O 累积排放量分别为21.06、4.77和1.48 mgNkg, 分别为培养初期总的无机氮含量的19.39%、4.39%和 1.36%(NH;-N+NO,-N初始含量均为 108.62 mgNkg),这说明,随着土壤含水量增大,气态氮损失量增加;高、中含水量土壤N2O 累积排放量分别比低含水量高 13.23和2.22倍,高含水量土壤 NzO 累积排放量比中含水量高3.42倍。各水分处理间 N O 累积排放量均达到显著水平 (P<0.01)。 各含水量土壤,无CH处理NzO 累积排放量均显著高于 0.1%(V/V) CH处理(P<0.01),这说 明0.1%(V/V) CH处理有效抑制了硝化过程中的自养氨氧化过程;同时,10%(V/V) C2H处理NO累积排放量均显著高于 0.1%(V/V)CH处理(P<0.01),这表明10%(V/V)CH处理有效抑制了 NzO 还原成N2的过程(表1)。 误差线表示标准误(n=3).下同 Error bars represent standard deviation of the mean (n=3). The same as below 图1 不同含水量土壤培养期间 N20 排放速率(A)和累积排放量(B) Fig. 1 N2O flux and cumulative emissions under different water contents during incubation time 表1 两种 C2Hz处理对土壤 N0排放速率及累积排放量的影响 Table 1 The effect of two C H treatments on the rate and cumulative emissions ofNO 处理 67% WFPS 80% WFPS 95% WFPS Treatments ER (mgNkg d) CE (mgNkg) ER (mgNkgd) CE (mgNkg) ER (mgN·kg d) CE (mgNkg) CK 0.0824±0.0347a 1.4827±0.0502a 0.2694±0.4058a 4.7685±0.3469b 1.1702±1.2403a 21.0641±0.9153a 0.1%(V/V) C2H2 0.0646±0.0241b 1.1635±0.0285c 0.2244±0.3192a 4.0958±0.1252c 0.8472±1.0099a 15.5504±0.6576c 10%(V/V) C2H2 0.0759±0.0291ab 1.3496±0.0551b 0.3313±0.4405a 5.7216±0.1798a 1.1063±1.0676a 19.6124±0.2163b CK: 无C2H2处理; ER: N2O排放速率; CE: N20累积排放量。为了方差分析准确性,保留了小数点后4位。同一列中不同小写字母表示处理间差异显著(P<0.05)。下同CK: Without C2H2 treatmen; ER: Emission rate of N2O; CE: Cumulative emissions of N2O. In order to improve the accuracy of the variance analysis, 4 decimalplaces were reserved. The values followed by different little letters in the same column indicate the significant differences between treatments at P<0.05 level.The same as below 2.2 土壤中无机氮NH*-N 和NO-N含量的变化 培养期间,土壤中NH -N和NO-N浓度变化说明了氮的转化过程。各处理土壤 NH-N浓度大体上均呈逐渐下降趋势。中、低含水量处理,土壤 NH' -N 浓度在培养开始后急剧下降,至培养第3天分别降低了95.54%和97.22%,之后稍有波动,但变化不大。高含水量处理NH-N浓度与另外两个处理相比下降缓慢,到培养第3和10天分别减少了49.85%和77.89%(图2-A)。 土壤 NO -N 含量在整部培养周期呈增加的趋势。中、低含水量处理,土壤中 NO,-N浓度从培养开始至 第3天迅速升高,之后未出现明显变化。至培养第18天,高、中和低含水量处理 NO,-N 浓度分别为 80.66、101.54和100.03 mgNkg(3个含水量 NO,-N 初始含量均为6.29 mgNkg),高含水量处理与中、低含水量处理间差异显著(P=0.0086),中低含水量处理间差异不显著(图2-B)。 2.3 不同乙炔处理下反硝化产物N20 和N20+N2的产生规律 NzO还原成Nz 的途径对于了解农业土壤中 NO消耗非常重要,并且这可能是一个考虑如何减缓 NO 图22不同含水量土壤培养期间 NH*-N(A)和 NO,-N(B)含量 Fig.2 Soil ammonium and nitrate contents under different water contents during incubation time 排放的方向。0.1%(V/V) C2Hz抑制自养氨氧化作用,10%(V/V) C2H2抑制 N2O还原成N,同时抑制自养氨氧化作用。本本究通过分析0.1%(V/V)CH和10%(V/V)CH处理组N2O 排放通量来估测可能的反硝化产物(N2O+N2)排放量以及N2O/(N2O+N2)比率。培养期间,土壤反硝化作用产生的 NzO和(NO+Nz)加权平均排放通量,高含水量处理(分别为0.85和1.11mgNkgd)显著高于中(分别为0.22和 0.33mgNkg d)、低含水量处理(分别为 0.06和 0.08mgNkg d),两个较低含水量处理间也均达显著水平(均为P<0.0001;表1)。高、中和低含水量土壤NzO/(NO+N)比率分别为0.61、0.72和0.86,并且各水分处理间差异显著 (P<0.0001),这说明,在67%WFPS处理下,只有14%的NO还原成了N2,大部分以NzO 形式排放到了外界环境中(表1)。 2.4 土壤N20 的同位素特征 NzO峰值一般出现在施肥后一周内34。因此,以下探讨了培养第一周期间 N O 同位素特征。NzO 同位素特征值受土壤含水量的影响显著(图3)。对于Nz0的815Nbulk和880,各含水量处理间差异均达显著性水平 (P<0.0001)。高、低含水量处理的 SP 值显著高于中含水量 (P<0.0001)。所有处理下 8Nbulk 平均值均为负值,变化范围为从-43.95%o到-5.31%0,880和 SP 平均值均为正值,变化范围分别为12.28%-40.66%o以及10.30%o—21.58%o。土壤含水量对N2O同位素特征值影响利用相关性进行分析发现, WFPS与8Nbuk具有显著负相关关系(r=-0.77, P<0.0001),另外,其与880 和SP均无显著相关性; SP与8Nbuk呈显著正相关(r=0.34, P<0.01),与8Nbulk相比, Sp 与8o相关性更加显著(r=0.56,P<0.0001);8151bulk和80具有显著正相关关系(r=0.61, P<0.0001)。 土壤排放 NO 的8Nbuk值随着土壤含水量的增加而减小(图3)。根据同位素分馏效应,添加 NH 会诱导土壤发生硝化作用,随着硝化作用进行,剩余底物会富集重同位素,导致 NH的8N增加,这可能会促使NzO 的 85Nbulk发生显著变化,因此,可能会使利用8Nbulk区分 NzO产生途径复杂化。研究发现,3个含水量在无 C2H处理下N2O的8Nbuk在培养第一周均呈增加趋势,变化范围为-54.78%o—3.62%,这与之前的研究一致,即施用尿素和铵态氮肥料后, N20的8Nbuk 通常会随着培养时间升高135-36].8Nbuk加权平均值为高含水量(-42.93%)<中含水量(-28.81%)<低含水量(-4.07%),且各水分处理间差异显著(P<0.0001) 不加CH条件下,两个较高含水量处理 NzO 的80值在培养第一周呈先降低后升高的变化趋势。整体上,3个含水量处理NO的80值在培养第一周呈增加趋势(图3)。各含水量土壤中,加0.1%(V/V)CH处理的880值显著高于加 10%(V/V)CH处理(P<0.01,表2),这或许可以解释为两种处理土壤中均主要发生反硝化作用,只是 10%(V/V) CH会抑制土壤中 N2O 还原成Nz的过程,而反硝化作用会消耗土壤中的 NO, 并使土壤中剩余的 NO,富180,增加其880值。有研究提出,反硝化过程中发生NzO还原会使 N-O 键断裂,导致剩余 NzO 相对富集8N"和880[34,37-38]。但是180不能单独用于区分NO产生途径,因为其会与不同来源O发生交换,并且不同来源O的8180值是变化的。 图3不同含水量土壤培养第一周N20 同位素特征值(8Nbuk, 8o和 SP) Fig. 3 Isotope signatures of N2O under different water contents during the first week incubation 表2 两种CH处理对土壤 N20 同位素特征值(8Nbulk,81O,SP)的影响 Table 2 The effect of two CzH2 treatments on N20 isotope signatures (8Nbulk,81o, SP)(%) 处理 67% WFPS 80% WFPS 95% WFPS Treatments SP 85Nbulk 880 SP 81Nbulk 80 SP 8Nbulk 80 CK 21.07a -4.07a 32.15a 10.26a -28.81a 21.69a 20.70a -42.93a 27.14a 0.1%(V/V) C2H 19.96ab -4.51a 30.87a 8.88a -29.14a 22.68a 17.38a -43.33a 28.29a 10%(V/V) C2H2 18.67b -4.34a 28.35b 5.95b -33.07a 16.73b 15.71b -41.97a 25.18a 2.5 基于 SP 值的硝化和反硝化过程对土壤 N20 排放的贡献率 不加CH2各处理 SP 值在培养第一周均呈先升高再下降的趋势(图3)。高、中和低含水量土壤 NzO的 SP 加权平均值,不加CH处理下分别为20.70%、10.26%和 21.07%,这与之前纯培养研究相比,高于反硝化作用SP 值(-10%o一0%),低于硝化作用 SP值(33%—37%)[39],这说明在各含水量土壤中可能同时具有多个 N2O 产生途径。0.1%(V/V) C2Hz处理下高、中和低含水量的 SP 加权平均值分别为17.38%o、8.88%和 19.96%0,10%(V/V)CH处理下,高(15.71%o)、中(5.95%)和低(18.67%)含水量土壤 NzO 的 SP 加权平均值分别比0.1%(V/V) CH处理降低了10%、33%和6%。该结果表明,反硝化过程中可能发生 NO还原(表2)。低含水量处理的SP 值在培养前两天均较低(分别为6.74%和12.04%),以反硝化作用为主,分别占N2O 生成量的 66.15%和56.36%;之后主要以硝化作用为主;中含水量土壤的 SP 值在培养第1一7天均较低(3.92%一15.21%), N O 主要由反硝化作用产生,由反硝 化作用排放的NzO贡献率为40.90%—74.04%(表3);高含水量处理 10%(V/V) CH的 SP 值在培养第一周比较高(7.61%0—21.11%o),而添加10%(V/V)C,H 处理会抑制自养氨氧化过程以及N2O还原成N2过程,故该处理不会因此出现较高的 SP 值,这说明可能发生了部分真菌反硝化作用。MAEDA 等通过研究67种真菌发现其 SP 平均值为 30%0±4.8%(测得的SP值范围为15.8%—36.7%)[40] 3 讨论 土壤含水量是控制 N,O 排放的主要因素[41],它对NO产生途径及同位素组成均具有显著影响。该研究表明土壤 N O 排放量随土壤含水量的增加而增加,这与前人的研究结果一致[42-44]。含水量从67%升高到95% WFPS,土壤NO排放量出现显著增加。这与温带大田土壤的研究结果相似, CLAYTON 通过研究草地土壤发现,65% WFPS是一个重要临界点,当超过该含水量,土壤 NzO 排放量出现显著增加145J。温带草地和农田土壤含水量从60%升到80% WFPS时, NzO排放量分别增加了12倍和30倍411,这与本研究结果 表3不同含水量土壤硝化和反硝化作用对 N20排放的贡献率 Table3 Contribution of nitrification and denitrification to NO emission under different soil moisture levels (%) 培养时间 67% WFPS 80% WFPS 95% WFPS Incubation 硝化作用 反硝化作用 硝化作用 反硝化作用 硝化作用 反硝化作用 time (d) Nitrification Denitrification Nitrification Denitrification Nitrification Denitrification 1 33.85±0.98 66.15±0.98 25.96±6.23 74.04±6.23 67.45±4.64 32.55±4.64 2 43.64±8.01 56.36±8.01 27.26±1.06 72.74±1.06 79.65±13.94 20.35±13.94 3 100 0 53.82±10.59 46.18±10.59 90.48±8.25 9.52±8.25 4 100 0 59.10±21.75 40.90±21.75 92.99±12.14 7.01±12.14 5 86.44±13.52 13.56±13.52 45.01±15.01 54.99±15.01 92.07±4.79 7.93±4.79 7 55.78±8.91 44.22±8.91 42.64±16.76 57.36±16.76 65.75±10.22 34.25±10.22 加权平均值 67.93 32.07 42.35 57.65 79.16 20.84 Weighted mean 相似,高、中含水量土壤 NzO 累积排放量分别比低含水量处理高13.23倍和2.22倍,这可能是由于随着土壤含水量(WFPS)的增加,水不断充满土壤孔隙,O2向土壤中扩散受到限制,土壤的厌氧条件逐渐增强并促进反硝化作用, NzO 也随之大量产生并排放出土壤46-471。随着土壤含水量(WFPS)增加, NzO 排放量增加,在含水量为80%95% WFPS 条件下出现最大的 NzO 排放量[48]。当土壤水势达到-5 kPa(约为 97%WFPS),出现最大的NzO排放量,土壤含水量(-2.5kPa)进一步增加, NzO产生量减少,可能是由于N2O还原速率增加[49-50]。但是,也有研究提出在 70% WFPS下出现较高的 NzO 排放量。DAVIDSON 研究发现,最大NzO 排放量产生于 60% WFPS, 硝化作用和反硝化作用对 NzO 产生均具有重要作用。出现该矛盾原因可能是由试验和土壤类型的不同导致。 同一土体中可以同时发生多个 NzO 产生过程,利用稳定同位素与 CH2 (0.1%和 10%V/V)抑制相结合的方法可以确定自养硝化作用和反硝化作用对土壤N,O 排放的贡献率。本研究发现自养硝化作用和反硝化作用对土壤排放NzO的贡献率随着土壤含水量的变化而有所不同,但绝对贡献率因所选择的方法不同有很大的差异。仅利用乙炔抑制技术估测的反硝化作用(含水量为67%一80% WFPS 时贡献率为82%-83%)对NzO排放贡献率大于同位素技术(含水量为67%一80% WFPS 时贡献率为32%—58%)测得的结果,利用两种方法估测反硝化作用对 N2O 排放的贡献率,大于25%的差异仅出现在67%WFPS条件下,这有可能是乙炔抑制技术忽略了异养硝化作用对土壤排放NO 的贡献。但是,不同途径对土壤 NzO 排放的贡献随着土壤含水量的变化趋势是相同的。 在大部分生态系统中,反硝化作用是主要的N2O产生途径。其最后-步是 N2O 还原酶将中间产物N2O还原成N2的过程,这步反应对估测 N2O 消耗、了解土壤中氮积累和排放到大气中的气态氮量至关重要,并且这可能是如何减缓 N2O 排放的重要方向。反硝化产物 N2O/(N2O+N2)比率用于评估 N2O 转化为 Nz的程度,变化范围从0(所有的NzO 全部转化为 N2)到1(NO 是反硝化过程的唯一最终产物)[51]。本研究发现,土壤含水量越高,土壤排放放 NO 转化成Nz的比例越高,土壤排放到外界环境的 NzO 绝对量也越高。这将会导致更多的 N2O排放到大气中,加剧温室效应。之前的一些研究也提出较高含水量的土壤出现最大的 N,O 排放量[8.48],这与本研究结果一致。这说明可以通过控制土壤水分条件来减缓 NzO 排放。 一些文献报道8Nbulk 是区分硝化作用和反硝化作用的重要指标,这是因为与反硝化作用相比,硝化作用会加速8N-NO;贫化[35,52],其他学者主张815Nbulk取决于底物来源 NH 和NO以及土壤异质性,并没有考虑N O 还原过程对剩余 NzO 的影响[28,53]。本研究发现施用 NH后后,由于硝化过程中同位素分馏导致8Nbuk值随着培养时间逐渐升高。底物(NH)充足,硝化作用产物 NO受底物影响,根据同位素分馏原理,微生物勿先利用轻同位素,导致8N-NO, 逐渐贫化,而发生反硝化作用的底物几乎全部来自于硝化作用产物(NO),故反硝化作用占据主导地位的较高土壤含水量,其8Nbulk值越低,本研究显示8Nbulk值随着含水量的增加而降低(8Nbuk加权平均值,95%WFPS 处理≤80%WFPS 处理<67% WFPS处理)。 880值受NzO向N还原过程的影响,同时O,HO 与NO,之间的O原子交换也会影响其大小[54-55]。 与8Nbulk和SP相比,对NzO分子中81o的解释更为复杂56]。N2O-O可能来源于不同途径,理论上,硝化细菌-反硝化过程中(NH;→NHOH→NO,→NO→N20)一半的氧原子来自于空气中02,另一半氧原子来自于 HzO, 羟胺氧化过程中,100%的N2O-O来源于O54]。如果反硝化细菌利用 NO,产生 N2O,那么NzO中所有的○都来自于NO.但是在实际环境中,H0-O 与 NO-O 和 NO,-O 发生氧交换,且HO-O 和NO-O对Nz0-O的贡献与微生物种类有关55]。基于以上理论和研究结果,采用88O-NzO 值对 NzO 来源进行分析比较复杂,需要考虑多种因素。本试验中,880与乙炔抑制技术相结合,提高了其准确性。各含水量土壤中, 0.1%(V/V) CH处理组的80值显著高于10%(V/V) CH处理组(P<0.01),这可能是由于两种处理土壤中均主要发生反硝化作用,只是10%(V/V) C2H2会伟制土壤中 N2O 还原成N2的过程,而反硝化作用会消耗土壤中的NO, 并使土壤中剩余NO富10,增加其80值。有研究提出,反硝化过程中发生 N2O 还原会使 N-O 键断裂,导致剩余 N2O相对富集8N和88034,37-38]。尽管一些研究中利用80来区分N2O产生途径53,57,但是只依靠8180-N2O值对 N O 来源进行分析仍备受争议,如果880与其他同位素值(如8N,SP)结合来分析,可能会提高其准确性。 与8Nbulk和88O相比,SP 值是区分土壤 NO 排放途径的一种重要工具,其优势在于受样品干扰小,与 NO 前体的8'N同位素组成没有相关关系124-26]。一般随着土壤含水量(WFPS)的增加,土体的厌氧体积逐渐增大并使反硝化作用加强, NzO 也随之大量产生并排放出土壤[46-47]。本研究高含水量处理厌氧体积高于中含水量处理,其 SP 值之所以高于中含水量处理,可能是发生了部分真菌反硝化作用27。MAEDA等I40通过对67种真菌测试发现,其 SP 平均值为30.0%±4.8%(变化范围为15.8%o—36.7%o)[40]。另有文献报道真菌产生 N2O 的 SP 值为 36.9%o—37.1%o,这与细菌硝化作用的相似(34.1%—39.6%)[27]。 本研究利用同位素技术结合乙炔抑制技术,高含水量处理中,加10%(V/V) CH只发生反硝化作用,其会抑制自养氨氧化过程和 N2O 还原成 Nz的过程,故该处理不会因为这两个过程而产生较高的 SP值261,而 95% WFPS 在 10%(V/V)C2H2条件下土壤排放NzO 的 SP加权平均值为15.71%o,这正说明高含水量处理中发生部分真菌反硝化作用。与细菌反硝化作用 相比,真菌反硝化作用和硝化作用排放NzO 的过程均会产生较高的 SP 值2。因此,利用同位素技术区分细菌硝化作用和真菌反硝化作用产生的N2O遇到挑战27。另外,较高土壤含水量更有利于反硝化反应的发生,而施加硫酸铵后,虽然同样产生厌氧环境,由于硫酸铵提供大量可利用氮,在土壤表层硝化反应得到促进。除此之外, SP 值会随着 N2O 还原过程发生变化,使对 NzO产生途径评估产生偏差。由完全的硝化作用和细菌反硝化作用产生NzO的 SP值,分别约为33%和0%,还原过程会使 SP 值升高126],这与本研究结果-致。高、中和低含水量土壤, 10%(V/V)CH处理组 NzO 累积排放量分别比0.1%(V/V)CH处理增加了26%、40%和16%,说明未加10%(V/V) CH处理的土壤发生 NzO 还原过程;同时,与10%(V/V)CH处理相比, 0.1%(V/V)CH处理下高、中和低含水量的 SP 加权平均值分别升高了11%、49%和7%,这正验证了该理论。根据同位素二源混合模型,以上过程会使由 SP 值估则的NzO 产生途径低估反硝化作用对 NzO排放的贡献126,58]。 与示踪技术相比,利用自然丰度同位素技术(例如 SP 值的运用)不需要人为标记培养、操作方便,具有明显优势。但是微生物氮循环过程相当复杂,对SP 值用于区分 NzO 产生途径的方法应慎重利用,如硝酸盐异化还原成铵和异养硝化作用也会产生Nz011,59-60],并影响氮循环过程中一些含氮化合物的同位素特征值。目前为止,这些过程对土壤产生NO的1N的SP 值的影响还不明确161]。因此,本研究并未对这些过程对SP 值的影响进行分析。虽然SP 值在应用中存在一些不足,但其确实是一种有效的 NzO 溯源方法,并已在国际上得到广泛认可。当下中国对 SP 值研究刚刚起步,本文对其进行初步探讨,接下来将进一步探究微生物群落结构及其酶组成对土壤产生NzO的同位素特征值随时间变化的影响,从而能提高利用SP值区分NO产生途径的准确性;另外,土壤反硝化的 NO,还原成 NO过程中,真菌和细菌反硝化作用对土壤产生NzO 的贡献及其对 SP 值变化的影响,也需要做进一步研究。 4 结论 本试验将自然丰度的同位素技术与乙炔抑制技术相结合测定不同含水量(WFPS)下硝化作用和反硝化作用对土壤 NzO 排放的贡献率。随着土壤含水量增大, NzO 排放量增加。各处理均在前4天具有较高的 NO排放量,之后排放量相对较小,并且变化不大。随着土壤含水量增加, NO/(N2O+N2)比率降低,土壤以 N2O 形式排放到大气中的比例降低,以Nz形式排放到大气中的比例升高, NzO 还原过程增强。本研究通过 SP 值估算硝化和反硝化作用的贡献率得出,培养前7d内,67% WFPS 土壤NzO 排放以硝化作用为主,且在前2d以反硝化作用为主,之后主要通过硝化作用排放 NO。在一定范围内,含水量升高会使反硝化作用增强。 ( References ) ( [1] IPCC. C limate C hange 2013: T h e P h ysical S cience B asis.WorkingGroup I C ontribution to the IPCC 5 th A ssessment R e port. IPCC,Cambridge, UK and New York,NY, USA, 2 013. ) ( 21 KROEZ E C , MOSIER A, BOUWMAN L. Closing the global N 2Obudget: A retrospective analysis 1500- 1 994. Global B i ogeochemical Cycles, 1999, 1 3(1): 1 -8. ) ( [3] SAHRAWAT K L , KEENEY D R. N itro u s oxide emission from soils.Advances i n Soil Science, 1986,4:103-148. ) ( [4] BOUWMAN A F. S oils and the greenhouse effect: the present sta t usand f uture t rends concerning the effect of soils and their cover on thefluxes of greenhouse g asses, the surface energy balance, and the water b alance. W iley, 1 990. ) ( [5] GRANLI T , B O CKMAN O C. N i trous oxi d e from agriculture.Norwegian Journal of Agricultural Sciences, 1994(12):1-128. ) ( [6] DAVIDSON E A . F luxes of n itrous oxide an d nit r ic o x ide f r omterrestria l ecosystems. A g lobal i nventory of nitric oxide e m issionsfrom soils.//ROGERS J E , WHITMAN W B. Microbial P roductionand Consumption of Greenhouse Gases: M ethane, N itrogen Ooxides, and Halomethanes. Washington, DC: AmericanSociety y f or Microbiology, 1991:219-235. ) ( [7] STEVENS R J,LAUGHLIN R J,BURNS L C, ARAH JR M, HOODR C . M easuring the contributions of nitrification and denitrification to the f lux of nitrous oxide f rom soil. Soil Biology and B i ochemistry,1997,29(2): 1 39-151. ) ( [8] 1 郑循华,王明星 ,王 跃思,沈壬兴,龚宴邦,骆冬梅,张文,金继生,李老土.稻麦轮作生态系统中土 壤 湿度对 N2O产生与排放的影响. 应用生态学报,1996,7(3):273-279. ZHENG X H, WANG M X, WANG Y S, SHEN R X,GONG Y B, LUO D M, ZHANG W, JIN JS, LI L T . T he effect of s oil mo i sture onn2o production a nd emission i n r i ce-wheat r o tation system. ChineseJournal of Applied Ecology, 1 996,7(3):2 7 3-279. ( i n Chinese) ) ( [9] ABBASI M K, ADAMS W A. Estimation of simultaneous nitrification ) ( a nd denitrification in grassland s oil associated with u rea-N using N a nd n i trification i n hibitors. B i ology and Fert i lity of Soils, 2000, 31(1) : 38-44. ) ( [10] W OLF I, RUSSOW R. Diff e rent pat h ways of formation of N 2O , N2and N O in black earth soil. S oil B iology and B i ochemistry, 2 0 00, 32(2): 229-239. ) ( [11] BATEMAN E J, B AGGS E M. Co n tributions of n i tr i fication a n d denitrification to N2O e m issions fr o m soi l s at d ifferent water-filled p ore space. Biology and Fe r tility of Soils, 2 005,41(6):379-388. ) ( [12] RUSER R, FLESSA H, RUSSOW R, SCHMIDT G, BUEGGER F, M UNCH J C . Emission of N2O, N2 and CO2 fro m soi l fe r tilized with n itrate: effect of compaction,soil moisture and re w etting. Soil Biology a nd Biochemistry, 2006,38(2):2 6 3-274. ) ( [13 ] NOMMIK H . I n vestigation s ondenitrification i n i n s s o c il. Acta Agriculturae Scandinavica, 1 9 56, 6(2):195-228. ) ( [14] WALTER H M , K E ENEY D R , F I LL E RY I R. I n hi b ition of Nitrification by Acetylene1. S oil Science S ociety of America Journal, 1979,43(1):195-196. ) ( [15] DE BOER W , KOWALCHUK G A. N itrif i cation in ac i d soils: M icroorganisms and m echanisms. S o il B iology a nd B i ochemistry, 2001 , 33(7/8):853-866. ) ( [16] FLATHER D H, BEAUCHAMP E G. Inhib i tion of t he fermentation process in soil by acetylene. Soil Biology and Biochemistry, 1992, 24(9): 905-911. ) ( [17] BERNOT M J, DODDS W K, GARDNER W S, M CCARTHY MJ, S OBOLEV D, T AN K J. Co m p a ring denit r ification es t imates f o r atexas e stuary b y using acetylene inhibition a nd membrane inl e t ma s sspectrometry. Applied and Environmental Microbiology, 2003,69 ( 10):5950-5956. ) ( [18] YAO Z S , LIU C Y, DONG H B , WANG R, ZHENG X H. An n ualnitric and n itrous oxide fluxes f rom C h inese su b tropical p l a stic g reenhouse a n d co n ventional ve g etable cul t ivations. En v ironmentalPollution, 2015, 196:89-97. ) ( [19] SCHMIDT H L, W ERNER R A , YO S HIDA N, W ELL R . I s the i sotopic c omposition of nitrous oxide an indicator for its or i gin from n itrification or denitrification? A theoretical a pproach fr o m ref e rreddata and m icrobiological a nd e n zyme ki ne tic aspects. lRapidCommunications in Mass Spectrometry, 2004, 18(18):2036-2040. ) ( [20] STEIN L Y, Y U NG Y L . P r od u ction, iso t opic composition, a n d atmospheric f ate o f b i ologically p roduced n i trous o x ide. A n nual R eview of Earth & Planetary Sciences, 2003,31(31):329-356. ) ( [21] TOYODA S. P ro duction mechanism a n d global b u dget of N. Geophysical Research Le t ters, 2 0 02, 29(3):1037. ) ( [22] POPP B N, WESTLEY M B , TOYODA S, MIWA T, DORE J E, YOSHIDA N, RUST T M, SANSONE FJ, RUSS M E, DSTROM N E, OSTROM P H . Nitrogen and oxygen iso t opomeric constraints onthe origins a nd sea-to-air flux of N 2 0 in th e ol i gotrophic sub t ropicalNorth P acific g yre. G lobal B i ogeochemical Cycles, 20 0 2, 16( 4 ): 12-1-12-10. ) ( [ 2 3] YOSHIDA N, TOYODA S. Constraining the atmospheric N2O b u dgetfrom intramolecular site preference i n N2O isotopomers.Nature, 2000, 405(6784): 3 30-334. ) ( [24] SUTKA R L , OSTROM N E, OSTROM P H , GANDHI H ,BREZNAK J A. Ni t rogen isotopomer site preference of N20 producedby N itrosomonas europaea and Methylococcus capsulatus Bath. RapidCommunications in Mass spectrometry, 2003,17(7): 73 8 -745. ) ( [25] TOYODA S, MUTOBE H, YAMAGISHI H , YOSHIDAN, T A NJI Y . Fractionation of N2O i sotopomers during p r oduction b y d e nitrifier.Soil Biology and Biochemistry, 2005,37(8):1535-1545. ) ( [26] SUTKA R L , OSTROM N E, O STROM P H, L I F. Distinguishing Nitrous Oxide P r oduction from Nitrification and De n itrification on the Basis of I sotopomer Abundances. A p plied& E Environmental Microbiology, 2006, 7 2(1 ) :638-644. ) ( [27 ] SUTKA R L, ADAMS G C , OSTROM N E, OSTROM P H.Isotopologue fractionati o n duri n g N2O production by fungal denitrification. Rapi d Communications in Mass S pectrometry, 2 008, 22(24):3989-3996. ) ( [28] BAGGS E M. A r e view of s ta b le is o tope t e chniques for N 2O sourcepartitioning in soils : recen t progress , remaining challenges and futureconsiderations . Rapid Communications i n Mass Spectrometry, 2008, 22(11): 1 664-1672. ) ( [29] STEIN L Y , YUNG Y L . P r od u ction, iso t opic composition, and atmospheric f ate o f b i ologically p roduced n i trous oxide. A n nual Review ofEarth & Planetary Sciences, 2003,31(31):329-356. ) ( [30] TOYODA S. Pr o duction m e chanism and gl o bal bu d get of N.Geophysical Research L e tters, 2002,29(3): 1 0 37. ) ( [31] POPP B N, WESTLEY M B , TOYODA S , MIWA T , DORE JE, YOSHIDA N, RUST T M, SANSONE F J,RUSS M E , DSTROM NE, OSTROM P H. Nitrogen and oxygen iso t opomeric constraints o n the origins and s ea-to-air flux of N20 in the oligotrophic subtropicalNorth P acific gyre. Global Biogeochemical Cycles, 2002, 1 6(4): 12-1 - 12-10. ) ( [32] Y OSHIDA N, T OYODA S. Constraining the atmospheric N20 budgetfrom intramolecular site preference in N2O is o topomers. Nature, 2000, 405(6784):330-334. ) ( [33] 鲍士旦.土壤农化分析.北京:中国农业出版社,2000. ) ( B AO S D. So i l Agricultural C h emistry Analysis. B eijing: ChinaAgriculture Press, 2000. (in Chinese) ) ( [34] PARK S, PEREZ T, BOERING K A, TRUMBORE S E, G IL J, MARQUINA S, TYLER S C . Can N20 stable isotopes and i sotopomers b e useful t ools t o characterize sources and m icrobial p athways of N 2 O pr o duction an d con s umption in t r op i cal soi l s? Global Biogeochemical Cycles, 2011, 2 5(1): 5 75-582. ) ( [35] PEREZ T, TRUMBORE S E, TYLER S C, M ATSON P A, ORTIZ-MONASTERIO I, R A H N T, G RIFFITH D W T . Identifying the agricultural imprint on the global N2O budget using stable isotopes.Journal of Geophysical R e search Atmospheres, 2 0 01, 106(D9):9869-9878. ) ( [36] UEDA S , G O C S , SU W A Y. S t ab l e iso t ope fingerprint o f N 2Oproduced by a mmonium ox i dation u n der la b oratory a nd f i eldconditions//Internation a Workshop on the Atmospheric N 2O B u dget: A n Analysis of the State of Our Understanding of Sources and Sink sof Atmospheric N 2O. T sukuba, Ja pan: Na tional I nstitut e of A gro-Environmental S c iences, 1 9 99: 3-20. ) ( [37] WE S TLEY M B, YAMAGISHI H, P OPPB N,Y O SHIDA N. Nitrous oxide c ycling i n t he B lack S e a in f erred f r om st a ble isotope and i sotopomer distributions. D e ep Sea Research Part II Topical Studies inOceanography, 2006, 53(17/19):1802-1816. ) ( [38] D ECOCK C, SIX J . How relia b le is t h e int r amolecular distribution of N in N20 to source partition N20 emitted from soi l ?. Soil Biology & Biochemistry,2013,65:114-127. ) ( [39] OSTROM N E,OS T ROM P H. The Isotopomers of N i trous Oxide: A nalytical C onsiderations a n d A p plication to Resolution of Microbial Production Pathways . F Handbook of E nvironmental I sotope Geochemistry. B e rlin Heidelberg: Springer, 2011: 4 5 3-476. ) ( [40 ] MAEDA K, SPOR A,EDEL-HERMANN V,HERAUD C, BREUIL M, BIZOUARD F , TOYODA S, YOSHIDA N , STEINBERG C, P HILIPPOT L.N 2 O p rodu c tion, a wid e spread trait i n fungi. Scie n tificReports, 2015,5. ) ( [41] DOBBIE K E, SMITH K A. The effe c ts of temperature, w a ter-filled p ore space a nd l and u se o n N 2O em i ssions f r om an imperfectlydrained g leysol. European J o urnal of So i l Sc i ence, 2 0 01, 52 ( 4): 667-673. ) ( [42] DOBBIE K E , M CTAGGART I P, SMITH K A . Nitrous o x ide emissions f rom i n tensive agricultural systems: V ariations betweencrops and seasons, key d r iving v a riables, and m e an em i ssion fac t ors.Journal o f G eophysical R esearch A t mospheres, 1 9 99, 1 0 4(D21):26891-26899. ) ( [43 ] ABBAS I M K , ADAMSW W A. Gaseous NN e mission during ) ( simultaneous n i trification-denitrificati o n associated wit h mineral N fertilization to a grassland soil under field conditions. Soil Biology andBiochemistry,2000,32(8):1251-1259. ) ( [ 4 4] SKIBA U, BALL B. The effect of soil texture and soil drainage onemissions of nitric oxide and nitrous oxide. So i l Use and Management, 2002,18(1):56-60. ) ( [45] CLAYTON H, MCTAGGARTI P, PARKER J, SWAN L, SMITH K A .Nitrous o xide e m issions from fertilised g r assland: a 2-year study ofthe effects of N f ertiliser form and environmental conditions. Bi o logy and Fertility of Soils, 1997,25(3):252-260. ) ( [46] SMITH K A. A m o del of t h e extent of anaerobic zon e s in agg r egatedsoils, a nd i t s p o tential a p plication to est i mates of d e nit r ification. European Journal of Soil Science, 1 980,31(2):263-277. ) ( [47 ] 黄国宏,陈冠雄,韩冰, Oswald Van Cleemput.土壤含水量与 N2O产生途径研究.应用生态学报,1999,1 0 (1): 53-56. HUANG G H, CHEN G X, H A N B, OSWALD V C. Study on soilwater content and N20 pathway. C hinese J ournal of Applied Ecology,1 9 99,10(1 ): 53-56. (in Chinese) ) ( [48 ] SCHINDLBACHER A. ZECHMEISTER-BOLTENSTERN S. BUTTERBACH-BAH L K. Effects of soil mo i sture and temperature on N O, NO2, and N20 emissions fro m European forest soils. Journal of Geophys i cal Research Atmospheres, 2 0 04, 1 0 9(10 9 ): 1 7 39-1739. ) ( [49] SMITH K A, THOMSON P E, CLAYTON H, MCTAGGART I P , CONEN F. E f f ects of temperature, wa t er content and ni t rogenfertilisation o n emissions of nitrous oxide by s oils. Atmospheric Environment, 1998,32(19):3301 - 3309. ) ( [50] F OCHT D D, VERSTRAETE W. Biochemical ecology of nitrificationand d enitrification in soils. Advances in Microbial Ecology, 1977 ( 16): 1 3 5-214. ) ( [51] JONES C M, SPOR A, BRENNAN F P, BREUIL M , B RU D,LEMANCEAU P, G RIFFITHS B , H ALLIN S, PHILIPPOT L Recently identified m icrobial guild mediates s o il N20 si n k ca p acity. Nature Climate Change,2014,4(9):801-805. ) ( [52] PER E Z T . Fa c tors that control the isotopic composition of N2O from soil emissions. Stable Isotopes and Biosphere Atmosphere Interactions,2005:69-84. ) ( [53] WELL R, FLESSA H, XING L , T ANG X J , ROMHELD V. ) ( Isotopologue ratio s of N2O emitted from microcosms w ith N H;fertilized arable s oils u nder co n ditions fav o ring nitrification. SoilBiology and Biochemistry, 2 008,40(9):2416-2426. ) ( [54] KOOL D M, WRAGE N , O ENEMA O , DOLFING J , VAN GROENIGEN J W. O xygen exch a nge between (de)n i trificationintermediates a nd H 2 O an d its im p lications fo r so u rce de t erminationof NO; a n d N2 O : a r eview. Ra p id Co m munications in Mass Spectrometry, 2 007, 21(22):3569-3578. ) ( [55] CASCIOTTI K L , SIGMAND M,HASTINGS M G. Mea s urement of the oxygen i s otopic composition of n itrate in se a water and freshwaterusing t he d enitrifie r method. Analytical Chemistry, 2002, 7 4(19):4905-4912. ) ( [56] W ELL R, FLESSA H. I so t opologue si g natures of N20 produced bydenitrification in soils. Journal of Geophysical Research Atmospheres, 2009, 11 4, G02020. ) ( [57] SZUKICS U, ABELL G C J, HODL V, MITTER B , SESSITSCH A , HACKL E, ZECHMEISTER-BOLTENSTERN S. Nitrifiers a nd denitrifier s respond rapidly to changed m o isture and in c reasingtemperature i n a pristine forest soil. Fems Microbiology Ecology, 20 1 0, 72(3):395-406. ) ( [58] OSTROM, N . E ., PITT A, SUTKA R, OSTROM P H, STUART GRANDY A , H UIZINGA K M, P H ILIP R OBERTSON G . I sotopologueeffects during N 2 O reduction in soils and i n pure cultures o f denitrifiers. Journal of Geophysical Research, 2 007,11 2 : G02005.doi:10.1029/2006JG000287,2007. ) ( [59] S MITH M S. Dissimilatory reduction of NO t o NH: a n d N2 0 by asoil Citrobacter sp. Applied and E nvironmental M i crobiology, 19 8 2, 43(4):854-860. ) ( [60] ROBERTSON G P, T IEDJE JM. N i trous oxide sou r ces in aerobicsoils: nitrification , denitrification and other biological processes. Soil Biology & B iochemistry, 1987, 1 9(2):187-193. ) ( [61] SPOTT O , STANGE C F. A n e w mat h ematical approach for calculating the contribution ofanammox, de n itrification n an atmosphere t o an N2 m ixture based o n a N tr a cer t e chnique. Rapid Communications in Mass Spectrometry, 2 0 07,21(14):2398-2406. ) Abstract: 【Objective】 The objective of this paper is to understand the contribution of microbial processes to N2O production and its changing rules under different water contents to provide a theoretical basis for reducing agricultural N2O emissions.【Method】A microcosm experiment was performed to investigate the effects of different water-filled pore space on N2O emissions and isotopic signatures (δ15Nbulk, δ18O and nitrogen isotopomer site preference of N2O) of soil at Shunyi district, Beijing. The studycombined stable isotope technique and gas inhibitor method to analyze N2O flux and its isotope signatures that emitted from soil. Theexperiment was set up three different water content levels, including 67%, 80% and 95% WFPS, and with three inhibitor levels,(without C2H2, with 0.1% (V/V) C2H2 and with 10% (V/V) C2H2). After two hours incubation, the soil samples were collected todetermine the concentrations of NH+4 -N and NO-3-N. The gas samples were collected to determine the isotope signatures, and the two end-members mixing model was applied to quantify the respective contributions of microbial processes to N2O production. 【Result】According to the incubation of the soil, the weighted average N2O flux of 95%, 80% and 67% WFPS were 1.17, 0.27 and 0.08mgN·kg-1·d-1, respectively, and the N2O emissions of 95% WFPS were significantly higher than that of both 80% and 67% WFPS, as well as the N2O emissions of 80% WFPS were significantly higher than that of 67% WFPS. The cumulative emissions of (N2O+N2)in 95%, 80% and 67% WFPS were 18.05%, 5.27%, and 1.24% of initial mineral nitrogen, respectively, over the entire incubation period. The cumulative emissions of (N2O+N2) were 19.61, 5.72 and 1.35 mgN·kg-1, respectively; the initial content of NH+4-N+NO-3-N was 108.62 mgN·kg-1. Compared with 67% WFPS, the cumulative (N2O+N2) emissions of 95% and 80% WFPS increased 13.53 and 3.24 times, respectively. The cumulative emissions of (N2O+N2) in 95% WFPS was 2.43 times greater than that of 80% WFPS.The values of reduced NH+4 -N+NO-3-N as gaseous nitrogen increased with the increase of the water content. The weighted averageδ15Nbulk values varied from -42.93‰ to -4.07‰, and the higher level of soil water content showed significantly higher N2O emissions. 10% (V/V) C2H2 would inhibit the reduction of N2O to N2. The δ18O values with 10% (V/V) C2H2 were significantly smaller than that of with 0.1% (V/V) C2H2 in three water content levels. And the ratio of N2O/(N2O+N2) reduced with the increaseof soil moisture. Multiple N2O processes occurred simultaneously in all treatments. The values of SP increased during the initial four days and then decreased gradually with incubation time. The SP values of 67%WFPS treatment at the first two days ranged from 6.74‰ to 12.04‰, and the contribution of denitrification to N2O production was from 56.36% to 66.15%, suggesting that denitrification was the dominant microbial process, then the contribution of nitrification (55.78%-1) to N2O production became greater. The weighted average SP value was 10.26‰ in 80% WFPS treatment, indicating denitrification (40.90%-74.04%) was the major N2O production process. There were larger SP values in 95% WFPS treatment with 10% (V/V) C2H2 in the first seven incubation days, ranged from 7.61‰ to 21.11‰. Compared with 0.1% (V/V) C2H2, the weighted average SP values of N2O under95%, 80% and 67% WFPS treatments with 10% (V/V) C2H2 produced from soil reduced by 0.10, 0.33 and 0.06 times respectively.【Conclusion】 The increase of soil water content promotes N2O emission, and the 95% WFPS treatment showed the highest N2O emissions. In the 67% WFPS treatment, the initial stage of N2O emission was dominated by denitrification, followed bynitrification. Denitrification was the dominate process in 80% WFPS treatment and nitrification was the dominate process in 95% WFPS treatment.
确定
还剩10页未读,是否继续阅读?

艾力蒙塔贸易(上海)有限公司为您提供《不同含水量的土壤中氮氧双同位素检测方案(同位素质谱仪)》,该方案主要用于土壤中其他检测,参考标准--,《不同含水量的土壤中氮氧双同位素检测方案(同位素质谱仪)》用到的仪器有
相关方案
更多
该厂商其他方案
更多