


方案详情
文
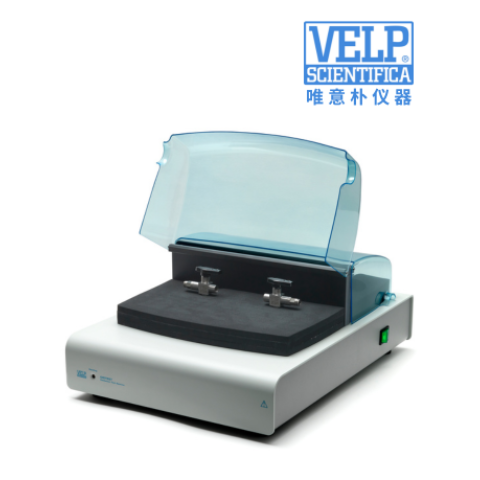
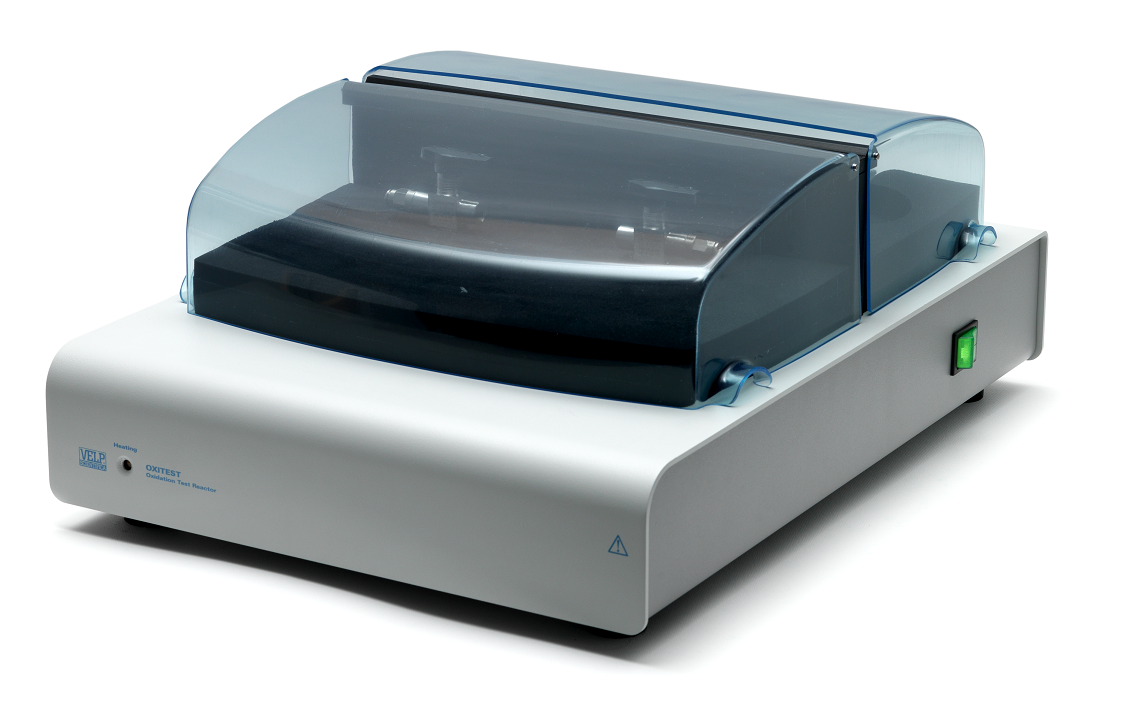
芥花籽油氧化测试根据Verardo等人开发的方法,使用
“ Oxitest”(Velp Scientifica)配备了两个
分开的氧化室。 样品已放置在腔室中,然后将该系统密封,加热到一定温度,然后将氧气注入腔室以达到预定义的氧气压力,分析开始。 任何
可氧化的化合物将与室内的氧气发生反应因此降低了腔室内的气压。 压力在整个过程和诱导过程中对腔室进行监控,使用两切线法获得样品的点(IP)。
方案详情

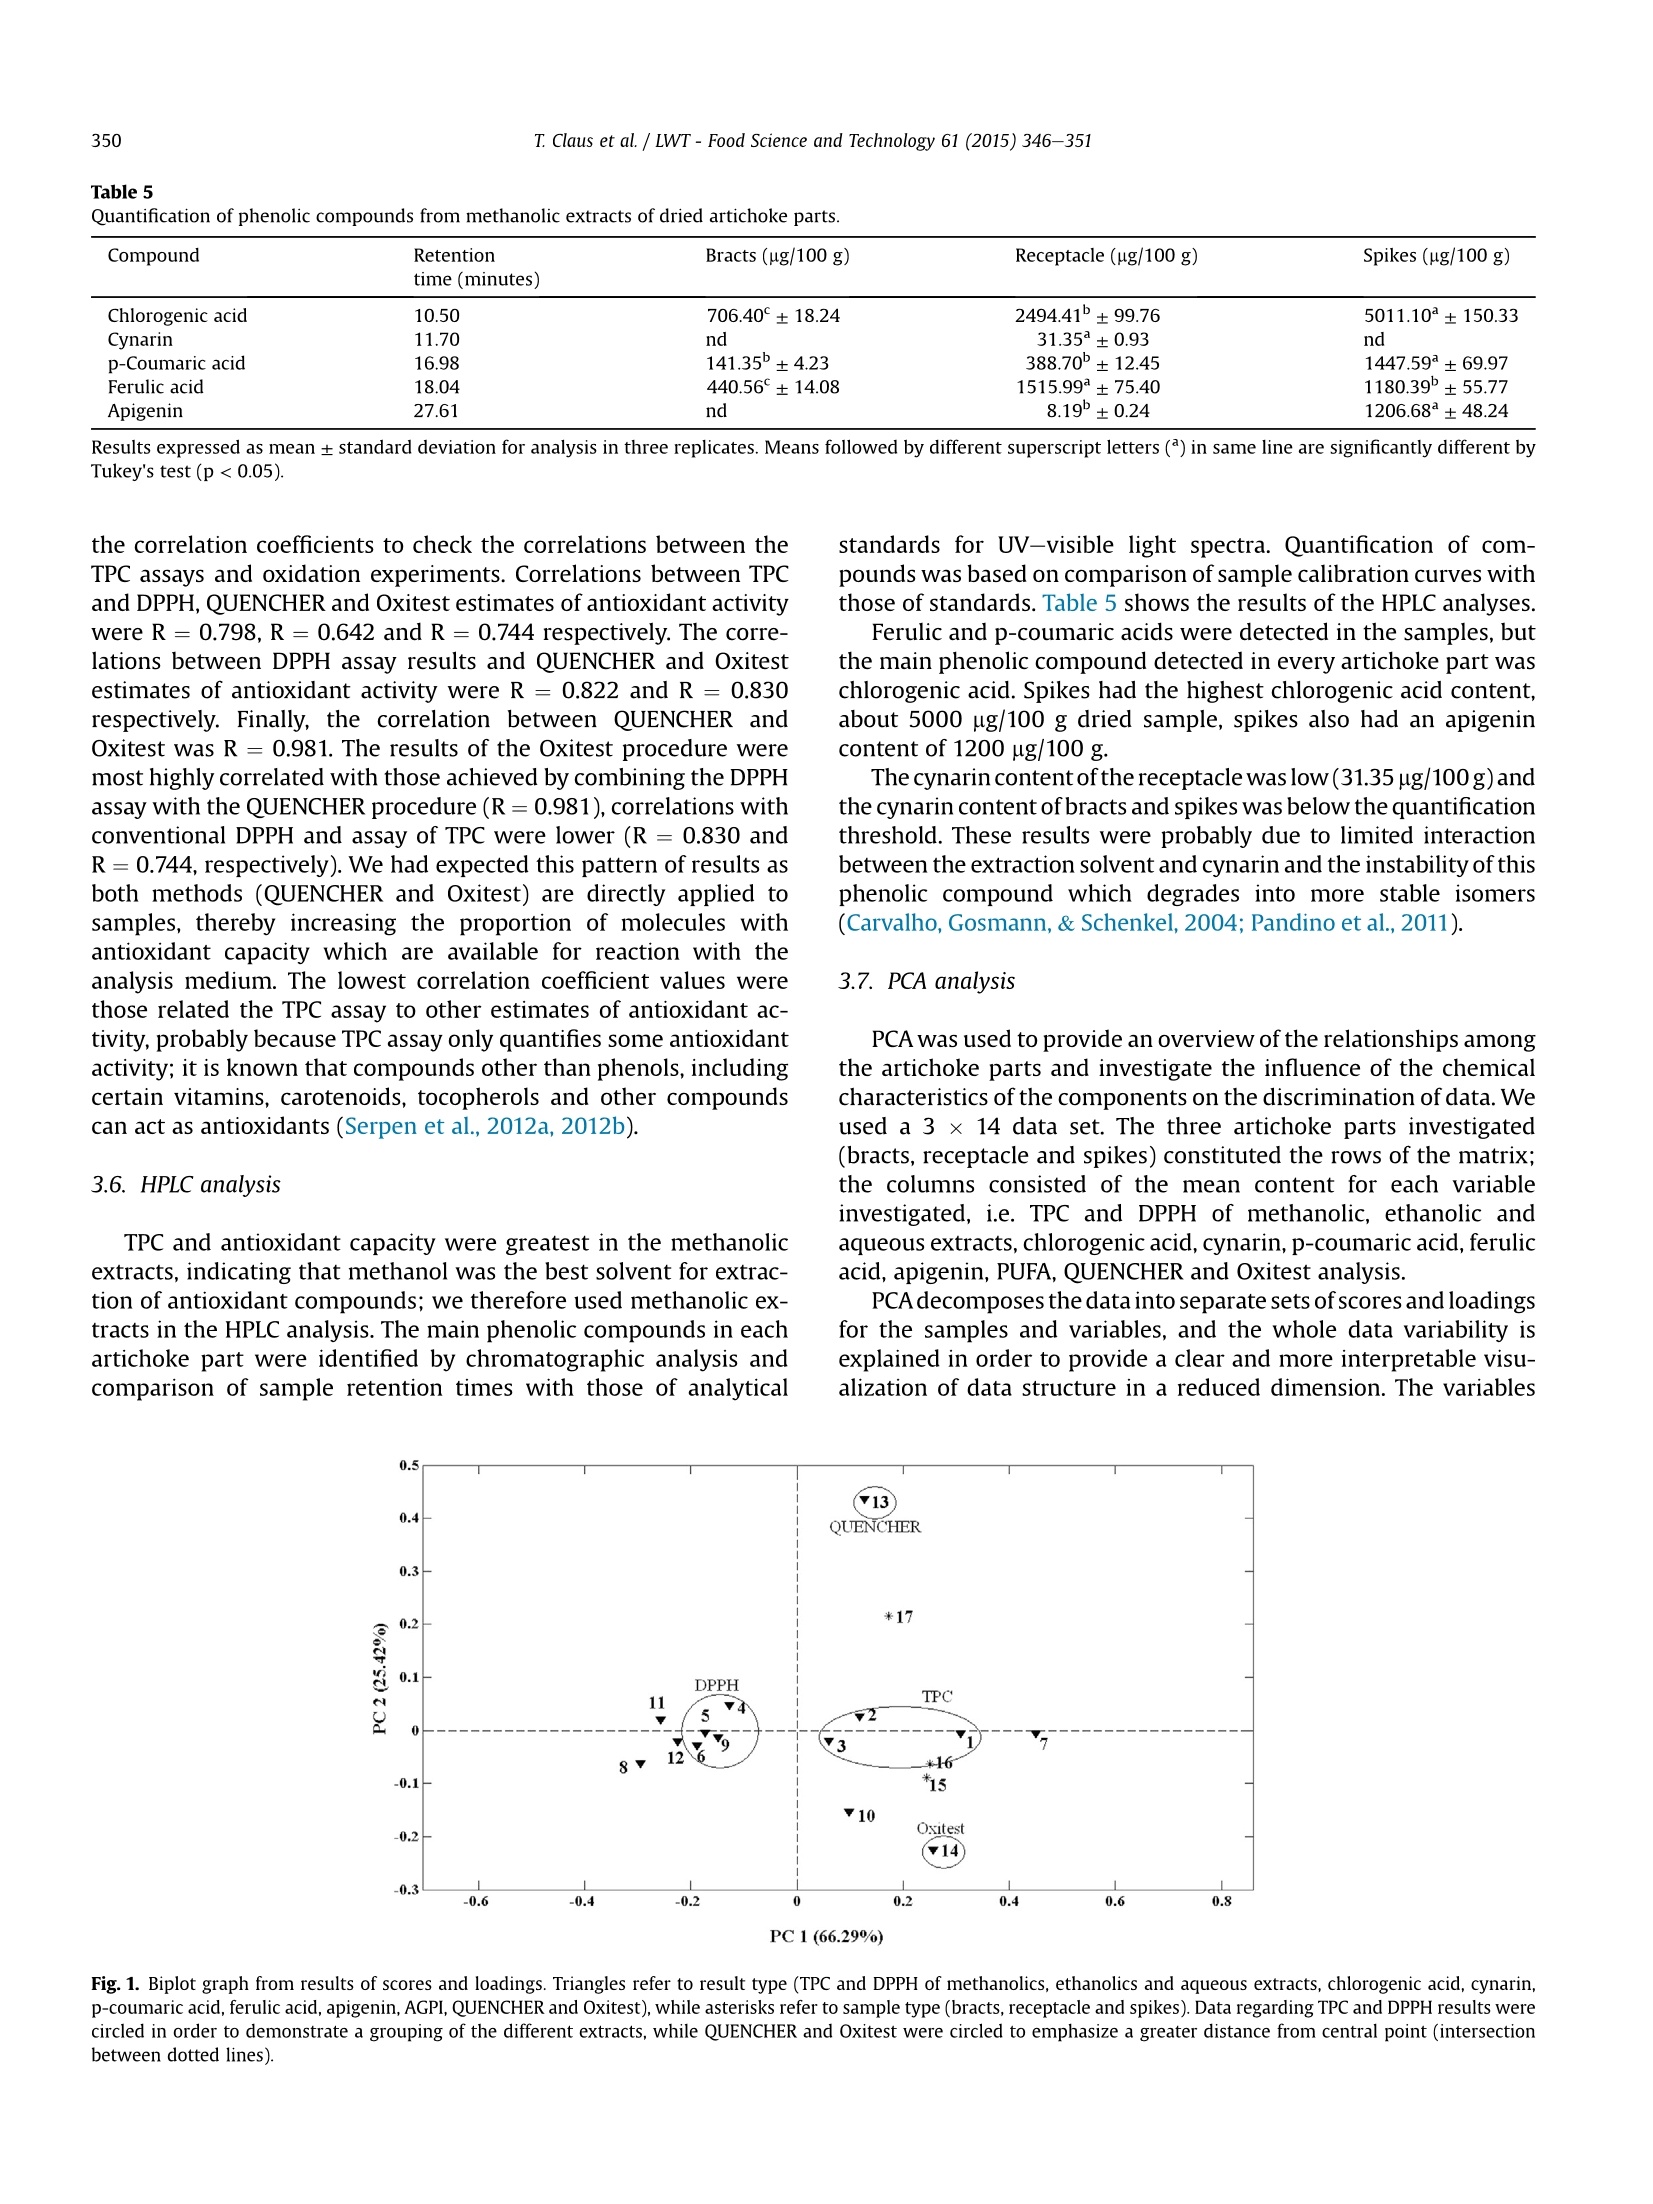
LWT-Food Science and Technology 61 (2015)346-351Contents lists available at ScienceDirect T. Claus et al. /LWT-Food Science and Technology 61 (2015) 346-351347 http://dx.doi.org/10.1016/j.lwt.2014.12.050 LWT- Food Science and Technology ELSEVIER journal homepage: www.elsevier.com/locate/lwt Chemical characterization and use of artichoke parts for protectionfrom oxidative stress in canola oil Thiago Claus", Swami A. Maruyama, Sylvio V. Palombini, Paula F. Montanher,Elton G. Bonafe, Oscar de Oliveira Santos Junior, Makoto Matsushita, Jesuf V. Visentainer State University of Maringa, Department of Chemistry,Av. Colombo, 5790, 87020-900, Maringa, Parana State, Brazil ARTICL E I N F O ABSTRACT Article history: Received 4 August 2014 Received in revised form 13 December 2014 Accepted 21 December 2014 Available online 30 December 2014 Keywords: Antioxidants Fat acids Oxitest The residues of artichoke processing are commonly discarded by the food industry owing to lack ofdetailed knowledge of their chemical composition, which would facilitate research into practical uses forthem. We therefore evaluated proximate and fatty acid compositions, total phenolic compound contentand total antioxidant activity of artichoke parts (bracts, receptacle and spikes) cultivated in Brazil andperformed principal components analysis. Analysis indicated higher concentrations of phenolic com-pounds and antioxidant activity in the spikes than in the bracts and receptacle. In a follow-up experimentwe assessed the lipid protective value of artichoke parts in tests on canola oil using a new instrument,called“Oxitest". The addition of 5 g/100 g of spikes almost doubled the canola oil induction point. Theseresults suggest that artichoke spikes may have industrial applications as natural antioxidant additives tofoods such as canola oil. QUENCHER procedure 2014 Elsevier Ltd. All rights reserved. PCA 1. Introduction The artichoke plant (Cynara cardunculus var. scolymus (L.) Fiori)originated in southern Europe, in the Mediterranean region, and itbelongs to the Asteraceae family, which also includes daises andsunflowers (Lombardo et al., 2010). It is the most important hor-ticultural crop in Italy, followed by potato and tomato (Fratianni,Tucci, De Palma, Pepe, & Nazzaro, 2007). Italy is also the world'sbiggest producer of artichokes with about 480,000 tons harvestedin the year of 2010, followed by Spain (167,000 tons) and France(42,000 tons). Together these three countries are responsible for85% of the total global cultivation area (Lutz, Henriquez, & Escobar,2011; Saez, Fasoli, D'Amato, Simo-Alfonso, & Righetti, 2013). Arti-choke was introduced to Brazil at the beginning of the 20th centuryby Italian immigrants, and nowadays it is mainly grown in thestates of Sao Paulo and Rio Grande do Sul. It is important toremember that Brazilian consumption much lower than Europeanconsumption and sale and production costs are higher because ofthis lower demand, which reduces accessibility (Di Giulio, 2004).Costs are also high because only a small part of the artichoke is ( * Corresponding author. Tel.: + 55 4430113661. ) ( E -mail a ddress: thiago cl au s@ hotma i l. c o m ( T . Claus). ) edible; cultivation produces a large volume of byproducts whichare usually discarded. The edible parts of artichoke and its byproducts contain manychemical compounds known for their beneficial effects in the hu-man body, such as phenolic acids, flavonoids and sesquiterpenes,these compounds help to protect the liver, reduce blood cholesterollevels, have anticarcinogenic activity, and increase the volume ofbile secretion from liver as well as the rate of discharge from thedigestive system (Jacociunas et al., 2013; Lattanzio, Kroon, Linsalata,& Cardinali, 2009; Noldin et al., 2003; Pandino, Lombardo,Mauromicale, & Williamson, 2011; Shen, Dai, & Lu, 2010;Sonnante, De Paolis, Lattanzio, & Perrino, 2002). As well as thesebenefits the compounds listed above are also responsible for theantioxidant activity of artichoke parts; they stabilize free radicals inthe human body (Biglari, Alkarkhi, & Easa, 2008; Ferracane et al.,2008; Rufino, Alves, Fernandes, & Brito, 2011; Vasco, Ruales, &Kamal-Eldin,2008). The ability of antioxidant compounds to delay or inhibitoxidation of substrates has other applications, including protectingedible fats and oils - and even engine lubricants (Focke et al., 2012;Impellizzeri et al., 2012)- against oxidation. In many cases the additive used is a synthetic antioxidant such as2,6-bis(1,1-dimethylethyl)-4-methylphenol (BHT) due to the highactivity per unit weight of these compounds, however there is evidence that they may have harmful effects on human health(Arabshahi-Delouee&UUrooj, 2007;Botterweck, Verhagen,Goldbohm, Kleinjans, & Van Den Brandt, 2000; Dolatabadi &Kashanian, 2010; LeClercq,Arcella, & Turrini, 2000). Chemical andpharmacological research is therefore underway to find naturalantioxidants which are suitable for use in the food industry (Moureet al., 2001). Byproducts of artichoke represent a potential alterna-tive to synthetic antioxidants, because of their low cost and the re-ported antioxidant activity of artichoke cultivated in othercountries; however there is very limited data on the antioxidantcontent and activity of artichokes cultivated in Brazil. Samples of this type can also be tested for ability to protect asubstrate against oxidation. Lipid matrices rich in unsaturated fattyacids (UFAs) are usually more prone to oxidative degradation thansaturated fatty acids (SFAs). The fatty acid composition of canola oil(7.3 g/100 g saturated fatty acids; SFAs, 66.9 g/100 g mono-unsaturated fatty acids; MUFAs and 25.8 g/100 g polyunsaturatedfatty acids; PUFAs; Huang et al., 2008) makes it an excellent sub-strate for lipid degradation tests. The aim of this study was therefore to determine the antioxidantcapacity of artichoke using DPPH radical capture assay, alone and incombination with the QUENCHER procedure, and to evaluate theproximate and fatty acid composition of artichoke parts in terms oftotal phenolic content using high performance liquid chromatog-raphy (HPLC). The ability of samples to delay canola oil oxidationwas tested using a new instrument,“Oxitest". Data on antioxidantactivity were correlated with themselves and with Oxitest data andassays of total phenolic content to extract more information aboutthe chemical composition of sampled artichoke parts. 2. Materials and methods 2.1. Sampling About 36 kg of artichokes (Cynara cardunculus var. scolymus (L.)Fiori) were acquired commercially in three periods separated by30-day intervals, in the city of Maringa, Parana state, Brazil. Sam-ples were washed with running water, dried with paper towels andmanually separated into bracts, spikes and receptacle (heart).Samples from the three different sampling periods were combinedand homogenized in order to minimize the effects of edaphocli-matic variation, which might affect the properties of interest inthese samples. Artichoke parts were dried in a laboratory oven withforced ventilation at 45 °C until constant weight was attained.Dried samples were packed under vacuum in polypropylene bagsand kept in a freezer at -18 C. Prior to analysis samples weretriturated in a knife mill and passed through a 0.177 mm sieve toensure that particle size did not influence the analytical procedures(Gokmen, Serpen, & Fogliano, 2009). 2.2. Reagents and standards Reagents and solvents in analytical and HPLC grades were ac-quired from Fisher Scientific (Fair Lawn, NJ) and Sigma ChemicalsCo (St. Louis, MO). Chlorogenic acid, p-coumaric acid, ferulic acid,apigenin and cynarin standards for HPLC were acquired from SigmaChemicals Co (St. Louis, MO). Ultrapure water (Milli-Q system,Millipore Corp, Bedford, MA) was used in all analyses. 2.3. Chemical analysis All analyses were carried out in triplicate. Total lipid content (TL)of the samples was determined according to the proceduredescribed by Bligh and Dyer (1959). Moisture content was deter-mined using AOAC Official Method 930.15, ash content using AOAC Official Method 942.05 and crude protein (CP) was measured ac-cording to AOAC Official Method 960.52 (1990), using a factor of6.25 to convert percentage nitrogen to percentage protein (Asso-ciation of Official Analytical Chemists AOAC, 2000). Crude fibercontent was determined according to the IAL method (InstitutoAdolfo Lutz, 2008, chap. 4) using digestion with sulfuric acid0.23 mol/L and sodium hydroxide 0.66 mol/L. 2.4. Fatty acid composition Fatty acid methyl esters were prepared by saponification ofsample lipid contents with sodium hydroxide 0.5 mol/L (in meth-anol) followed by methylation with triboronfluoride (12.0 ml BF3 in100.0 ml methanol) (Joseph & Ackman,1992) and separated by gaschromatography (GC) using a Thermo 3300 gas chromatographequipped with a flame ionization detector (FID) and a fused-silicaCP-7420 (SELECT FAME) capillary column (100 m x 0.25 mmi.d. x 0.25 mm cyanopropyl). The operation parameters were asfollows: detector temperature, 240 °C; injection port temperature,230 °C. Column temperature was maintained at 165 °C for 7 min,then raised by 4°C/min to 185 °C and maintained at this temper-ature for 4.67 min. Following this the temperature was raised to235°C at a rate of 6°C/min and maintained at this level for 5 min,giving a 30-min chromatographic run. Carrier gas flow (hydrogen)was 1.2 ml/min; nitrogen at 30 ml/min was used as the makeup gas.The sample split ratio was 1:80. Fatty acids were identified by comparing retention times tothose of standard methyl esters (Sigma, USA). Quantification offatty acids (FAs) was performed using tricosanoic acid methyl ester(Sigma, USA) as an internal standard (Joseph & Ackman, 1992). Peakareas were determined using the Chromquest 5.0 software. 2.5. Preparation of extracts Methanolic,ethanolic and aqueous extracts were obtained fromall prepared sample in proportions of 1:10 (m/v). Methanolic andethanolic extracts were stirred for 4 h at room temperature (25°C)then subjected to rotary evaporation to remove solvents. Aqueousextracts were stirred for 8 min at 80 °C. After cooling the solventwas sublimated in a lyophilizer (model Alpha 1-2 LD plus, MartinChrist, Germany). All extracts were stored in eppendorfs, protectedfrom light, in a freezer at -18 °C until the analysis. 2.6. Analysis ofantioxidant capacity using conventional DPPH assay Initially, the antioxidant capacity of extracts was measuredthrough a conventional DPPH (2,2-Diphenyl-1-picrylhydrazyl) freeradical capture method, following the procedure described by Brand-Williams, Cuvelier, and Berset (1995), with some modifications (Maet al., 2011). Extracts were prepared as 2.0 mg/ml solutions then25.0 pl aliquots were mixed with 2.0 ml of a methanolic solution of6.25×10-5mol/LDPPH. The mixture was kept in the dark for 30 minand absorbance at 517 nm was measured in a spectrophotometer(Genesys 10 uv, Thermo Scientific, Madison, USA). Methanolic solu-tions of Trolox ((±)-6-hydroxi-2,5,7,8-tetramethylcromane-2-car-boxylic acid) with different concentrations were used to achieve thecalibration curve and the antioxidant capacity was expressed inmmol Trolox equivalent (TE)/100 g dried sample. 2.7. Antioxidant capacity analysis through DPPH assay paired withQUENCHER procedure The QUENCHER (QUick, Easy, New, CHEap and Reproducible)procedure is a recently developed procedure for measuring theantioxidant capacity of foods directly (Gokmen et al., 2009). It has Table 1Proximate composition of dried artichoke. Parts Initial moisture Moisture after Ash (g/100 g) Crude protein Total lipids Fiber (g/100 g) (g/100 g) drying (g/100 g) (g/100 g) (g/100 g) Bracts 80.65±2.12 4.49±0.01 5.37±0.16 10.35°±0.05 2.04±0.03 44.23±1.29 Receptacle 88.44±0.30 4.63±0.06 12.32±0.12 24.27±0.12 1.34±0.02 13.07±0.56 Spikes 80.98±0.75 2.94±0.09 7.31±0.12 20.61±0.03 9.17±0.28 27.79±1.14 Results expressed as mean± standard deviation for analysis in three replicates. Means followed by different superscript letters () in same column are significantly different byTukey's test (p <0.05). the advantages that it can be combined with DPPH radical assayand avoids the use of solvent extraction procedures which affectthe evaluation of antioxidants in ways which are explained below(Section 3.3). Analyses were done according to the proceduredescribed by Serpen, Gokmen, and Fogliano (2012a). A solution ofDPPH was obtained by dissolving 40 mg DPPH in 200 ml ethanol/water mixture (1:1, ml:ml). An absorbance value of 0.75-0.80 wasachieved by diluting the solution in approximately 800 ml ethanol/water (1:1, ml:ml) mixture. About 10 mg of sample was weighed;bract and receptacle samples were mixed with 10.0 ml DPPH, spikesamples were mixed with 50.0 ml DPPH. Mixtures were protectedfrom light and subjected to magnetic stirring for 5, 10,15, 30, 45 or60 min reaction time. After this mixtures were centrifuged at9200 g for 5 min, then the absorbance of the supernatant wasmeasured in a spectrophotometer (Genesys 10 uv, Thermo Scien-tific, Madison, USA), with a wavelength of 525 nm. MethanolicTrolox solutions of different concentrations were used to achieve10 ml and 50 ml calibration curves and the antioxidant capacitywas expressed in mmol TE/100 g of dried sample. 2.8. Total phenolic compounds The total phenolic compound content (TPC) was determinedaccording to the procedure described by Shahidi and Naczk (1995).Extracts were prepared as 2.5 mg/ml solutions; a 250 pl aliquot ofthe solution was added to a tube with 250 ul Folin-Ciocalteau re-agent (diluted 1:1 in distilled water), 500 pl saturated Na2CO3 So-lution and 4.0 ml distilled water. These mixtures were kept allowedto rest for 25 min at room temperature then centrifuged at 3800 gfor 10 min. Supernatant absorbance at 725 nm was measured witha Genesys 10 uv (Thermo Scientific, Madison, USA) spectropho-tometer. Gallic acid solutions of different concentrations were usedto achieve the calibration curves, and results were expressed as mggallic acid equivalent (GAE)/100 g dried sample. 2.9. Preparation of standards for HPLC Every standard used was carefully weighed, dissolved in meth-anol then submitted to sonication for 10 min. Calibration curveswere obtained from chlorogenic acid, p-coumaric acid, ferulic acid,apigenin and cynarin solutions at concentrations ranging from 0.01to 0.5 mmol/L (Fratianni et al., 2007). 2.10. Quantification of phenolic compounds using HPLC All HPLC experiments were done at room temperature in a VarianPro Star equipment with a Star Chromatography Workstationrunning LC control software (Varian Analytical Instruments), aRheodyne manual injection valve (50 pl loop), a Pro Star 350photodiode array detection (DAD) connected to a Polyview 2000TMprogram and a MicrosorbC18(250mmx4.6mm,particle size: 5 um)column. The method was based that of Fratianni et al. (2007). Themobile phase (MP) consisted of two solutions: Milli-Q water with1 ml/100 ml acetic acid (solution A) and acetonitrile solution con-taining 1 ml/100 ml acetic acid(solution B). The MP gradient startedwith an A:B ratio of 90:10, this was adjusted to 50:50 over 30 min at alinear rate of change.Shortly after this the ratio was changed to 0:100over 5 min. The ratio was held at 0:100 for 2 min before beingreturned to 90:10 over 2 min after which it remained unchangeduntil the end of the run. Total run time was 49 min; MP flow rate was0.8 ml/min and the detector wavelength was set at280 nm. 2.11. Oxidation ofcanola oil by artichoke parts Canola oil oxidation tests were conducted according to themethod developed by Verardo et al. (2013) using a reactor called“Oxitest” (Velp Scientifica, Usmate,Milan,Italy),equipped with twoseparated oxidation chambers. The sample of interest was placedin a chamber, then this system was sealed, heated to a certain Table 2Fatty acid quantification (mg/100 g) for dried artichoke parts. Fatty acids Artichoke parts Bracts Receptacle Spikes 16:0 (Palmitic acid) 229.95°±20.94 327.74C±31.61 2303.58±146.02 18:0 (Stearic acid) 13.37±2.27 16.80±0.91 297.20±15.08 18:1n-9 (Oleic acid) 17.80±2.75 19.44±1.59 99.87±8.60 18:1n-7 (cis-Vaccenicacid) 6.74±1.06 12.99±1.72 51.84±6.31 18:2n-6 (Linoleic acid) 518.92±39.93 784.66±71.32 3462.87°±189.87 18:3n-3 (alpha-Linolenic acid) 242.60±19.04 151.67°±14.49 987.74±34.42 20:0 (Arachidic acid) 7.51±0.69 10.50±0.82 180.52±21.45 22:0 (Behenic acid) 5.66±0.67 4.36±0.86 52.91*±5.89 20:4n-6 (Arachodonic acid) 9.00±0.94 11.10±1.48 127.94±8.80 20:5n-3 (Eicosa-pentaenoic acid) 20.49±1.75 16.07±1.21 175.60±11.32 SFA 256.49±21.08 359.40c±31.64 2600.78±148.47 MUFA 24.54±2.95 32.43±2.34 151.71±10.67 PUFA 796.41±44.2 963.50±72.80 4754.15°±193.50 n-6/n-3 2.00°±0.35 4.74±0.96 3.09±0.35 Results expressed as mean ±standard deviation for analysis in three replicates.Means followed by different superscript letters () in same column are significantly different byTukey's test (p <0.05). SFA: sum of saturated fatty acids. MUFA: sum of monounsaturated fatty acids. PUFA: sum of polyunsaturated fatty acids. Total content of phenolic compounds and total antioxidant capacity of methanolic (ME), ethanolic (EE), aqueous (AE) extracts and QUENCHER for the artichoke parts. Artichoke part TPC (mg EAG/100 g) DPPH (mmol Trolox/100 g) QUENCHER ME EE AE ME EE AE (mmol Trolox/100 g) Bracts 706.48°±11.88 307.89°±9.46 280.76°±9.21 155.73°±0.65 129.15°±0.93 138.85°±0.74 273.52±15.19 Receptacle 1637.89±37.00 1452.74±18.22 1310.05±23.66 294.17±2.23 249.09±0.86 198.85±1.24 356.13±11.72 Spikes 4290.23±51.38 3429.86±60.25 2538.18±37.78 2333.12±17.20 1438.88±10.74 1067.52±3.15 8573.36±254.70 Results expressed as mean ±standard deviation for analysis in three replicates. Means followed by different superscript letters () in same column are significantly different byTukey's test (p<0.05). temperature and oxygen was injected into the chamber to achieve apre-defined oxygen pressure.When the oxygen has been added thechamber was electronically locked and the analysis begins. Anyoxidizable compound will react with the oxygen in the chamberthus reducing the gas pressure inside the chamber. The pressure inthe chamber is monitored throughout the procedure and the in-duction point (IP) of the sample was obtained using the two-tangent method. If a compound which delays sample oxidation isadded to the system the latency to a measurable decrease in oxygenpressure will be increased. The Oxitest method thus offers an effi-cient method of assessing the ability of a given compound to delayor inhibit the oxidation of a given substrate. All tests for this studywere performed at a temperature of 90 °C with an initial oxygenpressure of 588 kPa, 99.9999% purity. Samples of artichoke part(0.25 g) were added to 5 g canola oil. Oxidation of the pure oil(control) and of canola oil plus 0.001 g BHT (reference) were alsoassessed. It is very important to note that the percentage BHT usedin the reference test is the maximum allowed for use in foods by theFood and Drug Administration (FDA). Each experiment wasrepeated three times. 2.12. Statistical analysis Data were subjected to ANOVA and means were compared usingthe Tukey test conducted using Statistica, version 7.0. Correlationcoefficients (R) were calculated to determine the relationship be-tween the obtained results using Microsoft Office Excel, version2007. Principal components analysis (PCA) was carried out usingMATLAB 2007. 3. Results and discussion 3.1. Yield and chemical analysis Processing the artichoke into parts yielded the following pro-portions by mass for the various parts,receptacle: 22.70 g/100 g;bracts: 56.14 g/100 g and spikes: 21.16 g/100 g. Only the receptacleis edible, so all the other parts (about 77% by mass of the wholeartichoke) are discarded by the food industry, generating a largeamount of residue. The results of the chemical analyses of moisture content, ashcontent, TL and crude fiber content are presented in Table 1. Initialmoisture values of artichoke were high, ranging from 80.65 g/100 g(bracts) to 88.44 g/100 g (receptacle), however after the dryingprocess moisture content of all parts was less than 4.7 g/100 g. 3.2. Fatty acid composition Table 2 shows the ten main FAs which were detected in driedartichoke parts, four SFAs, two MUFAs and four PUFAs (two n-6;two n-3). The main compounds in the SFA, MUFA and PUFA groupswere palmitic (16:0), oleic (18:1 n-9) and linoleic (18:2 n-6) acidsrespectively.Alpha-linolenic acid (18:3 n-3) was also a significantproportion of PUFA content. 3.3. Total phenolic content and antioxidant capacity The results of assays of TPC and antioxidant capacity assays arelisted in Table 3. The significant differences between the results ofconventional DPPH assay and the QUENCHER procedure notwith-standing it was clear that TPC was higher in spikes than in any otherartichoke part sampled; spikes also had the highest antioxidantactivity. Combining the QUENCHER procedure with the DPPH assay ledto greater results of antioxidant activity from artichoke parts thanthe same method executed with sample extracts. Conventional methods use solvents to extract the compoundspossessing antioxidant activity from samples. A fraction of everysample will remain insoluble regardless of the solvent chosen soextraction cannot be complete; some of the compounds of interestmay be retained in the insoluble fraction, leading to underestima-tion of antioxidant activity (Serpen et al., 2012) by the QUENCHERprocedure. Estimates of antioxidant activity based on extraction areusually less accurate when the substance contains amino acids,fibers or uronic acids (Perez-Jimenez & Saura-Calixto,2006). 3.4. Capacity of artichoke parts to delay oxidation of canola oil The Oxitest method proved a very effective method ofcomparing oxidation of canola oil with and without addition ofartichoke parts. Data from tests in the Oxitest reactor are given inTable 4. Canola oil without additives starts to oxidize in892±7.0 min; adding 0.001 g BHT delays oxidation by 347 min(38.90% increase in oxidation latency). Bracts and receptacle wereless effective than BHT in delaying oxidation (oxidation latency wasincreased by 15.58% and 24.10% respectively), but adding 0.25 gartichoke spikes delayed oxidation by 649 (a 72.75% increase inoxidation latency compared to the control). This is a very impres-sive result; artichoke spikes show superior antioxidant activity toBHT and they are from a natural source -unused byproducts of thefood industry - unlike BHT. 3.5. Correlation analysis The calculation of correlation coefficients (R) is useful for con-firming the strength of predicted relationships. In this work we used Table 4Induction points of the oxidation experiments with canola oil. Canola oil Induction point (minutes) Without antioxidants 892.0°±7.0 With 0.02 g/100 g of BHT 1239.0±12.5 With 5 g/100 g of artichoke bracts 1031.0±6.3 With 5 g/100 g of artichoke receptacle 1107.0°±9.6 With 5 g/100 g of artichoke spikes 1541.0±9.3 Results expressed as mean± standard deviation for analysis in three replicates.Means followed by different superscript letters () in same column are significantlydifferent by Tukey's test (p <0.05). Compound Retention Bracts (ug/100 g) Receptacle (ug/100 g) Spikes (ug/100 g) time (minutes) Chlorogenic acid 10.50 706.40°±18.24 2494.41±99.76 5011.10±150.33 Cynarin 11.70 nd 31.35±0.93 nd p-Coumaric acid 16.98 141.35±4.23 388.70±12.45 1447.59°±69.97 Ferulic acid 18.04 440.56±14.08 1515.99±75.40 1180.39±55.77 Apigenin 27.61 nd 8.19±0.24 1206.68±48.24 Results expressed as mean ± standard deviation for analysis in three replicates. Means followed by different superscript letters () in same line are significantly different byTukey's test (p<0.05). the correlation coefficients to check the correlations between theTPC assays and oxidation experiments. Correlations between TPCand DPPH, QUENCHER and Oxitest estimates of antioxidant activitywere R=0.798, R=0.642 and R= 0.744 respectively. The corre-lations between DPPH assay results and QUENCHER and Oxitestestimates of antioxidant activity were R=0.822 and R= 0.830respectively. Finally, the correlation between QUENCHER andOxitest wa R =0.981. The results of the Oxitest procedure weremost highly correlated with those achieved by combining the DPPHassay with the QUENCHER procedure (R=0.981), correlations withconventional DPPH and assay of TPC were lower (R =0.830 andR=0.744, respectively). We had expected this pattern of results asboth methods (QUENCHER and Oxitest) are directly applied tosamples, thereby increasing the proportion of molecules withantioxidant capacity which are available for reaction with theanalysis medium. The lowest correlation coefficient values werethose related the TPC assay to other estimates of antioxidant ac-tivity, probably because TPC assay only quantifies some antioxidantactivity; it is known that compounds other than phenols, includingcertain vitamins, carotenoids, tocopherols and other compoundscan act as antioxidants (Serpen et al., 2012a,2012b). 3.6. HPLC analysis TPC and antioxidant capacity were greatest in the methanolicextracts, indicating that methanol was the best solvent for extrac-tion of antioxidant compounds; we therefore used methanolic ex-tracts in the HPLC analysis. The main phenolic compounds in eachartichoke part were identified by chromatographic analysis andcomparison of sample retention times with those of analytical standards for UV-visible light spectra. Quantification of com-pounds was based on comparison of sample calibration curves withthose of standards. Table 5 shows the results of the HPLC analyses. Ferulic and p-coumaric acids were detected in the samples, butthe main phenolic compound detected in every artichoke part waschlorogenic acid. Spikes had the highest chlorogenic acid content,about 5000 pg/100 g dried sample, spikes also had an apigenincontent of 1200 pg/100 g. The cynarin content ofthe receptacle was low(31.35pg/100g)andthe cynarin content of bracts and spikes was below the quantificationthreshold. These results were probably due to limited interactionbetween the extraction solvent and cynarin and the instability of thisphenolic compound which degrades into more stable isomers(Carvalho, Gosmann, & Schenkel, 2004; Pandino et al., 2011). 3.7. PCA analysis PCA was used to provide an overview of the relationships amongthe artichoke parts and investigate the influence of the chemicalcharacteristics of the components on the discrimination of data. Weused a 3 × 14 data set. The three artichoke parts investigated(bracts, receptacle and spikes) constituted the rows of the matrix;the columns consisted of the mean content for each variableinvestigated, i.e. TPC and DPPH of methanolic, ethanolic andaqueous extracts,chlorogenic acid, cynarin,p-coumaric acid, ferulicacid, apigenin, PUFA, QUENCHER and Oxitest analysis. PCAdecomposes the data into separate sets of scores and loadingsfor the samples and variables, and the whole data variability isexplained in order to provide a clear and more interpretable visu-alization of data structure in a reduced dimension. The variables PC1 (66.29%) Fig. 1. Biplot graph from results of scores and loadings. Triangles refer to result type (TPC and DPPH of methanolics, ethanolics and aqueous extracts, chlorogenic acid,cynarin,p-coumaric acid, ferulic acid, apigenin, AGPI, QUENCHER and Oxitest), while asterisks refer to sample type (bracts, receptacle and spikes). Data regarding TPC and DPPH results werecircled in order to demonstrate a grouping of the different extracts, while QUENCHER and Oxitest were circled to emphasize a greater distance from central point (intersectionbetween dottedlines). investigated were measured on different scales so we chose to use anautoscaled data matrix which allowed the variance of all variables tobe identical in the first instance. The two principal components explained 91.71% of all variancein the data. The entire data set was visualized using a biplot(combined scores and loadings plot for two components) which isshown in Fig. 1. The spikes (*17) differ from bracts (*15) and receptacle (*16) bypresenting opposing positions on the axis of PC2. The results of theDPPH and TPC assays were grouped around the central Cartesianpoint indicating that they were not influential components. How-ever, QUENCHER procedure showed a significant correlation withspikes because point *17 is the closest to point 13. This pattern ofresults indicates that the QUENCHER procedure is valuable forevaluation of artichoke parts as the radical used (DPPH) reacts withmore antioxidant compounds than the common DPPH assay whichrelies on extraction. 4. Conclusion As in other countries the only part of artichoke cultivated inBrazil (Cynara cardunculus var. scolymus (L.) Fiori) which is edible isthe receptacle. Knowledge about the artichoke receptacle increasedfollowing evaluation of their proximate and FA composition. Allparts of the artichoke have antioxidant activity, as the TPC andDPPH/QUENCHER assays in this study have demonstrated. Theseassays indicated that TPC and antioxidant activity are concentratedin the spikes of artichokes. This finding was corroborated by HPLC,in which the greatest concentrations of chlorogenic, ferulic and p-coumaric acids and apigenin were detected in the spikes. Unlike the other artichoke parts spikes showed a remarkablecapacity to delay oxidation of canola oil, producing results superiorto that of BHT added at 0.02 g/100 g. This effect can be attributed tothe overall antioxidant activity of spikes, indicated by the strongcorrelation between the Oxitest results and the results of DPPHradical capture assay combined with QUENCHER? procedure(R=0.9814). Artichoke spikes are therefore strong candidates foruse in the food industry as natural additives against oxidation offoods such as canola oil although assessments of taste modificationor product allergenicity are required to evaluate the food safety ofsuch a product. Acknowledgments The authors would like to thank CAPES for financial support andCocamar-Cooperativa Agroindustrial de Maringa, for the donationof canola oil. References Arabshahi-Delouee, S.,& Urooj, A. (2007). Antioxidant properties of various solventextracts of mulberry (Morus indica L.)leaves. Food Chemistry, 102, 1233-1240.Association of Official Analytical Chemists.(2000).Official methods ofanalysis of the association of official analytical chemists. Gaithersburg (17th ed.). Biglari, F., Alkarkhi, A. F. M., & Easa, A. M.(2008). Antioxidant activity and phenoliccontent of various date palm (Phoenix dactylifera) fruits from Iran. Food Chem-istry, 107,1636-1641. Bligh, E. G., & Dyer, W. J (1959). A rapid method of total lipid extraction andpurification. Canadian Biochemistry Physiology, 37,911-917. Botterweck, A. A. M., Verhagen, H., Goldbohm, R. A., Kleinjans, J, & Van DenBrandt, P. A. (2000). Intake of butylated hydroxyanisole and butylatedhydroxytoluene and stomach cancer risk: results from analyses in theNetherlands Cohort study. Food and Chemical Toxicology, 38, 599-605. Brand-Williams, W.,Cuvelier, M. E., & Berset, C. (1995). Use of a free radical method to evaluate antioxidant activity. LWT- Food Science and Technology, 28, 25-30.Carvalho, J. C. T., Gosmann, G., & Schenkel, E. P. (2004). Farmacognosia: da planta ao medicamento (5th ed.). Brazil: Porto Alegre/Florianopolis. Di Giulio, G.(2004). Falta pesquisa para aumentar producao de alcachofra no Brasil.Ciencia e Cultura, 56, 13-14. Dolatabadi, J. E. N., & Kashanian, S. (2010). A review on DNA interaction withsynthetic phenolic food additives. Food Research International, 43, 1223-1230. Ferracane, R., Pellegrini, N., Visconti, A., Graziani, G., Chiavaro, E., Miglio, C., et al.(2008). Effects of different cooking methods on antioxidant profile, antioxidantcapacity, and physical characteristics of artichoke. Journal of Agricultural andFood Chemistry,56,8601-8608. Focke, W. W.,Westhuizen,I. V. D.,Grobler, L., Nshoane, K. T., Reddy,J. K., & Luyt, A. S.(2012). The effect of synthetic antioxidants on the oxidative stability of bio-diesel.Fuel, 94. 227-233. Fratianni, F., Tucci, M., De Palma, M., Pepe, R., & Nazzaro, F. (2007). Polyphenoliccomposition in different parts of some cultivars of globe artichoke (Cynaracardunculus L. var. scolymus (L.) Fiori). Food Chemistry, 104, 1282-1286. Gokmen, V., Serpen, A., & Fogliano, V.(2009). Direct measurement of the totalantioxidant capacity of foods: the 'QUENCHER' approach. Trends in Food Scienceand Technology, 20, 278-288. Huang, S. S. Y., Fu, C. H. L., Higgs, D. A., Balfry, S. K., Schulte, P. M., & Brauner, C. J.(2008). Effects of dietary canola oil level on growth performance, fatty acidcomposition and ionoregulatory development of spring chinook salmon parr(Oncorhynchus tshawytscha). Aquaculture, 274, 109-117. Impellizzeri, D., Esposito,E., Mazzon, E., Paterniti, I., Di Paola, R., Bramanti, P., et al.(2012). The effects of a polyphenol present in olive oil, oleuropein aglycone, inan experimental model of spinal cord injury in mice. Biochemistry Pharma-cology, 83, 1413-1426. Instituto Adolfo Lutz. (2008). Normas Analiticas do Instituto Adolfo Lutz. Metodosquimicos e fisicos para analise de alimentos (4th ed.).Sao Paulo: Digital. Jacociunas, L. V., Andrade, H. H. R., Lehmann, M., Abreu, B. R. R., Ferraz, A. B. F.,Silva,J., et al. (2013). Artichoke induces genetic toxicity in the cytokinesis-blockmicronucleus (CBMN) cytome assay. Food and Chemical Toxicology,55, 56-59. Joseph,J. D., & Ackman,R. G.(1992). Capillary column gas-chromatographic methodfor analysis of encapsulated fish oils and fish oil ethyl-esters-collaborativestudy. Journal of AOAC International, 75, 488-506. Lattanzio, V., Kroon, P. A., Linsalata, V.,& Cardinali, A. (2009). Globe artichoke: afunctional food and source of nutraceutical ingredients. Journal of FunctionalFoods, 1, 131-144. LeClercq, C., Arcella, D., & Turrini, A. (2000). Estimates of the theoretical maximumdaily intake of erytho1r0bic acid, gallates,butylated hydroxyanisole (BHA) andbutylated hydroxytoluene (BHT) in Italy: a stepwise approach. Food andChemical and Toxicology, 38, 1075-1084. Lombardo, S.,Pandino, G., Mauromicale, G., Knodler, M., Carle, R., & Schieber, A.(2010). Influence of genotype, harvest time and plant part on polyphenoliccomposition of globe artichoke [Cynara cardunculus L. var. scolymus (L.) Fiori].Food Chemistry, 119, 1175-1181. Lutz, M., Henriquez, C., & Escobar, M. (2011). Chemical composition and antioxidantproperties of mature and baby artichokes (Cynara scolymus L.), raw and cooked.Journal of Food Composition and Analysis, 24, 49-54. Ma,X., Wu,H., Liu, L., Yao,Q.,Wang,S.,Zhan,R.,et al.(2011). Polyphenolic compoundsand antioxidant properties in mango fruits. Scientia Horticulturae,129,102-107.Moure, A., Cruz, J. M.,Franco, D., Dominguez,J. M., Sineiro, J., Dominguez, H., et al. (2001).Natural antioxidants from residual sources. Food Chemistry, 72,145-171. Noldin, V. F., Filho, V. C., Monache, F. D., Benassi,J. C., Christmann, I. L., Pedrosa,R. C.,et al. (2003). Composicao quimica e atividades biologicas das folhas de Cynarascolymus L. (Alcachofra) cultivada no Brasil. Quimica Nova, 26, 331-334. Pandino, G., Lombardo, S., Mauromicale, G., & Williamson, G. (2011). Profile ofpolyphenols and phenolic acids in bracts and receptacles of globe artichoke(Cynara cardunculus var. scolymus) germplasm. Journal of Food Composition andAnalysis, 24, 148-153. Perez-Jimenez, J.,& Saura-Calixto, F. (2006). Effect of solvent and certain food0,1.constituents on different antioxidant capacity assays. Food Research Interna-tional, 39, 791-800. Rufino, M. S. M., Alves, R. E., Fernandes, F. A. N., & Brito, E. S.(2011). Free radicalscavenging behavior of ten exotic tropical fruits extracts. Food Research Inter-national, 44, 2072-2075. Saez,V., Fasoli, E., D'Amato, A., Simo-Alfonso, E., & Righetti,P. G. (2013). Artichokeand cynar liqueur: two (not quite) entangled proteomes. Biochimica et Bio-physica Acta, 1834, 119-126. Serpen, A., Gokmen, V., & Fogliano, V. (2012a). Solvent effects on total antioxidantcapacity of foods measured by direct QUENCHER procedure. Journal of FoodComposition and Analysis, 26, 52-57. Serpen, A., Gokmen, V., & Fogliano, V. (2012b). Total antioxidant capacities of rawand cooked meats. Meat Science, 90, 60-65. Shahidi, F, & Naczk, M. (1995). Food phenolics: Sources, chemistry, effects andapplications. Lancaster: Technomic Publishing Company. Shen,Q., Dai, Z., & Lu, Y. (2010). Rapid determination of caffeoylquinic acidderivatives in Cynara scolymus L. by ultra-fast liquid chromatography/tandemmass spectrometry based on a fused core C18 column. Journal of SeparationScience, 33, 3152-3158. Sonnante, G., De Paolis, A., Lattanzio, V., & Perrino, P. (2002). Genetic variation inwild and cultivated artichoke revealed by RAPD markers. Genetic Resources andCrop Evolution, 49, 247-252. Vasco,C., Ruales, J., & Kamal-Eldin, A. (2008). Total phenolic compounds and anti-oxidant capacities of major fruits from ecuador. Food Chemistry,111,816-823. Verardo, V., Riciputi, Y., Sorrenti, G., Ornaghi, P., Marangoni, B., & Caboni, M. F.(2013). Effect of nitrogen fertilisation rates on the content of fatty acids, sterols,tocopherols and phenolic compounds, and on the oxidative stability of walnuts.LWT- Food Science and Technology, 50, 732-738. 利用OXITEST分析菜籽油的氧化稳定性
确定
还剩4页未读,是否继续阅读?

产品配置单

意大利VELP公司为您提供《菜籽油中氧化稳定性检测方案(氧化分析仪)》,该方案主要用于食用植物油中理化分析检测,参考标准--,《菜籽油中氧化稳定性检测方案(氧化分析仪)》用到的仪器有VELP Oxitest 油脂氧化分析仪
推荐专场

相关方案
更多
该厂商其他方案
更多