


方案详情
文
采用LaVision公司DaVis 8.3.0软件平台上加载的数字全场数字图像相关处理软件模块DVC,对高温下核石墨材料内部的形变,应变以及损伤容限进行了实验测量和分析。
方案详情

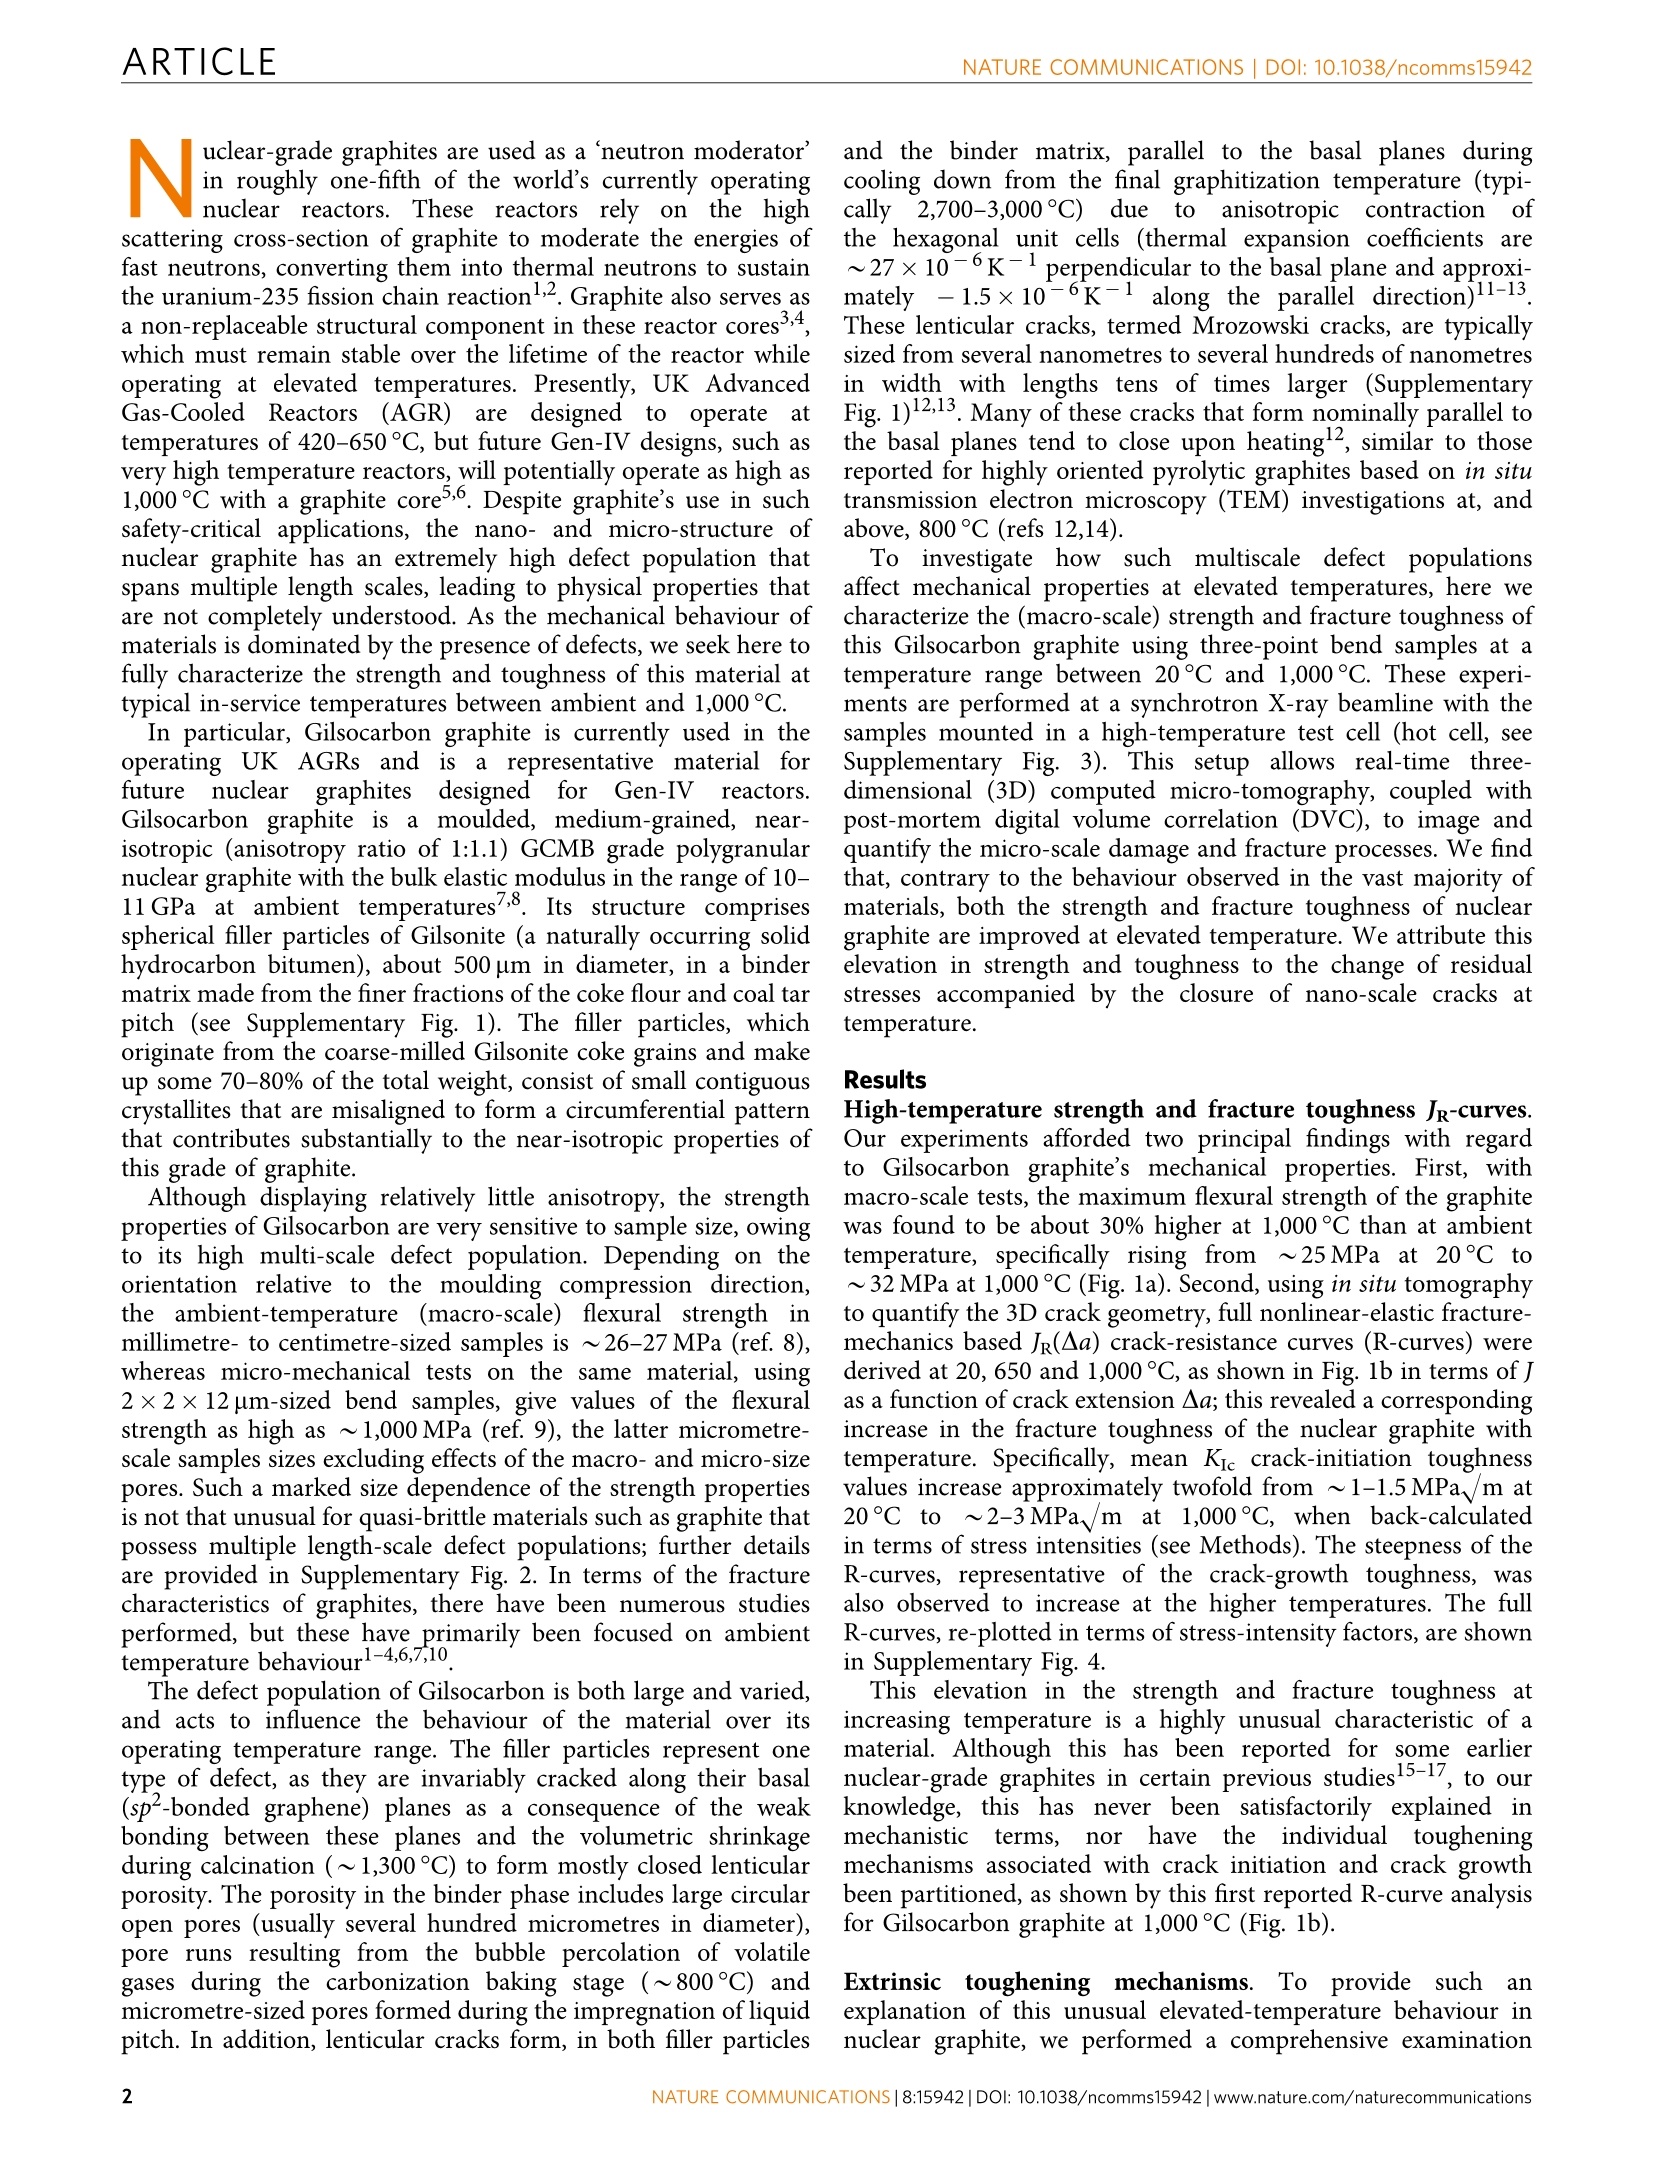
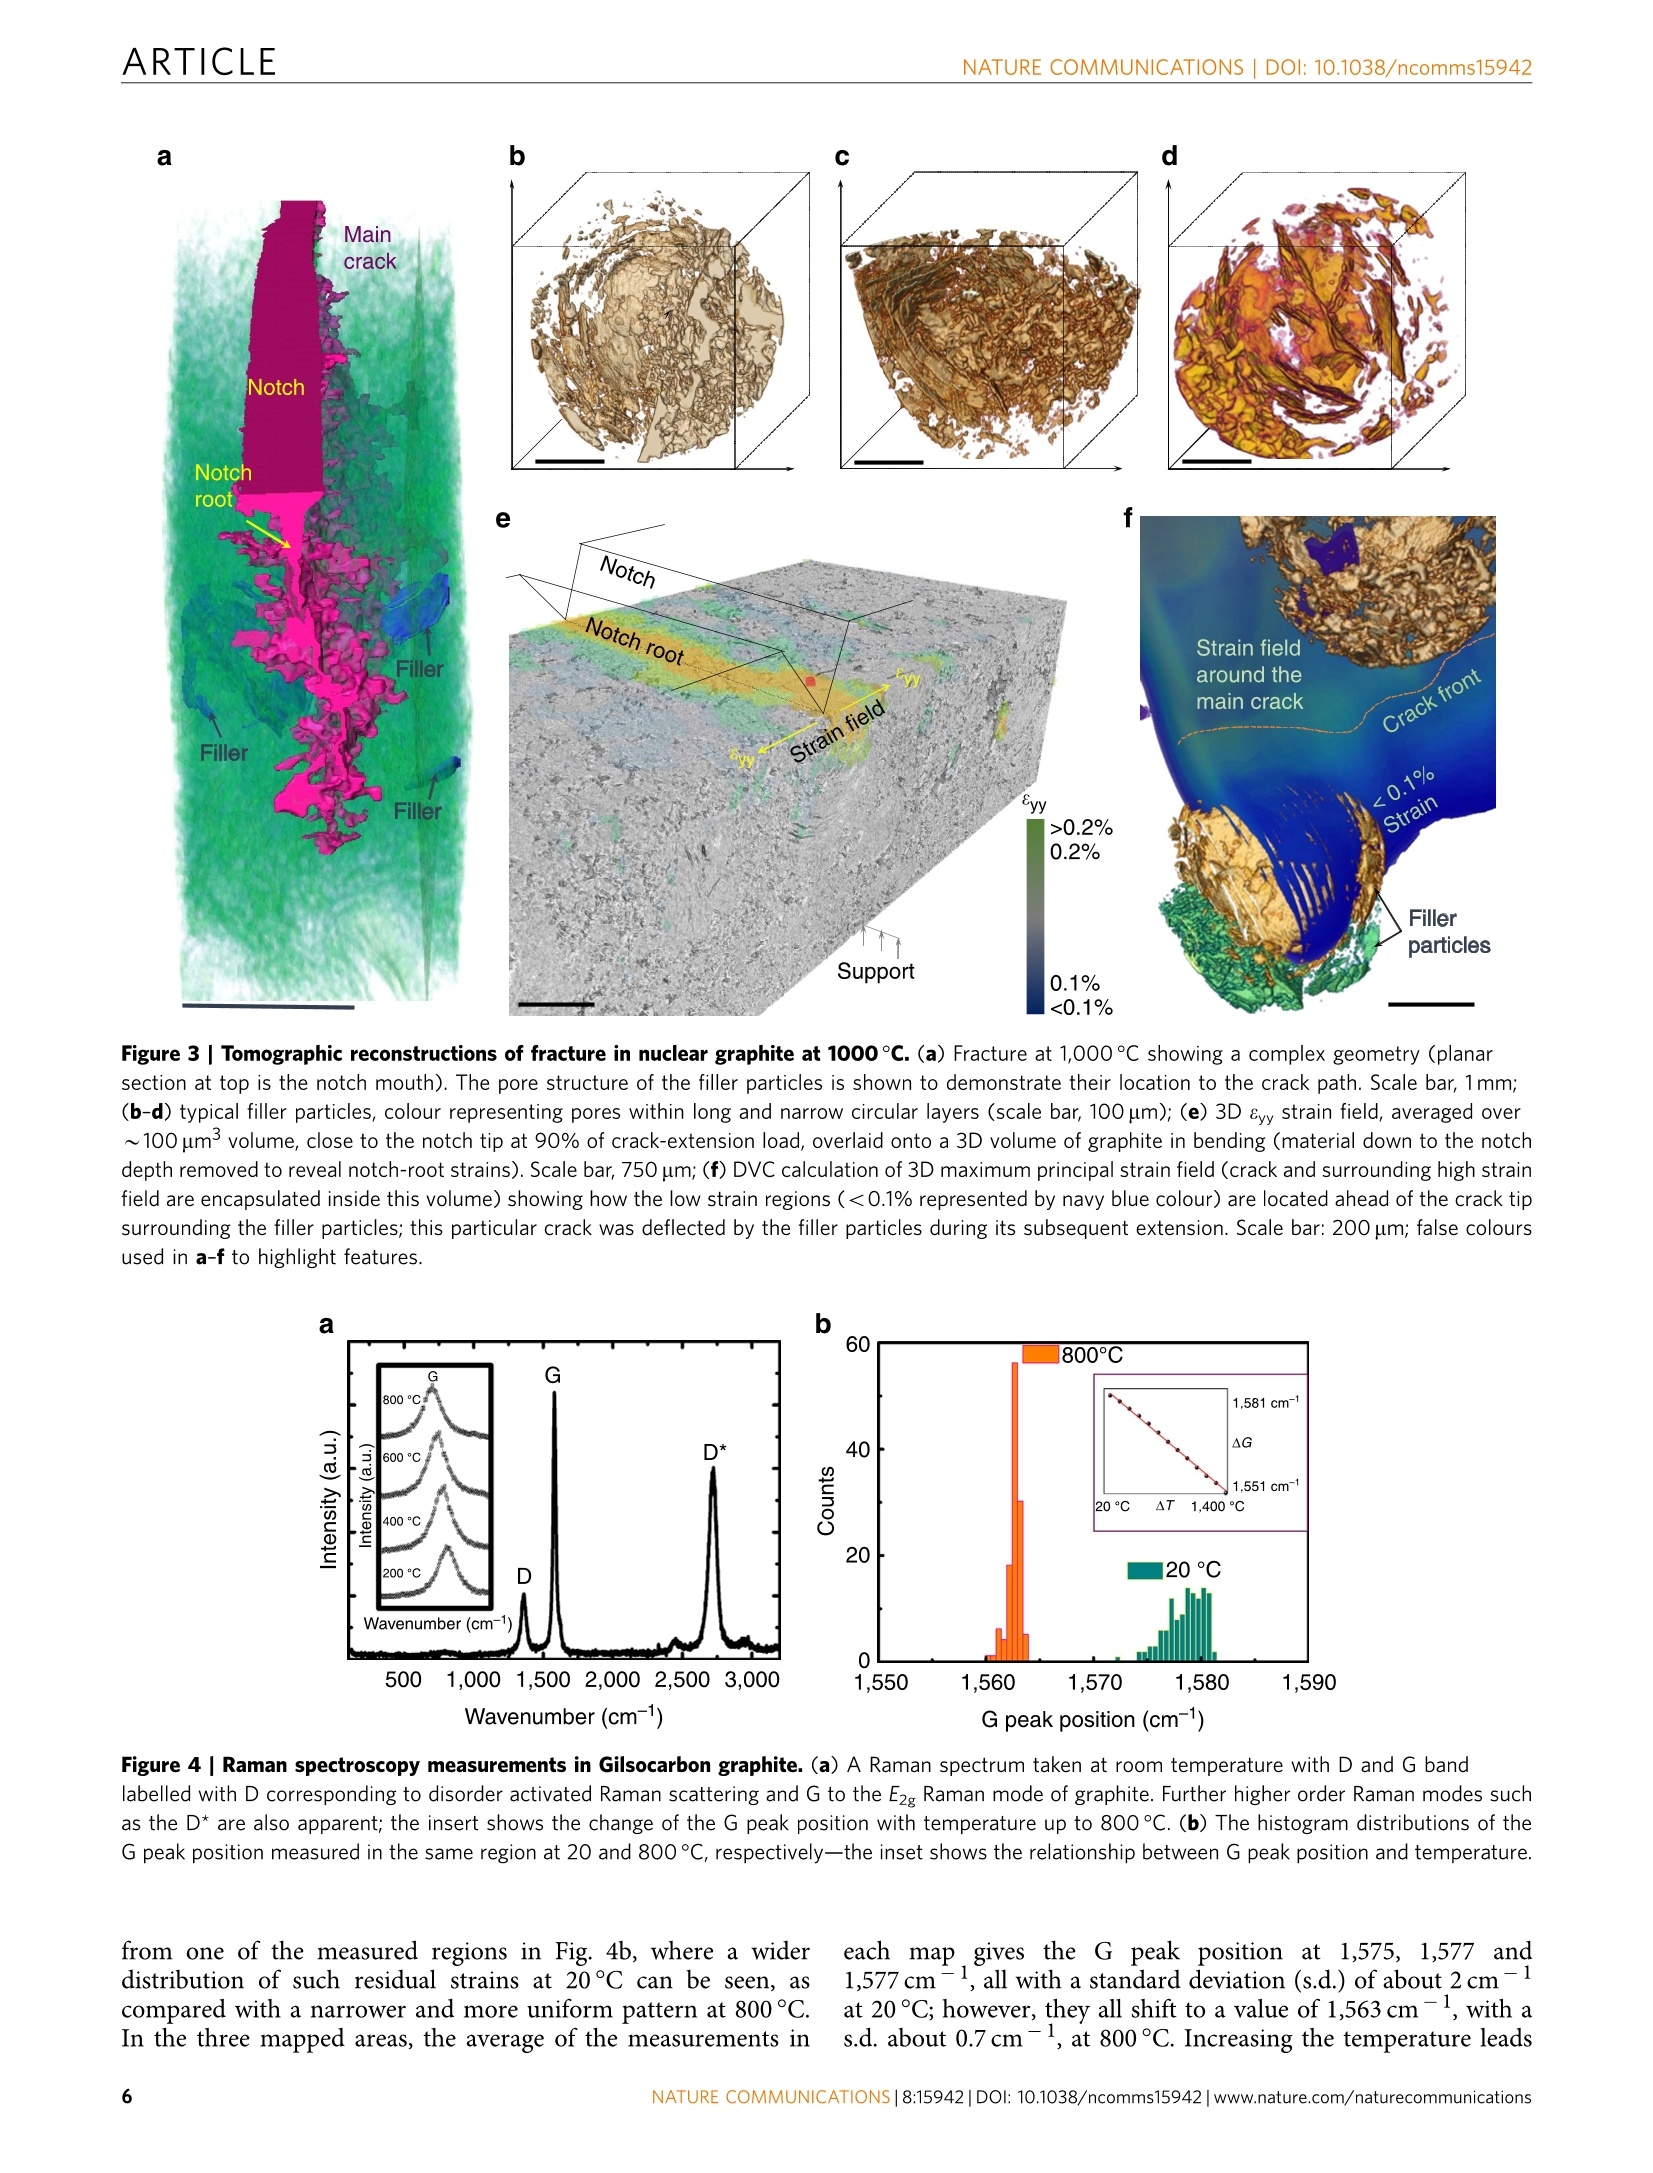
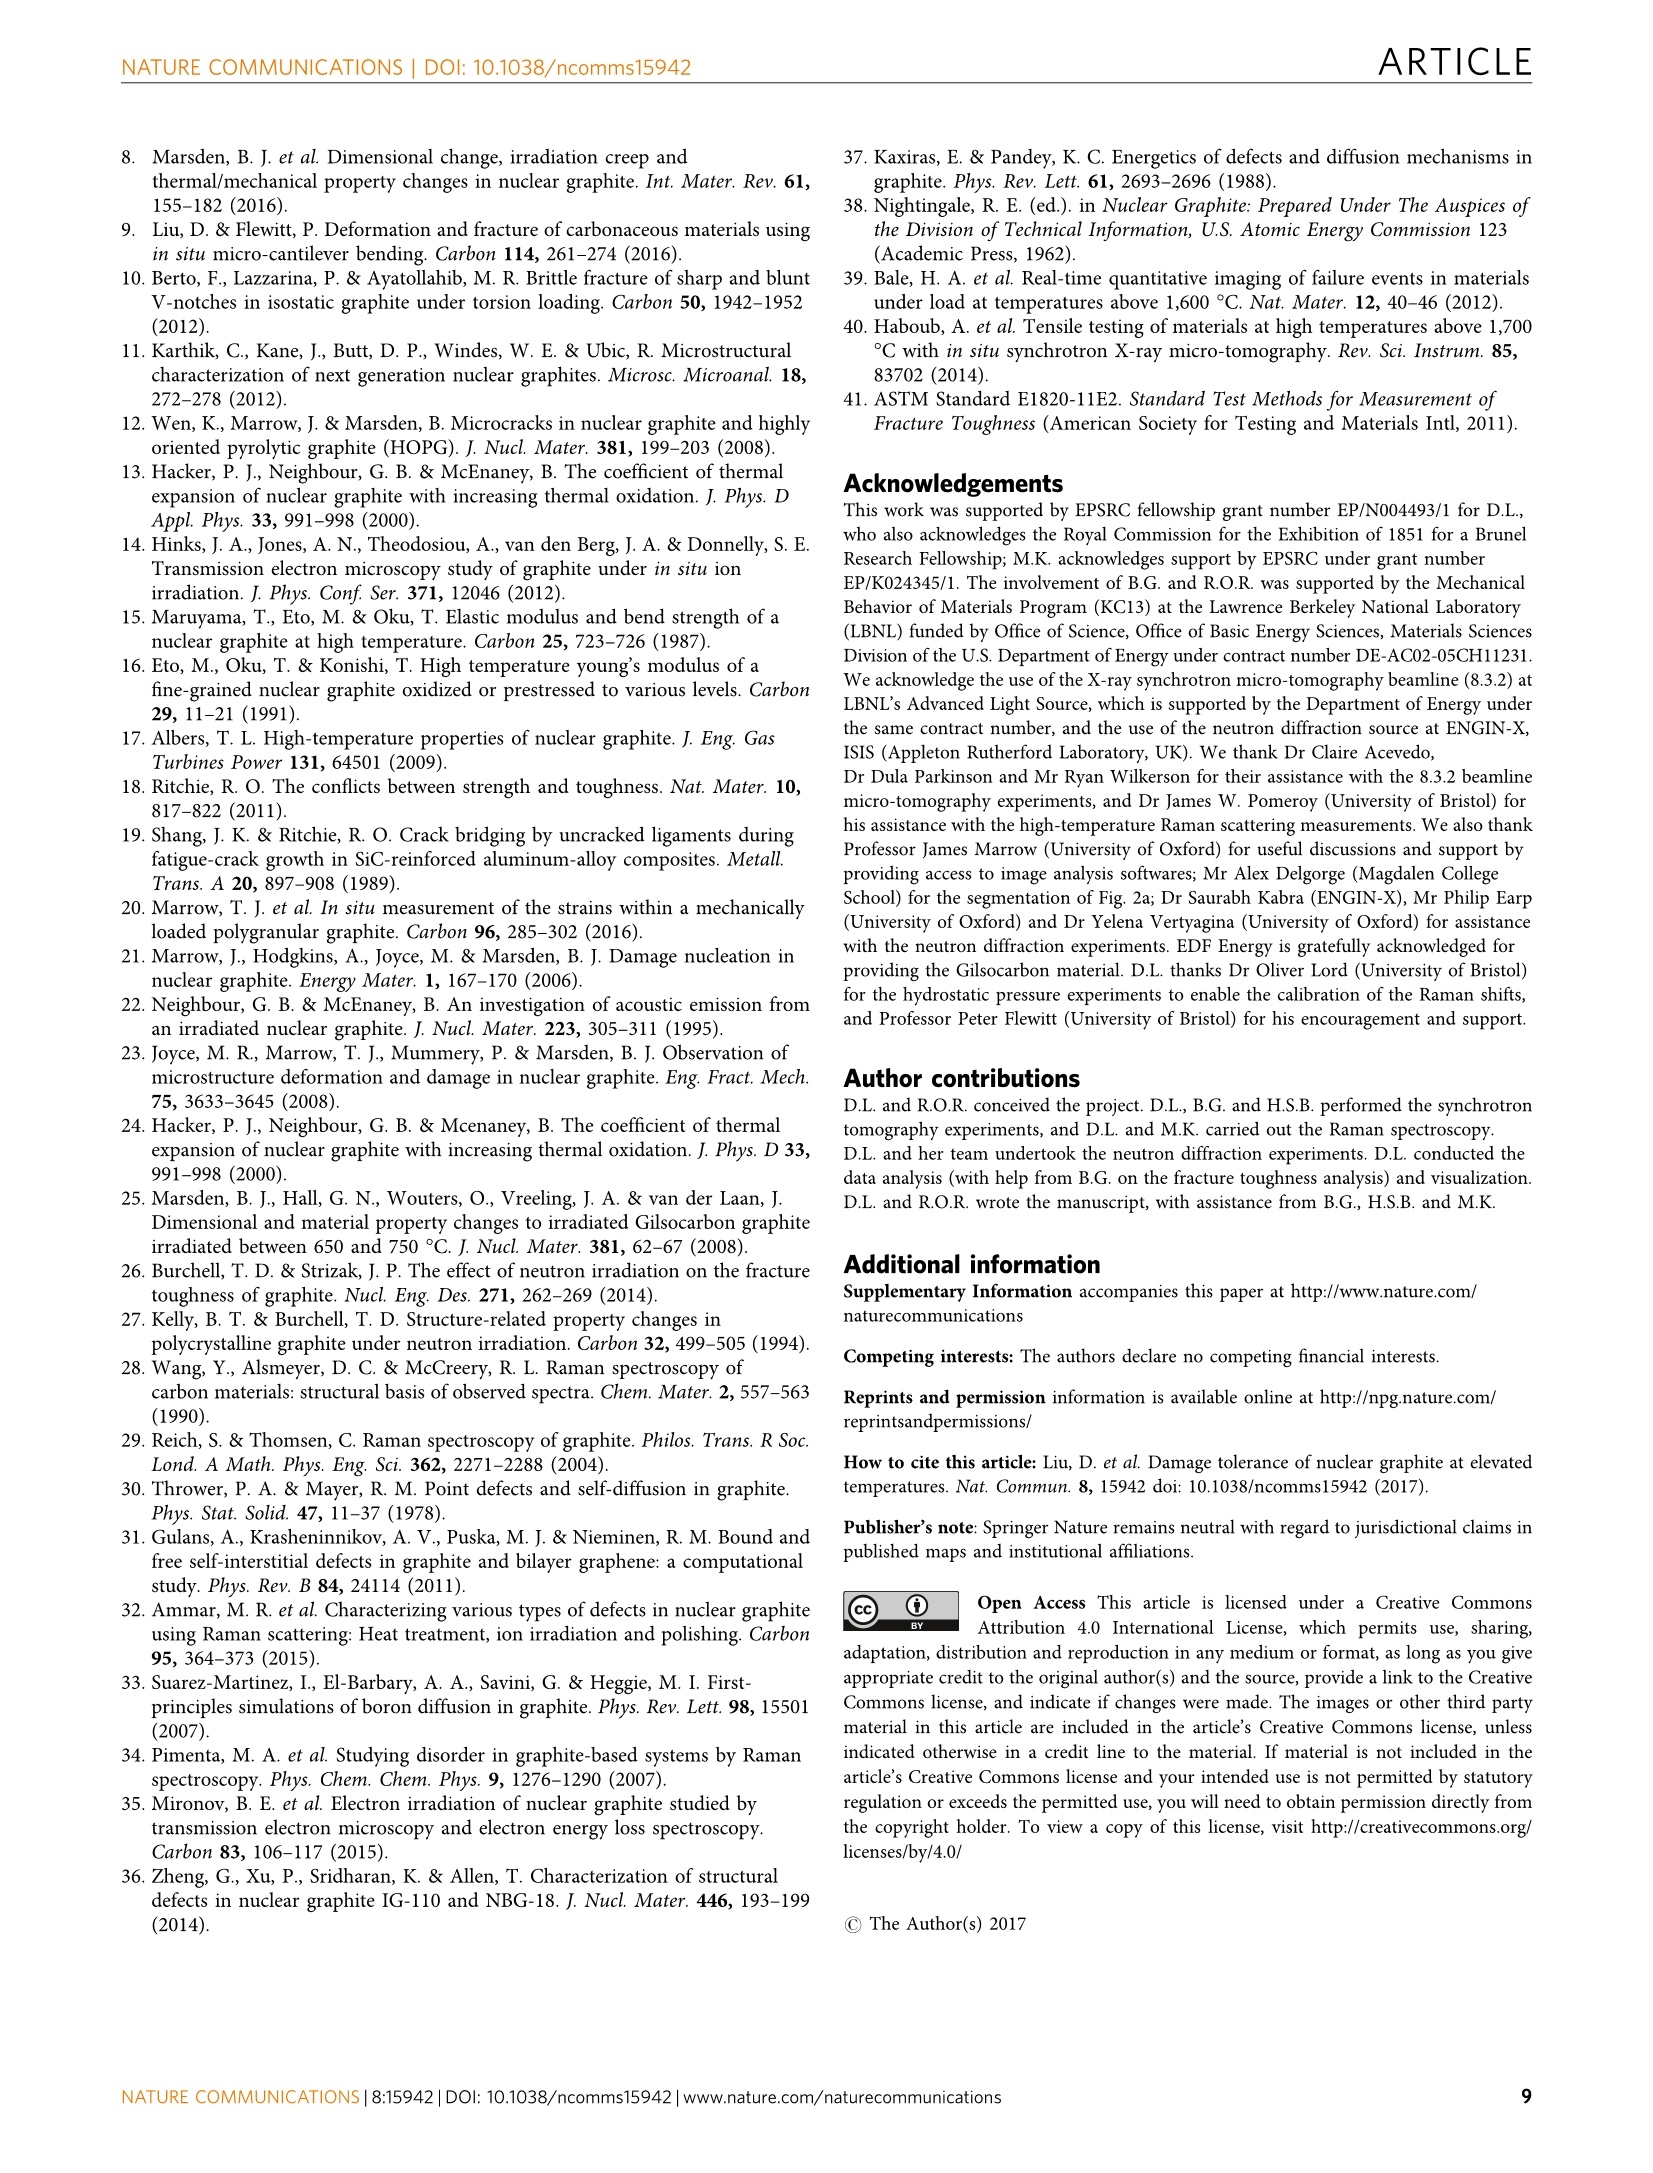
natureCOMMUNICATIONSARTICLEReceived 4 Dec 2016Accepted 11 May 2017Published 30 Jun 2017 ARTICLENATURE COMMUNICATIONS|DOI: 10.1038/ncomms15942 DOI: 10.1038/ncomms15942 OPEN Damage tolerance of nuclear graphite at elevatedtemperatures Dong Liu’, Bernd Gludovatz2,t, Harold S. Barnard3, Martin Kuball4 & Robert O. Ritchie2,5 Nuclear-grade graphite is a critically important high-temperature structural material forcurrent and potentially next generation of fission reactors worldwide. It is imperativeto understand its damage-tolerant behaviour and to discern the mechanisms of damageevolution under in-service conditions. Here we perform in situ mechanical testing withsynchrotron X-ray computed micro-tomography at temperatures between ambient and1,000 °℃ on a nuclear-grade Gilsocarbon graphite. We find that both the strength and fracturetoughness of this graphite are improved at elevated temperature. Whereas this behaviouris consistent with observations of the closure of microcracks formed parallel to thecovalent-sp--bonded graphene layers at higher temperatures, which accommodate themore than tenfold larger thermal expansion perpendicular to these layers, we attributethe elevation in strength and toughness primarily to changes in the residual stress state at800-1,000℃, specifically to the reduction in significant levels of residual tensile stresses inthe graphite that are 'frozen-in' following processing. ( Department of Materials, Un i versity of Oxford,Oxford OX1 3PH, UK. 2 M aterials Sciences Division, Lawren c e Berkeley National Laboratory, Berkeley,Cal i fornia 94720, USA. 3 A dvanced Light Sou r ce, Lawrence Berkeley National Laboratory, Berkeley, Cali f or n ia 94720, USA. 4 Cen t e r for Device Therm o graphy and R eliability, H .H . Wills Physics Laboratory, Uni v ersity of Br i s t ol , Bris t o l BS 8 1TL , UK . 5Department o f Materials S c ie n ce and En g i neering, University ofCali f orn i a, 324 Hearst Mining B uildi n g, MC 1760, Berkeley, California 94720, USA. tPresent address: School of Mechanical and Manufacturing Engineering, UNSW Sydney, NSW 2052, Australia. Correspondence and r e que s ts for materials shou l d be addressed to D. L . (em a i l: dong.liu@materials.ox.ac.uk) or toR.O.R. (email: rori t chie@lb l .gov). ) uclear-grade graphites are used as a ‘neutron moderator’Nin roughly one-fifth of the world’s currently operatingnuclear reactors..These reactors rely on the highscattering cross-section of graphite to moderate the energies offast neutrons, converting them into thermal neutrons to sustainthe uranium-235 fission chain reaction. Graphite also serves asa non-replaceable structural component in these reactor cores3,4,which must remain stable over the lifetime of the reactor whileoperating at elevated temperatures. Presently, UK AdvancedGas-CooledReactors(AGR)are (designed to operateattemperatures of 420-650℃, but future Gen-IV designs, such asvery high temperature reactors, will potentially operate as high as1,000℃ with a graphite core5.6. Despite graphite’s use in suchsafety-critical applications, the nano- and micro-structure ofnuclear graphite has an extremely high defect population thatspans multiple length scales, leading to physical properties thatare not completely understood. As the mechanical behaviour ofmaterials is dominated by the presence of defects, we seek here tofully characterize the strength and toughness of this material attypical in-service temperatures between ambient and 1,000℃. In particular, Gilsocarbon graphite is currently used in theoperating UK AGRs and is a representative materialforfutur:e nucleargraphitesddesigneddffor Gen-IVreactors.Gilsocarbon graphite is)da moulded, medium-grained,near-isotropic (anisotropy ratio of 1:1.1) GCMB grade polygranularnuclear graphite with the bulk elastic modulus in the range of 10-11 GPa at ambient temperatures8. ]Itsstructure comprisesspherical filler particles of Gilsonite (a naturally occurring solidhydrocarbon bitumen), about 500 um in diameter, in a bindermatrix made from the finer fractions of the coke flour and coal tarpitch (see Supplementary Fig. 1). The filler particles, whichoriginate from the coarse-milled Gilsonite coke grains and makeup some 70-80% of the total weight,consist of small contiguouscrystallites that are misaligned to form a circumferential patternthat contributes substantially to the near-isotropic properties ofthis grade of graphite. Although displaying relatively little anisotropy, the strengthproperties of Gilsocarbon are very sensitive to sample size, owingto its high multi-scale defect population. Depending on theorientation relative to the moulding compression direction,the ambient-temperature (macro-scale)flexuralstrength inmillimetre- to centimetre-sized samples is ~26-27MPa (ref. 8),whereas micro-mechanical tests on the same material, using2×2×12 um-sized bend samples, give values of the flexuralstrength as high as ~1,000 MPa (ref. 9), the latter micrometre-scale samples sizes excluding effects of the macro- and micro-sizepores. Such a marked size dependence of the strength propertiesis not that unusual for quasi-brittle materials such as graphite thatpossess multiple length-scale defect populations; further detailsare provided in Supplementary Fig. 2. In terms of the fracturecharacteristics of graphites, there have been numerous studiesperformed, but these have primarily been focused on ambienttemperature behaviour1-4,6,7,10 The defect population of Gilsocarbon is both large and varied,and acts to influence the behaviour of the material over itsoperating temperature range. The filler particles represent onetype of defect, as they are invariably cracked along their basal(sp-bonded graphene) planes as a consequence of the weakbonding between these planes and the volumetric shrinkageduring calcination (~1,300℃) to form mostly closed lenticularporosity. The porosity in the binder phase includes large circularopen pores (usually several hundred micrometres in diameter),pore runs resulting from the bubble percolation of volatilegases during the carbonization baking stage (~800C) andmicrometre-sized pores formed during the impregnation of liquidpitch. In addition, lenticular cracks form, in both filler particles and the binder matrix, parallel to the basal planes duringcooling down from the final graphitization temperature (typi-cally2,700-3,000°C)) duetooanisotropic: contraction ofthe hexagonal unit cells (thermal expansion coefficients are~27×10ma*103x1o apendicalon to the basa. rei ne and approsThese lenticular cracks, termed Mrozowski cracks, are typicallysized from several nanometres to several hundreds of nanometresin width with lengths tens of times larger (SupplementaryFig. 1)12,13. Many of these cracks that form nominally parallel tothe basal planes tend to close upon heating12, similar to thosereported for highly oriented pyrolytic graphites based on in situtransmission electron microscopy (TEM) investigations at, andabove,800°C (refs 12,14). To investigate howsuch multiscale defect populationsaffect mechanical properties at elevated temperatures, here wecharacterize the (macro-scale) strength and fracture toughness ofthis Gilsocarbon graphite using three-point bend samples at atemperature range between 20°C and 1,000C. These experi-ments are performed at a synchrotron X-ray beamline with thesamples mounted in a high-temperature test cell (hot cell, seeSupplementary Fig. 3). This setup allows real-time three-dimensional (3D) computed micro-tomography, coupled withpost-mortem digital volume correlation (DVC), to image andquantify the micro-scale damage and fracture processes. We findthat, contrary to the behaviour observed in the vast majority ofmaterials, both the strength and fracture toughness of nucleargraphite are improved at elevated temperature. We attribute thiselevation in strength and toughness to the change of residualstresses accompanied by the closure of nano-scale cracks attemperature. Results High-temperature strength and fracture toughness JR-curves.: OCur experiments afforded two principal findings with regardto Gilsocarbon graphite’s mechanical properties. First, withmacro-scale tests, the maximum flexural strength of the graphitewas found to be about 30% higher at 1,000℃ than at ambienttemperature, specifically rising fro~m 2~52M5 PMa at20°C to~32 MPa at 1,000℃ (Fig. 1a). Second, using in situ tomographyto quantify the 3D crack geometry, full nonlinear-elastic fracture-mechanics based J(Aa) crack-resistance curves (R-curves) werederived at 20, 650 and 1,000C, as shown in Fig. 1b in terms of Jas a function of crack extension Aa; this revealed a correspondingincrease in the fracture toughness of the nuclear graphite withtemperature. Specifically, mean Kre crack-initiation toughnessvalues increase approximately twofold from ~1-1.5MPa m at20°C to ~2-3MPam at1,000°C, when back-calculatedin terms of stress intensities (see Methods). The steepness of theR-curves, representative of the crack-growth toughness, wasalso observed to increase at the higher temperatures. The fullR-curves, re-plotted in terms of stress-intensity factors, are shownin Supplementary Fig. 4. This elevation in the strength and fracture toughness atincreasing temperature is a highly unusual characteristic of amaterial. Although this has been reported for some earliernuclear-grade graphites in certain previous studies15-17, to ourknowledge, thishas never beeni satisfactorily explained1iinmechanisticc terms,S,norrhave theindividualtougheningmechanisms associated with crack initiation and crack growthbeen partitioned, as shown by this first reported R-curve analysisfor Gilsocarbon graphite at 1,000℃(Fig. 1b). Extrinsic toughening mmeecchhaanisms. Toprovidee suchaanexplanation of this unusual elevated-temperature behaviour innuclear graphite, we performed a comprehensive examination b Temperature (C) Aa (mm) C Figure 1| Strength and toughness of Gilsocarbon graphite as a function of temperature. (a) The macro-scale flexural strength (measured on3-4 mm-sized bend specimens) increases with temperature from ~25 MPa at 20°℃ to ~32 MPa at 1,000℃ and(b) the corresponding fracturetoughness also increases, in terms of J(Aa) crack-resistance curves. (It is noteworthy that the open data points on the R-curves in b are outside themaximum J and Aa limits for the size of our specimens, as prescribed by the ASTM E1820 standard41; these data points are not included in the analysis.Owing to the size of the samples, these data points represent a condition of large-scale bridging, where the extent of crack-tip shielding in the wake of thecrack tip is no longer small compared with the in-plane dimensions of crack size and the remaining uncracked ligament). (c-e) Reconstructed tomographic3D volume images of Gilsocarbon under load at 1,000°C, showing (c) a typical crack originating from the notch root deflected around filler particles(labelled F); scale bar, 400 um, (d) individual bridging sites formed during the growth of the crack; scale bar, 10 um, and (e) an example of a larger volumeof material forming a bridging region in the path of the advancing main crack; scale bar, 20 pm. False colour used in c-e to highlight various features. of the tomographic images and identified several extrinsictoughening mechanisms at both ambient and high temperatureswhich contribute to the rising R-curve behaviour. (Note here thatresistance to fracture can be considered as a mutual competitionbetween two classes of toughening mechanisms: intrinsicmechanisms, which represent material's inherent resistance tomicrostructural damage mechanisms that operate ahead of thecrack tip, plasticity or, more generally, inelasticity, being thedominant contributor, and extrinsic mechanisms, which act to‘shield’ the crack from the applied driving force and operateprincipally in the wake of the crack tip. Extrinsic toughening isonly effective in developing crack-growth toughness, as demon-strated by a rising R-curve; these mechanisms have little to noinfluence on the crack-initiation toughness 8.) As seen in Fig. 2, many of the filler particles are crackedalong their folded graphene planes; interactions between themain crack path and these particles lead to gross deflection andtwist of the crack front as the crack essentially circumvents/passeseach particle. Such crack deflections act to increase thecontribution from extrinsic toughening (Supplementary Fig. 5).Constrained microcracking around the vicinity of the maincrack, uncracked-ligament bridging in the crack wake and bifurcation at the crack tip18,19 are also observed at all threetemperatures (Supplementary Fig. 6). At room temperature,the generation of bridging sites in the form of microcracks,located ahead of the main crack, acts to create such uncracked-ligament crack bridges, which in turn result in a change in thepropagation direction; both serve as potent extrinsic tougheningmechanisms.Essentially, crack growth ina graphite can beenvisaged as a aprocess of breaking a network of bridgingligaments resulting in a meandering crack path. There appearsto be two prime mechanisms for the formation of crack bridges atambient temperatures: one, as stated above, is when the crackpasses a filler particle; the other is when the crack enters adifferent phase, for example, when the crack propagates from apore to a solid region; both processes act to cause the direction ofthe crack path to change. Specifically, there are several mainconsequences to form bridging sites when a moving crack interactwith a filler particle from one side (Fig. 2a), through the middle(Fig. 2b), and around the particle (Fig. 2c). Such bridging sites,although naturally formed close to the crack tip, are retained aspart of a bridging zone in the crack wake, in some cases spanningup several hundred micrometres..NMoreover, with . thepreponderance of microcracks and pores in the microstructure At higher temperatures, conversely, there appears to be areduction in the micro-crack density at 1,000°℃, as comparedwiththat at :ambient temperatureseS(Supplementary Fig.66). a b Figure 2| Computed tomography shows generation of extrinsic toughening mechanisms. In Gilsocarbon graphite, crack deflection and crackbridging occurs at 20℃ when the main crack interacts with a filler particle in three ways: (a) as the main crack grows through the side of a filler particle,the material between the pores around the particle and circumferential crack inside the particle tend to form a bridge site; (b) the crack enters through thecentre of a particle and is deflected by the central calcination cracks such that bridges form when it exits the particle to join the matrix; (c) the crack missesthe main part of the particle but bridges still form around the filler particle due to the change in crack path; (d) example of parallel crack coexisting with themain crack at 20°C. Examples at1,000°C of (e) the discontinuous main crack interrupted by various bridging sites and increased number of small bridgesat the crack tip, combined with uncracked-ligament shielding; (f) uncracked-ligament bridging near the crack tip; (g) the combination of very large ligamentbridging and very small ones as the crack path changes direction;(h) crack deflection at filler particles; and (i) with consequent bifurcation occurring at thecrack tip. All scale bars, 100 um. Specifically, the circumferential lenticular cracks within the fillerparticles tend to become smaller in size when the graphite isheated up to 1,000℃ (Supplementary Fig. 7). However, morebridging sites are observed at 1,000°℃ and they are more denselydistributed along the crack path (Fig. 2e), which certainlycontributes to extrinsic toughening and hence to the increasingsteepness of the R-curves, that is, higher crack-growth toughness,at the higher temperatures. In particular, there is more evidenceof uncracked-ligament bridging (Fig. 2fg) than is seen at lowertemperatures (in some samples, there is an increase by ~50% inbridge density, as compared with that at 20°℃); although many ofthese bridges are quite narrow (≤5 um in size), they extendfurther into the crack wake than the less numerous ones seen atlower temperatures. Certainly, the deflection of the crack by fillerparticles is still active at high temperatures (Fig. 2h). In particular,at 1,000C, there is more evidence of bifurcation of the crack tip(Fig. 2h,i and Supplementary Fig. 6). Interactions between themain crack and filler particles, pores and existing defects stillcontribute to the deflection of the crack path, which furtherprovides extrinsic toughening, butthere is distinctlylessmicrocracking involved in such events at high temperatures(Supplementary Fig. 6). In addition, due to the presence of largerligament bridges along the crack length (crack bridges are eithervery large, ~100 um, or very small, ≤5 um, and regularly spacedalong the crack path), the main crack path appears almostdiscontinuous when viewed in a two-dimensional slice (Fig. 2e,g). Visualization and quantification of cracks and strains.As shown by the 3D tomographic reconstructions in Fig. 3, thegeometries of the cracks that result in the fracture of nucleargraphite are extremely complex, in particular as they interact withthe pores and defects in the microstructure. Figure 3a shows atypical example of a crack in a sample fractured at 1,000°C; forclarity, only a few filler particles are shown (marked as filler).The actual pore structure within a filler particle is shown inFig. 3b with three different examples; it is noteworthy that someof the filler particles are not spherical and are broken into halvesduring manufacture (Supplementary Fig. 1). In addition to the 3Dvisualization of these cracks and their constituent parts, DVCanalysis was undertaken. This specifically involves comparingeach of the deformed 3D volumes with the reference load-freevolume, so that the displacement/strain field can be deduced;further details are described in the Methods section. Before thepropagation of the main crack, there is usually a zone of highstrain (in excess of 0.1% when averaged over a volume of~100 um’) formed ahead of the notch root, as highlighted inFig. 3c. Figure 3d also demonstrates the existence of the max-imum principal strain distribution (in 3D) caused by the advanceof the crack as it approaches filler particles at 1,000C. The pathfollowed by a growing crack is progressively more tortuous as thesample is further deformed, consistent with the highly hetero-geneous distribution of the strains in 3D space associated with thesignificant local variations in microstructure. In addition, DVCanalysis allows the strain profile across the width of the sampleto be characterized. At 20°C, nonlinear behaviour in thestress-strain curve was observed at about 90% failure loadstarting at a depth of 400-500 um from the tensile surface; thisdepth was reduced to ~100 pm at 1,000°℃ (SupplementaryFig. 8). As reported elsewhere0, such nonlinear inelasticbehaviour is directly associated with microcracking in thisgrade of Gilsocarbon graphite21-23. Coefficient of thermal expansion. The observed reduction inmicrocracks at 1,000°C appears to be associated with the sig-nificantly higher (constrained) thermal expansion in the direction perpendicular to the graphene layers where the Mrozowskicracks are formed, that is, the excessive thermal expansion isaccommodated by the closing of these cracks11-13. The coefficientof thermal expansion (CTE) of graphite single crystals, a, is highlyanisotropic; along the a axis where strong sp hybridized C-Cbonds exist within the basal planes, &a=~-1.5×10⁻⁶K-1,whereas along the c axis where weak Van der Waals interactionsexist between the basal planes, ac=~27.0×10⁻⁶K-1. Thesmall negative value in the basal plane corresponding to thePoisson’s contraction is associated with the large expansion inperpendicular direction. For an idealized randomly distributedset of single crystals with no porosity, the CTE at a certaintemperature in any direction can be estimated by (a+2o_)/3~8.0×10-6K-1 ((refs 24,25). The 3D quantification of thegraphite microstructure provided information on the generalCTE at the micro-scale in our samples when they were heatedfrom ambient to elevated temperature. This macro-scale CTEmeasured at 650℃ and 1,000℃ gave a similar value ofapproximately 6-7×10⁻⁶K-1aasiant average of theie112samples tested between 20°℃ and 1,000°C, consistent with themeasured bulkpropertiess for thisgrade of graphite,24.Thee ~20% reduction between our measured CTE from thetomography scans and this value is consistent with TEMobservations that the lenticular Mrozowski cracks close upupon heating to accommodate the expansion perpendicular tothe c-axis2(see also Supplementary Fig. 7). This argument workson a crystallite-scale and thus would seem to be relevant only toMrozowski cracks sized in the tens of nanometres, that is, thatare contained within a single crystallite. Although the thermalexpansion1 ofiindividual crystallitessis highlyanisotropic,Gilsocarbon graphite is comprised of 70-80 wt% filler particleswhere the crystallite c axis is distributed radially outwards fromthe center and the Mrozowski cracks are usually radiallydistributed between the individual folded graphitic sheets. Inthe filler matrix, the distribution of these nano-pores is morerandom. Mrozowski cracks are found to shrink upon re-heating;indeed, they have an important role in accommodating theirradiation induced volumetric changeeiin graphiteduringservice25-27 Residual stress relaxation at temperature. However, we believethat there is an additional,more important mechanism that isresponsible for the increase in both strength and fracturetoughness at elevated temperature in Gilsocarbon graphite; this isthe existence, and subsequent relaxation, of large tensile residualstresses. To explicitly examine this in the graphite, we utilizedhigh-temperature Raman spectroscopy to estimate the residualstrain as a function of temperature. Using a 488-nm laser (2.54 eVexcitation energy) Renishaw Ramascope with a hot cell, spectrafrom selected areas on fracture surfaces were collected at 20°Cand at 800℃; a typical spectrum at 20°C is shown in Fig. 4a. Asdescribed in the Methods section, the shift in the graphite G peakwas measured to estimate the local residual strains retained in thecrystallites within the sampled volume. Usually, the G peakposition in a stress-free graphite centers around a wave number of1,581-1,583 cm-1 (refs 28,29). Shifts lower than this valuerepresent a tensile stretch of the atomic bonds. Three regions ofthe graphite sample (sized 40×40 um) were evaluated (as amixture of filler particles and matrix); for each region, a map of121 measurements (step size: 4 um) was undertaken both at 20℃and 800℃, respectively. Large variations in the local residualstrains were evident in the graphite crystallites at ambienttemperature; however, these variations in strain mostly vanishedwhen the sample was heatediup to 800℃. This can beappreciated from the histogram in the G peak position taken Figure 3| Tomographic reconstructions of fracture in nuclear graphite at 1000°C. (a) Fracture at 1,000℃ showing a complex geometry (planarsection at top is the notch mouth). The pore structure of the filler particles is shown to demonstrate their location to the crack path. Scale bar, 1mm;(b-d) typical filler particles, colour representing pores within long and narrow circular layers (scale bar, 100 um); (e) 3D evy strain field, averaged over~100 um’volume, close to the notch tip at 90% of crack-extension load, overlaid onto a 3D volume of graphite in bending (material down to the notchdepth removed to reveal notch-root strains). Scale bar, 750 um; (f) DVC calculation of 3D maximum principal strain field (crack and surrounding high strainfield are encapsulated inside this volume) showing how the low strain regions(<0.1% represented by navy blue colour) are located ahead of the crack tipsurrounding the filler particles; this particular crack was deflected by the filler particles during its subsequent extension. Scale bar: 200 um; false coloursused in a-f to highlight features. Figure 4| Raman spectroscopy measurements in Gilsocarbon graphite. (a) A Raman spectrum taken at room temperature with D and G bandlabelled with D corresponding to disorder activated Raman scattering and G to the E2g Raman mode of graphite. Further higher order Raman modes suchas the D* are also apparent; the insert shows the change of the G peak position with temperature up to 800°C. (b) The histogram distributions of theG peak position measured in the same region at 20 and 800°C,respectively-the inset shows the relationship between G peak position and temperature. from one of the measured regions in Fig. 4b, where a widerdistribution of such residual strains at 20°C can be seen, ascompared with a narrower and more uniform pattern at 800°C.In the three mapped areas, the average of the measurements in each map gives the G peak position at 1,575, 1,577 and1,577 cm1_, all with a standard deviation (s.d.) of about 2cm-at 20°℃; however, they all shift to a value of 1,563 cm-,with as.d. about 0.7 cm-, at 800℃. Increasing the temperature leads to a linear decrease in the G peak wave number, which wascalibrated to be 0.025 cm-1°c-l up to 900℃ in this particulargraphite material. By extrapolating the Raman shifts measured at20℃ to 800°℃, it is apparent that those measured at 800℃result from a combination of the temperature-induced shift inphonon frequency and a relaxation of the initial tensile stretchingof the atomic bonding. Such stress relaxation is also consistentwith the narrower G peak position distribution (s.d.=0.7 cm-1at 800℃, compared with 2.0 cm-1 at 20C). If we take thischange in the s.d. of the G peak position and convert it to a stressvia the calibrated conversion factor, it represents an equivalentrelaxation of tensile hydrostatic stress by ~200 to 250 MPa whenthe temperature is increased from ambient to 800C. (Asdescribed in Supplementary Note 1, the conversion from theRaman G peak shift to the hydrostatic stress was calibrated usinga diamond anvil cell where a free-standing micrometre-sizedgraphite and a few, 1-3 um-sized ruby grains were subjected to ahydrostatic pressure of up to 8.9GPa, applied by squeezing thetwo opposing diamond anvils, while simultaneously recording theG peak position). For a material with a macro-scale strength anorder of magnitude smaller, this magnitude of residual stress of~200-250MPa and its relaxation at high temperatures appearsto be unrealistically large. However, as noted above, measure-ments on micrometre-size samples, which exclude the effects ofthe macro- and micro-size pores, give strength numbers for thismateriallcloser to 1,000 MPa, which, as depicted inSupplementary Fig. 2, provide, in some sense, a “truer’representation of the inherent strength of the actual graphitizedaterial. The principal conclusion here isthat Ramanmeasurements indicate a significant relief of residual tensilestresses of at least 20% of the flexural strength when the graphiteis heated to 800°C. As this marked reduction in residual tensilestresses at 800℃ is also consistent with the observed (partial)closure of the Mrozowski cracks at these higher temperatures,we consider this stress relaxation to be the main contributionto the higher strength and toughness measured at elevatedtemperatures. Discussion To confirm thisresidualstress relaxationargument,weperformed neutron diffraction measurements on six graphitesamples (with a gauge volume of 4×4x4mm) at 20°C;experimental details are given in Supplementary Note 2. Allmeasurements gave a 3.375 A average spacing between the basalplanes {0002}, as compared with the standard value of 3.350 A fora stress-free, ideal graphite hexagonal unit cell8.28,29, indicatingthat a tensile stretch in the atomic bonding is created during themanufacturing processing of Gilsocarbon graphite, consistentwith the Raman observations described above. Using an elasticmodulus of 34.6 GPa for this crystal lattice {0002}, an average‘frozen-in’tensile stressat ambient temperature can thusbe calculated to il be~260 MPaatttheatomic-scaleinas-manufactured Gilsocarbon graphite, that is, a residual stressvalue identical to the Raman spectroscopy measurements. This isconsidered to be a consequence of the complex manufacturingprocess used to make this material, with the final step involvingthe graphitization of the carbon material at ~2,700°℃, or higher,to develop a larger-scale graphitic sheet structure prior tocooling from this high temperature to ambient conditions.The concomitant changes in temperature and stress state canact to cause inter-graphitic layer slip to promote the formationof complex interlayer defects, including stacking faults. Carboninterstitials, carbon complexes and vacancies, and impurity-relatediinterstitial and substitutionaldefectswithintthecrystallites, can also be formed during manufacture, as well as additional defects in the grain boundaries30-33.. Anl overallreflection ofttheseddefectsislSevidentin(ourrRamanmeasurements in Fig. 4a by the highly pronounced intensity ofthe disorder-related D band (~1,360cm-1)28,29,34, whichtypically has a 0.2-0.4 intensity ratio as compared with thecrystalline G band in this grade of Gilsocarbon graphite. Inaddition, these defects have been observed in various TEMmeasurements in different grades of nuclear graphites35,36. Owingto the existence of these defects, the atomic bonds are stretched.Akin to rapidly quenched martensitic structures in steels, thishighly defect-ridden microstructure would be subjected to highlevels of residual tensile strain, as our Raman and neutrondiffraction measurements indicate, leading to initial stretching ofthe atom bonds in tension at ambient temperatures. In additionto the disorder-related D band in the Raman spectrum, certainstudies have suggested that the double-resonance Raman modeD* at ~2,700cm一,1 which is clearly in evidence in our graphitemeasurements (see Fig. 4a), is enhanced by the presence ofstacking faults’. From the various studies noted above, thedefects in as-manufactured graphite are clearly responsible for thetensile stretch of the atomic bonding. Of note, as reported in ref. 38, the crystals in nucleargraphite are sometimes bonded by a non-crystalline carbonlayer; as we found that these crystals are under residual tensilestresses at room temperature, it may indicate, for example, thatthe amorphous carbon functions as a compression counterpart.Thus, with respect to the precise length scales over which theseresidual stresses exist, one interpretation is that the tensile stressesexist at crystallite to grain-size dimensions, the tensile stressesbeing balanced by compressive stresses in the amorphous carbonsurrounding these features (which naturally cannot be measuredwith diffraction methods or Raman spectroscopy). However, theMrozowski cracks do not simply form at such sub-micrometredimensions but also at dimensions up to the scale of tens tohundreds of micrometres, which suggests that the tensile residualstresses may exist over significantly larger length scales. Indeed,the overall question of the precise length scales over which theresidual stresses (tensile or compressive) may exist in this highlyheterogeneous material remains to be resolved, although webelieve that they are associated with defects, free surfaces createdby Mrozowski cracks and grain boundaries. Upon heating, thesestresses will be relaxed, causing the cracks to close, to reduce theirsurface energy; as the material becomes correspondingly stiffer,this can affect the macro-scale fracture toughness and strengthbehaviour. In summary, in situ mechanical testing at high temperatureswasundertaken, coupled with real-time computed X-raymicro-tomography, to examine the damage evolution, strengthand toughness of the nuclear Gilsocarbon graphite, which wasobserved to display the unusual behaviour of an increase inflexural strength and toughness with increase in temperature.Using additional Raman spectroscopy and neutron diffractionstudies, we conclude that the underlying mechanisms responsiblefor such behaviour are the high-temperature relaxation of tensilestresses ‘frozen-in’at ambient temperatures from the high defectconcentration that results from cooling from>2,700℃ duringmanufacture, which aids the closure of nano-cracks at elevatedtemperatures from the anisotropic thermal expansion in graphite. Methods Material. The Gilsocarbon graphite material studied here is a moulded,GCMB-grade polygranular nuclear graphite used in the core of the UK AGRsmanufactured by GrafTech (formerly UCAR) and supplied by EDF Energy Ltd(UK). It comprised spherical Gilsonite coke filler particles (~500 um in diameter)within a coal tar pitch binder matrix (density of ~1.81 gcm-3 with a totalporosity of 20 vol.%; macro-scale elastic modulus of about 10-11 GPa andmacro-scale flexural strength of about 26-27 MPa). The vibrational moulding process used to form the graphite blocks resulted in a relative random mixture offiller and binder with an ultimate anisotropic ratio of 1:1.10 determined bycomparing the macroscopic coefficients of thermal expansion between 25° and500℃ along, and perpendicular, to the pressing direction. More detaileddescriptions of the microstructure can be found in Supplementary Fig. 1. Mechanical testing. Two types of Gilsocarbon specimen geometries were tested.Rectangular beams of the size 3×3×16 mm and 4×4×20 mm were madeby electrical discharge machining. All samples were cut longitudinally to thebrick-moulding axis to ensure consistency. For strength tests, we used both3×3×16 mm (roller span 10 mm) and 4×4×20 mm (roller span of 16 mm)geometries. Fracture toughness tests were performed on 4×4×20 mm beamsamples containing a starter notch ~1.2 mm in length and ~400 um in widthmachined using electrical discharge machining; the notch root was subsequentlysharpened using a micro-notching technique involving polishing with 1 umdiamond paste using a razor blade to achieve a ~30 um radius at the notch tip.During this process, the crack length at both side surfaces was checked regularly toensure a uniform front, which was later confirmed by the tomography images.Final crack lengths (notch plus micro-notch) were ~ 1.6 mm, giving a crack lengthto width (a/W) ratio of ~0.4. For mechanical testing on the synchrotron beamline, a high-temperature testcell (hot cell) with an integrated three-point bending fixture (Supplementary Fig.3)was used on the micro-tomography beamline 8.3.2 at the Advanced Light Source(Lawrence Berkeley National Laboratory, Berkeley, USA). Detailed descriptions ofthe hot cell and set-up are described elsewhere39,40. Four notched samples and fourunnotched samples were tested at each temperature of 20,650 and 1,000C; monotonic loading was applied to all samples at a rate of 1 ums-. Thetomography scans for each sample were taken at a load-free condition (usually asmall load ~5 N was applied to make sure the sample and the rollers were in goodcontact to eliminate sample movement during the rotation of the load cell in thescanning process as the sample was deformed to higher load). For strength tests,several scans (six to ten) were performed from load-free condition until 85-95% offailure load was reached for DVC analysis. For fracture tests, four to five scans weremade until the onset of crack growth; this was subsequently followed by up to tenscans to capture the crack extension as the sample was further loaded. After eachcrack growth step, the crack length was measured by averaging 40 points equallyspaced across the sample thickness. An X-ray accelerating voltage of 25 keV wasused for all the scans; the field of view was 4×4 mm at a resolution of 3.25 pmper voxel. For each scan, a set of calibration X-ray images were taken includingbright-field (with the sample removed from the X-ray path) and dark-field imagesscan (with the X-ray blocked to correct for any stray lights); 1,025 radiographs werecollected during a scan over a rotation of 180°. The information extracted fromthese scans, such as the crack length, was used to calculate the J-integral as afunction of the crack extension at the different test temperatures. For verification, additional three-point bending tests using the same rollersand spacing as the beamline experiments were performed on an Instron 5944screw-driven loading machine (Norwood, MA, USA). These tests involving fivesamples each for strength and fracture toughness measurement were carried out atambient temperature on 4×4×20mm samples. Results were calculated usingidentical methods as employed for the beamline tests; values were included in thedetermination of the average strength in Fig. la and toughness in Fig. 1b. Inaddition, six previously dried samples, pre-exposed at 150℃ to 200°℃ to removeany absorbed water, were evaluated with respect to their flexural strength. Resultingstrength measurements displayed no appreciable difference from those notsubjected to such thermal pre-exposure, indicating that absorbed water in thegraphite had little to no effect on the mechanical behaviour of the material in thepresent study. Raman spectroscopy measurements. A Renishaw inVia Raman Microscope(Renishaw, Wotton-under-Edge, UK) with a hot cell (Linkham TS1500) wasemployed for this part of the study. Specifically, a 488-nm laser (LaserPhysicsModel 150M-Select), corresponding to a 2.539 eV excitation energy was used toexcite the Raman spectra. Calibration of the spectrometer was undertaken withsilicon before and after the measurements on the graphite, considering its520 cm- Raman line. The laser was focused onto the graphite sample surfaceusing a Nikon long distance ×50 objective, numerical aperture=0.6, whichprovided a laser spot size of ~1-2 um. Three random areas (40×40 um each) onthe graphite sample surface were selected to conduct Raman mapping. For eachregion, a map of 121 measurements was undertaken with a step size of 4 um at bothroom temperature and at 800℃ (inert argon gas was passed through the hotcell during the high-temperature measurements). A full spectrum from 0 to3,200cm-I was acquired during each measurement with an acquisition time of10 s. As graphite has a pseudo-hexagonal structure with the crystalline peak at1,581-1,583 cm-(Ezg mode, G peak), a change in the G peak shift was usedto estimate the residual strains in the crystallites within the sampled volume.The spectra collected from each region were then fitted using mixed Lorentzian andGaussian using a least-square approach to derive the G peak position. Usingthe same hot cell and set-up, on a freestanding cylindrical piece of Gilsocarbongraphite (~100 um’in volume containing a free-surface of a broken filler particleto focus the laser on), the G peak position was measured from 20° to 1,400°C at intervals of 100℃ to derive the relationship between the G peak position andtemperature. Data analysis. For calculation of strength, the geometry of each specimenwas documented by optical microscopy, with dimensions confirmed, whereappropriate, by the X-ray tomography reconstructed images. Flexural strength,as values were calculated using the following solution: where F is the applied load, L is the loading span (either 10 or 16 mm in the presentwork), W is the sample width (either 3 or 4 mm) and B is the sample thickness(3 or 4mm). The flexural modulus E was estimated using: where m is the initial linear slope of the load-deflection curve. For specimens testedon beamline, the flexural strength and modulus were validated against the strain onthe bending surface derived by DVC. When calculating fracture toughness, nonlinear-elastic fracture mechanicsmethodologies were used to account for both the linear and nonlinear deformationof the graphite material in general accordance with ASTM Standard E1820 forfracture toughness testing . For each data point, the value of the J-integral, Ii wasdetermined using the solution for the single-edge-notched three-point bendinggeometry10: J=1.9*A;/b;B where A; is the entire area under the load-deflection curve as a sum of the elasticand plastic contribution, b, is the residual ligament width at a particular cracklength, aj. Specifically, for the current work, the crack length at a certain load, aj,was averaged from 24 measurements on the tomography images spaced at fixedintervals across the thickness of the sample. To express the results in terms of stress-intensity factors, the value of J can beconverted to approximate K values using the mode I J-Kr equivalence relationship: where E is the bulk elastic modulus, taken here to be 11 GPa for Gilsocarbongraphite8.20. There are historical bend test data showing that there can be slightchange (~10% increase at 1,000°C (ref. 15)) in the value of E with temperature;however, for simplicity here, we assume an E of 11 GPa to convert our JR(Aa)resistance-curve results to KR(Aa) curves, as shown in Supplementary Fig. 4. Finally, for visualization and volume correlation analysis, tomographicprojections, that is, sinograms, were analysed using a filtered back-projectionalgorithm to reconstruct the tomography slices using the 8.3.2 beamline softwarepackage Octopus 8.5. The reconstructed tomographic images were then processedin ImageJ (Rasband, W.S., ImageJ, U.S. National Institutes of Health, Bethesda,http://imagej.nih.gov/ij/) and analysed in Avizo 9.2.0 (VSG, Visualization SciencesGroup, Inc., Burlington, MA, USA). Segmentation was undertaken by usingmultiple image intensity thresholding in ImageJ and Avizo 9.2.0. DVC wasundertaken using LaVision DaVis 8.3.0 software. A correlation window size of128×128×128 (equivalent to a 104 um’ volume in the real sample) was used with75% overlap with two passes performed. Rigid body movement (includingtranslation and rotation caused by the movement of the loading rigs) was extractedfrom the final results. The displacement field and the strain calculated from theDVC analysis was then exported as Image raw data float (RAF)' file and visualizedusing Avizo 9.2.0 software. Data availability. The data that support the findings of this study are availablefrom one of the corresponding authors, Dr D.L., at Oxford University, uponreasonable request. References 1. K]elly, B. T. Graphite-the most fascinating nuclear material. Carbon 20, 3-11(1982). 2.Taylor, R. et al. The mechanical properties of reactor graphite. Carbon 5,519-531 (1967) 3.Tucker, M. O., Rose, A. P. G. & Burchell, T. D. The fracture of polygranulargraphites. Carbon 24, 581-602 (1986). 4.Burchell, T.D. A microstructurally based fracture model for polygranulargraphites. Carbon 34, 297-316 (1996). 5.Idaho National Laboratory, Oak Ridge National Laboratory & ArgonneNational Laboratory. Next Generation Nuclear Plant Research and DevelopmentProgram Plan. INEEL/EXT-05-02581. Available at https://digital.library.unt.edu/ark:/67531/metadc779528/m2/1/high_res_d/859112.pdf (INEEL, 2005). 6.Nemeth, N., Walker, A., Baker, E., Murthy, P. & Bratton, R. Large-scale Weibullanalysis of H-451 nuclear-grade graphite rupture strength. Carbon 58, 208-225(2013). 7.Mostafavi,M., McDonald, S. A., Cetinel, H., Mummery, P. M. & Marrow, T.J.Flexural strength and defect behaviour of polygranular graphite under differentstates of stress. Carbon 59, 325-336 (2013). 8..Marsden, B. J.et al. Dimensional change, irradiation creep andthermal/mechanical property changes in nuclear graphite. Int. Mater. Rev. 61,155-182 (2016). 9. Liu, D. & Flewitt, P. Deformation and fracture of carbonaceous materials usingin situ micro-cantilever bending. Carbon 114, 261-274 (2016). 10. Berto, F., Lazzarina, P. & Ayatollahib, M. R. Brittle fracture of sharp and bluntV-notches in isostatic graphite under torsion loading. Carbon 50, 1942-1952(2012). 11. Karthik, C., Kane, J., Butt, D. P., Windes, W. E. & Ubic, R. Microstructuralcharacterization of next generation nuclear graphites. Microsc. Microanal. 18,272-278(2012). 12. Wen, K., Marrow, J. & Marsden, B. Microcracks in nuclear graphite and highlyoriented pyrolytic graphite (HOPG). J. Nucl. Mater. 381, 199-203 (2008). 13. Hacker, P. J., Neighbour, G. B. & McEnaney, B. The coefficient of thermalexpansion of nuclear graphite with increasing thermal oxidation. J. Phys. DAppl. Phys. 33, 991-998 (2000). 14. Hinks, J. A., Jones, A. N., Theodosiou, A., van den Berg, J. A. & Donnelly, S. E.Transmission electron microscopy study of graphite under in situ ionirradiation. J. Phys. Conf. Ser. 371, 12046 (2012). 15. Maruyama, T., Eto, M. & Oku, T. Elastic modulus and bend strength of anuclear graphite at high temperature. Carbon 25, 723-726 (1987). 16. Eto, M., Oku, T.& Konishi, T. High temperature young’s modulus of afine-grained nuclear graphite oxidized or prestressed to various levels. Carbon29,11-21(1991). 17. Albers, T. L. High-temperature properties of nuclear graphite. J. Eng. GasTurbines Power 131, 64501 (2009). 18. Ritchie, R. O. The conflicts between strength and toughness. Nat. Mater. 10,817-822 (2011). 19. Shang, J. K. & Ritchie, R. O. Crack bridging by uncracked ligaments duringfatigue-crack growth in SiC-reinforced aluminum-alloy composites. Metall.Trans. A 20, 897-908 (1989). 20. Marrow, T. J. et al. In situ measurement of the strains within a mechanicallyloaded polygranular graphite. Carbon 96, 285-302(2016). 21. Marrow, J., Hodgkins, A., Joyce, M. & Marsden, B.J. Damage nucleation innuclear graphite. Energy Mater. 1, 167-170 (2006). 22. Neighbour, G.B. & McEnaney, B. An investigation of acoustic emission froman irradiated nuclear graphite. J. Nucl. Mater.223, 305-311(1995). 23. Joyce, M. R., Marrow, T. J., Mummery, P. & Marsden, B. J. Observation ofmicrostructure deformation and damage in nuclear graphite. Eng. Fract. Mech.75, 3633-3645 (2008). 24. Hacker, P. J., Neighbour, G. B. & Mcenaney, B. The coefficient of thermalexpansion of nuclear graphite with increasing thermal oxidation. J. Phys. D 33,991-998(2000). 25. Marsden, B. J., Hall, G. N., Wouters, O., Vreeling, J. A. & van der Laan, J.Dimensional and material property changes to irradiated Gilsocarbon graphiteirradiated between 650 and 750 C. J. Nucl. Mater. 381,62-67(2008). 26. Burchell, T. D. & Strizak, J.P. The effect of neutron irradiation on the fracturetoughness of graphite. Nucl. Eng. Des. 271, 262-269 (2014). ( 27. Kelly, B. T.& Burchell, T .D. S t ructure-related p r operty changes inpolycrystalline graphite under neutron irradiation. Carbon 32, 499-505 (1994). ) ( 28. Wang, Y., Alsmeyer, D. C. & McCreery, R. L. Raman s pectroscopy ofcarbon m aterials: structural basis of observed spectra. Chem. Mater.2,557-563 (1990). ) ( 29. Reich, S. & Thomsen, C. Raman spectroscopy of graphite. Philos. Trans. R Soc. Lond. A M ath. P h ys. Eng. Sci. 362,2271-2288 (2004). ) 30. Thrower, P. A.& Mayer, R. M. Point defects and self-diffusion in graphite.Phys. Stat. Solid. 47,11-37 (1978). ( 31. Gulans, A., Krasheninnikov, A. V., Puska, M . J. & Nieminen,R. M . Bound and f ree s elf-interstitia l defects in graphite and bilayer graphene: a c o m putational s tudy. P hys. R ev. B 84, 2 411 4 ( 2 011). ) ( 32. Ammar, M. R. et al. C h aracterizing various ty p es of defects in nuclear graphite using R aman scattering: H e at treatment, ion irradiation a n d polishing. C a rbon 95, 364-373 (2015). ) ( 33. Suarez-Martinez, I , El-Barbary, A. A., Savini, G . & He g gie, M. I. F irst-principles simulations of boron diffusion in graphite. P hys. R ev. Lett. 98, 15501 (2007). ) ( 34. Pimenta, M . A. et al. Studying disorder i n graphite-based s ystems by Ramanspectroscopy. Phys. Chem. C hem. Phys. 9, 1 276-1290 ( 2 007). ) ( 35. Mironov, B. E. et al. Electron irradiation of nuclear graphite studied bytransmission electron m i croscopy and electron energy loss spectroscopy.Carbon 8 3, 106-117(2015). ) 36. Zheng, G., Xu, P., Sridharan, K. & Allen, T. Characterization of structuraldefects in nuclear graphite IG-110 and NBG-18. J. Nucl. Mater. 446, 193-199(2014). 37. Kaxiras, E. & Pandey, K. C. Energetics of defects and diffusion mechanisms ingraphite. Phys. Rev. Lett. 61, 2693-2696 (1988). 38. Nightingale, R. E. (ed.). in Nuclear Graphite: Prepared Under The Auspices ofthe Division of Technical Information, U.S. Atomic Energy Commission 123(Academic Press, 1962). 39. Bale, H. A. et al. Real-time quantitative imaging of failure events in materialsunder load at temperatures above 1,600 C. Nat. Mater. 12, 40-46(2012). 40. Haboub, A. et al. Tensile testing of materials at high temperatures above 1,700℃ with in situ synchrotron X-ray micro-tomography. Rev. Sci. Instrum. 85,83702(2014). 41. ASTM Standard E1820-11E2. Standard Test Methods for Measurement ofFracture Toughness (American Society for Testing and Materials Intl, 2011). Acknowledgements This work was supported by EPSRC fellowship grant number EP/N004493/1 for D.L., who also acknowledges the Royal Commission for the Exhibition of 1851 for a BrunelResearch Fellowship; M.K. acknowledges support by EPSRC under grant numberEP/K024345/1. The involvement of B.G. and R.O.R. was supported by the MechanicalBehavior of Materials Program (KC13) at the Lawrence Berkeley National Laboratory(LBNL) funded by Office of Science, Office of Basic Energy Sciences, Materials SciencesDivision of the U.S. Department of Energy under contract number DE-AC02-05CH11231.We acknowledge the use of the X-ray synchrotron micro-tomography beamline (8.3.2) atLBNL’s Advanced Light Source, which is supported by the Department of Energy underthe same contract number, and the use of the neutron diffraction source at ENGIN-X,ISIS (Appleton Rutherford Laboratory, UK). We thank Dr Claire Acevedo, Dr Dula Parkinson and Mr Ryan Wilkerson for their assistance with the 8.3.2 beamlinemicro-tomography experiments, and Dr James W. Pomeroy (University of Bristol) forhis assistance with the high-temperature Raman scattering measurements. We also thankProfessor James Marrow (University of Oxford) for useful discussions and support byproviding access to image analysis softwares; Mr Alex Delgorge (Magdalen CollegeSchool) for the segmentation of Fig. 2a; Dr Saurabh Kabra (ENGIN-X), Mr Philip Earp(University of Oxford) and Dr Yelena Vertyagina (University of Oxford) for assistancewith the neutron diffraction experiments. EDF Energy is gratefully acknowledged forproviding the Gilsocarbon material. D.L. thanks Dr Oliver Lord (University of Bristol)for the hydrostatic pressure experiments to enable the calibration of the Raman shifts, and Professor Peter Flewitt (University of Bristol) for his encouragement and support. Author contributions D.L. and R.O.R. conceived the project. D.L., B.G. and H.S.B. performed the synchrotrontomography experiments, and D.L. and M.K. carried out the Raman spectroscopy.D.L. and her team undertook the neutron diffraction experiments. D.L. conducted thedata analysis (with help from B.G. on the fracture toughness analysis) and visualization.D.L. and R.O.R. wrote the manuscript, with assistance from B.G., H.S.B. and M.K. Additional information Supplementary Information accompanies this paper at http://www.nature.com/naturecommunications Competing interests: The authors declare no competing financial interests. Reprints and permission information is available online at http://npg.nature.com/reprintsandpermissions/ How to cite this article: Liu, D. et al. Damage tolerance of nuclear graphite at elevatedtemperatures. Nat. Commun. 8, 15942 doi: 10.1038/ncomms15942 (2017). Publisher’s note: Springer Nature remains neutral with regard to jurisdictional claims inpublished maps and institutional affiliations. Open Access This article is licensed under a Creative Commons@ Attribution 4.0 International License, which permits use, sharing,adaptation, distribution and reproduction in any medium or format, as long as you giveappropriate credit to the original author(s) and the source, provide a link to the CreativeCommons license, and indicate if changes were made. The images or other third partymaterial in this article are included in the article’s Creative Commons license, unlessindicated otherwise in a credit line to the material. If material is not included in thearticle’s Creative Commons license and your intended use is not permitted by statutoryregulation or exceeds the permitted use, you will need to obtain permission directly fromthe copyright holder. To view a copy of this license, visit http://creativecommons.org/licenses/by/4.0/ ATURE COMMUNICATIONS|:DOI: ncommswww.nature.com/naturecommunications Nuclear-grade graphite is a critically important high-temperature structural material for current and potentially next generation of fission reactors worldwide. It is imperative to understand its damage-tolerant behaviour and to discern the mechanisms of damage evolution under in-service conditions. Here we perform in situ mechanical testing with synchrotron X-ray computed micro-tomography at temperatures between ambient and 1,000 C on a nuclear-grade Gilsocarbon graphite.We find that both the strength and fracture toughness of this graphite are improved at elevated temperature. Whereas this behaviour is consistent with observations of the closure of microcracks formed parallel to the covalent-sp2-bonded graphene layers at higher temperatures, which accommodate the more than tenfold larger thermal expansion perpendicular to these layers, we attribute the elevation in strength and toughness primarily to changes in the residual stress state at 800–1,000 C, specifically to the reduction in significant levels of residual tensile stresses in the graphite that are ‘frozen-in’ following processing.
确定


还剩7页未读,是否继续阅读?

产品配置单


北京欧兰科技发展有限公司为您提供《核石墨中损伤容限检测方案(工作站及软件)》,该方案主要用于核能中损伤容限检测,参考标准--,《核石墨中损伤容限检测方案(工作站及软件)》用到的仪器有LaVision DaVis 智能成像软件平台、LaVision StrainMaser 全场应变测试系统组件
推荐专场


相关方案
更多
该厂商其他方案
更多