


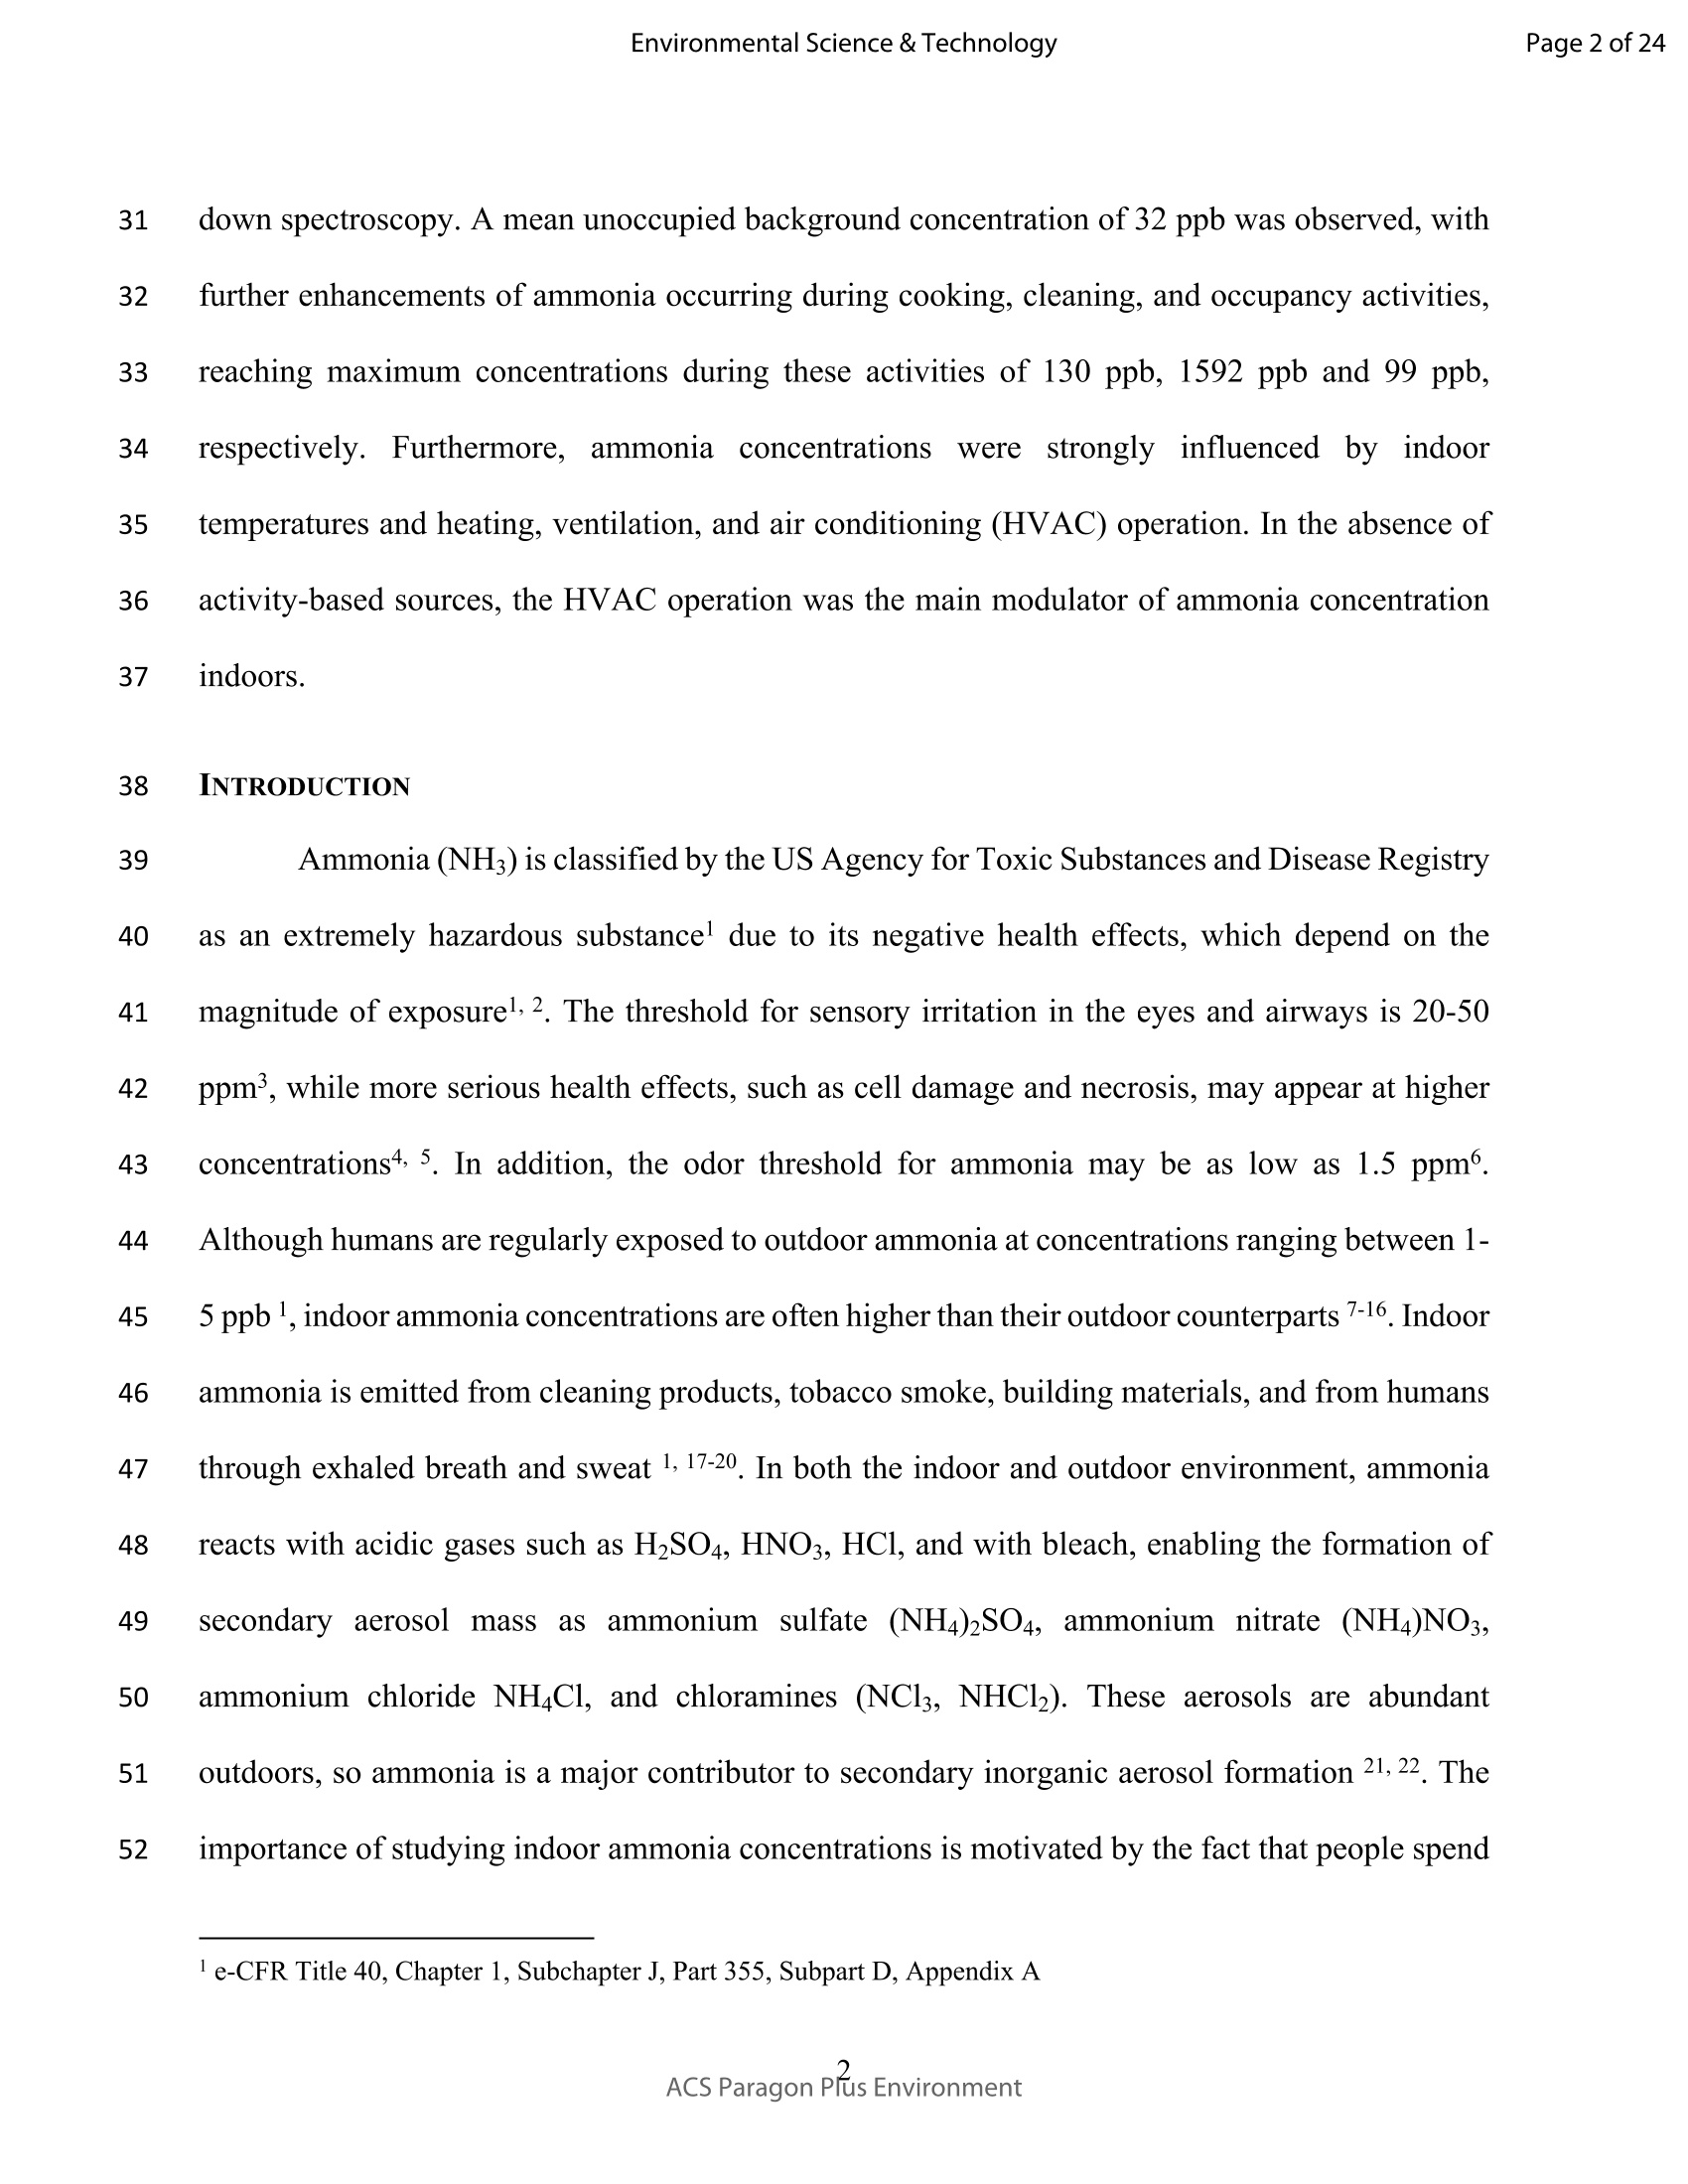
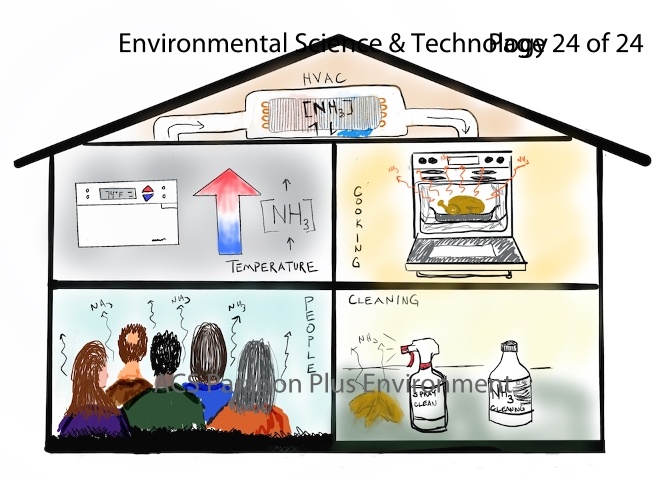
通常氨气(NH3)在室外浓度水平约为1-5ppb,但室内氨气浓度可能要高得多。室内氨主要来自清洁产品、烟草烟雾、建筑材料和人类。由于氨的高反应性、在水中的高溶解度以及易于吸附在各种表面上,导致对其的测量不容易进行。因此对室内氨浓度的综合评价仍然是一个有待研究的课题。本文介绍在2018年6月进行的一项综合室内化学研究,使用CRDS仪器测量了室内氨的实时浓度。观测到平均空白背景浓度为32 ppb,在烹调、清洁和占用活动期间氨进一步增加,在这些活动期间分别达到最大浓度130 ppb、1592 ppb和99 ppb。此外,氨浓度受室内温度、供暖、通风和空调(HVAC)运行的强烈影响。在没有活性源的情况下,暖通空调的运行是室内氨浓度的主要影响因素。
方案详情

Subscriber access provided by UNIV AUTONOMA DE COAHUILA UADEC Page 1 of 24Environmental Science & Technology Characterization of Natural and Affected Environments Observations and Contributions of Real-time IndoorAmmonia Concentrations During HOMEChem Laura Ampollini, Erin F Katz, Stephen Bourne, Yilin Tian, Atila Novoselac, Allen H. Goldstein, Gregor Lucic, Michael S. Waring, and Peter DeCarlo Environ. Sci. Technol., Just Accepted Manuscript·DOI: 10.1021/acs.est.9b02157·Publication Date (Web): 24 Jun 2019Downloaded from http://pubs.acs.org on June 25, 2019 Just Accepted “Just Accepted”manuscripts have been peer-reviewed and accepted for publication. They are postedonline prior to technical editing, formatting for publication and author proofing. The American ChemicalSociety provides"Just Accepted” as a service to the research community to expedite the disseminationof scientific material as soon as possible after acceptance. “Just Accepted”manuscripts appear infull in PDF format accompanied by an HTML abstract. “Just Accepted”manuscripts have been fullypeer reviewed, but should not be considered the official version of record. They are citable by theDigital Object Identifier (DOIQ). “Just Accepted”is an optional service offered to authors. Therefore,the “Just Accepted”Web site may not include all articles that will be published in the journal. Aftera manuscript is technically edited and formatted, it will be removed from the “Just Accepted” Website and published as an ASAP article. Note that technical editing may introduce minor changesto the manuscript text and/or graphics which could affect content, and all legal disclaimers andethical guidelines that apply to the journal pertain. ACS cannot be held responsible for errors orconsequences arising from the use of information contained in these “Just Accepted”manuscripts. ( i s published by the American C hemical S o ciety. 11 55 Sixteenth S t reet N.W., Washington, DC 20036 ) ( Published by American Chemical Society. Copyright @ American Chemical Society. H owever, no copyright c l aim i s m ade to original U.S. Government works, or worksproduced by employees of any Commonwealth realm Crowngovernment in the courseof their duties. ) 1一 Observations and Contributions of Real-time Indoor Ammonia Concentrations During 2 HOMEChem 3 Laura Ampollini, Erin F. Katz, Stephen Bourne’, Yilin Tiant, Atila Novoselac, Allen H. 4 Goldstein4,5, Gregor LucicMichael Waring, Peter F. DeCarlo*1,2 5 Department of Civil, Architectural, and Environmental Engineering, Drexel University,6 Philadelphia, PA 19104, USA 7 Department of Chemistry, Drexel University, Philadelphia, PA 19104, USA 8 Department of Civil, Architectural, and Environmental Engineering, University of Texas at 9 Austin, 1 University Station C1752, Austin, TX 78712-1076, USA B “Department of Environmental Science, Policy, and Management, University of California,Berkeley, CA 94720, USA Department of Civil and Environmental Engineering, University of California, Berkeley, CA 94720, USA 15 Picarro Inc., 3105 Patrick Henry Drive, Santa Clara, CA 95054, USA *Corresponding author: Department of Civil, Architectural and Environmental Engineering, Drexel University Philadelphia, PA 19104,USA Tel.:+12158952345 Fax: +12158951363 e-mail: pfd33@drexel.edu 23 ABSTRACT 24 Although ammonia (NH) is usually found at outdoor concentrations of 1-5 ppb, indoor 25 ammonia concentrations can be much higher. Indoor ammonia is strongly emitted from cleaning26 products, tobacco smoke, building materials, and humans. Because of ammonia’s high reactivity,27 solubility in water, and tendency to sorb to a variety of surfaces, it is difficult to measure, and thus28 a comprehensive evaluation of indoor ammonia concentrations remains an understudied topic. 29 During HOMEChem, which was a comprehensive indoor chemistry study occurring in a test house30 during June 2018, the real-time concentration of ammonia indoors was measured using cavity ring- 31 down spectroscopy. A mean unoccupied background concentration of 32 ppb was observed, with 32 further enhancements of ammonia occurring during cooking, cleaning, and occupancy activities, 33 reaching maximum concentrations during these activities of 130 ppb, 1592 ppb and 99 ppb, 34 respectively. Furthermore,ammoniaconcentrations werestrongly influencedeby1indoor 35 temperatures and heating, ventilation, and air conditioning (HVAC) operation. In the absence of 36 activity-based sources, the HVAC operation was the main modulator of ammonia concentration37 indoors. 38 INTRODUCTION 39 Ammonia (NH) is classified by the US Agency for Toxic Substances and Disease Registry40 as an extremely hazardous substancel due to its negative health effects, which depend on the41 magnitude of exposurel,2. The threshold for sensory irritation in the eyes and airways is 20-5042 ppm, while more serious health effects, such as cell damage and necrosis, may appear at higher43 concentrations4, 5. In addition, the odor threshold for ammonia may be as low as 1.5 ppm.44 Although humans are regularly exposed to outdoor ammonia at concentrations ranging between 1-45 5 ppbl, indoor ammonia concentrations are often higher than their outdoor counterparts 7-16. Indoor46 ammonia is emitted from cleaning products, tobacco smoke, building materials, and from humans47 through exhaled breath and sweat 1, 17-20. In both the indoor and outdoor environment, ammonia48 reacts with acidic gases such as H2SO4, HNO3, HCl, and with bleach, enabling the formation of49 secondary aerosol massasammonium sulfate (NH4)2SO4, ammonium nitrate (NH4)NO3,50 ammonium chloride NH4Cl, and chloramines (NCl3, NHCl). These aerosols are abundant51 outdoors, so ammonia is a major contributor to secondary inorganic aerosol formation 21, 22. The52 importance of studying indoor ammonia concentrations is motivated by the fact that people spend ( e-CFR Title 40, Chapter 1, Subchapter J, Part 355, Subpart D, Appendix A ) 53 significantly more time indoors than outdoors; people spend roughly 90% of their time indoors, at54 home, work, school, or in public buildings 23. Previous indoor ammonia measurements have 55 typically been taken using time integrated methods. Brauer et al. (1991)9, Suh et al. (1994) 12,56 Fischer et al. (2003) 16, and Lunden et al. (2003) 15 investigated the concentration of indoor57 ammonia in homes to better understand its role on the neutralization of acid aerosol and the gas-58 equilibrium conditions governing concentration of ammonium nitrate aerosol. 59 Leaderer et al. (1990) 14 investigated how indoor concentrations of ammonia changed in60 homes with and without kerosene heaters during winter months, and with and without air61 conditioning during summer months. Atkins and Lee (1993) 11, Tidy and Cape (1993) 10,62 Tuomainen et al. (2001) 24, and Jarnstrom et al. (2006) 25 studied indoor concentrations in different63 rooms of homes and new buildings before and after the first months of occupancy. The ammonia64 concentration in office buildings was the focus of Sisovic et al. (1987) 7 and Salonen et al. (2009)65 26, while Li and Harrison (1990) 8, Gomzi (1990) 13, and Meininghaus et al. (2003) 27 measured66 ammonia concentrations at universities and schools. 67 Previous studies were often completed using diffusive samplers or active samplers with68 denuders, methods which lead to numerous limitations, such as lower accuracy and non-real time69 measurements 28. Hence, there is a need for measurements indoors with improved accuracy and70 high time resolution, so that factors that influencing dynamic ammonia concentrations indoors can71 be determined. We present herein a detailed assessment of indoor ammonia concentrations72 measured in a test-house using the method of cavity ring-down spectroscopy, allowing us to73 explore the impact of common activities such as cleaning, cooking, and occupancy on indoor74 ammonia concentration dynamics, as well as the impact of a heating, ventilation, and air-75 conditioning (HVAC) system. 76 MATERIALS AND METHODS 77 HOMEChem 78 The measurements presented in this paper were conducted during the HOMEChem 79 experiment which took place at the University of Texas at Austin over four weeks in June 2018 29.80 The goal of HOMEChem was to perform a variety of activities and experiments within the UTest81 house, a three bedroom and two-bath manufactured home with a floor area of 110 m² and a volume82 of 250 m’, described in detail in a study by Novoselac and Siegel (2009)30, and to measure83 concentrations of a number of gases and aerosols, leading to an analysis of the everyday chemistry 84 in indoor domestic environments. 85 During the 4-week experiment, factors such as temperature, relative humidity (RH), HVAC86 system parameters, and number of people in the house, in addition to logging specific activities87 performed and products used, were recorded using a variety of instruments and methods. The88 activities conducted during HOMEChem can be placed into three macro-categories which reflect89 common everyday indoor activities: cleaning, cooking, and occupancy. Although different types90 of sub-experiments were conducted over the entire month of HOMEChem, only the ones most91 affecting ammonia concentration will be considered and described in this study. 92 Instrumentation 93 Ammonia concentrations were measured with a Picarro G2103 Analyzer. This instrument94 uses the cavity ring-down spectroscopy (CRDS) analytical technique to provide real-time95 measurement of ammonia at parts per billion (ppb) levels. We report 30 sec.average96 concentrations although higher time resolution is possible. Measurement accuracy is 0.5 ppb± 5%97 of reading with a precision of 0.10 ppb + 0.1% of reading for 30 sec. of data. [The instrument's 98 molar absorptivity, or extinction coefficient, was calibrated at the Picarro factory in Santaa Clara.99 CA by comparison to a Calibration Standard Analyzerimmediatelyypurior to shipping to Drexel 100 University. The calibration of this Calibration Standard Analyzer was vavlaildiadtaet(ed by the National 101 PhysicallLLaboratory (United Kingdom) using gravimetric standards and reportedl ttobe within 1%102 of the standard, with an expanded uncertainty of 2% 28. Using the Calibration Standard Analyzer103 approach and supporting studies of CRDS stability over time (0.1% slope change / year))31, only 104 periodic validation using a non-reactive gas (CO2) iis required to validate the calibration. 105 The Picarro G2103 Analyzer was placed in the kitchen of the UTest house, above the106 refrigerator at a height of approximately two meters and a distance of approximately four meters107 from the stove and oven. The inlet of the instrument was short, at approximately 5 cm long, with108 an inline Teflon filter to prevent particle intrusion into the instrument. Although there is a reported109 carbon dioxide (CO2) measurement by the G2103, we instead use the CO2 measurement from the110 Picarro G2401 instrument (as described in 32). Temperature and RH data were recorded by a data111 logger (HOBO Data Logger, model U12-012, Onset Computer Corp., Bourne, MA) placed next112 to the Picarro, with 1 min. resolution. 113 The total air exchange rate through the HVAC system was measured to be 7.9 +/-0.6 h- 114 by summing the total flow from supply registers in the home. Air flow through the HVAC was 115 constant, regardless of air conditioning demand (HVAC fan was always on). Measurements of 116 HVAC airflow were made using a Shortridge Instruments CFM-88L flow hood with an accuracy117 of +/-3% of reading +7 ft/min. No HVAC filters were installed in the system so as to prevent118 their influence on the experiments. The fresh air system air exchange rate was approximately 0.5 119 h- unless specified otherwise, and was continuously monitored using an Ebtron Advantage III 120 HTx104-PE with an accuracy of+/- 3% for the range of flow rates measured. Due to high expected 121 latent loads in the test house, a secondary dehumidifier was always active in the HVAC air122 handling unit. 123 Temperature of the supply and return air flows were measured using Omega Instruments124 model 44033 thermistors, connected to GW Instruments iNet-100 data acquisition hardware using125 Omega OMX-R4.7K precision shunt resistors. This combination provided an accuracy of+/-0.1°℃126 in the range of 0-70°C. RH probes were located inside the HVAC supply diffuser, at the HVAC127 return register, and in the kitchen area of the home. The RH was measured using Veris model 128 HD2XVSX humidity sensors with an accuracy of +/- 2% from 10-80% RH. 129 The window and door open/closed status was monitored by wireless sensors (SmartThings,130 Inc., Mountain View, CA, USA), with sensor arrangement reported in the study overview 29. 131 Activities and experiments 132 Background measurement 133 One 12-hour daytime background measurement was taken when no people and no activities134 were taking place in the UTest house. This background measurement was recorded on June 15,135 2018 from 8:00 AM to 8:00 PM. During this period, the air-conditioning (AC) thermostat setpoint136 temperature was set at 76°F(~25.5°C). 137 Nighttime high temperature 138 In order to study the relationship of how chemical emissions from species such as ammonia139 respond to temperature, measurements from the night of June 24, 2018 to the morning of June 25, 140 2018 were recorded as the setpoint temperature in the UTest house was set at 90°F (~32.2°℃).141 Limited activity took place during these hours; in particular, only a nighttime ozone experiment 142 was being performed with two people entering the house at 9:55 PM and 2:55 AM. 143 Response time activity 144 The “response time"activity was performed on June 4, 2018 with the goal of determining145 the time taken by a variety of measured chemical species within the UTest house to reach a steady 146 state condition after the door and windows of the house were sequentially opened and closed. 147 During the response time activity, the AC was turned off at 10:00 AM and the door and windows 148 were opened and closed at 30-minute intervals until 8:30PM. The AC was turned on at 8:35 PM149 signifying the end of the activity. 150 Cleaning experiment 151 The cleaning experiment was conducted on June 26, 2018 and consisted in a combination152 of mopping the floor with vinegar and spraying ammonia on other surfaces such as windows, the 153 table, and the stove. The cleaning experiment occurred in the living room, adjacent to the kitchen. 154 The ammonia spray used consisted of a solution of HDX64 oz. Lemon Ammonia (1-3 weight % 155 of ammonia) that was mixed in the spray bottle according to manufacturer instructions. The house156 was cleaned at three different times during the day. The experiment was conducted as follows: at157 12: 35 PM, floors are mopped with vinegar for 10 minutes, 1 minute break, surfaces are sprayed 158 with ammonia solution for 5 minutes; at 4:35 PM, surfaces are sprayed with ammonia solution for 159 5 minutes, 5 minute break, floors are mopped with vinegar for 10 minutes; at 8:08 PM, floors are 160 mopped with vinegar for 10 minutes, 10 minute break, surfaces are sprayed with ammonia solution 161 for 5 minutes. The starting and ending weights of cleaning solutions can be found in Table S1. 162 Cooking experiment 163 The cooking experiment was conducted on June 18, 2018 and consisted of the preparation164 of an“American Thanksgiving-style”dinner menu consisting of turkey, roasted brussels sprouts165 with pancetta, smashed sweet potatoes with marshmallows,cranberry sauce, and stuffing. Cooking166 began at10:00 AM and ended at around 3:30 PM, with the dinner taking place between 4:00 PM167 and 5:00 PM. 168 Occupancy 169 Ammonia concentrations were measured during the HOMEChem Open House, an event170 that took place on June 22, 2018, which opened the UTest house to visitors including scientists, 171 scholars, and industry partners from around the country. The occupancy in the house varied greatly 172 throughout the day. The open house schedule consisted of three tours and the recording of a radio 173 program. Tours took place between 9:30 -10:45 AM, 12:00-1:00 PM, and 1:00-2:00 PM. 174 Since this event was not considered a sub-experiment, precise data on the number of occupants 175 throughout the day are not available. However, approximate values based on visual observation 176 were recorded and are presented in the results below. CO levels also provide an estimate of177 Occupancy. 178 Data analysis 179 Collected data from all instruments were analyzed using Igor Pro 7 (Wavemetrics, Lake180 Oswego,OR). Ammonia concentrations were investigated in the context of other measured181 parameters including temperature and RH of the house and HVAC supply air. In addition, other182 information collected in the activity log of the HOMEChem experiment, such as the periods when183 windows and doors were open, were integrated into the analysis to give a more comprehensive184 view of the state of the house. In all experiments, a categorization of the coolingcoil state was185 required. We categorize the cooling coil as ON, meaning that its surface was wet, when the supply186 air temperature was less than 20°℃, with the only exception being the night of June 25, 2018, when187 the air conditioning (AC) was set at a higher temperature than usual and thus a temperature of188 27°C was used as the cooling coil threshold. These temperature values were determined189 graphically by exploring the inverse relationship between HVAC supply air relative humidity and190 temperature. When the air conditioning is ON and thus the cooling coil as well, the temperature of 191 the supply air decreases rapidly while the humidity of the supply air increases until the cooling192 coil is OFF again. 193 194 NHs (ppb) Figure 1 Indoor NH concentrations found in previous studies compared to the frequency of indoor NHconcentrations found during the HOMEChem experiment (indicated by the yellow histogram). Theconcentration values are classified taking into account the season in which the measurements wereconducted (summer JJA or winter DJF) and location (schools, offices and homes) when specified. 195 RESULTS 196 Figure 1 summarizes the ammonia concentrations observed in previous studies, with 197 additional details on the studies given in Table S1. The concentration values are classified 198 according to the season in which the measurements were conducted (when specified), and the 199 location of the studies (schools, offices, or homes). All values but one are greater than 10 ppb, a 200 level that is considered a high outdoor concentration of ammonia 33. Schools and offices were 201 locations with the highest ammonia concentrations, reaching maximums of 440 ppb and 103 ppb, 202 respectively. Ammonia in homes ranged between 8.1 ppb and 67.7 ppb. The concentrations of 203 ammonia found in homes are compared with the concentrations found during HOMEChem 204 indicated by the histogram. The histogram seems to be in line with the previous results and 205 provides additional information on the frequency of concentration values. 206 207 Table 1: Ammonia (NH), temperature and relative humidity (RH) levels during HOMEChem Summary of minimum, 10h percentile, mean, 90h percentile, and maximum NH concentration, temperature, and relative humiditymeasured during the unoccupied background measurement and other activities performed during HOMEChem. Measured NH(ppb) Temperature (°C) RH (%) Activity Classification Min 10th % Mean 90th% Max Min 10th% Mean 90th% Max Min 10th% Mean 90th% Max Background 24.2 26.3 31.9 38 40.6 24.5 24.8 25.3 25.8 26.1 53.2 54 57.8 61.7 63.2 Night-time high temp 40 57.5 65.4 72.7 74.3 29.3 32.3 32.7 33.3 33.5 46 47.3 49.1 50.6 51.6 Responsetime 20 28.5 52.5 80 91.6 24.8 27.1 31.2 34.9 35.5 45.8 47 53.2 60 69.5 Cooking 23.8 30 62.1 102.4 130.1 25.4 26 27.8 30.2 30.7 48.9 50.1 52.1 53.9 62.7 Cleaning 19.1 26.1 72.9 94.9 1592 24.1 25 26.7 29.9 35.3 44.6 48.5 52.7 58.8 72.7 Occupancy 29.6 34.9 51.6 86 99 24.7 25.4 26.4 27.6 27.8 49.9 51.9 56 60.1 67.7 208 209 Values for the minimum, 10th percentile, mean,90th percentile, and maximum NH210 concentration measured during the different activities described above are summarized in Table 1. 211 These activities include the background measurement, nighttime high temperature, response time, 212 cooking activity, cleaning activity, and occupancy. The background concentration had a mean of 213 31.9 ppb and each activity caused the ammonia concentration to rise. These summary values reflect 214 the range of measurement, but do not provide insight into the high time resolution dynamic changes 215 in ammonia concentration. 216 NH concentration dependence on temperature 217 Background measurement and nighttime high temperature 218 Indoor ammonia concentrations show a strong dependence on the indoor temperature at219 the UTest house. Figure 2 shows the temperature, RH, and ammonia concentration for two220 different days. Figure 2(a) shows the unoccupied background measurement with the house221 maintaining a mean temperature of 25.3℃ and relative humidity of 57.8%. For these conditions 222 223 Figure2 NH concentration, temperature, relative humidity and cooling coil on/off during unoccupied backgroundon June 15, 2018, with AC set at 76°F (~25.5°℃) and nighttime high temperature on June 24-25, 2018, with ACset at 90°F (~32.2℃). 224 and a mean ammonia concentration of 65.4 ppb. The average temperature during the nighttime225 high temperature measurement was 7.4C hotter than during the background measurement, which 226 effectively doubled the indoor ammonia, increasing the concentration by 33.5 ppb. These levels of 227 ammonia are similar to those in Leaderer et al. (1999) 14 for homes in the case of summer with AC228 on (Table S1). 229 Although the mean ammonia concentrations during the two days are notably different, with230 concentrations ~36 ppb higher on average at the elevated temperatures, they display the same fine 231 scale temperature-dependent behavior, with increases and decreases in ammonia concentration232 over short timescales based on fluctuations in indoor temperature and HVAC operation and233 presence of water on the cooling coil. This behavior is consistent with observations ofcyclic uptake234 of water soluble organic species in a residential HVAC system operating on a duty cycle 34. For235 the background measurement, ammonia concentration varied from a minimum of 24.2 ppb to a236 maximum of 40.6 ppb, matching the rise and fall of temperature, which varied from 24.5℃ to237 26.1°C. For the nighttime high temperature measurement, ammonia concentration varied from a 238 minimum of 40 ppb to a maximum of 74.3 ppb, matching the rise and fall of the higher 239 temperatures, from 29.3°℃ to 33.5℃. 240 In Figure 2, the behavior of the HVAC system and its effect on ammonia concentration 241 can be easily observed: when AC is ON, and thus the cooling coil is wet (due to the temperature242 of the cooling coil being lower than the dew point temperature of the air), the temperature, the RH,243 and the ammonia concentration drop until AC is switched OFF , at which point all three244 immediately start to rise until AC is switched ON once again; this pattern continues while no other 245 activity is taking place within the house. This is also highlighted by the final time period246 represented in Figure 2 (7:07 AM on 6/25/2018), when the AC is returned to the lower temperature 247 of 76°F, and temperature and ammonia concentration return to background measurement levels by248 10:00 AM. The HVAC fan was always ON in the test house (even when the cooling coil was OFF),249 which is not the case in a normal residential HVAC system; this could have enhanced the re-250 evaporation of NH into the supply air when the coiling coil turns OFF. 251 Response time 252 Figure 3 shows NH3 concentration, temperature, and RH during the response time activity. 253 At 10:00 AM the AC was turned off and the temperature steadily increased throughout the day 254 from a starting temperature of 24.8°C to a final maximum temperature of 35.5°℃. Ammonia 255 concentrations also increased throughout the day, with a higher starting concentration for each256 sequential recovery experiment. The maximum ammonia concentration reached during the day257 was 91.6 ppb, but this concentration dropped rapidly during the house flush periods when doors 258 and windows were opened to rapidly ventilate the house with outdoor air with low ammonia 259 concentrations. Note that the ammonia concentrations measured indoors never drop to typical 260 outdoor values indicating a continuous emission of indoor ammonia. Since concentrations of Figure 3 NH concentration, temperature and relative humidity, during response time activity. The yellow columnsshow the-30 minute house flush periods, i.e. the time range when door and windows were opened. 261 ammonia remained high during all the windows and doors being opened, this suggests a large 262 source of ammonia on indoor surfaces which can rapidly be liberated into the gas phase to maintain 263 equilibrium. This surface-gas equilibrium mechanism is similar to the proposed HONO 264 equilibrium mechanism described in detail by Collins et al. 35. This maximum ammonia 265 concentration corresponded with the maximum temperature point and was almost three times 266 higher than the room temperature background measurement and roughly 18 times greater than a 267 typical moderate-high outdoor concentration of 5 ppb, suggesting that a house without air 268 conditioning may reach ammonia concentrations that are quite high during warm periods. 269 Figure 4 utilizes data from Figures 2 and 3 and plots the natural logarithm of ammonia 270 271 272 273274275 276 Figure 4 Plot of the natural logarithm of ammonia concentrationversus inverse of temperature (in K). concentration versus the inverse of thetemperature (in K) using the six peaksof NH3 concentrations recorded duringthe response time activity, plus theaverage of peak concentrations fromthe two background mmeeaasurements.The linearity of this plot (R=0.97) 277 suggests one of two potential mechanisms occurring simultaneously or alone: (1) ammonia 278 emissions from building materials respond to temperature in an exponential fashion, (2) standard 279 sorption kinetics are governing ammonia-surface behavior. The relationship fit in Figure 4 was 280 used to predict background ammonia concentration as a function of temperature during the 281 cooking, cleaning, and occupancy experiments, in order to better quantify and visualize the 282 ammonia emissions observed from these activities. Note that this relationship does not hold when283 doors and windows are open due to dilution with low NH concentration and warmer outdoor air. 284 Cooking experiment 285 The ammonia concentration during the simulated thanksgiving dinner activity is shown in286 Figure 5a. During this activity, ammonia concentration ranges from 23.8 ppb to 130.1 ppb, with a287 mean concentration value of 62.1 ppb. The temperature throughout this activity remains relatively288 stable, with a mean temperature of 27.8°C. This temperature is slightly higher than the set289 temperature on the thermostat (76°F=24.4°℃) due to the cooking activities and associated thermal290 load. 291 Using the measured temperature, the relationship in Figure 4 was used to estimate the292 background ammonia concentration, demonstrating that house emissions alone do not account for293 the enhancements in ammonia concentrations observed during the cooking activity. Thus, cooking Figure 5 NH concentration, NH predicted, temperature, relative humidity and cooling coil on/off during thecooking activity (Thanksgiving dinner) and the cleaning activity (combination of mopping the floor with vinegarand spraying ammonia on surfaces). Graph A) 1,2,3: Open oven to baste turkey; 4: Begin frying turkey on stove;5: Turkey out of oven; 6: Pancetta into oven; 7: Pancetta out of oven; 8: Start Cleanup; Graph B) 1,3: NH spraystarts (after mopping); 2: NH spray starts (before mopping). Time-intervals when windows/door and windowswere opened are indicated with“D+Wopen”and“W open”. NH, decay due to pure air exchange loss is shown ingraph B. 294 emissions are an important source of ammonia here, and these emissions have a larger effect on295 the ammonia concentration than the temperature-based background emissions on this day. 296 In Figure 5a, ammonia concentration shows a rapid increase each time the oven is opened. 297 In fact, the first five peaks on the graph (labeled as 1, 2, 3, 5, and 7) correspond with openings of 298 the oven door associated with turkey and pancetta being cooked inside the oven. This relationship299 between the opening of the oven door and peaks in ammonia levels suggests that the thermal300 decomposition of amino acids in proteins of the meat may be an important source of ammonia301 during cooking activities 36. In contrast, stir-frying of vegetables was done frequently during302 HOMEChem and did not show the ammonia enhancements (Figure S1) observed from roasting 303 turkey, supporting the amino acid breakdown pathway as the likely source of ammonia emission.304 Cleaning experiment 305 Duringthheeammonia-basedproduct cleaningactivity,,themaximum ammonia306 concentrations of the entire HOMEChem experiment are reached. As shown in Figure 5b, there307 are three main peaks that follow the three cleaning procedures described in the Methods above.308 Peaks 1 (976 ppb) and 3 (732ppb) result from when ammonia is sprayed on surfaces after the309 floors are mopped with vinegar. The second peak, 1592 ppb, which is the maximum ammonia310 concentration value recorded over the entire HOMEChem experiment, results after ammonia is311 sprayed before mopping the floors with vinegar. 312 The alternating order of vinegar mopping and ammonia-product spraying, with consequent313 lower concentrations of ammonia when spraying occurred after mopping, suggests that the314 neutralization reaction between ammonia and acetic acid happens quickly, limiting ammonia315 concentrations from climbing to even higher values by removing some fraction of the ammonia 316 when it is added to the vinegar-coated floor. In all cases though, the highest indoor concentrations317 of ammonia were observed with values on the order of 1 ppm for each cleaning event. 318 After each peak, which occurred during the spraying of ammonia during cleaning, 319 ammonia then returned to lower levels within one to three hours. After the peak ammonia 320 concentrations, indoor ammonia levels returned to 60 ppb after 44, 62, and 37 minutes for cleaning 321 activities 1,2, and 3 respectively. The pure air exchange traces in figure 5b show the decay of 322 ammonia if caused only by the air exchange rate. In this case, the ammonia concentration would 323 return to 40 ppb after each peak in much longer time periods. The steep decline of ammonia 324 observed following each peak could be caused by the indoor uptake from chemical reactions and/or 325 the solubility in the water film on the surfaces in the house and in particular on the active cooling 326 coil and dehumidifier. Further investigation is needed to better understand the uptake dynamics of 327 ammonia in the indoor environment. Note that predicted values of NH based on temperature are 328 no longer valid when ventilation with outside air occurs until equilibrium can be reestablished after329 closing doors and windows. 330 Occupancy 331 The higher occupancy that occurred during the“Open House”was correlated with higher332 ammoniaconcentrations, reaching a peak of 99 ppb, as seen in Figure 6a. It was estimated by visual333 observation that 15 to 20 people were in the house during both the first and the second tour (9:30334 - 10:45 AM and 12:00-1:00 PM), while a higher number of around 20 to 25 people were in the335 house during the third tour (1:00-2:00 PM). This higher number of people and the consecutive336 occurrences of the second and third tours may contribute to explaining why ammonia levels reach337 a maximum after the third tour. This can also be seen by CO2 levels, which show an increase in Figure 6 Graph A) NH concentration, NH predicted, temperature, relative humidity and cooling coil on/off duringthe occupancy activity (Open House). Time-intervals when the door was open are indicated by the black trace. TheCO2 gaps show time intervals when the outdoor concentration was measured, while outdoor CO indicates the meanoutdoor CO2 collected over the time period shown in the figure; Graph B) Fitting lines and ANH (NH3-NHpredicted) versus AC02 (CO2- CO2outdoor) during each tour of the open house. Slopes from fit-Tour 1: 0.015ppb for ppm of CO; Tour 2:0.030 ppb ofNH for ppm of CO2; Tour 3: 0.048 ppb of NH, for ppm of CO2 338 CO2 concentration from 1275 ppm to 2241 ppm over the first tour and from 1800 ppm to 3010 339 ppm over the second and the third tour. Figure 6b shows the incremental change of ammonia as a 340 function of the increment of CO2 due to the different number of people taking part in each tour of 341 the open house. While ammonia concentration points are well distributed over the fitting line in 342 the first tour, suggesting a steady increase of ammonia with occupancy, this behavior is not visible 343 over the following two tours. A possible explanation of this trend is that the loss of ammonia due 344 to the solubility in the water film of the coils and/or other surfaces in the house reach saturation 345 and are not as effective at taking up additional ammonia. As part of the HOMEChem project, there 346 were dedicated days to varying the number of occupants in the test house, however, changes in347 ammonia concentration were small compared to changes from HVAC operation, as can be seen in 348 Figure S2. Quantifying ammonia emission from humans remains a challenge and further studies349 are required to understand this topic. 350 The mean ammonia concentration throughout the open house day is 51.6 ppb, while the351 mean temperature during the open house is 26.4℃, a value typical for the average temperature352 during the background measurements. During the open house, however, the AC was running353 constantly in order to keep the temperature low, due to a combination of factors, including the354 number of people inside the house, the uncontrolled opening and closing of the door, and the high355 outside temperature. These observed ammonia concentrations are consistent with studies by356 Sisovic et al. (1987) 7 and Gomzi (1999) 13 which found an indoor ammonia concentration in the357 summer, in offices and schools respectively (i.e. places with high occupancy), of more than 100 358 ppb. 359 AmmoniaaCconcentrations measured during1the HOMEChem i experimentshowed360 significant enhancements of indoor ammonia concentration compared to typical outdoor values.361 The values observed were consistent with other studies of indoor ammonia concentration.362 however, we suggest additional measurements across climate zones and in different seasons are363 needed to assess how applicable the observed indoor levels of ammonia are across other indoor364 environments and HVAC operating conditions. Overall, indoor concentrations of ammonia appear365 to be strongly controlled by gas-surface equilibrium similar to observations for HONO35. These366 concentrations are modulated by the HVAC system and the cooling coil state. The higher gas phase367 concentrations of ammonia indoors may be important drivers for chemical reactions as compared368 to outdoor levels. Reactions in which ammonia is the limiting reagent will be enhanced up with369 the higher concentrations indoors..JThe presence of ammonia may also serve as an avenue for370 acidic gases (e.g. HCl, HNO3) to react and partition into the particle phase as ammonium salts. 371 Further, due to the high solubility of ammonia in water, and the wet surfaces in the HVAC system 372 when the cooling coil is on or other wet surfaces indoors, there may be avenues for aqueous 373 chemistry to occur and/or the HVAC system may be a sink for ammonia. This would follow the 374 mechanism of uptake of water soluble organic species as described by Duncan et al. (2019) 34. 375 These observations of ammonia concentrations during HOMEChem are the first, to our 376 knowledge, of high time resolution indoor ammonia measurements with the ability to clearly 377 identify different sources and processes impacting ammonia concentrations in the indoor378 environment. 379 380 ACKNOWLEDGMENTS 381 VWe thank PicarroInc. for the loan of the G2103analyzer for use during HOMEChem.This382 workVWasfunded by grants from the Alfred P. Sloan Foundation Chemistry of Indoor383 Environments Program (G-2017-9944 and 2016-7050) and Drexel University Steinbright co-op384 funding. We acknowledge the University of Texas at Austin for hosting HOMEChem and Marina385 Vance and Delphine Farmer for leading the project. 386 387 Supporting information: Table of details for previous integrated measurements of indoor388 ammonia (Table S1), additional figures showing other cooking and occupancy measurements389 (Figures S1 and S2) REFERENCES ( 1 Roney, N.; Llados, F., Toxicological p rofile for ammonia. 2004. 2 ) ( Swotinsky, R. B . ; Chase, K . H . , Health effects of exposure to ammonia: scant information.American journal ofindustrial medicine 1990, 17,(4), 515-21. ) ( 3. Nielsen, G. D.; Wolkoff, P.; A larie, Y., Sensory irritation: Risk assessment approaches.Regulatory T oxicology and Pharmacology 2007, 48, (1), 6-18. ) ( 4. National Research Council, Ammonia. In Acute Exposure Guideline Levels for SelectedAirborne Chemicals: Volume 6, The National Academies Press: Washington,DC, 2008; p 320. ) ( 5. de la Hoz, R. E.; Schlueter, D. P.;Rom, W. N., Chronic lung disease secondary to ammoniainhalation injury: a report on three cases. American journal ofindustrial medicine 1996, 29, (2), 209-14. ) ( 6 Nagata, Y., Odor intensity and odor threshold value. Japan Air Clean Assoc 2003, 41, 17 - 7 ) ( Sisovic, A .; S ega, K .; K alinic, N ., Indoor/outdoor relationship of ammonia concentrationsin selected office buildings. Science of The Total Environment 1987, 61, 73-77. ) ( 8. Li, Y.; Harrison, R. M., Comparison of indoor and outdoor concentrations of acid gases,ammonia and t h eir associated salts. Environmental Technology 1990,11,(4),315-326. ) ( 391392393394395396397398399400401 402 403404405406407408409410411 412 413414415416417418419 420 421 14. Leaderer, B. P.; N aeher, L.; J a nkun, T. ; Bal e nger, K.; Holford, T. R.; Toth, C.; S u lli v an, 422 J.; Wolfson, J. M.; Koutrakis, P., Indoor, outdoor, and regional summer and winter concentrations 423 ofPM10, P M2.5, S O 4(2)-,H+ , NH4+,NO3-, NH3, and n i trous acid in hom e s with and without 424 kerosene space heaters . Environmental health perspective s 1999, 107,(3),223-31. 425426427428 429430431 432 433434 ) ( 9. Brauer, M.; Koutrakis, P.; Keeler, G. J.; Spengler,J. D., Indoor and outdoor concentrationsof inorganic acidic aerosols and gases. Journal of the Air & Waste Management Association 1991,41,(2),171-81. ) ( 10. T idy, G.; N eil C a pe, J., A m monia concentrations in hou s es and p ubli c buildings.Atmospheric Environment. Part A. G eneral Topics 1 993, 27, (14), 2235-2237. ) ( 1 1 . Atkins, D. H . F.; L ee, D . S ., I ndoor concentrations o f ammonia and the potentialcontribution of humans to atmospheric budgets. Atmospheric Environment. Part A. Gene r al Topics1993,27,(1),1-7. ) ( 12. Suh, H. H.; K o utrakis, P.; Spengler, J. D., T h e relationship between airborne acidity andammonia in indoor environments. Journal ofexposure analysis and environmental epidemiology 1994,4, (1),1-22. ) ( 13. Gomzi, M . , I n door ai r and respiratory health in preadolescent ch i ldren. AtmosphericEnvironment 1999, 33, (24), 4 081-4086. ) ( 15. Lunden, M. M.; Revzan, K. L.; Fi s cher, M. L.; Thatcher, T. L. ; Littlejohn, D.; Hering, S.V.; Brown, N . J., The transformation o f outdoor ammonium nit r ate ae r osols in the in d oorenvironment. Atmospheric Environment 2003,37,(39), 5633-5644. ) ( 16. Fischer, M. L.; Littlejohn, D.; Lunden, M. M.; Brown, N. J., Automated measurements ofammonia and nitric acid in indoor and o utdoor air. Environmental science & technology 2003, 37,(10), 2114-9. ) ( 17. L arson, T.V.; Covert, D. S.; Frank, R.; Charlson, R. J . , Ammonia in the human airways:neutralization of inspired acid sulfate aerosols. Science 1977, 197, (4299), 161. ) ( 18. Sutton, M. A .; D ragosits, U.; Tang, Y . S.; F owler, D., A mmonia emissions from non-agricultural sources in the UK. Atmospheric Environment 20 0 0, 34,(6),855-869. ) ( 19 Bai, Z.; Dong, Y.; Wang, Z.; Zhu, T.,Emission of ammonia from indoor concrete wall andassessment of human exposure. Environment International 2006, 32 , (3),303-311. ) ( 20. Schmidt, F. M .;V a ittinen, O.; M e tsala, M.; L e hto, M.; F o rsblom, C.; Groop, P. H.;Halonen, L., Ammonia in breath and emitted from skin. Journal of breath research 20 1 3, 7,(1), 017109. ) ( 21. N ational S cience a nd T echnology Council (U.S.); A i r Quality Research SubcommitteeAtmospheric Ammonia: Sources and F ate. A Review ofOngoing Federal Research and FutureNeeds; Washington, D.C., 2000. ) ( 22. Bittman, S.; Mikkelsen, R ., Ammonia emissions fro m agricultural operations: livestock. Better Crops with Plant Food 2009,93,(1),28-31. ) ( 23. Klepeis,N. E.; Nelson, W. C.; Ott, W.R.;Robinson, J.P.;T s ang, A. M.; Switzer, P.; Behar,J. V.; Hern, S. C.; Engelmann, W. H., The National Human Activity P attern Survey (NHAPS): aresource for assessing exposure to environmental pollutants. Journal of exposure analysis andenvironmental epidemiology 2001,11,231. ) ( 24. T uomainen, M . ; P a sanen, A.-L.; Tuomainen,A.; Jyrki, L.; Juvonen, P., U sefulness of theFinnish classification of indoor climate, construction and finishing materials: comparison of indoorclimate between two new blocks of flats in F inland. Atmospheric Environment 2001, 35, (2), 305- 313. ) ( 25. Jarnstrom, H .; Saarela, K.; K alliokoski, P.; P asanen, A. L., Reference values for indoor airpollutant concentrations in new, r e sidential buildings in Finland. Atmospheric Environment 2006,40, (37),7178-7191. ) 26. Salonen,H. J.; Pasanen, A.-L.; Lappalainen, S. K.; Riuttala, H. M.; Tuomi,T.M.; Pasanen,P. O.; Back, B. C.; Reijula, K. E., Airborne Concentrations of Volatile Organic Compounds,Formaldehyde and Ammonia in Finnish Office Buildings with Suspected Indoor Air ProblemsJournal ofOccupational and Environmental Hygiene 2009,6, (3),200-209. 27. Meininghaus, R.; Kouniali, A.; Mandin, C.; Cicolella, A., Risk assessment of sensoryirritants in indoor air-a case study in a French school. Environment International 2003, 28, (7),553-557. 28. Martin, N. A.; Ferracci, V.; Cassidy, N.; Hoffnagle, J. A., The application of a cavity ring-down spectrometer to measurements of ambient ammonia using traceable primary standard gasmixtures. Applied Physics B 2016, 122,(8),219. 29. Farmer, D. K.;Vance, M. E.;Novoselac, A.; Abbatt, J.; Abeleira, A.; Alves, M. R.; Arata,C.; Boedicker, E.; Cardoso-Saldana, F.; Corsi, R.; DeCarlo, P.; Goldstein, A. H.; Grassian, V.;Hildebrandt Ruiz,L.; Jimenez,J. L.;Kahan,T. F.; Katz, E.;Nazaroff, W.; Or, V.;O’Brien, R. E.;Stevens, P.; Tian, Y.; Wang, C.; Zhou, S.; Zhou, Y., Overview ofthe House Observations ofMicrobial and Environmental Chemistry (HOMEChem) study. In Forthcoming 2019. ( 30. Novoselac, A.; Siegel, J. A., Impact o f placement of portable a i r cleaning devices inmultizone residential environments. Building and Environment 2009, 44,(12),2348-2356. ) ( 31. Yver K wok, C . ; Laurent, O.; Guemri, A. ; Ph i lippon, C.; Wastine, B.; Rella, C . W.;Vuillemin,C.; Truong,F.; Delmotte, M .; Kazan, V.;Darding,M.; Lebegue, B.; Kaiser, C.; Xueref-Remy, I ; Ramonet, M., Co m prehensive labo r atory and fiel d testing of cavity rin g -downspectroscopy analyzers measuring H2O,CO2,CH4 and CO. Atmos. Meas. Tech. 2 015,8,(9),3867- 3892. ) 480 ( 32. Goetz, J. D .; A very, A . ; W e rden, B.; Floerchinger, C.; Fortner, E. C .; Wormhoudt, J.;Massoli, P.; Herndon, S. C.; Kolb, C. E.; Knighton, W. B.; Peischl, J.; Warneke,C.; de Gouw, J .A.; Shaw, S. L.;DeCarlo, P. F., Analysis of local-scale background concentrations of methane and ) ( 481 other gas-phase species in the Marcellus Shale. Elementa-Science of the Anthropocene 2017, 5, 1- 482 ) ( 483 Kharol, S. K.; Shephard, M . W.; McLinden, C. A.; Zhang, L.; Sioris, C. E.;O'Brien, J. M.; ) ( 484 Vet, R.; Cady-Pereira, K . E .; Hare, E.; Siemons, J.; Krotkov, N . A., D ry D e position of Reactive ) ( 485 Nitrogen F rom S a tellite Observations of Ammonia and Ni t rogen Dioxide Over North America. 486 Geophysical Research Letters 2018,45,(2),1157-1166. ) ( 487 34. D uncan, S . ; Tomaz, S.; Morrison, G.; Webb, M.; Atkin, J.M.; Surratt, J.D.; T u rpin, B. J., ) ( 488 Dynamics of re s idential w a ter-soluble organic g ases: Insights i nto sourcesS and sinks 489 Environmental science & technology2019,53,(4), 1 812-1821. ) ( 490 35. Collins, D. B.; Hems, R. F.; Zhou, S.; W ang, C . ; Grignon, E.; Alavy, M.; S iegel, J. A .; ) ( 491 Abbatt, J. P. D., Evidence for Gas-Surface E quilibrium Control of Indoor Nitrous Acid. Environ 492 Sci Technol 2018, 52,(21),12419-12427. ) ( 493 36. Weiss, I . M.; Muth, C .; D rumm, R. ; Ki r chner, H. O. K., Thermal decomposition of the ) ( 494 amino acids glycine, cysteine, a spartic acid, asparagine, glutamic a cid, glutamine, ar ginine a nd 495 histidine. BMC Biophysics 2018, 11, (1), 2. ) Environmental Science & Techndlage off2.24 ACS Paragon Plus Environment NH3 concentration, temperature, relative humidity and cooling coil on/off during unoccupied background on June 15, 2018, with AC set at 76°F (~25.5°C) and nighttime high temperature on June 24 - 25, 2018, with AC set at 90°F (~32.2°C).
确定

还剩23页未读,是否继续阅读?

产品配置单
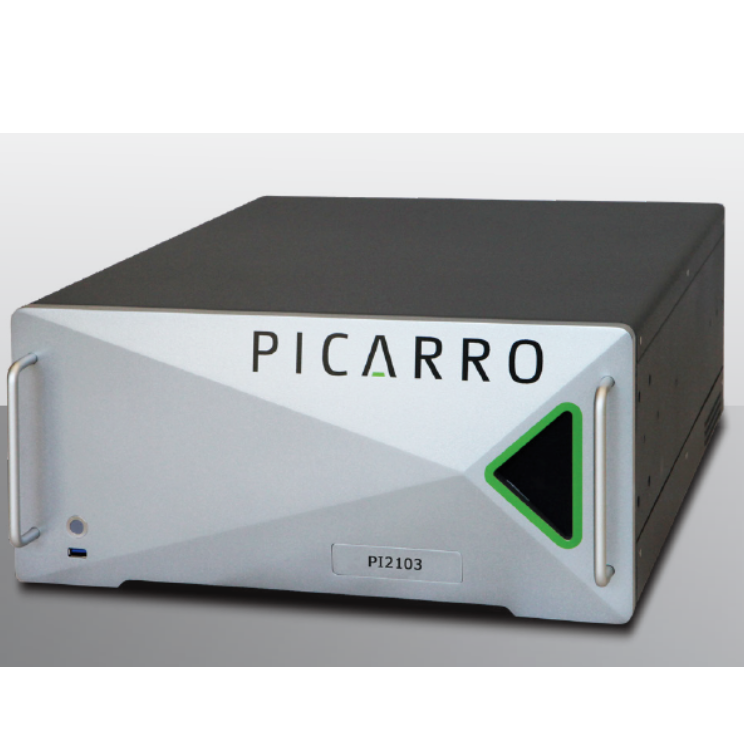
北京世纪朝阳科技发展有限公司为您提供《室内空气中氨气体检测方案(氨气分析仪)》,该方案主要用于空气中分子态无机污染物检测,参考标准--,《室内空气中氨气体检测方案(氨气分析仪)》用到的仪器有Picarro G2103 超高精度氨气(NH3)气体浓度分析仪
推荐专场
相关方案
更多
该厂商其他方案
更多