方案详情
文
本应用介绍了如何使用圆二色光谱仪(CD)的多元SSE程序分析八种蛋白质的二级结构,并与x射线晶体学得到的二次结构结果吻合较好。
方案详情

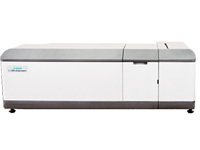
Application Note Using the Multivariate Secondary StructureEstimation (SSE) program214Application Note CDDSpectroscopy Using the Multivariate Secondary StructureEstimation (SSE) program Introduction CD measurements reveal information regarding thesecondary structure or backbone conformation of aprotein. Determination of the secondary structure contentof a biomolecule can elucidate the relationship betweenstructure and function or verify protein stability. JASCO'smultivariate Secondary Structure Estimation (SSE) programcan be used to analyse CD data in order to supplyresearchers with more quantitative structure estimations.Alarge number of samples can be automatically measuredand efficiently analysed using the High-Throughput CD(HTCD) system and multivariate SSE program. JASCO J-1500 high-throughput CD system View product information at www.jascoinc.com This application notes demonstrates secondary structureresults of eight proteins using the Multivariate SSE program. Keywords Secondary structure estimation, circular dichroism, HTCD,Multivariate, Biochemistry, Pharmaceuticals Experimental Measurement conditionsData acquisition interval0.1 nm Response time2 secondsSpectral bandwidth1nm Scan speed100 nm/minAccumulations2 times Path length1mm Results Prior to obtaining the sequence measurement, the pathlength and mean residue molar concentrations have to bespecified so that the optical constants can be automatically calculated for the secondary structure estimation (Figure 1). 1.63ld 1 382|C 1 244|C 1 444lC 158lC Figure 1. Multivariate parameter setup specifying path length and mean residue molar concentration The CD measurements in the far-UV region are obtained for eight 0.1 mg/mL protein samples with varying secondarystructure compositions and are shown in Figure 2. Figure 2. CD spectra of protein samples The secondary structure is estimated from the protein spectra in Figure 1 using the PLS multivariate method. Table 1compares these results with X-ray crystallography data. Figure 3 shows the secondary structure results set up in theJWMVS program. 28600 Mary's Court, Easton, MD 21601 USA Table 1. Comparison of Multivariate SSE results with X-ray crystallography data a-Helix % B-Sheet % Turn % Other% Lysozyme PLS 42.8 0.4 24.4 32.4 X-ray' 41 4 19 35 Cytochrome C PLS 42.6 3.1 181 36.2 X-ray' 42 8 9 42 Concanavalin A PLS 5.1 44.6 13.9 36.4 X-ray' 2 36 12 49 B-Lactoglobulin PLS 17.8 35.5 12.3 34.4 X-ray' 13 34 13 41 Trypsin inhibitor PLS 13.9 25.3 17.3 43.5 X-ray 2 33 10 55 Ribonuclease A PLS 21.5 14.7 22.4 41.4 X-ray 22 19 11 48 Human SerumAlbumin (HSA) PLS 66.8 1.3 8.2 23.7 X-ray 72 0 8 29 Hemoglobin PLS 61.1 0 18 20.9 X-ray 75 0 10 15 'W.C. Johnson, Proteins: Structure, Function, and Genetics (1999),35,307-312. Figure 3. Results set up using the Multivariate SSE program . Conclusion This application note illustrates the use of the Multivariate SSE program in obtained secondary structure data afterCD measurements. The PLS method shows good agreement with secondary structure results obtained by X-raycrystallography 28600 Mary's Court, Easton, MD 21601 USA JASCO INC.Mary’s Court, Easton, MD USATel: ( Fax: ( pplication Library: http://www.jascoinc.com/applications JASCO INC.Tel: ( Fax: ( pplication Library: http://www.jascoinc.com/applicationsCopyright O JASCO Corporation CD测量揭示了蛋白质的二级结构或主干构象的信息。生物分子二级结构含量的测定可以阐明结构与功能之间的关系,也可以验证蛋白质的稳定性。JASCO的多元二次结构估计(SSE)程序可以用来分析CD数据,为研究人员提供更多的定量结构估计。利用高通量CD (HTCD)系统和多变量SSE程序,可以对大量样品进行自动测量和有效分析。
确定


还剩2页未读,是否继续阅读?
JASCO 公司为您提供《蛋白质中二级结构检测方案(圆二色光谱仪)》,该方案主要用于预防类生物药品中组学研究检测,参考标准--,《蛋白质中二级结构检测方案(圆二色光谱仪)》用到的仪器有JASCO日本分光 圆二色光谱仪/圆二色谱 J-1500
推荐专场
相关方案
更多
该厂商其他方案
更多


