


方案详情
文
通过impact II Q-TOF 质谱进行蛋白组学和代谢组学研究,可以深入观察到合理的菌种如何设计提高了生物生产效率。基于代谢组学和蛋白组学的组学研究,可以找到精氨酸合成途径改变的理由和解决生化合成途径存在的瓶颈。
方案详情

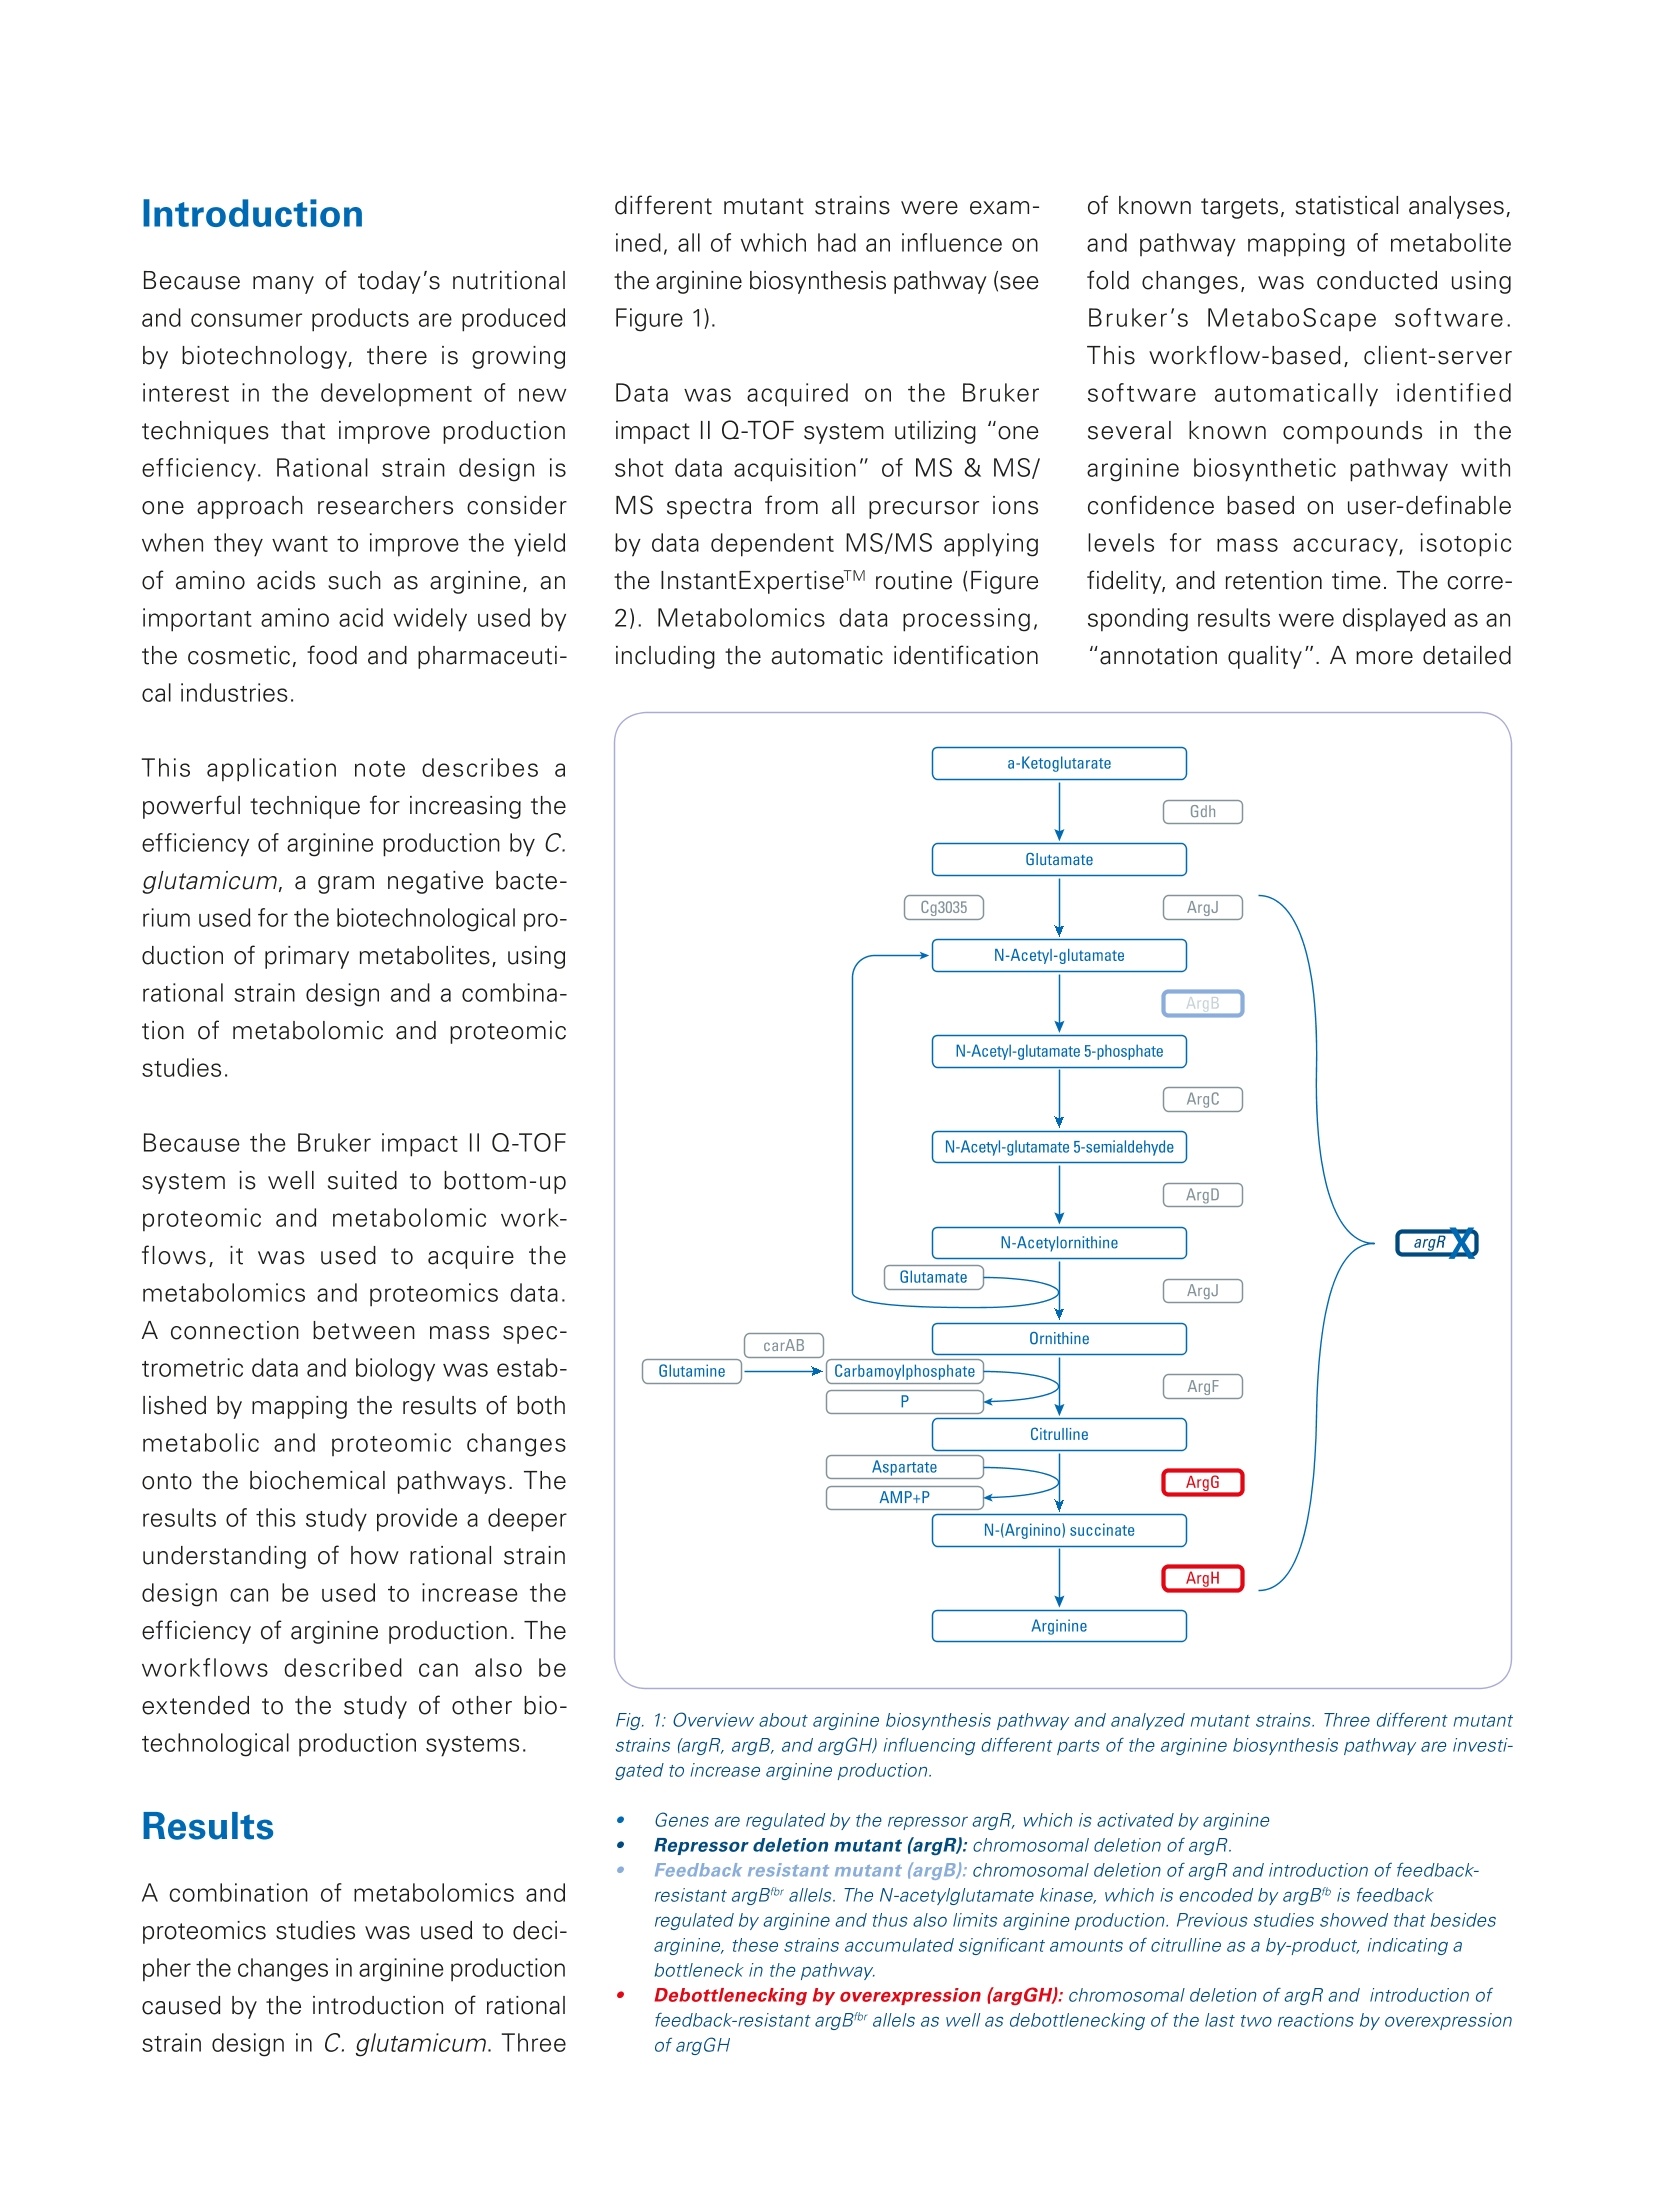
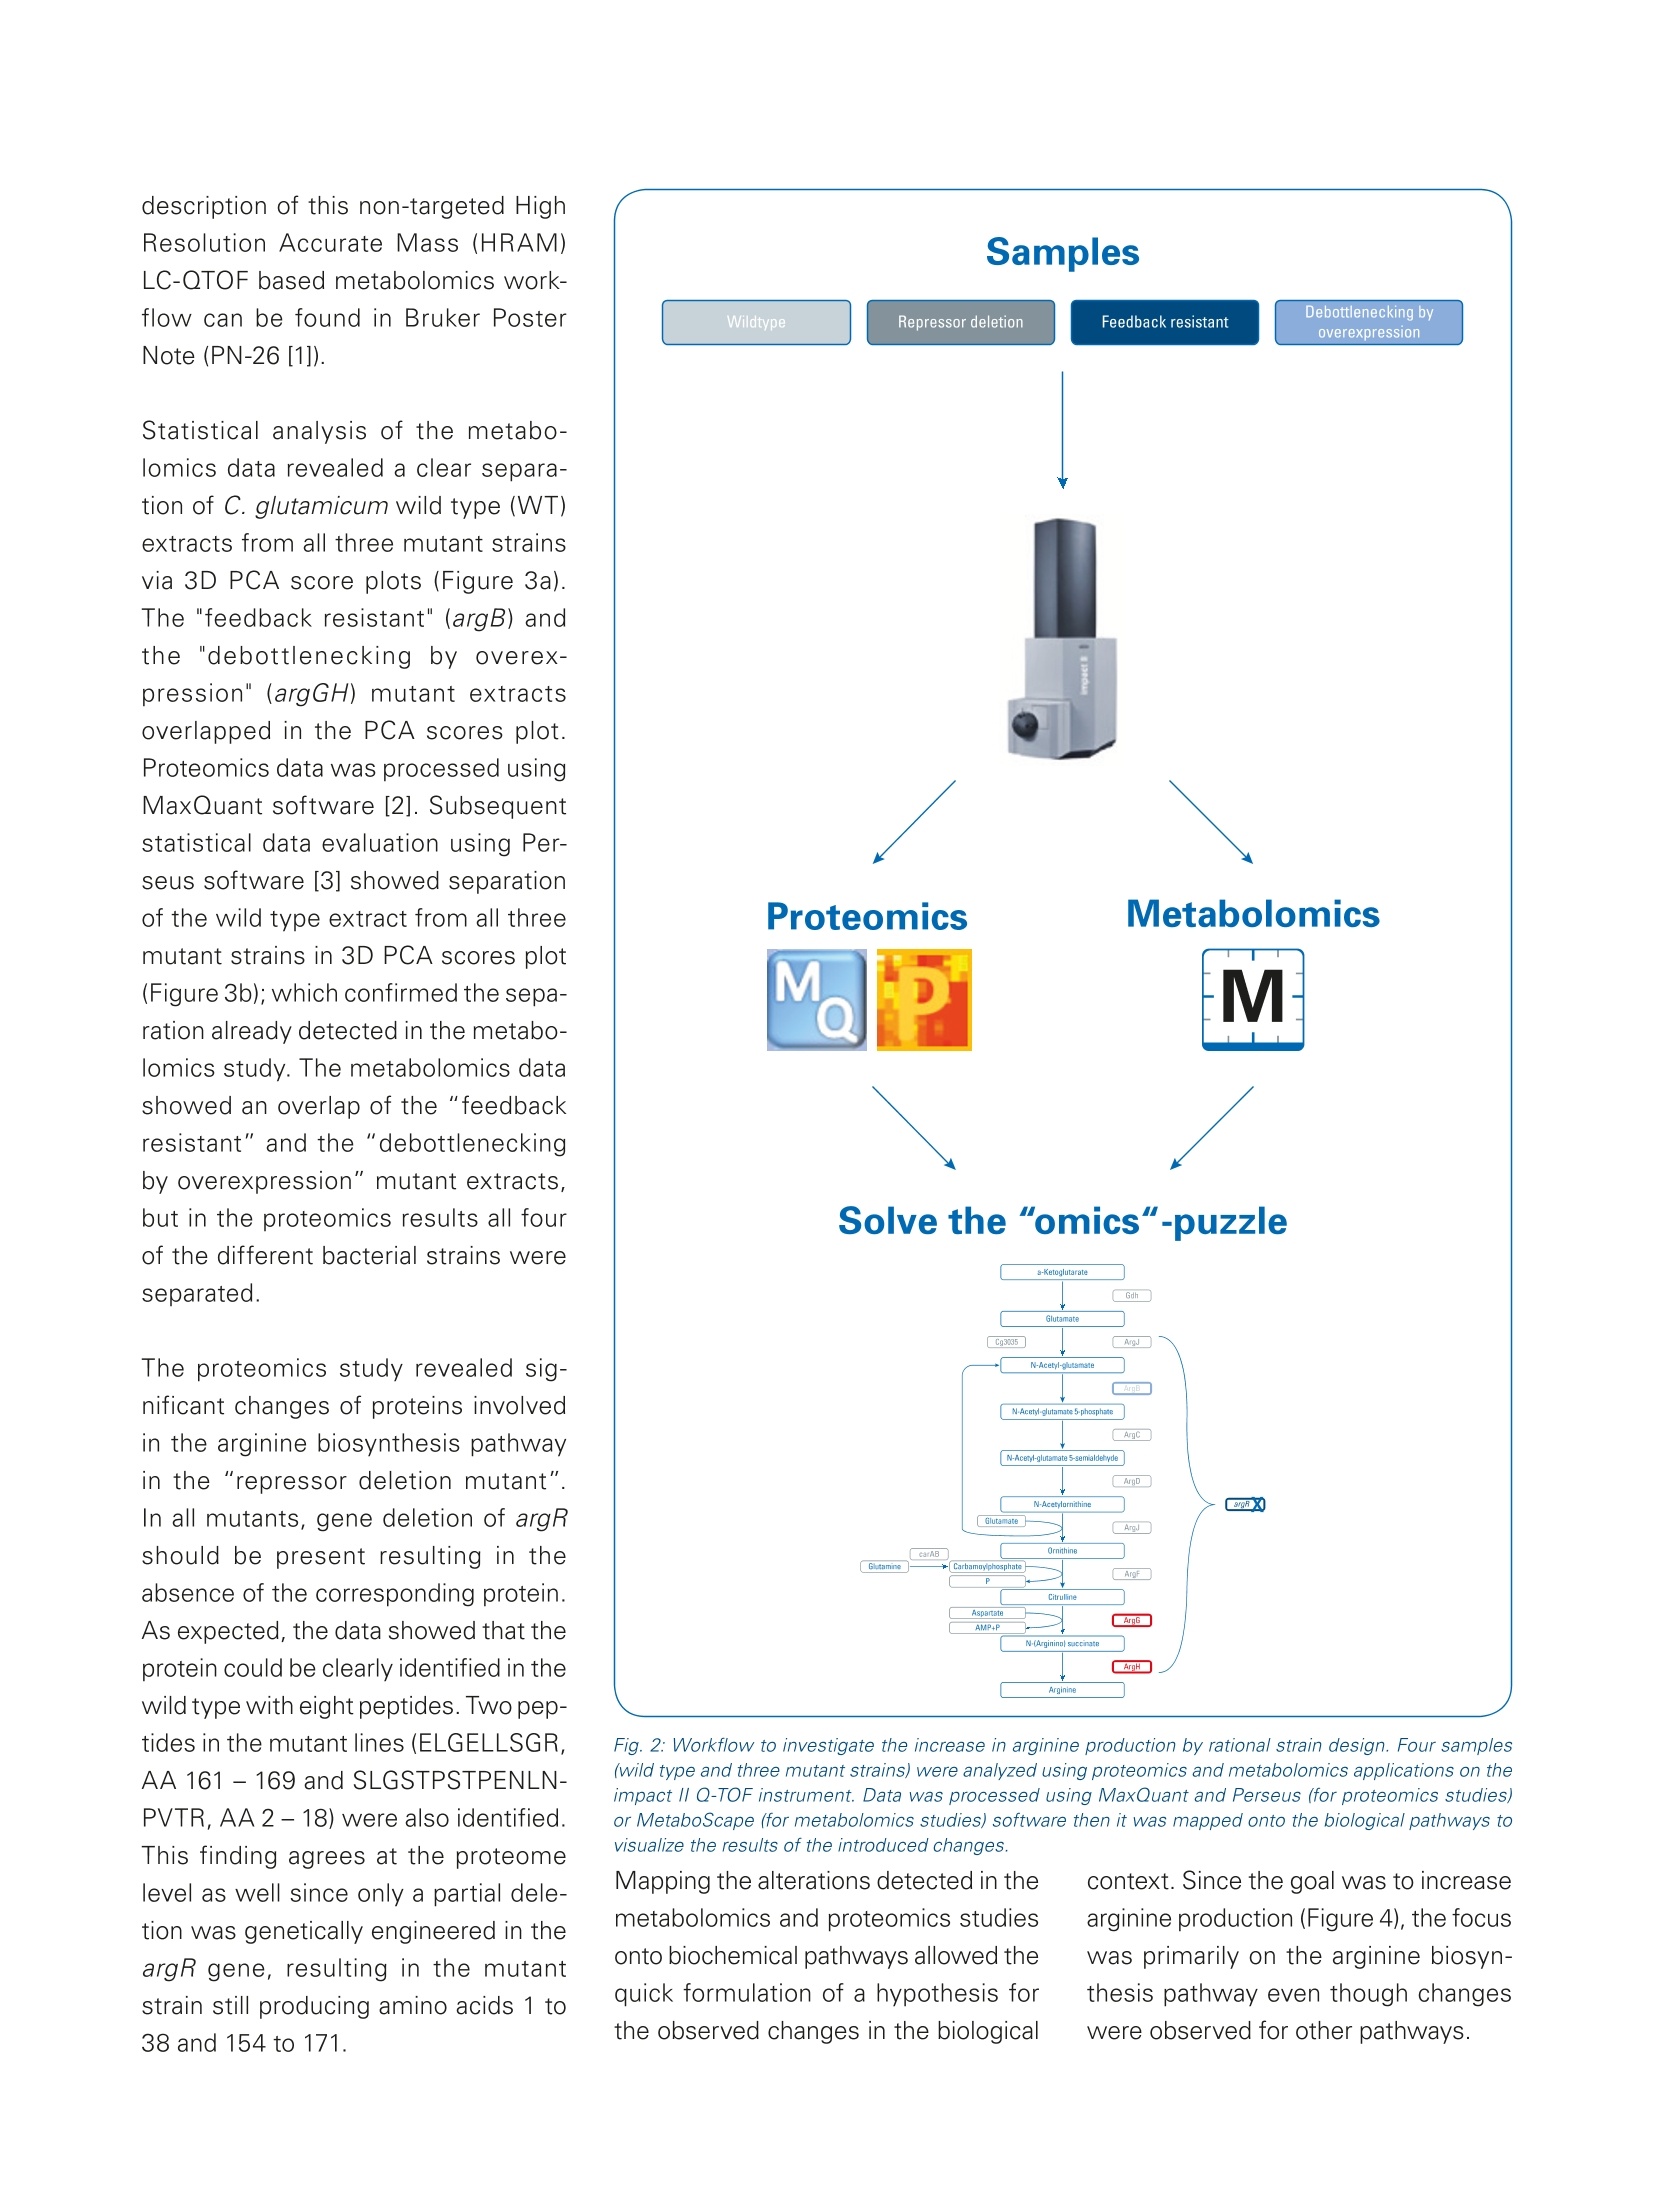
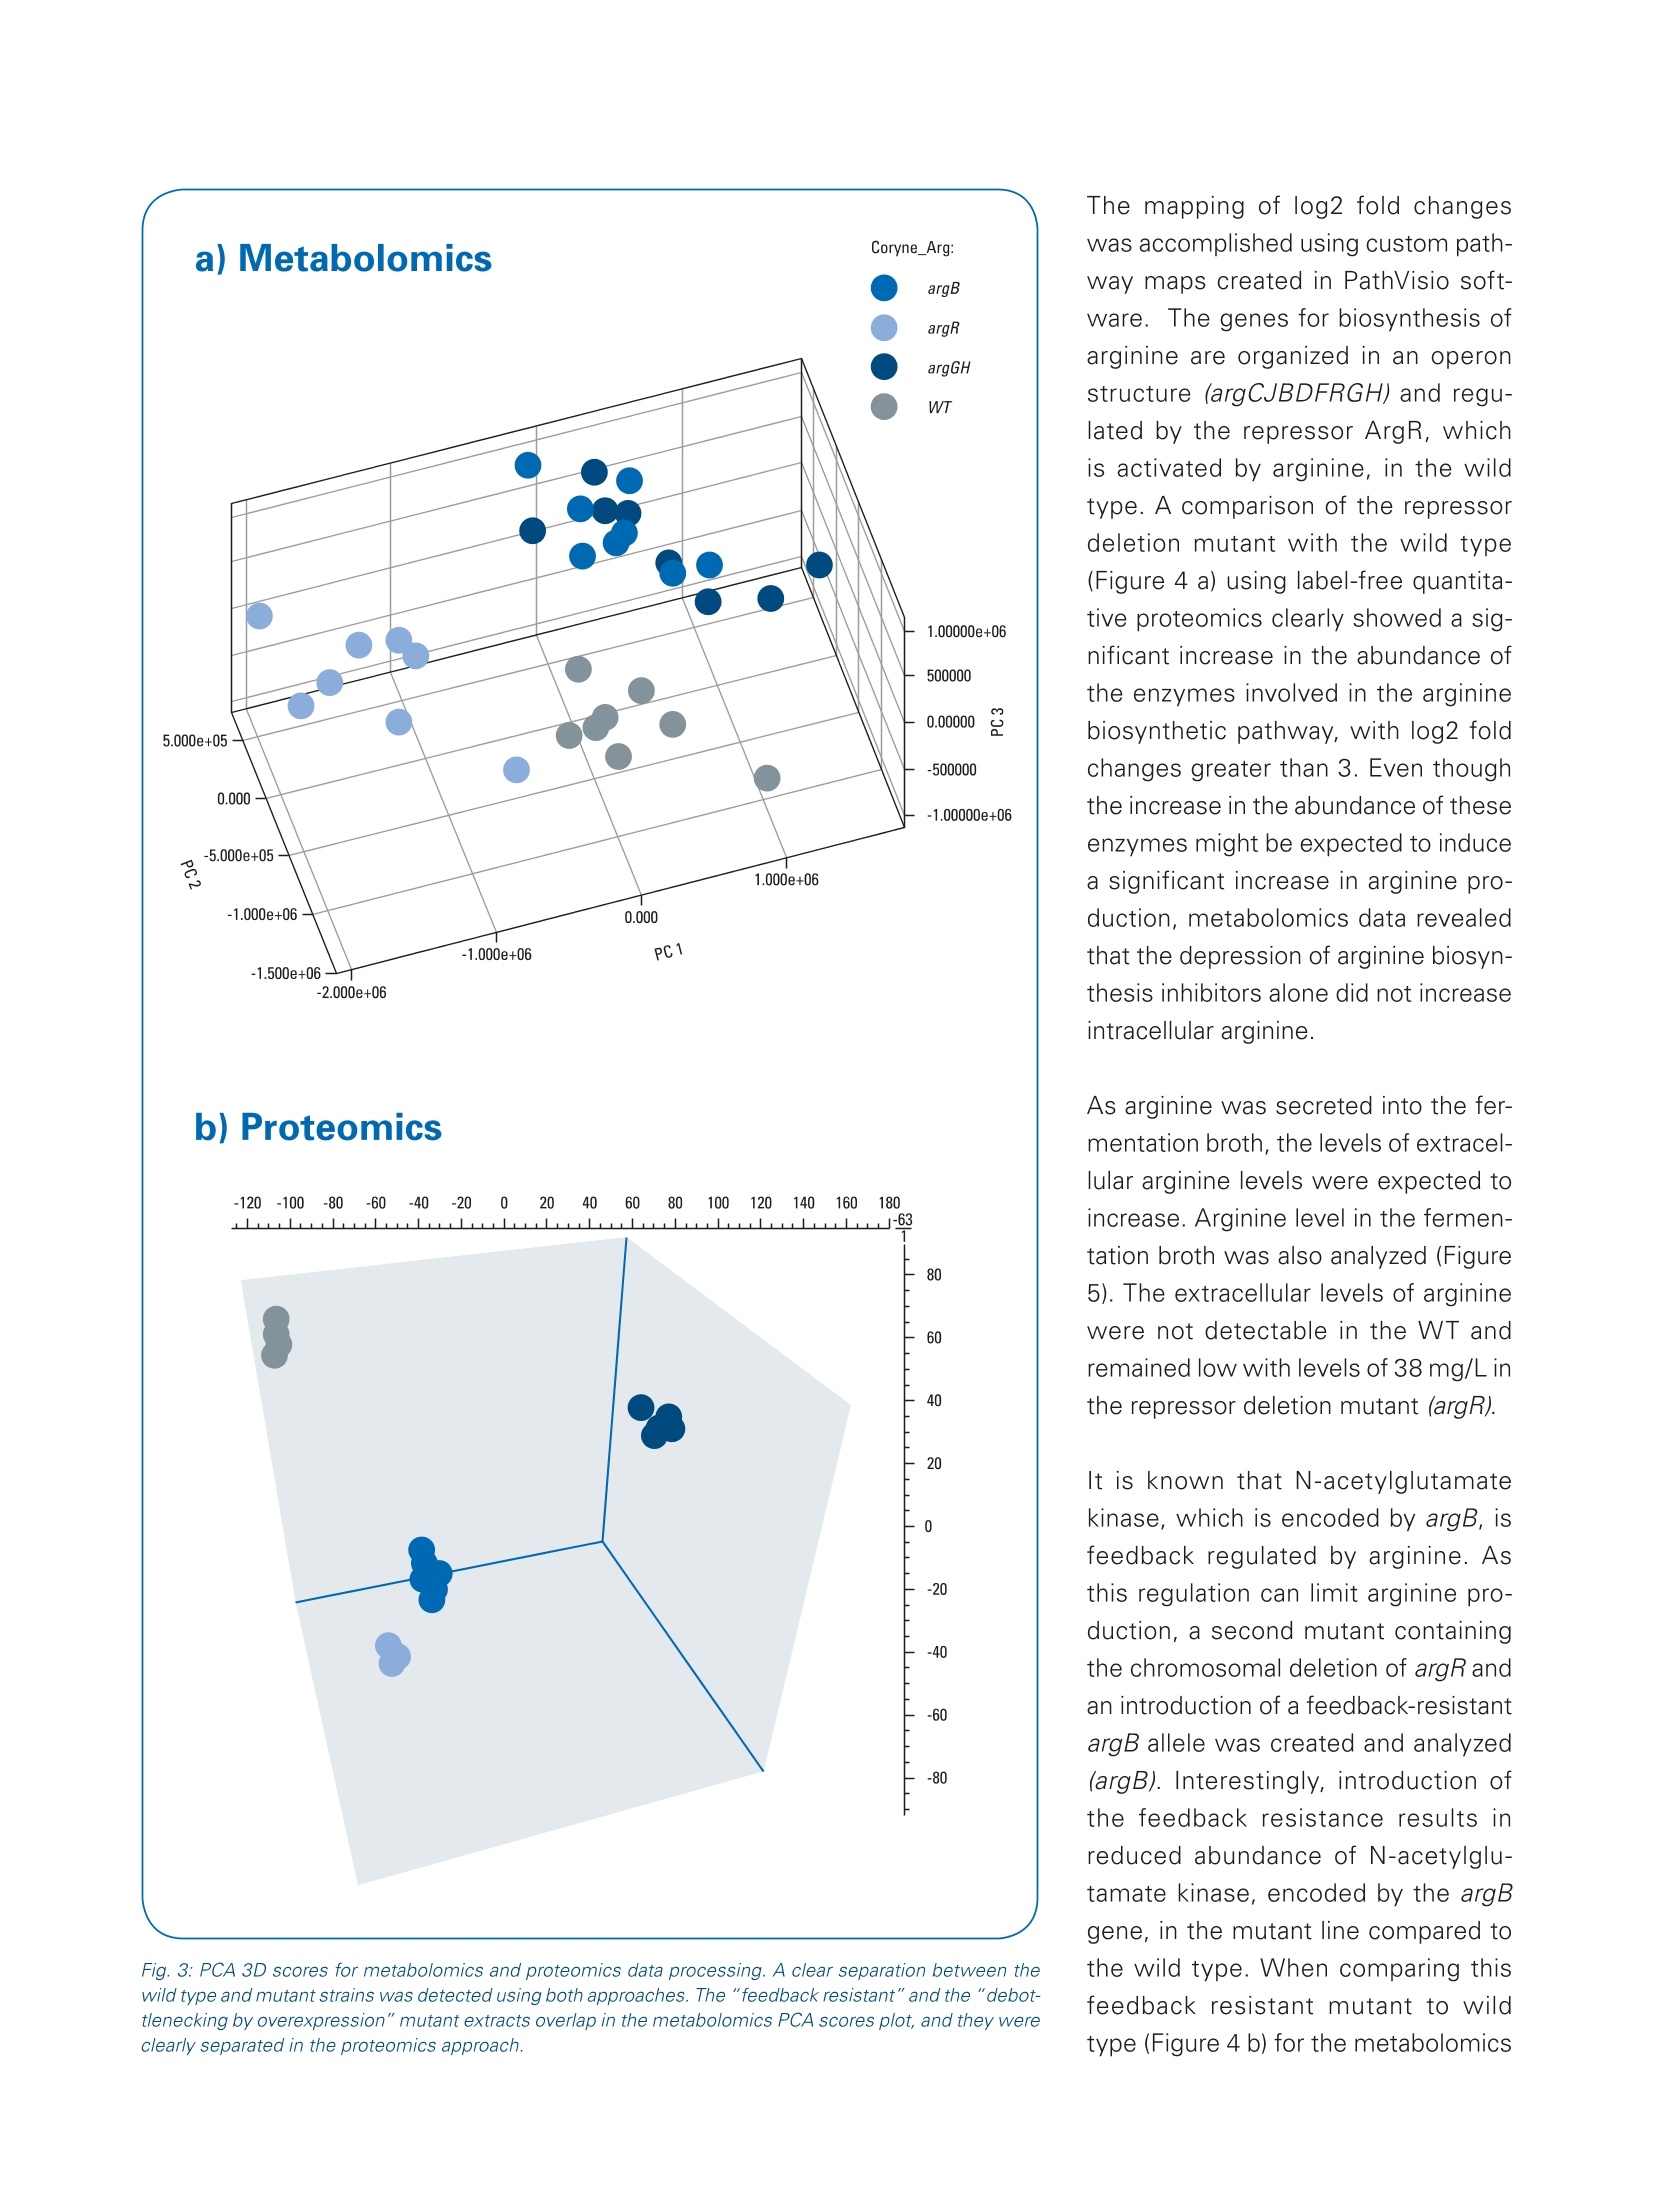
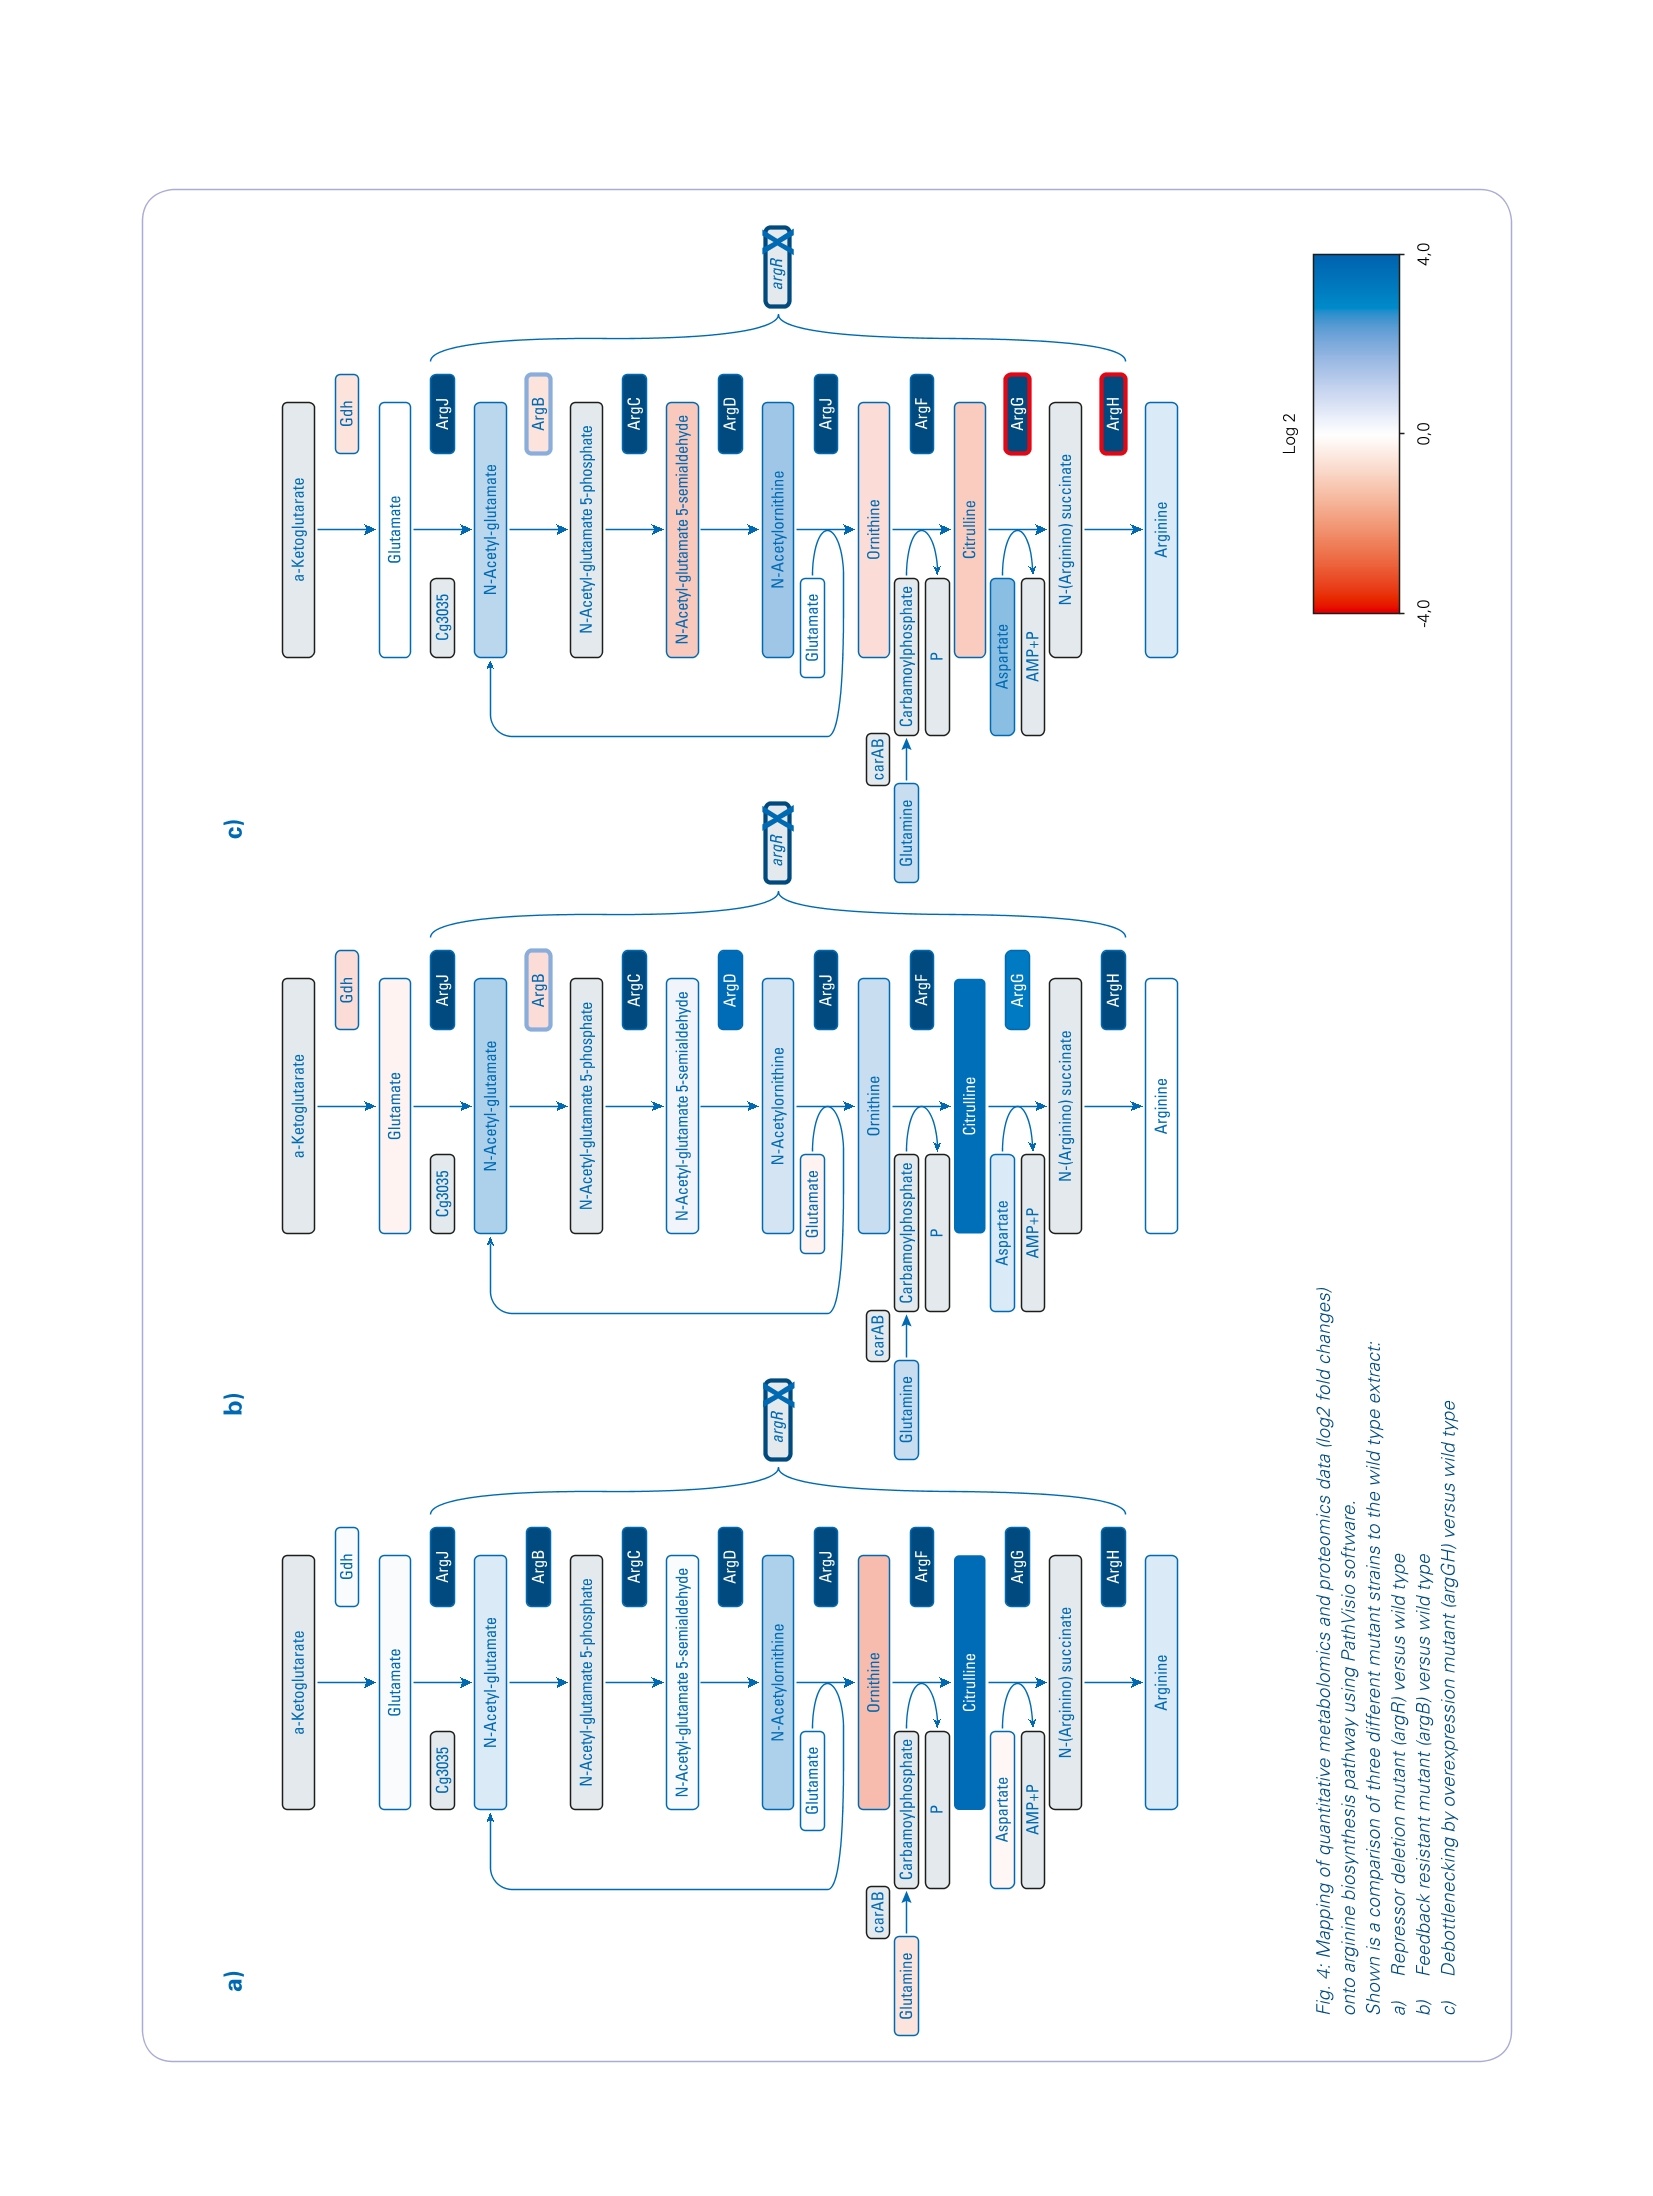
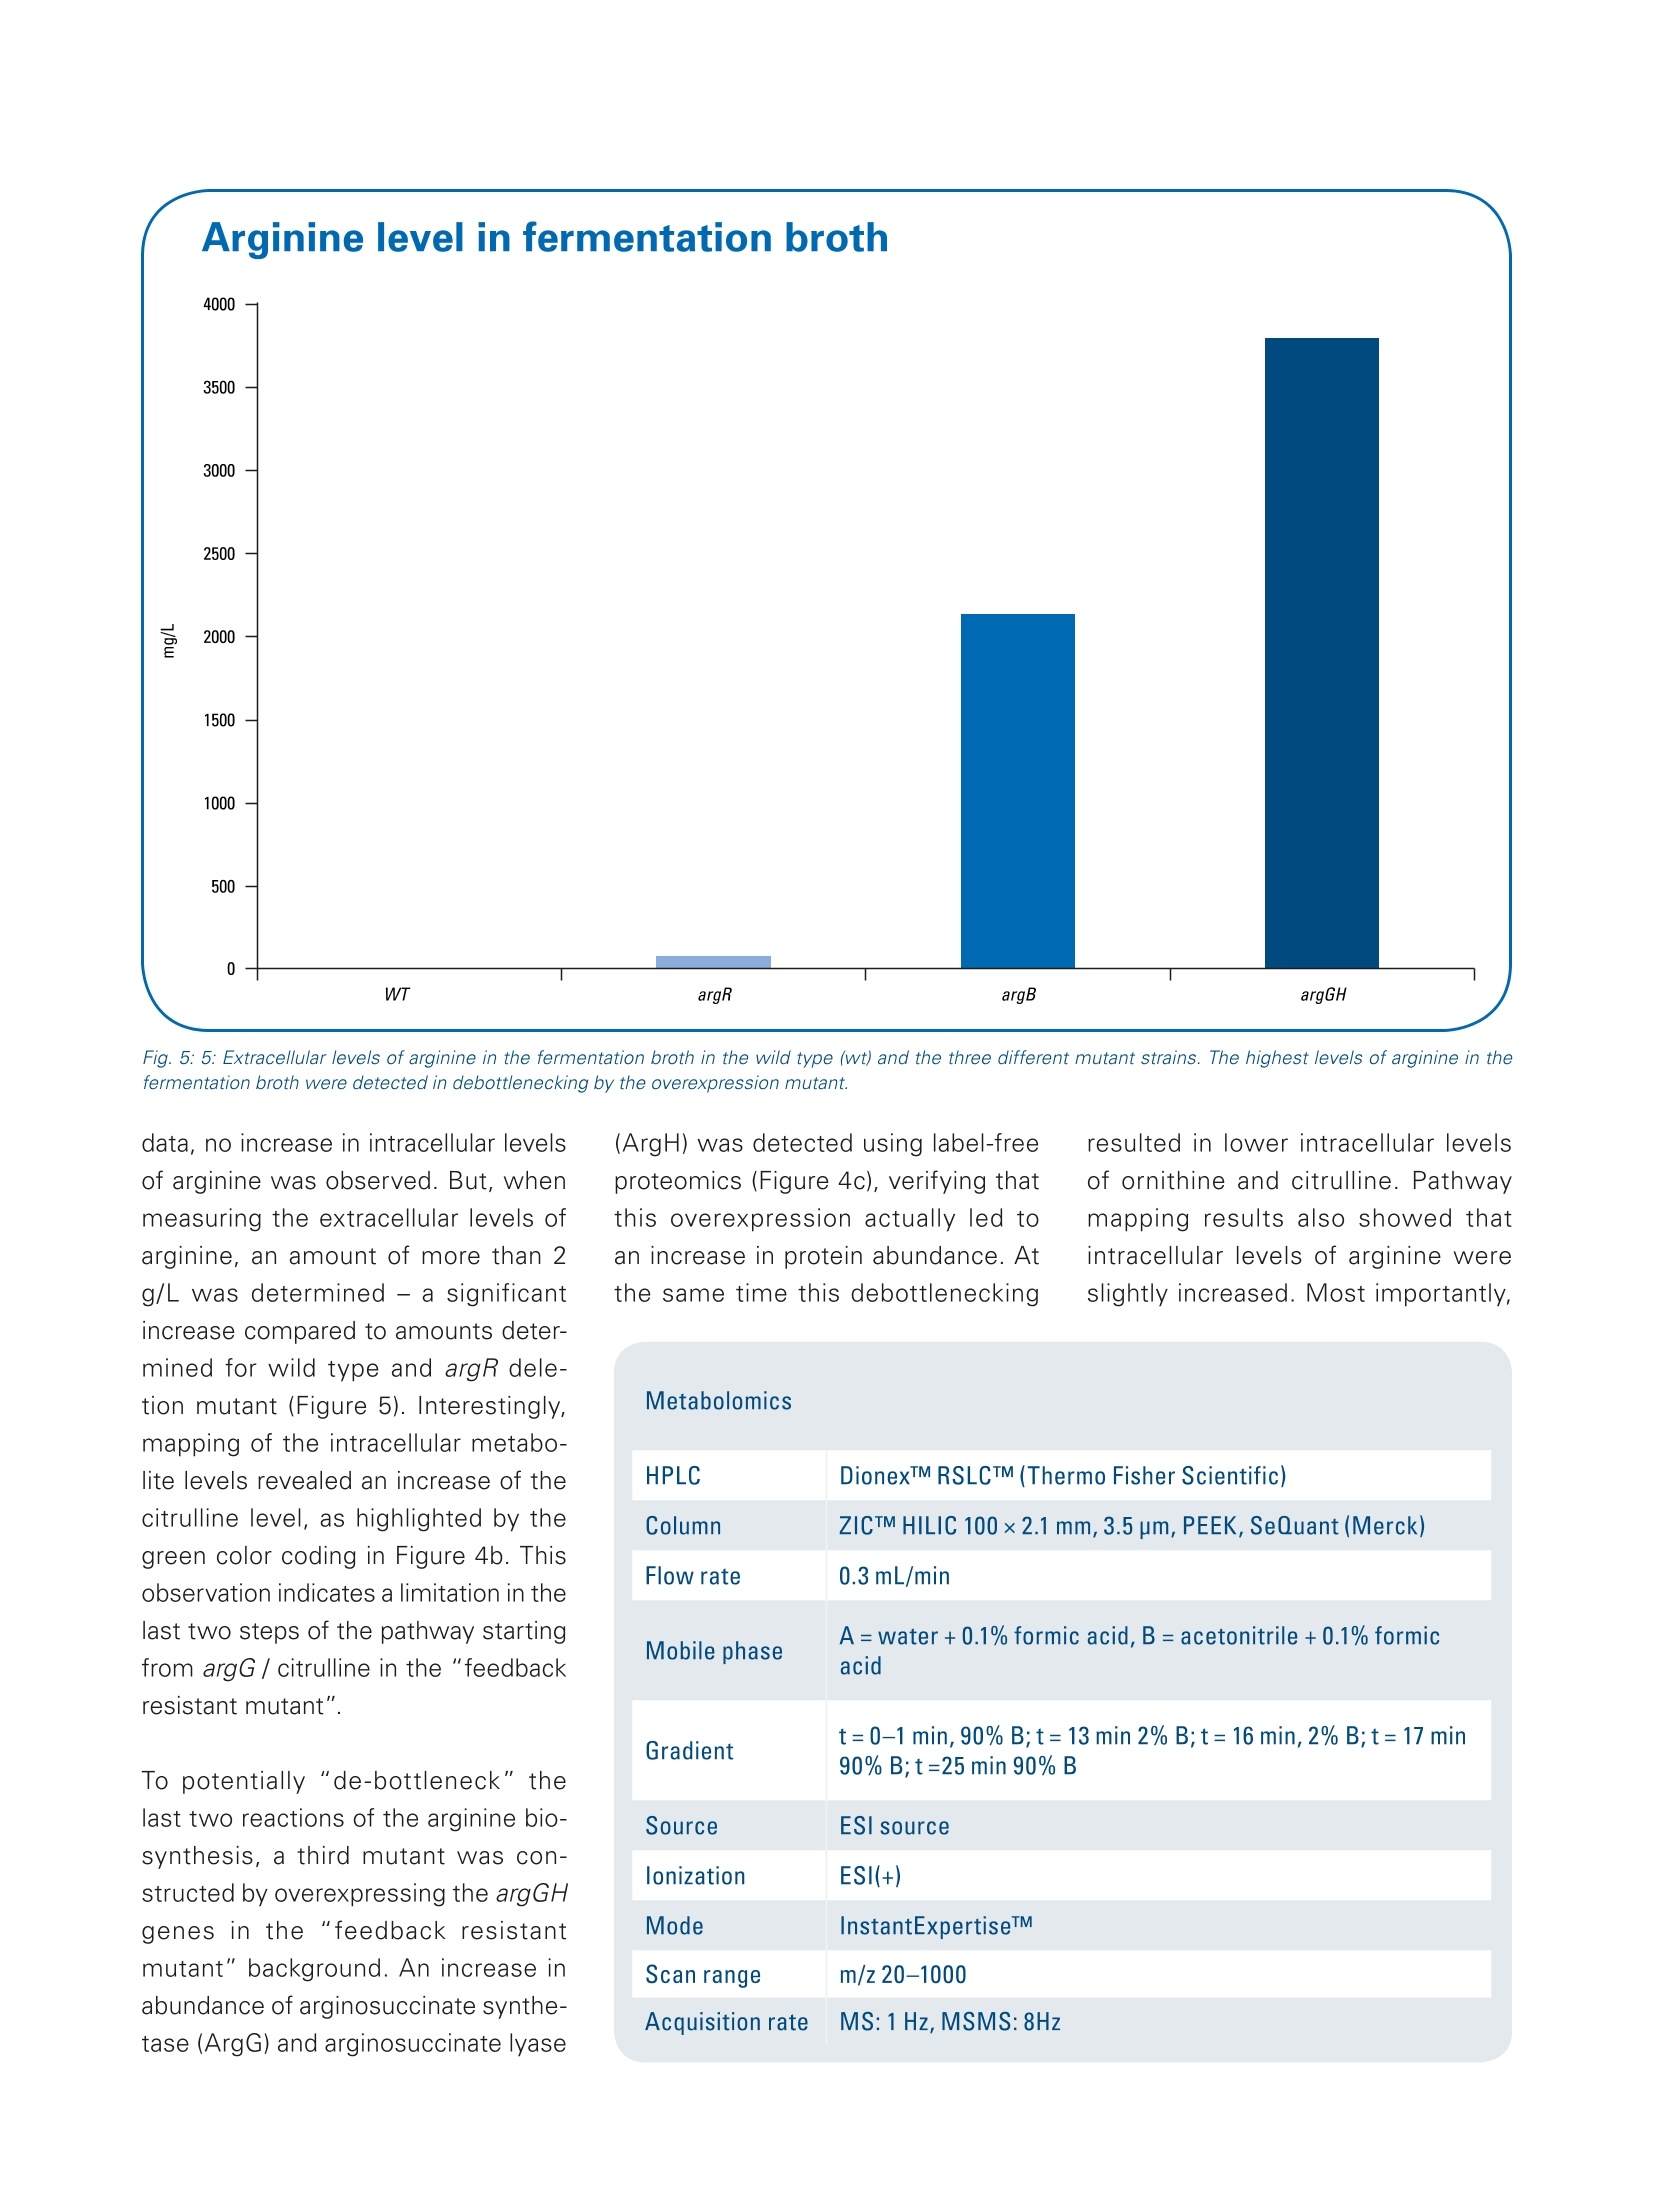
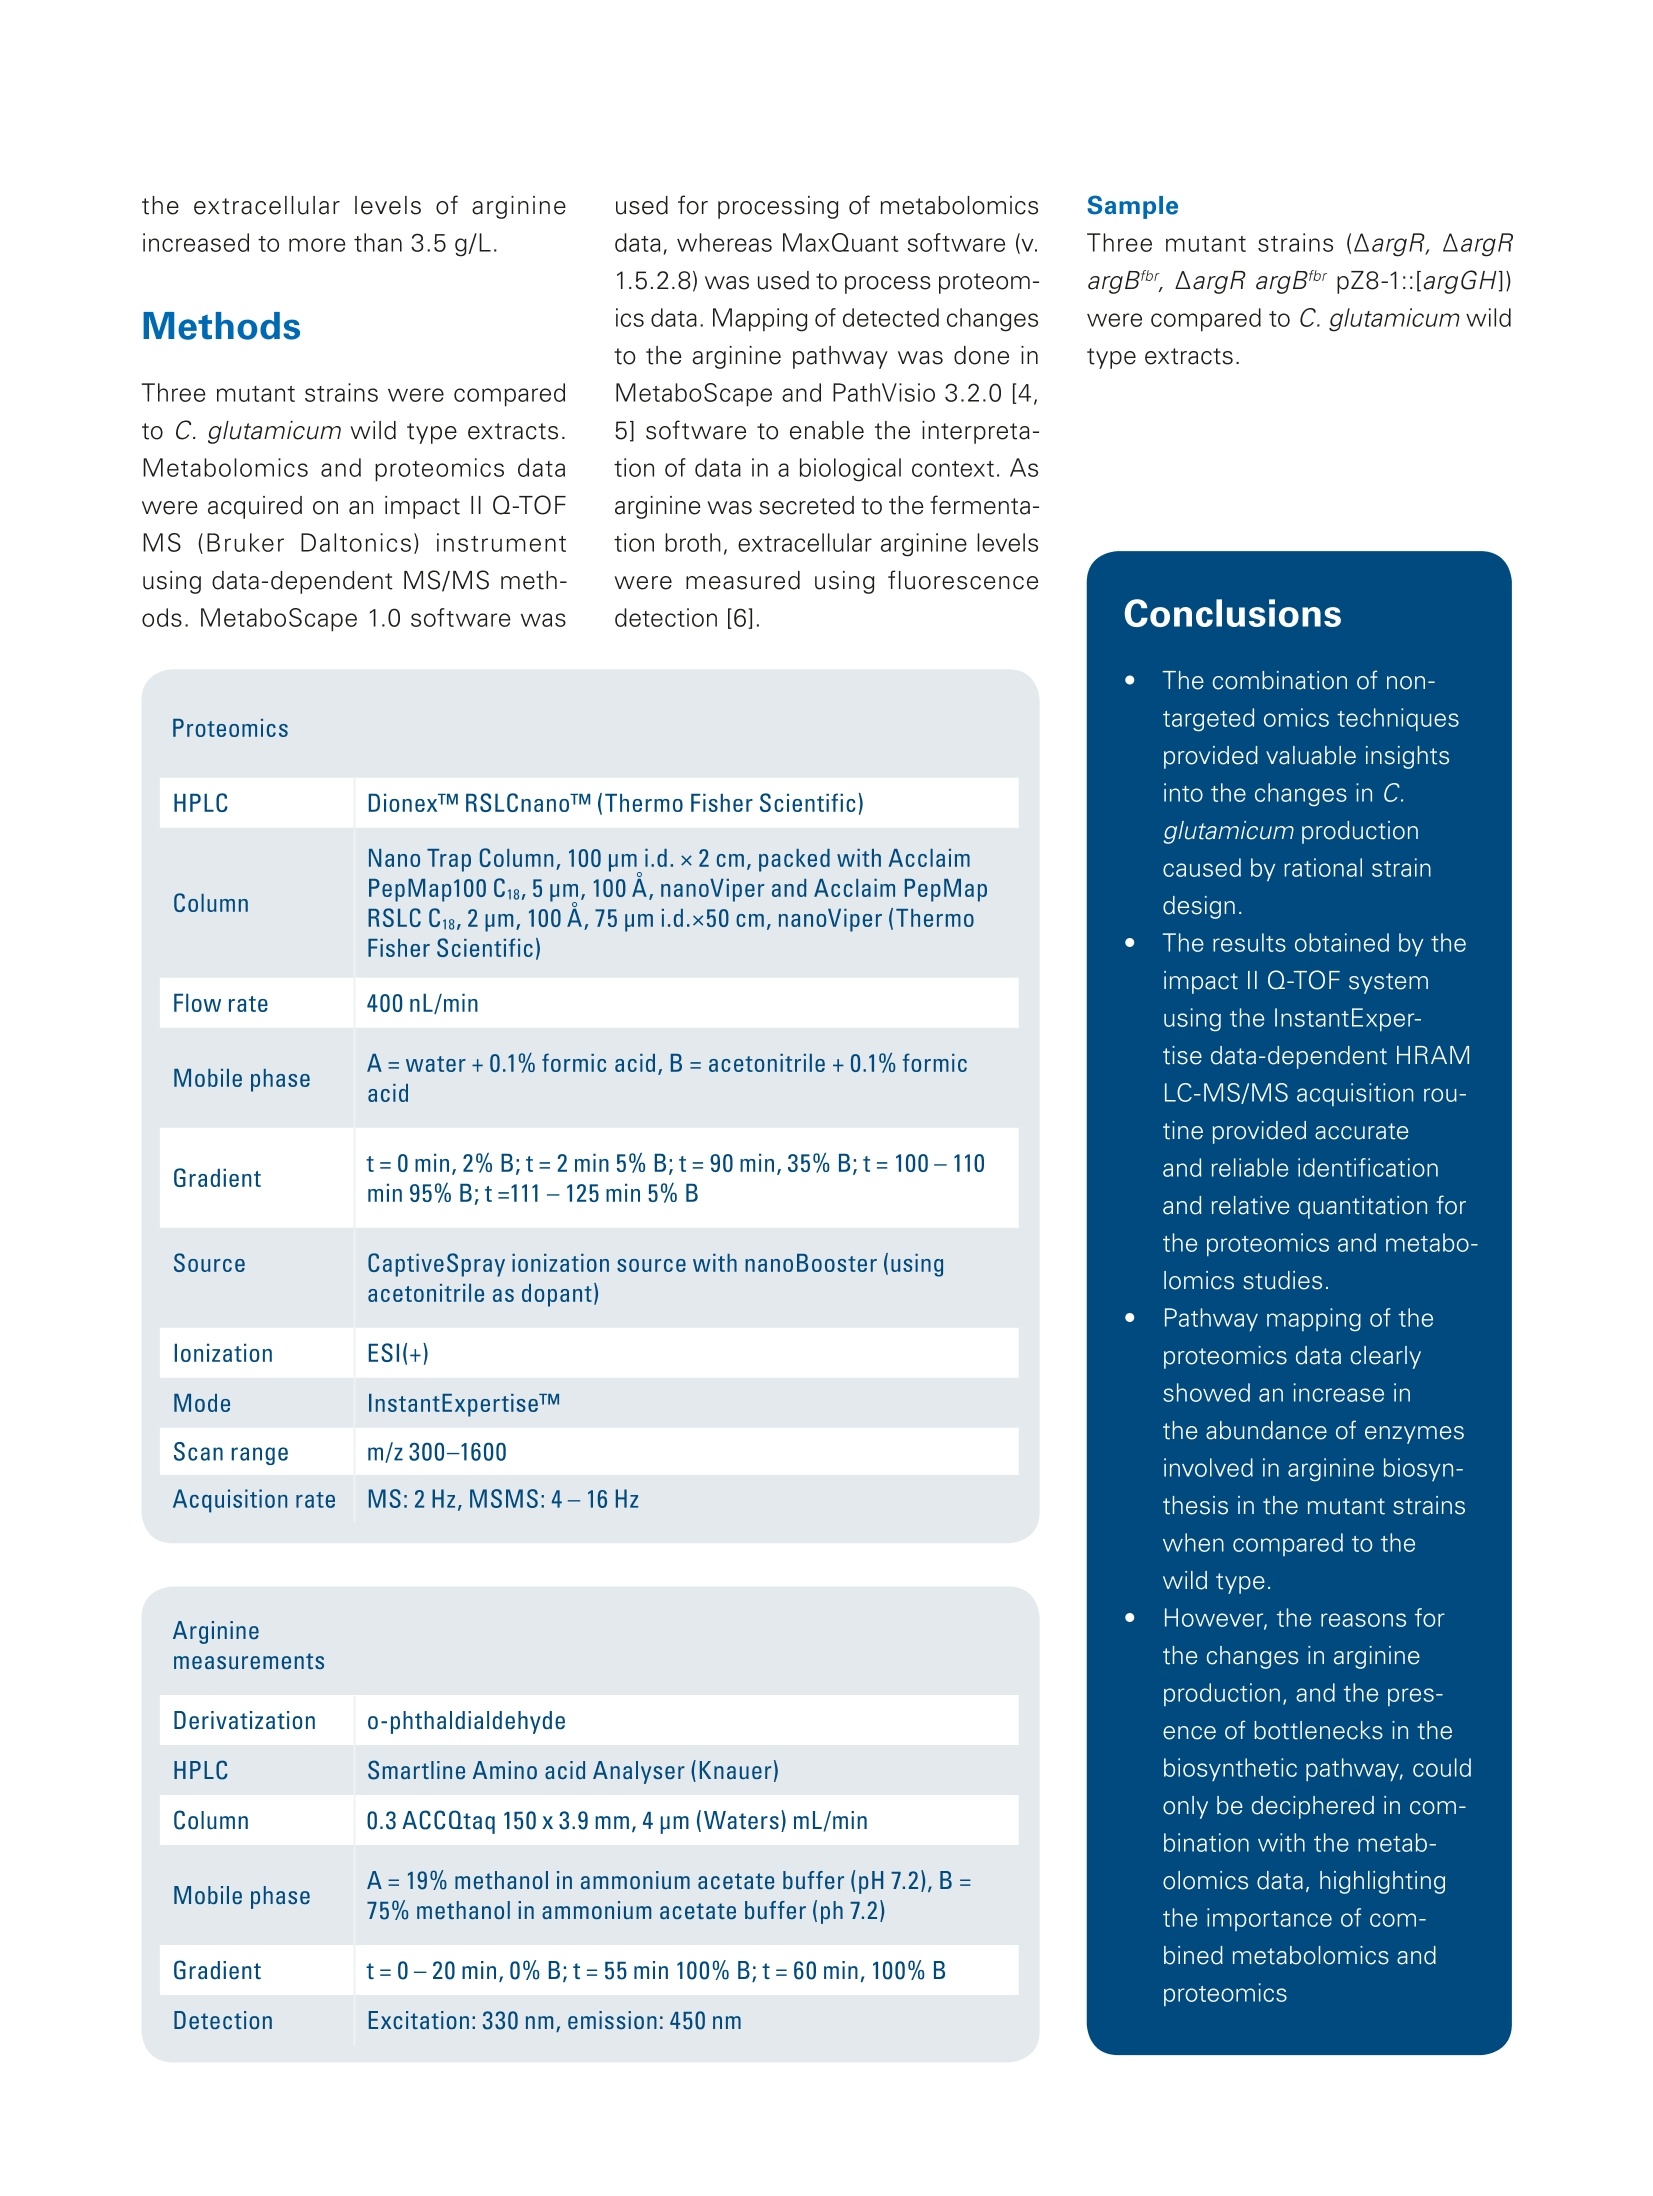
Omics studies elucidate an increasein bio-production efficiency High performance proteomics and metabolomics studiesusing the impact II Q-TOF provide insight into how rationalstrain design increased bio-production efficiency. This application note describesa combination of metabolomicand proteomic studies that pro-vided an understanding into howthe efficiency of arginine produc-tion by C. glutamicum, a gramnegative bacterium used for thebiotechnological production of pri-mary metabolites, was improvedby rational strain design. The results obtained by the Brukerimpact ll Q-TOF system using theInstantExpertiseTM data-depen-dent HRAM LC-MS/MS acquisi-tion routine provided accurate andreliable identification and relativequantitation for the proteomicsand metabolomics studies. Path-way mapping of the proteomicsdata clearly showed an increase in the abundance of enzymesinvolved in arginine biosynthesisin the mutant strains when com-pared to the wild type. The pres-ence of bottlenecks could only bedeciphered in combination withthe metabolomics data, highlight-ing the importance of combinedmetabolomics and proteomics.studies. Keywordsimpact//Pathway mappingMulti-OmicsProteomicsMetabolomicsMetaboScapeInstantExpertiselM ( Authors: F r ederik Walter , Marcus Persicke, Jorn Kalinowski ) Introduction Because many of today's nutritionaland consumer products are producedby biotechnology, there is growinginterest in the development of newtechniques that improve productionefficiency. Rational strain design isone approach researchers considerwhen they want to improve the yieldof amino acids such as arginine, animportant amino acid widely used bythe cosmetic, food and pharmaceuti-cal industries. This application note describes apowerful technique for increasing theefficiency of arginine production by C.glutamicum, a gram negative bacte-rium used for the biotechnological pro-duction of primary metabolites, usingrational strain design and a combina-tion of metabolomic and proteomicstudies. Because the Bruker impact II Q-TOFsystem is well suited to bottom-upproteomic and metabolomic work-flows, it was used to acquire themetabolomics and proteomics data.A connection between mass spec-trometric data and biology was estab-lished by mapping the results of bothmetabolic and proteomic changesonto the biochemical pathways. Theresults of this study provide a deeperunderstanding of how rational straindesign can be used to increase theefficiency of arginine production. Theworkflows described can also beextended to the study of other bio-technological production systems. Results A combination of metabolomics andproteomics studies was used to deci-pher the changes in arginine productioncaused by the introduction of rationalstrain design in C. glutamicum. Three different mutant strains were exam-ined, all of which had an influence onthe arginine biosynthesis pathway (seeFigure 1). Data was acquired on the Brukerimpact lI Q-TOF system utilizing "oneshot data acquisition" of MS & MS/MS spectra from all precursor ionsby data dependent MS/MS applyingthe InstantExpertiseM routine (Figure2). Metabolomics data processing,including the automatic identification Fig. 1: Overview about arginine biosynthesis pathway and analyzed mutant strains. Three different mutantstrains (argR, argB, and argGH) influencing different parts of the arginine biosynthesis pathway are investi-gated to increase arginine production. ( G e n e s a r e r eg ul ated b y the repres s o r a r gR, wh ic h i s a c ti v ate d b y a rginine ) ( R epre ss or deleti o n mutant (argR): chro mo s omal dele t i o n o f a rg R . ) ( F eedback r esistant mutant (argB): ch rom o so m al deleti o n o f a rg R a n d int r od u cti o n of feed b ack - re s is tant argBf or a l l e l s . T h e N- a cety / g l utamat e ki n a se , w hi c h is e ncode d b y a r gB t i s f e ed bac k r e g u l a te d by a rgin in e and thu s a ls o l i m i t s a r gi ni n e p r oduction . Pr e vi o us s t u dies sh o wed t h at b e si d esar g i ni ne , t h ese s tra ins a c cu m ulat e d s i g nifi c a n t am o u nt s o f citr ul line a s a by- p rodu c t , i nd i c at in g a bo t tl e ne c k in t he pa t h w ay. ) of known targets, statistical analyses,and pathway mapping of metabolitefold changes, was conducted usingBruker's MetaboScape software.This workflow-based, client-serversoftware automatically identifiedseveral known compounds in thearginine biosynthetic pathway withconfidence based on user-definablelevels for mass accuracy, isotopicfidelity, and retention time. The corre-sponding results were displayed as an"annotation quality". A more detailed description of this non-targeted HighResolution Accurate Mass (HRAM)LC-QTOF based metabolomics work-flow can be found in Bruker PosterNote (PN-26[1]). Statistical analysis of the metabo-lomics data revealed a clear separa-tion of C. glutamicum wild type (WT)extracts from all three mutant strainsvia 3D PCA score plots (Figure 3a).The "feedback resistant" (argB) andthe "debottlenecking by overex-pression" (argGH) mutant extractsoverlapped in the PCA scores plot.Proteomics data was processed usingMaxQuant software [2]. Subsequentstatistical data evaluation using Per-seus software [3] showed separationof the wild type extract from all threemutant strains in 3D PCA scores plot(Figure 3b); which confirmed the sepa-ration already detected in the metabo-lomics study. The metabolomics datashowed an overlap of the "feedbackresistant"and the"debottleneckingby overexpression" mutant extracts,but in the proteomics results all fourof the different bacterial strains wereseparated. The proteomics study revealed sig-nificant changes of proteins involvedin the arginine biosynthesis pathwayin the"repressor deletion mutant".In all mutants, gene deletion of argRshould be present resulting in theabsence of the corresponding protein.As expected, the data showed that theprotein could be clearly identified in thewild type with eight peptides. Two pep-tides in the mutant lines (ELGELLSGR,AA 161-169 and SLGSTPSTPENLN-PVTR, AA 2 -18) were also identified.This finding agrees at the proteomelevel as well since only a partial dele-tion was genetically engineered in theargR gene, resulting in the mutantstrain still producing amino acids 1 to38 and 154 to 171. Fig. 2: Workflow to investigate the increase in arginine production by rational strain design. Four samples(wild type and three mutant strains) were analyzed using proteomics and metabolomics applications on theimpact // Q-TOF instrument. Data was processed using MaxQuant and Perseus (for proteomics studies)or MetaboScape (for metabolomics studies) software then it was mapped onto the biological pathways tovisualize the results of the introduced changes. Mapping the alterations detected in themetabolomics and proteomics studiesonto biochemical pathways allowed thequick formulation of a hypothesis forthe observed changes in the biological context. Since the goal was to increasearginine production (Figure 4), the focuswas primarily on the arginine biosyn-thesis pathway even though changeswere observed for other pathways The mapping of log2 fold changeswas accomplished using custom path-way maps created in PathVisio soft-ware.1The genes for biosynthesis ofarginine are organized in an operonstructure (argCJBDFRGH) and regu-lated by the repressor ArgR, whichis activated by arginine, in the wildtype. A comparison of the repressordeletion mutant with the wild type(Figure 4 a) using label-free quantita-tive proteomics clearly showed a sig-nificant increase in the abundance ofthe enzymes involved in the argininebiosynthetic pathway, with log2 foldchanges greater than 3. Even thoughthe increase in the abundance of theseenzymes might be expected to inducea significant increase in arginine pro-duction, metabolomics data revealedthat the depression of arginine biosyn-thesis inhibitors alone did not increaseintracellular arginine. As arginine was secreted into the fer-mentation broth, the levels of extracel-lular arginine levels were expected toincrease. Arginine level in the fermen-tation broth was also analyzed (Figure5). The extracellular levels of argininewere not detectable in the WT andremained low with levels of 38 mg/L inthe repressor deletion mutant (argR). It is known that N-acetylglutamatekinase, which is encoded by argB, isfeedback regulated by arginine. Asthis regulation can limit arginine pro-duction, a second mutant containingthe chromosomal deletion of argRandan introduction of a feedback-resistantargB allele was created and analyzed(argB). Interestingly, introduction ofthe feedback resistance results inreduced abundance of N-acetylglu-tamate kinase, encoded by the argBgene, in the mutant line compared tothe wild type. When comparing thisfeedback resistant mutant to wildtype (Figure 4 b) for the metabolomics Fig. 4: Mapping of quantitative metabolomics and proteomics data (log2 fold changes) onto arginine biosynthesis pathway using PathVisio software. Shown is a comparison of three different mutant strains to the wild type extract: Repressor deletion mutant (argR) versus wild typed Feedback resistant mutant (argB) versus wild type -4,0 Debottlenecking by overexpression mutant (argGH) versus wild type Fig. 5: 5: Extracellular levels of arginine in the fermentation broth in the wild type (wt) and the three different mutant strains. The highest levels of arginine in thefermentation broth were detected in debottlenecking by the overexpression mutant. data, no increase in intracellular levelsof arginine was observed. But, whenmeasuring the extracellular levels ofarginine, an amount of more than 2g/L was determined - a significantincrease compared to amounts deter-mined for wild type and argR dele-tion mutant (Figure 5). Interestingly,mapping of the intracellular metabo-lite levels revealed an increase of thecitrulline level, as highlighted by thegreen color coding in Figure 4b. Thisobservation indicates a limitation in thelast two steps of the pathway startingfrom argG / citrulline in the "feedbackresistant mutant". To potentially "de-bottleneck" thelast two reactions of the arginine bio-synthesis, a third mutant was con-structed by overexpressing the argGHgenes in the "feedback resistantmutant" background. An increase inabundance of arginosuccinate synthe-tase (ArgG) and arginosuccinate lyase resulted in lower intracellular levelsof ornithine and citrulline. Pathwaymapping results also showed thatintracellular levels of arginine wereslightly increased. Most importantly, HPLC DionexTM RSLCTM (Thermo Fisher Scientific) Column ZICTM HILIC 100×2.1 mm,3.5 um, PEEK,SeQuant(Merck) Flow rate 0.3 mL/min Mobile phase A=water+0.1% formic acid,B=acetonitrile +0.1% formic acid Gradient t=0-1 min, 90% B;t=13min 2% B;t=16 min,2% B;t=17 min90% B;t=25 min 90%B Source ESI source lonization ESI(+) Mode InstantExpertiseTM Scan range m/z 20-1000 Acquisition rate MS:1 Hz,MSMS:8Hz the extracellular levels of arginineincreased to more than 3.5 g/L. Methods Three mutant strains were comparedto C. glutamicum wild type extracts.Metabolomics and proteomics datawere acquired on an impact II Q-TOFMS (Bruker Daltonics) instrumentusing data-dependent MS/MS meth-ods. MetaboScape 1.0 software was used for processing of metabolomicsdata, whereas MaxQuant software (v.1.5.2.8) was used to process proteom-ics data. Mapping of detected changesto the arginine pathway was done inMetaboScape and PathVisio 3.2.0 [4,5] software to enable the interpreta-tion of data in a biological context. Asarginine was secreted to the fermenta-tion broth, extracellular arginine levelswere measured using fluorescencedetection [6]. HPLC DionexTM RSLCnanoTM (Thermo Fisher Scientific) Column RSLC C18, 2 pm, 100 A, 75 um i.d;).x50 cm, nanoViper (ThermoFisher Scientific) Flow rate 400 nL/min Mobile phase A=water +0.1% formic acid, B=acetonitrile+0.1% formicacid Gradient t=0 min, 2% B;t=2 min 5%B;t=90 min,35% B;t=100-110min 95% B;t=111-125 min 5% B Source CaptiveSpray ionization source with nanoBooster (usingacetonitrile as dopant) lonization ESI(+) Mode InstantExpertiseTM Scan range m/z 300-1600 Acquisition rate Arginine Derivatization o-phthaldialdehyde HPLC Smartline Amino acid Analyser (Knauer) Column 0.3 ACCQtaq 150x3.9 mm,4 um (Waters)mL/min Mobile phase A=19% methanol in ammonium acetate buffer (pH 7.2), B=75% methanol in ammonium acetate buffer (ph 7.2) Gradient t=0-20 min, 0% B;t=55 min 100% B;t=60 min, 100% B Detection Excitation: 330 nm, emission: 450 nm Three mutant strains (AargR, ▲argRargBtbr, ▲argR argBir pZ8-1::[argGH])were compared to C. glutamicum wildtype extracts. Sample Conclusions The combination of non-targeted omics techniquesprovided valuable insightsinto the changes in C.glutamicum productioncaused by rational straindesign. The results obtained by theimpact lI Q-TOF systemusing the InstantExper-tise data-dependent HRAMLC-MS/MS acquisition rou-tine provided accurateand reliable identificationand relative quantitation forthe proteomics and metabo-lomics studies. Pathway mapping of theproteomics data clearlyshowed an increase inthe abundance of enzymesinvolved in arginine biosyn-thesis in the mutant strainswhen compared to thewild type. However, the reasons for the changes in arginineproduction, and the pres-ence of bottlenecks in thebiosynthetic pathway, couldonly be deciphered in com-bination with the metab-olomics data, highlightingthe importance of com-bined metabolomics andproteomics Learn More You are looking for further information? Check out the link or scanthe QR Code for our latest Webinar. www.bruker.com/webinar-metabolomics-1116 References Kelder T, Nunes N, Pico AR, and Evelo, [1] PN-26: MetaboScape: LinkingHRAM QTOF Data to Biology-Increasing Arginine Production in C.glutamicum by Rational Strain Designand Discovery Metabolomics https://www.bruker.com/fileadmin/user_upload/8-PDF-Docs/Separations_MassSpectrometry/Literature/PosterNotes/PN-26_MetaboScape_Coryne_Arginine_Mutanten_eBook.pdf [2] Cox, J. and Mann, M. MaxQuantenables high peptide identificationrates, individualized p.p.b.-range mass).-ralaccuracies and proteome-wide proteinquantification. Nat Biotechnol, 2008,26, pp1367-72. [3] Tyanova S., et al., Nat Methods,2016, doi: 10.1038/nmeth.390 For research use only. Not for use in diagnostic procedures. Bruker Daltonik GmbH Bremen · GermanyBillerica, MA ·USAPhone +49 (0)421-2205-0Phone +1 (978) 663-3660 ( [ 4] P athV i sio 3: A n Ext e n dable P a t hwayAnal y sis T oolbox ) Kutmon M, van lersel MP, Bohler A, cT PLoS Computational Biology (2015) 11(2):e1004085 doi: 10.1371/journal.pcbi.1004085,pubmed: 25706687 [5] Presenting and exploring biologicalpathways with PathVisio van lersel MP, Kelder T, Pico AR, Hanspers K, Coort S, Conklin BR, andEvelo C. BMC Bioinformatics. 2008 Sep 25;9:399. doi: 10.1186/1471-2105-9-399, pubmed:18817533 [6] Walter F., et al.; J Biotechnol. 2015,doi: 10.1016 Bruker Scientific LLC 通过impact II Q-TOF 质谱进行蛋白组学和代谢组学研究,可以深入观察到合理的菌种如何设计提高了生物生产效率。基于代谢组学和蛋白组学的组学研究,可以找到精氨酸合成途径改变的理由和解决生化合成途径存在的瓶颈。
确定
还剩6页未读,是否继续阅读?

产品配置单
布鲁克·道尔顿(Bruker Daltonics)为您提供《C. glutamicum(谷氨酸)中合成途径检测方案(液质联用仪)》,该方案主要用于其他中合成途径检测,参考标准--,《C. glutamicum(谷氨酸)中合成途径检测方案(液质联用仪)》用到的仪器有布鲁克impact II四极杆飞行时间质谱仪
推荐专场
相关方案
更多