


方案详情
文
在使用标准样品进行原位微区硫同位素测定时,我们制备了一系列粉末压片和黄铜矿玻璃标准样品来纠正质量偏差。采用飞秒激光剥蚀多收集器电感耦合等离子体质谱法(fsLA-MC-ICP-MS)测定了标准样品的硫同位素组成。黄铜矿玻璃(YN411-m)是将黄铜矿在N2保护条件下于1000°C融化,然后快速淬火制成。采用fsLA-MS-ICP-MS对YN411-m进行了多次均匀性测定,外部精度为0.28‰(n = 35)。当测定黄铜矿(GC)δ34S时,使用矿物颗粒、粉末压片、黄铜矿玻璃片作为标准。结果表明,基体效应是由浓度、元素组成和晶体结构引起的。从实用性考虑,熔融玻璃比粉状压片更合适作为标准样品。我们还发现载气流量、激光通量和光斑尺寸对结果的规律性有影响。因此,我们可以不使用匹配的标准样品,通过调整激光和MC-ICP-MS的参数来获得准确的δ34S结果。此外,fsLA-MC-ICP-MS由于可以极大地提高灵敏度、空间分辨率(10 - 20μm)因此非常有利于原位微区硫同位素测定。可以通过分析较小的矿物微区,特别是成矿后期充填的硫化物矿物,来解释多成因矿床的成因
方案详情

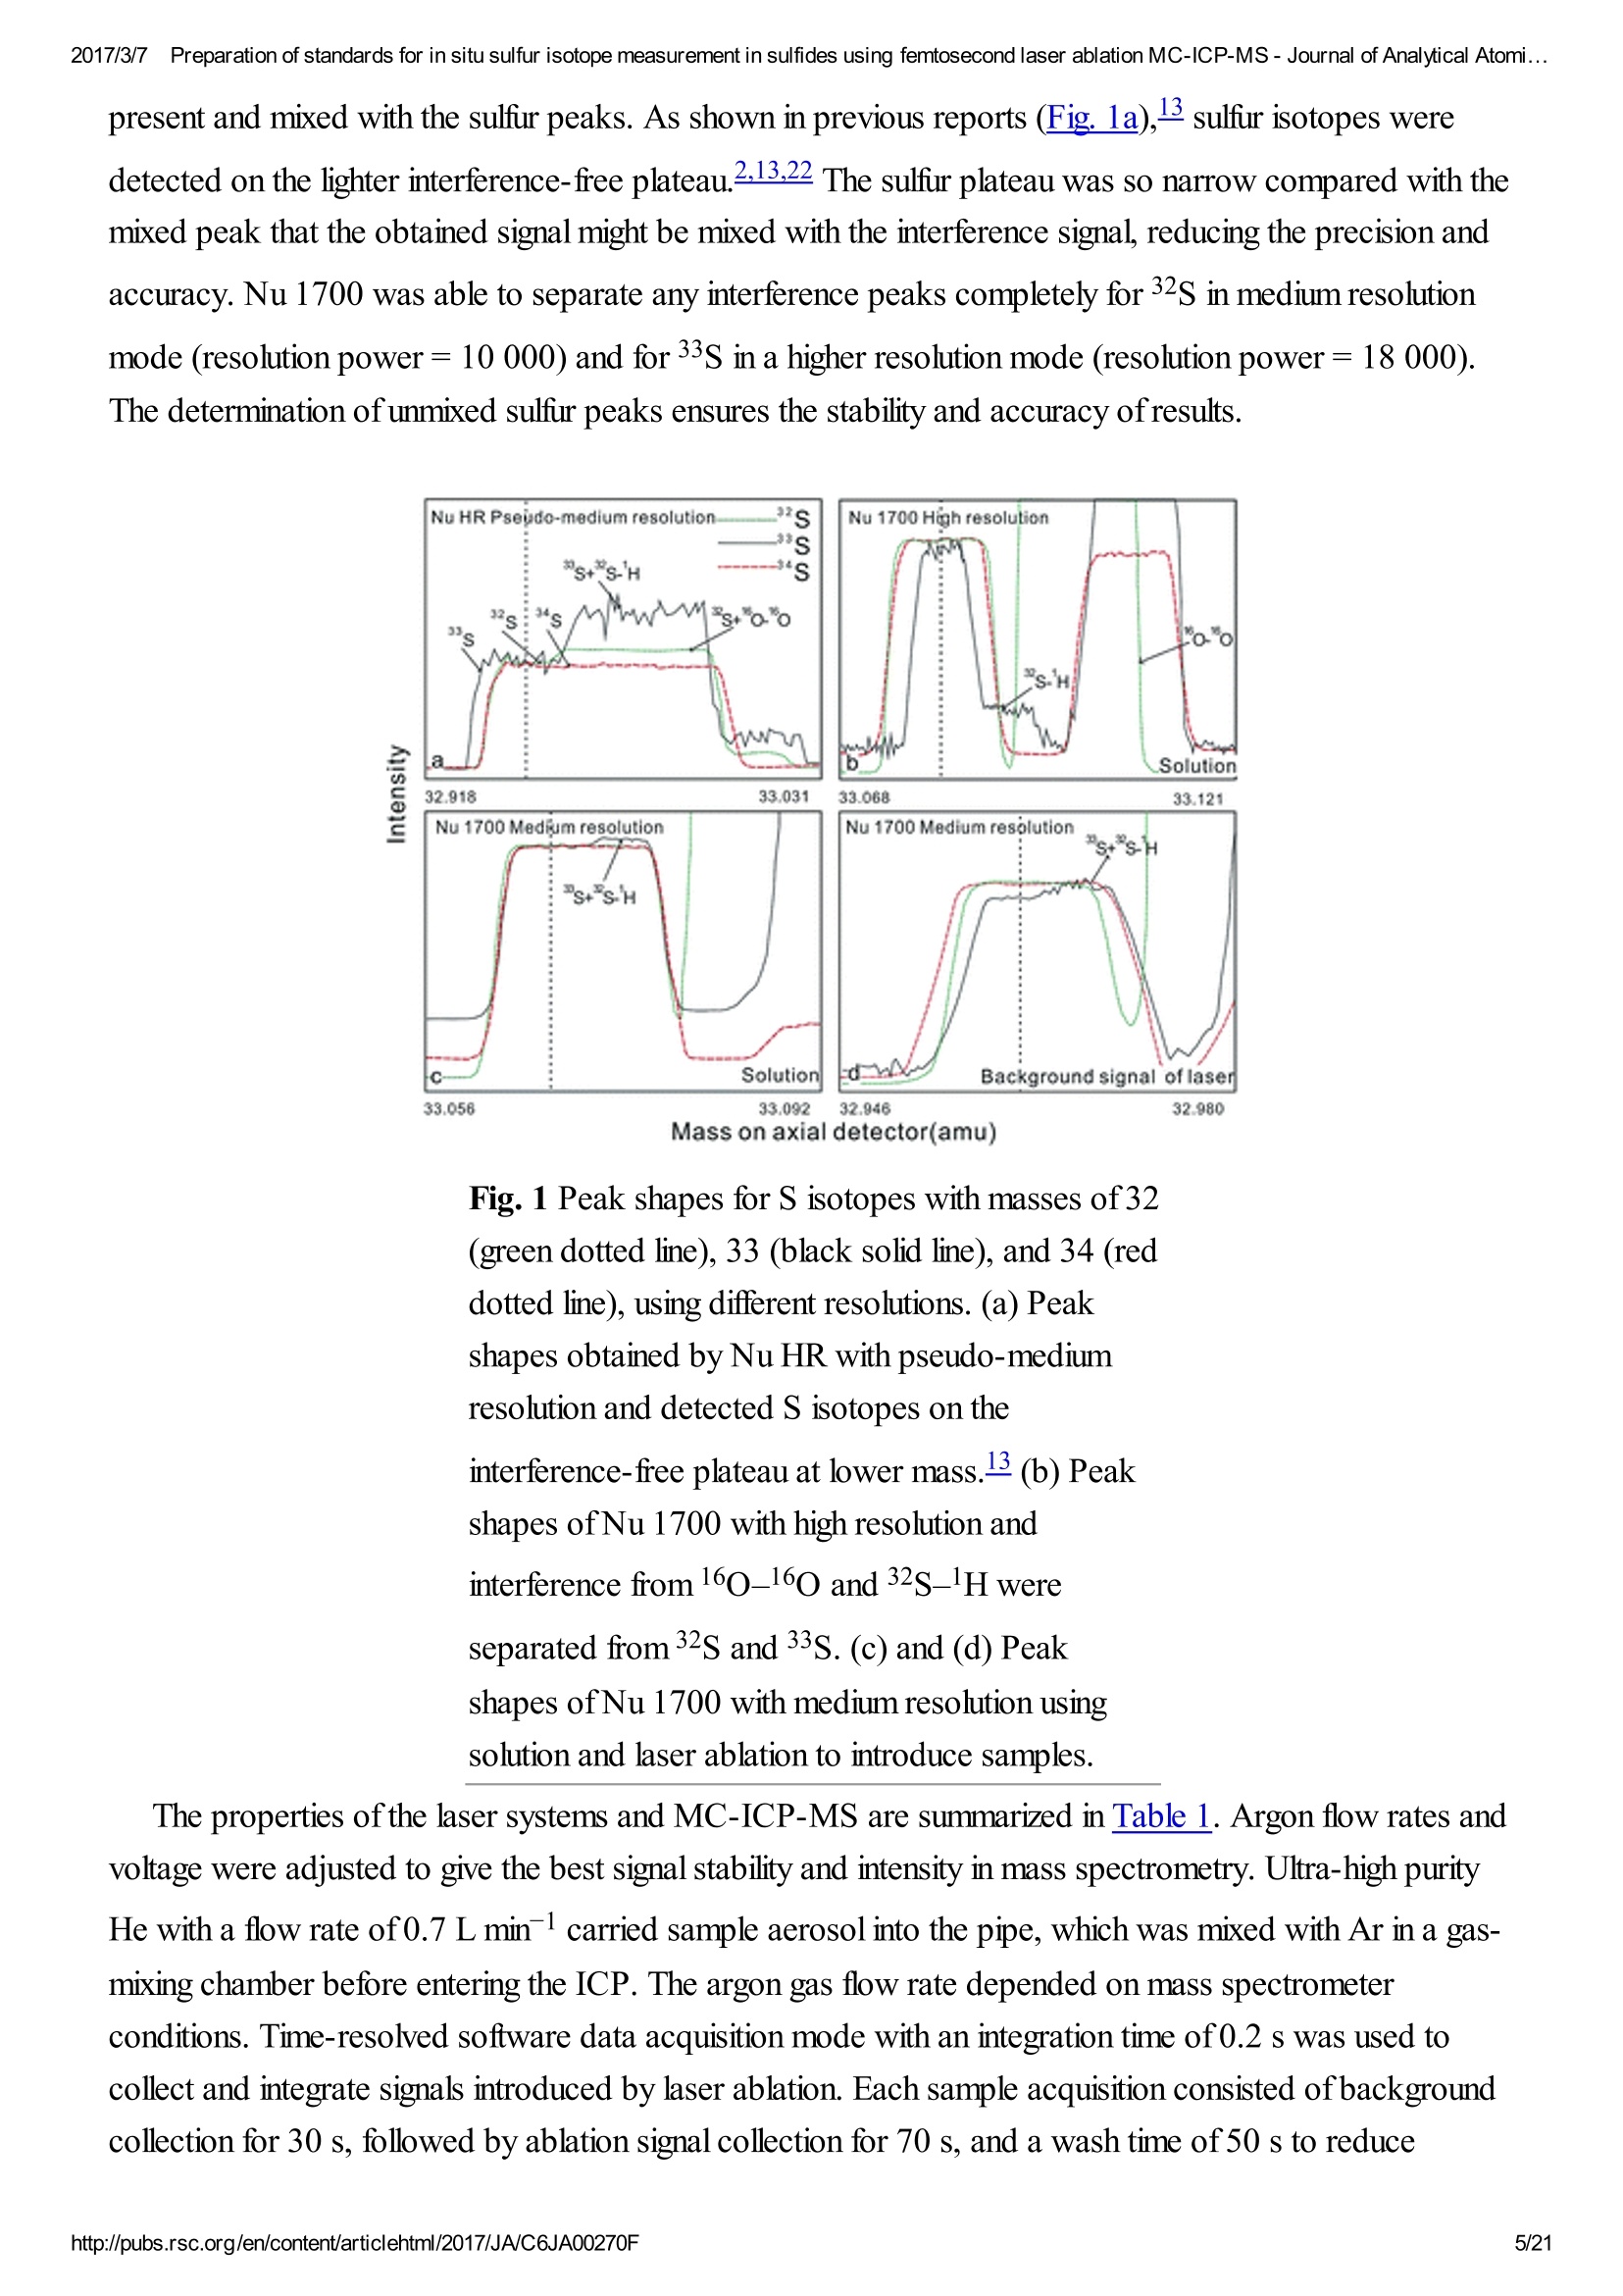
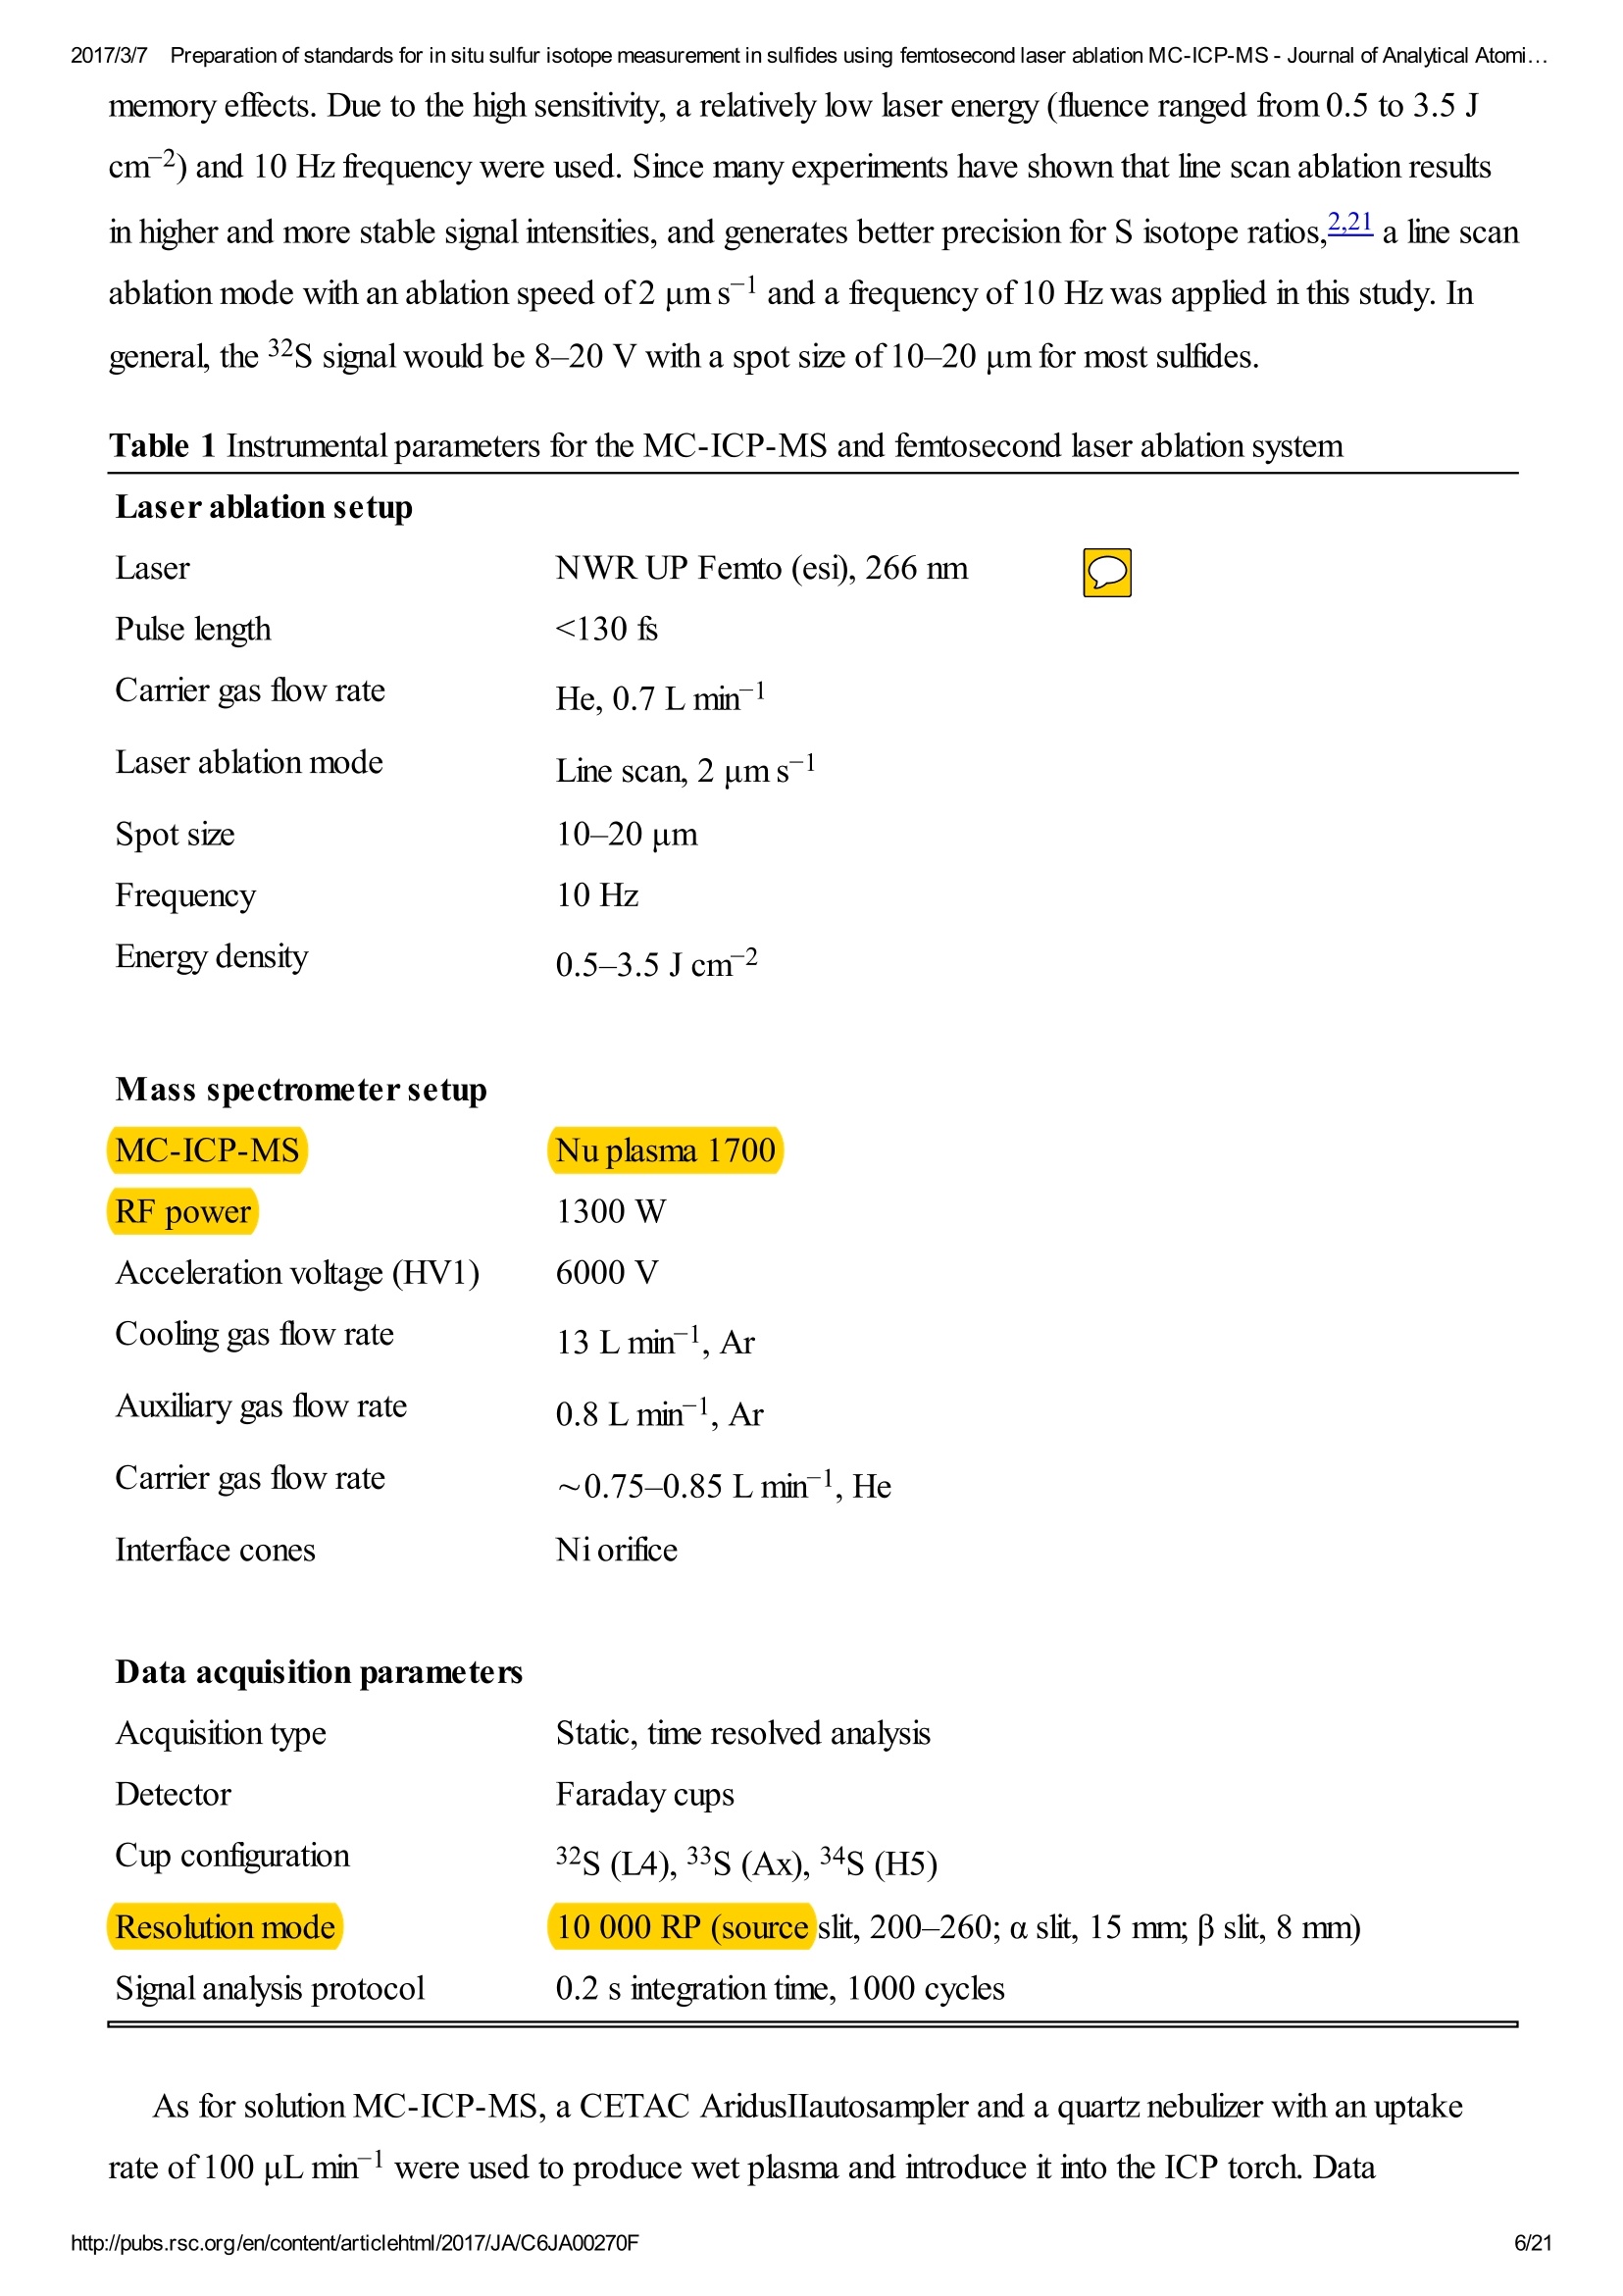
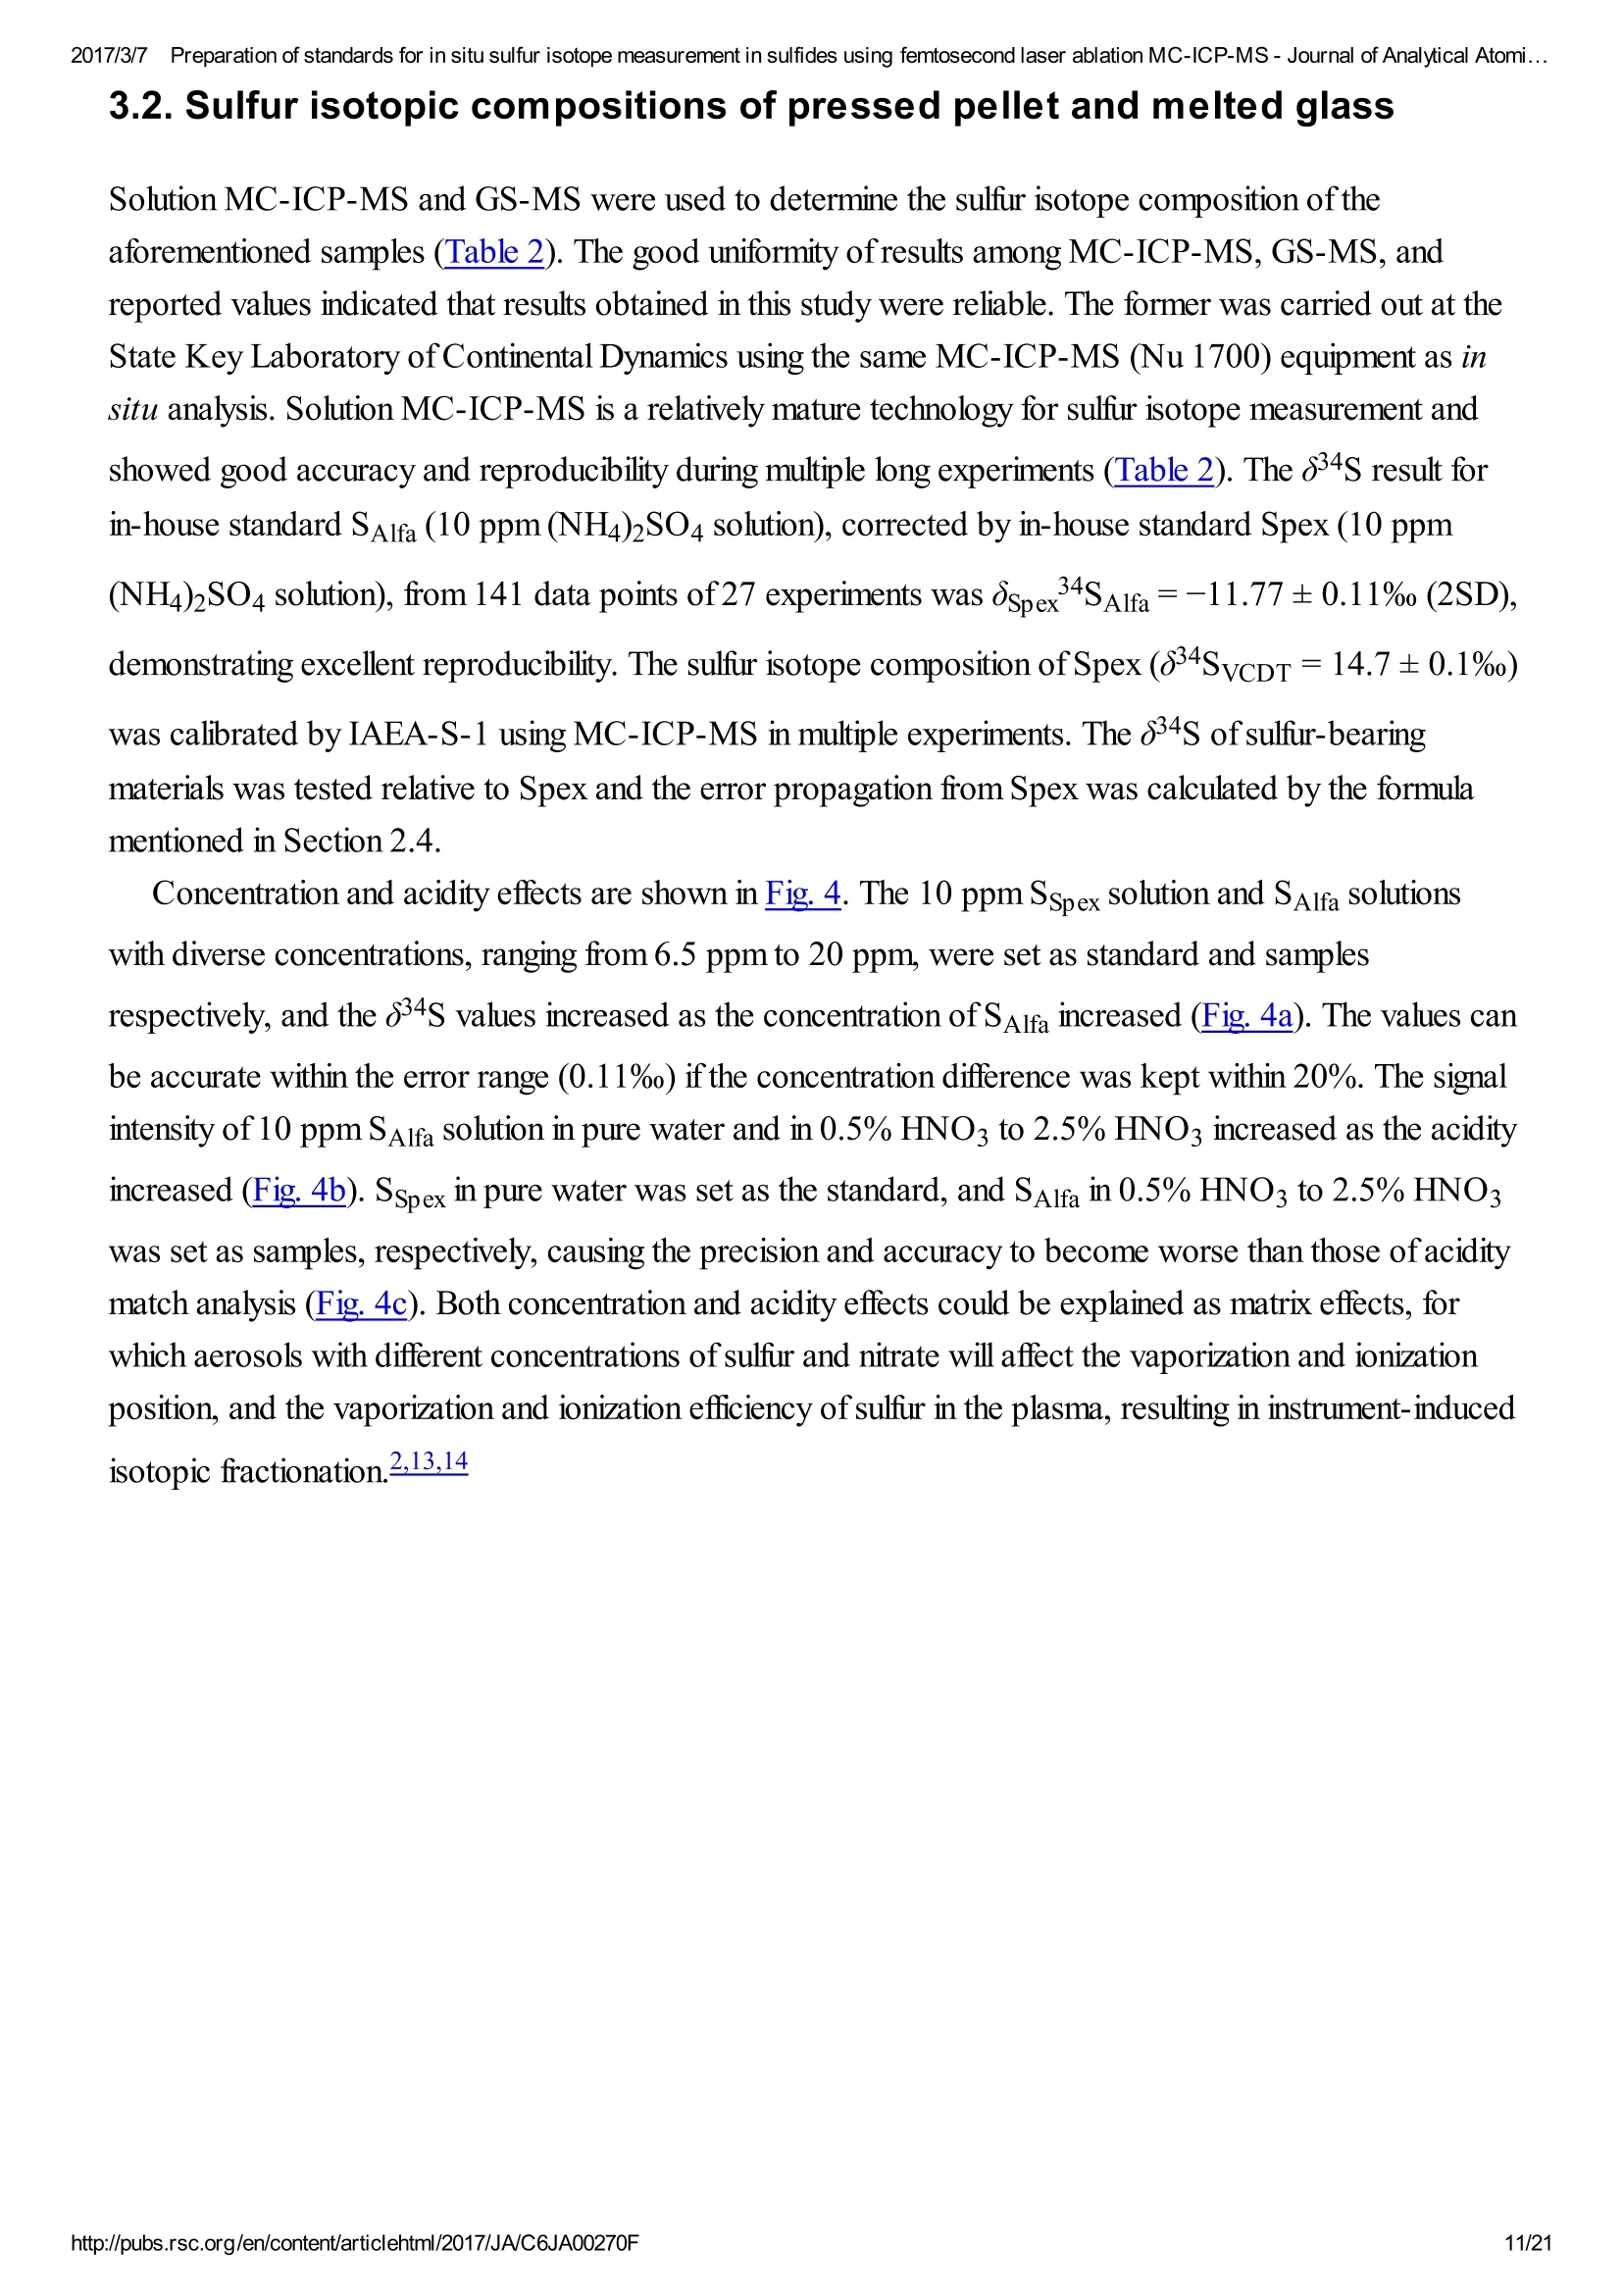
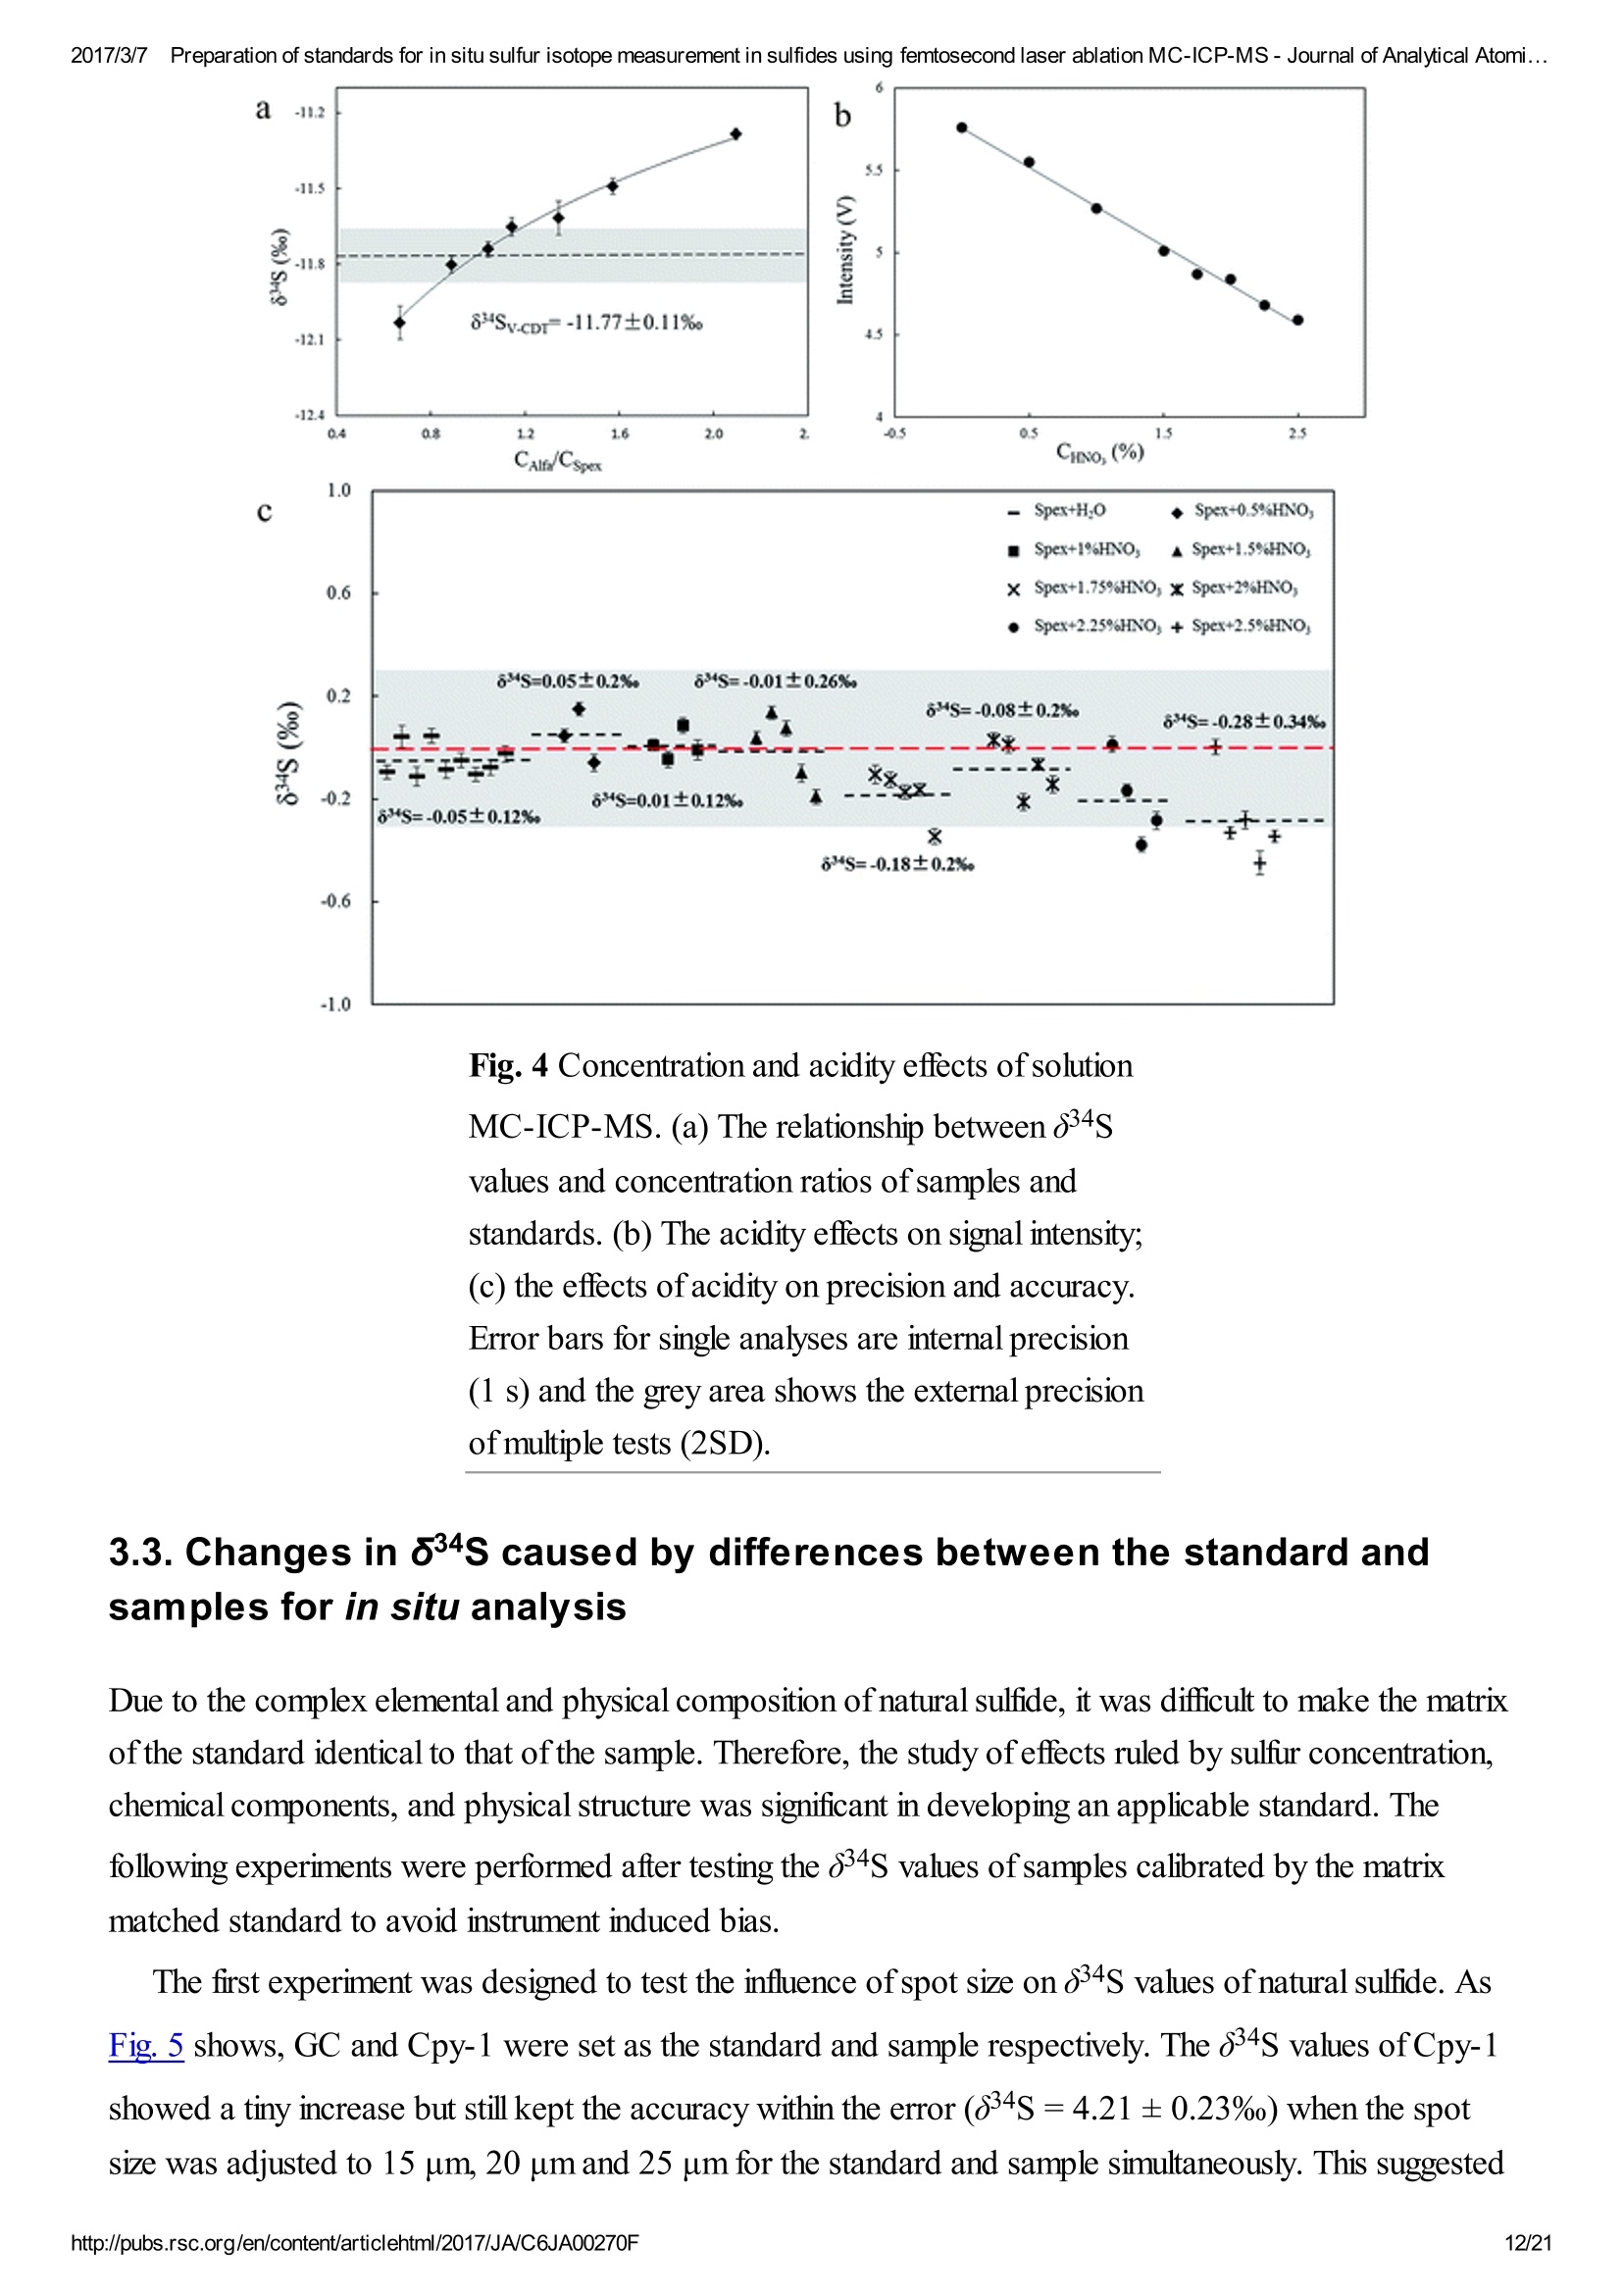
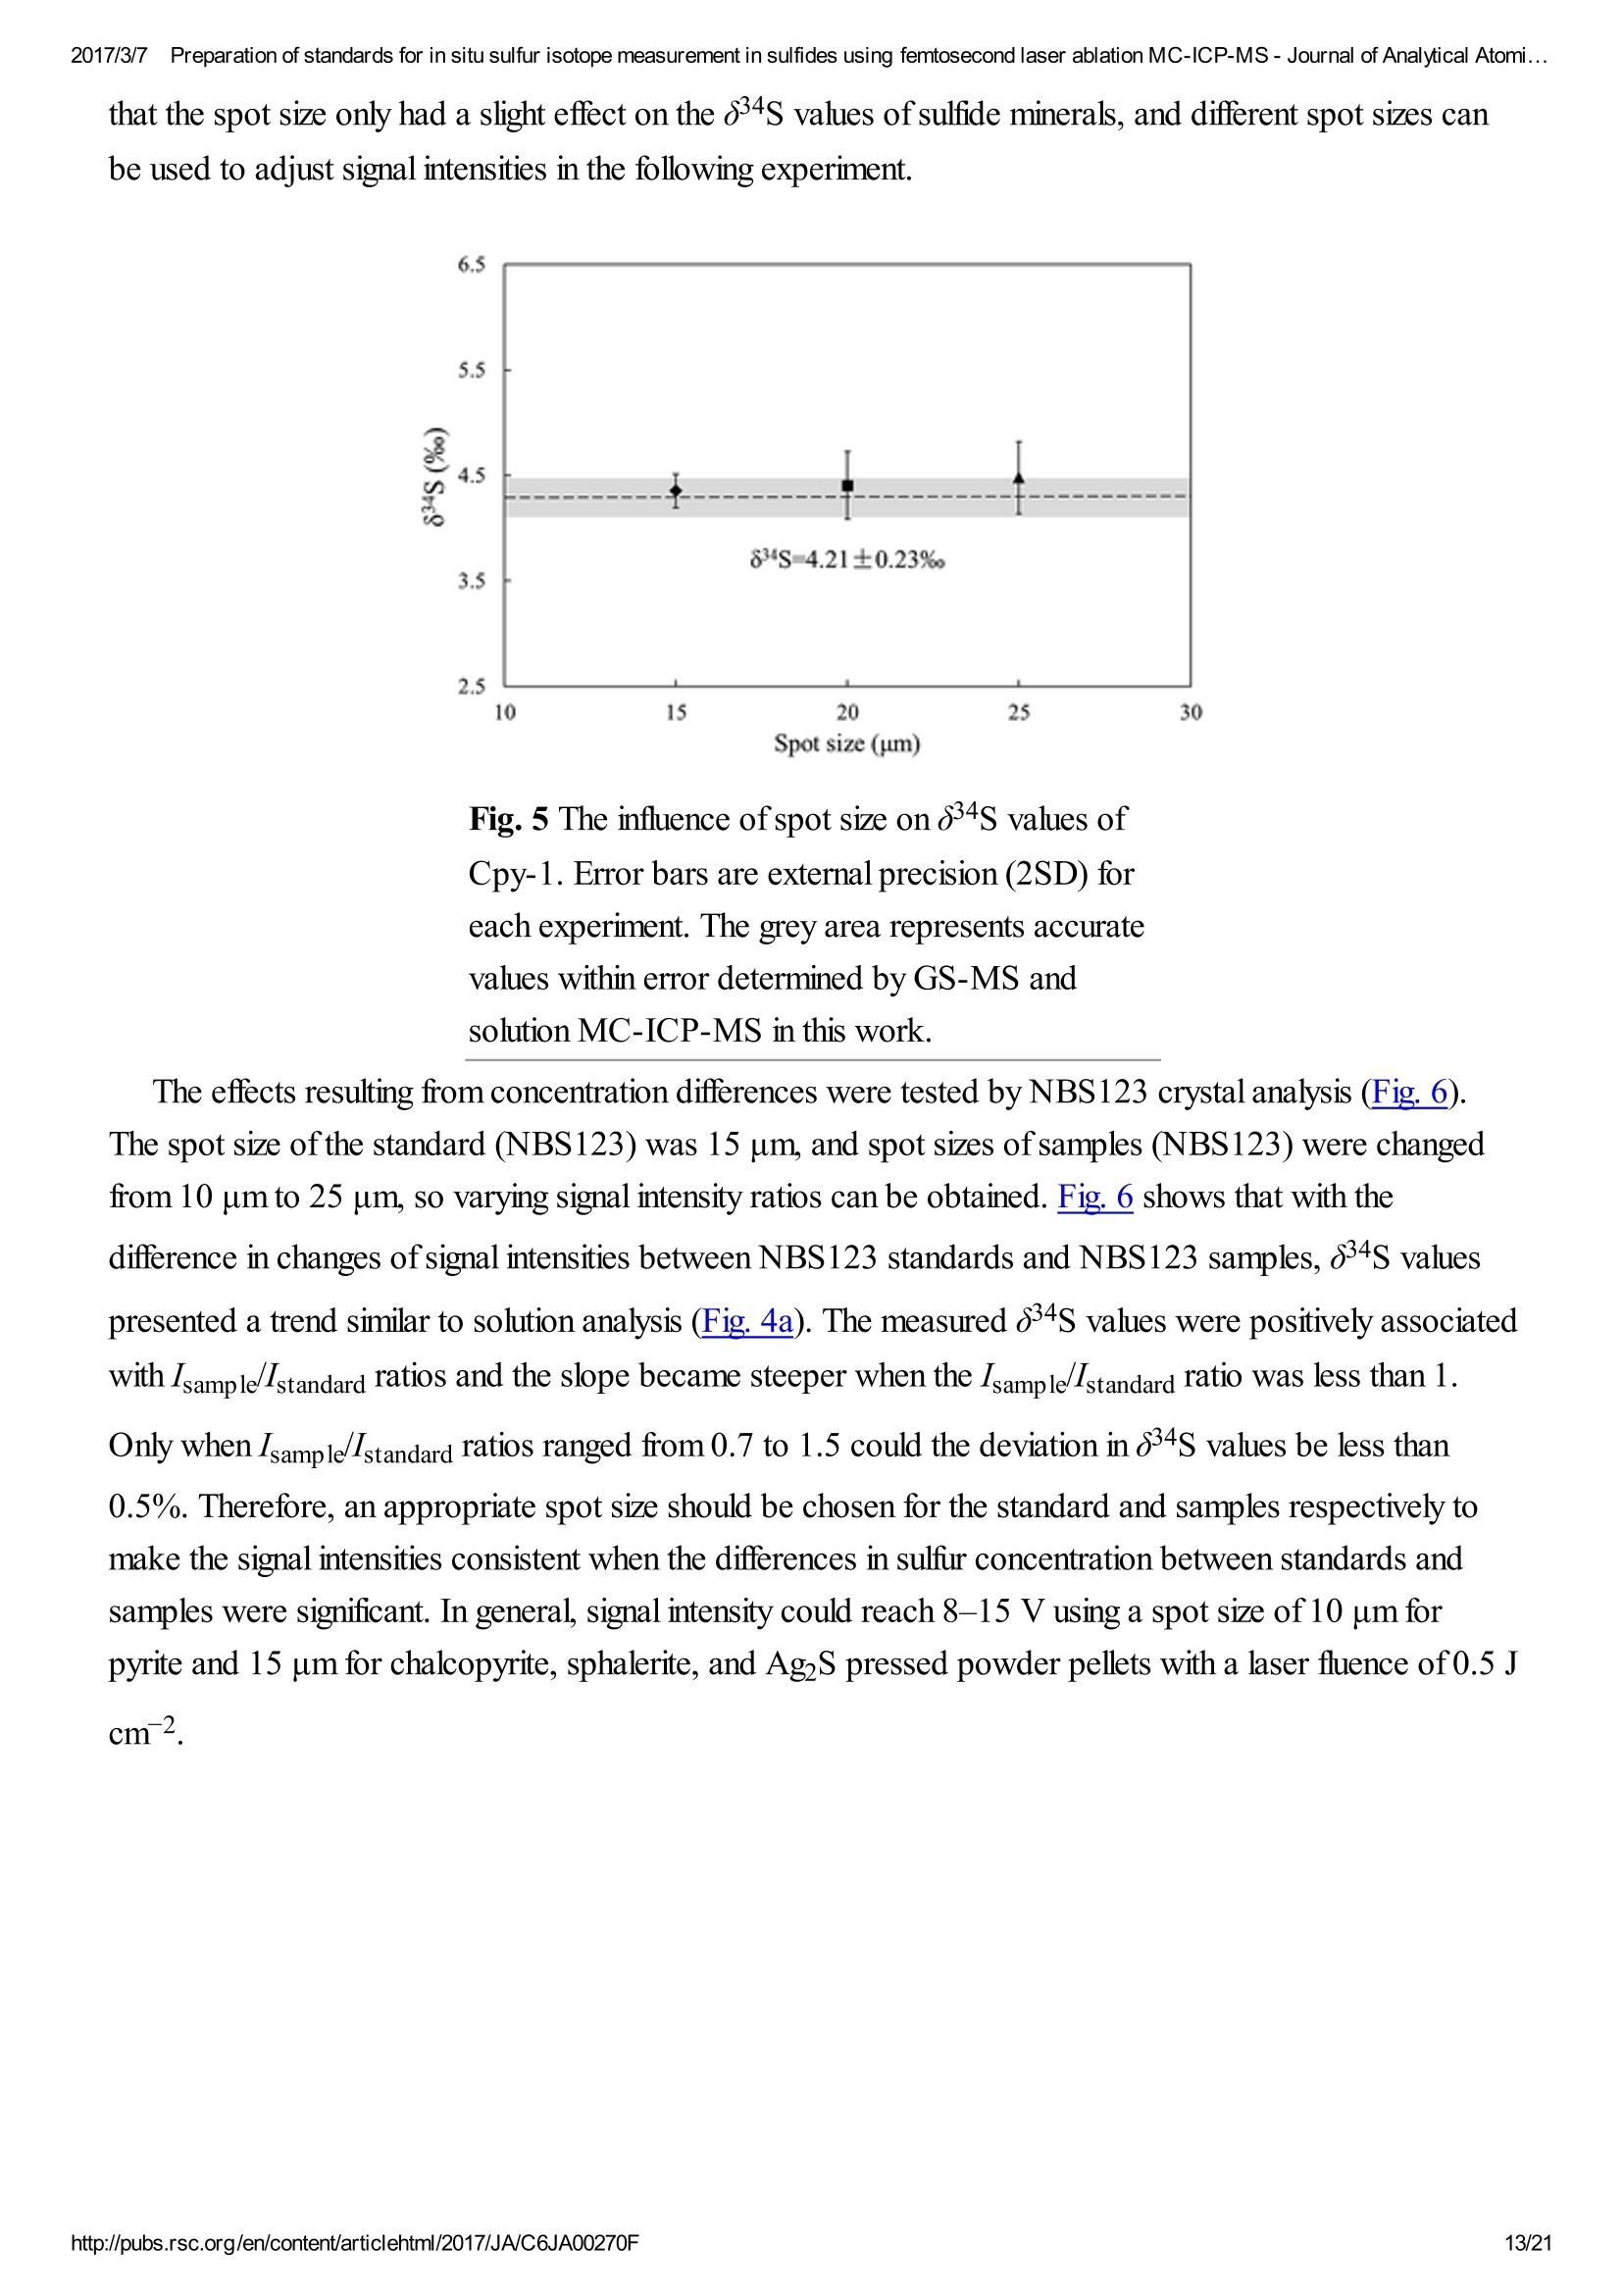
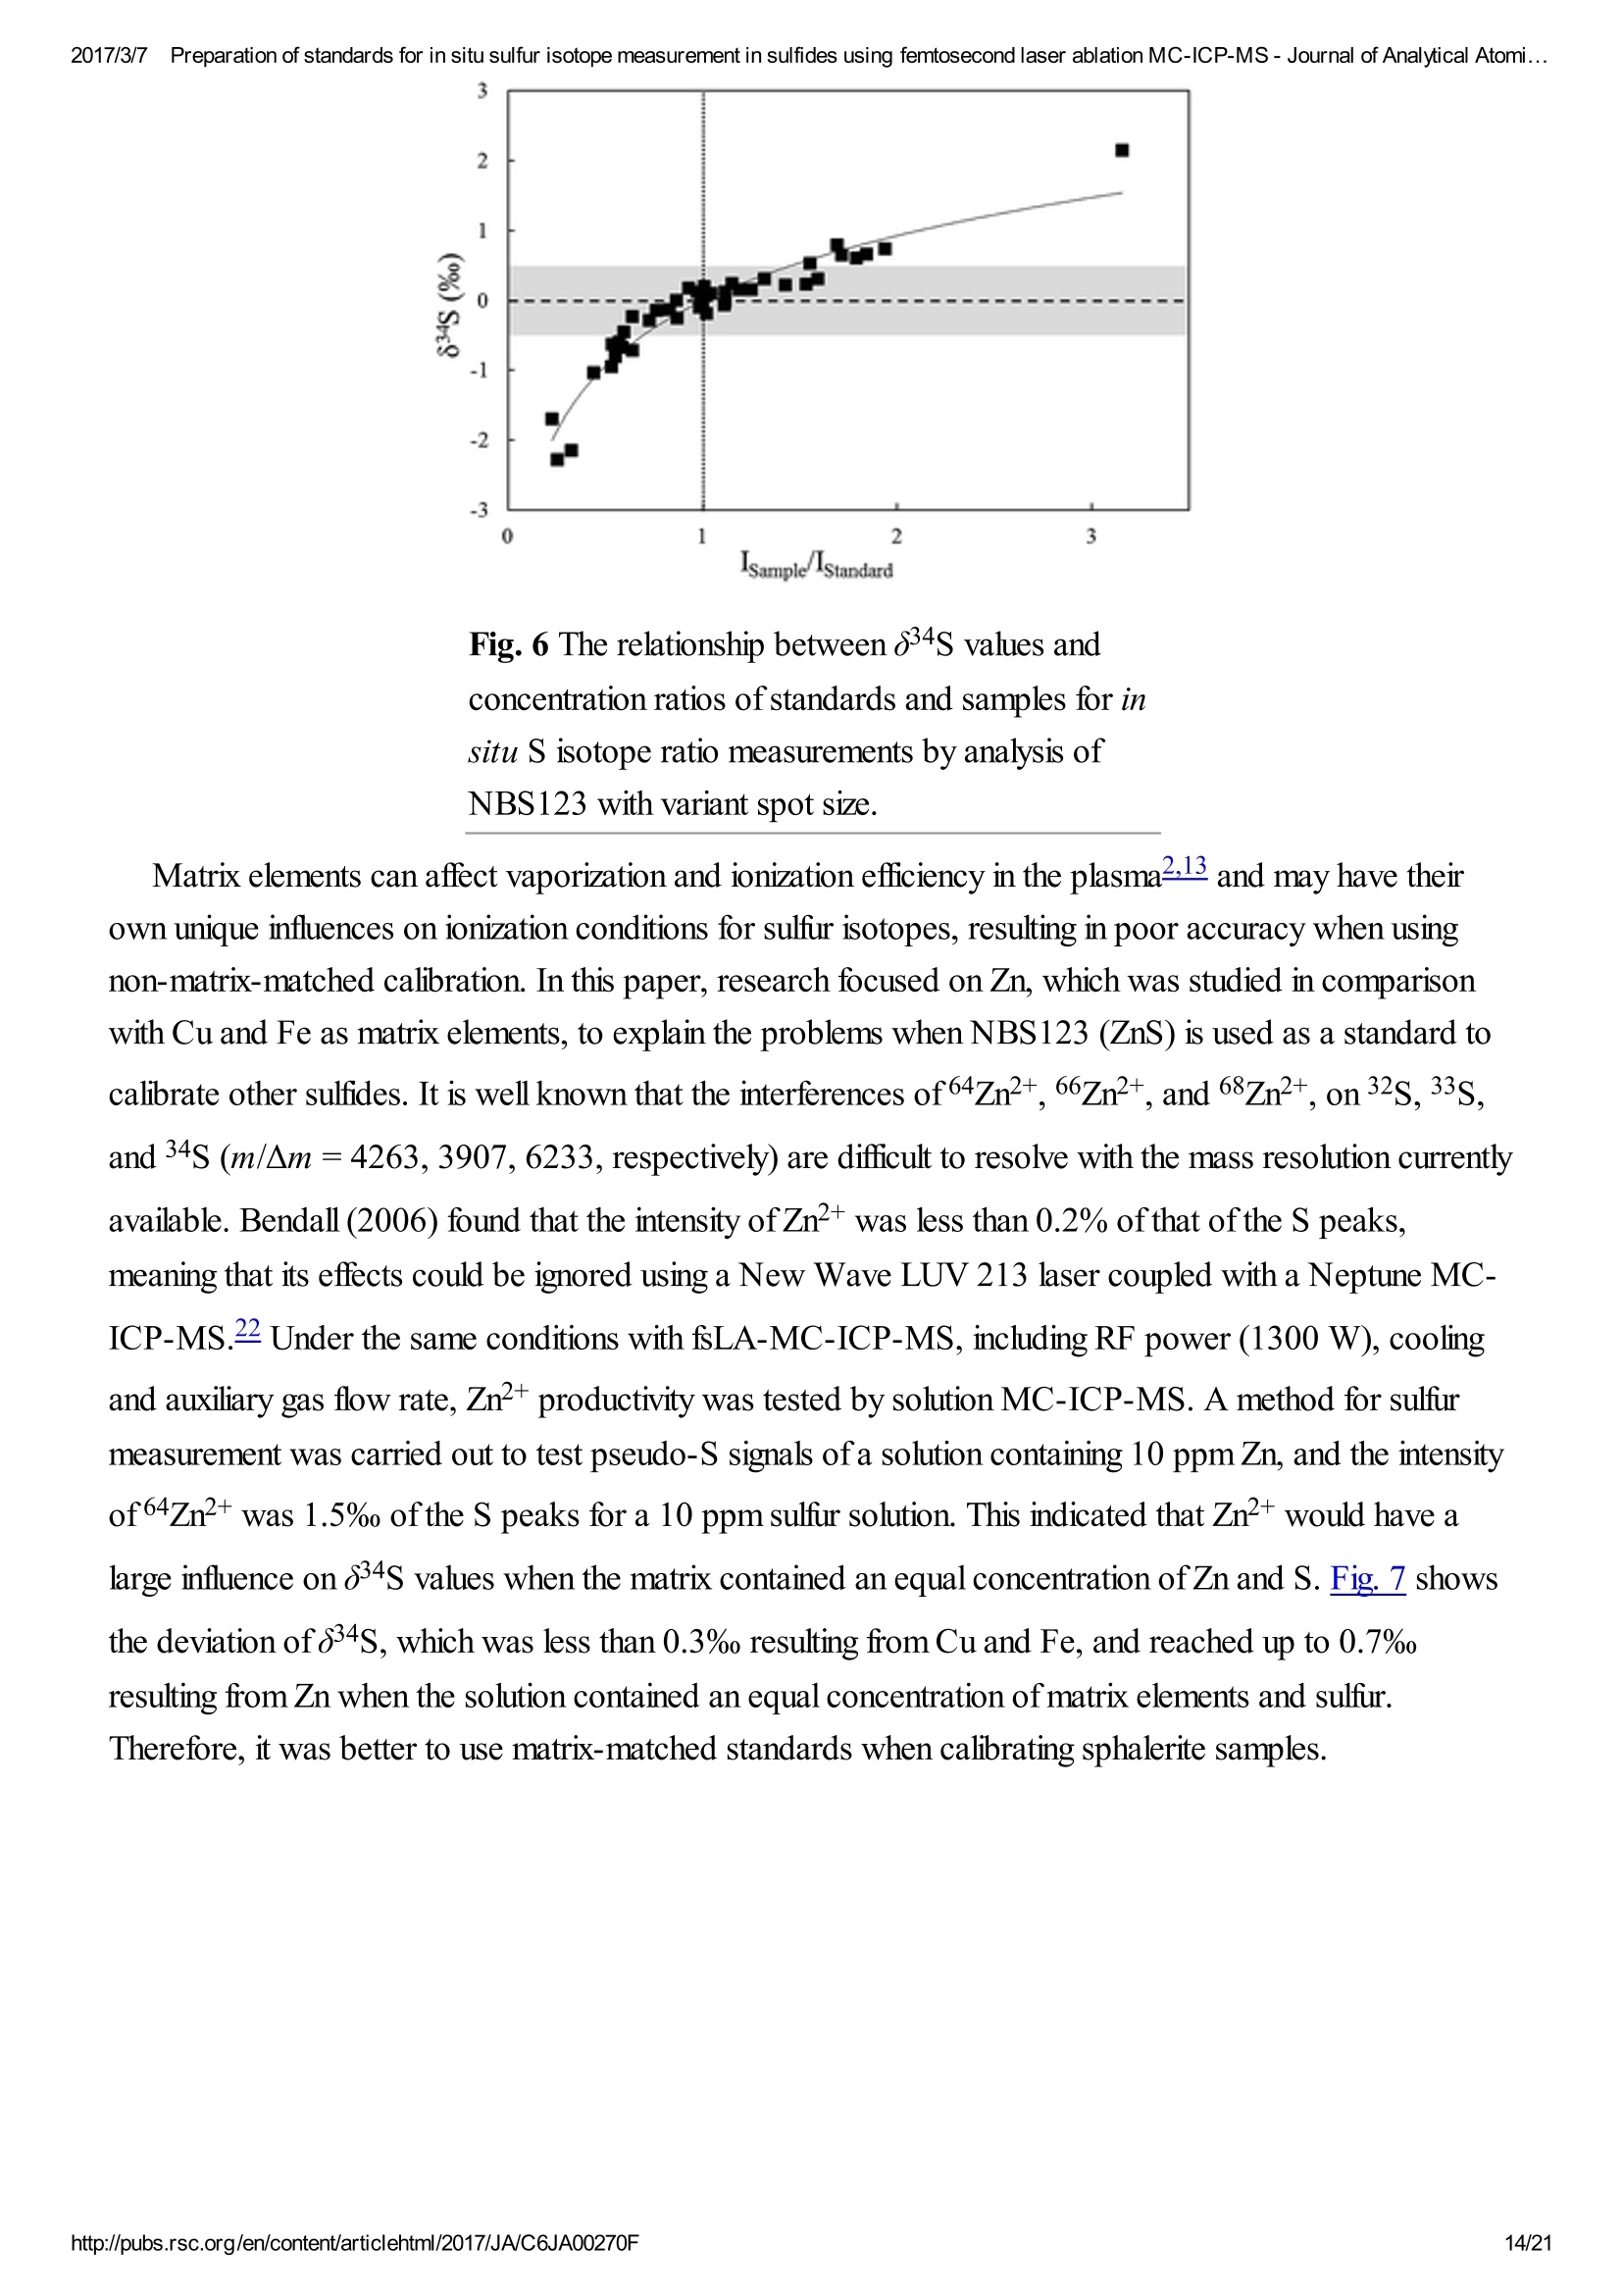
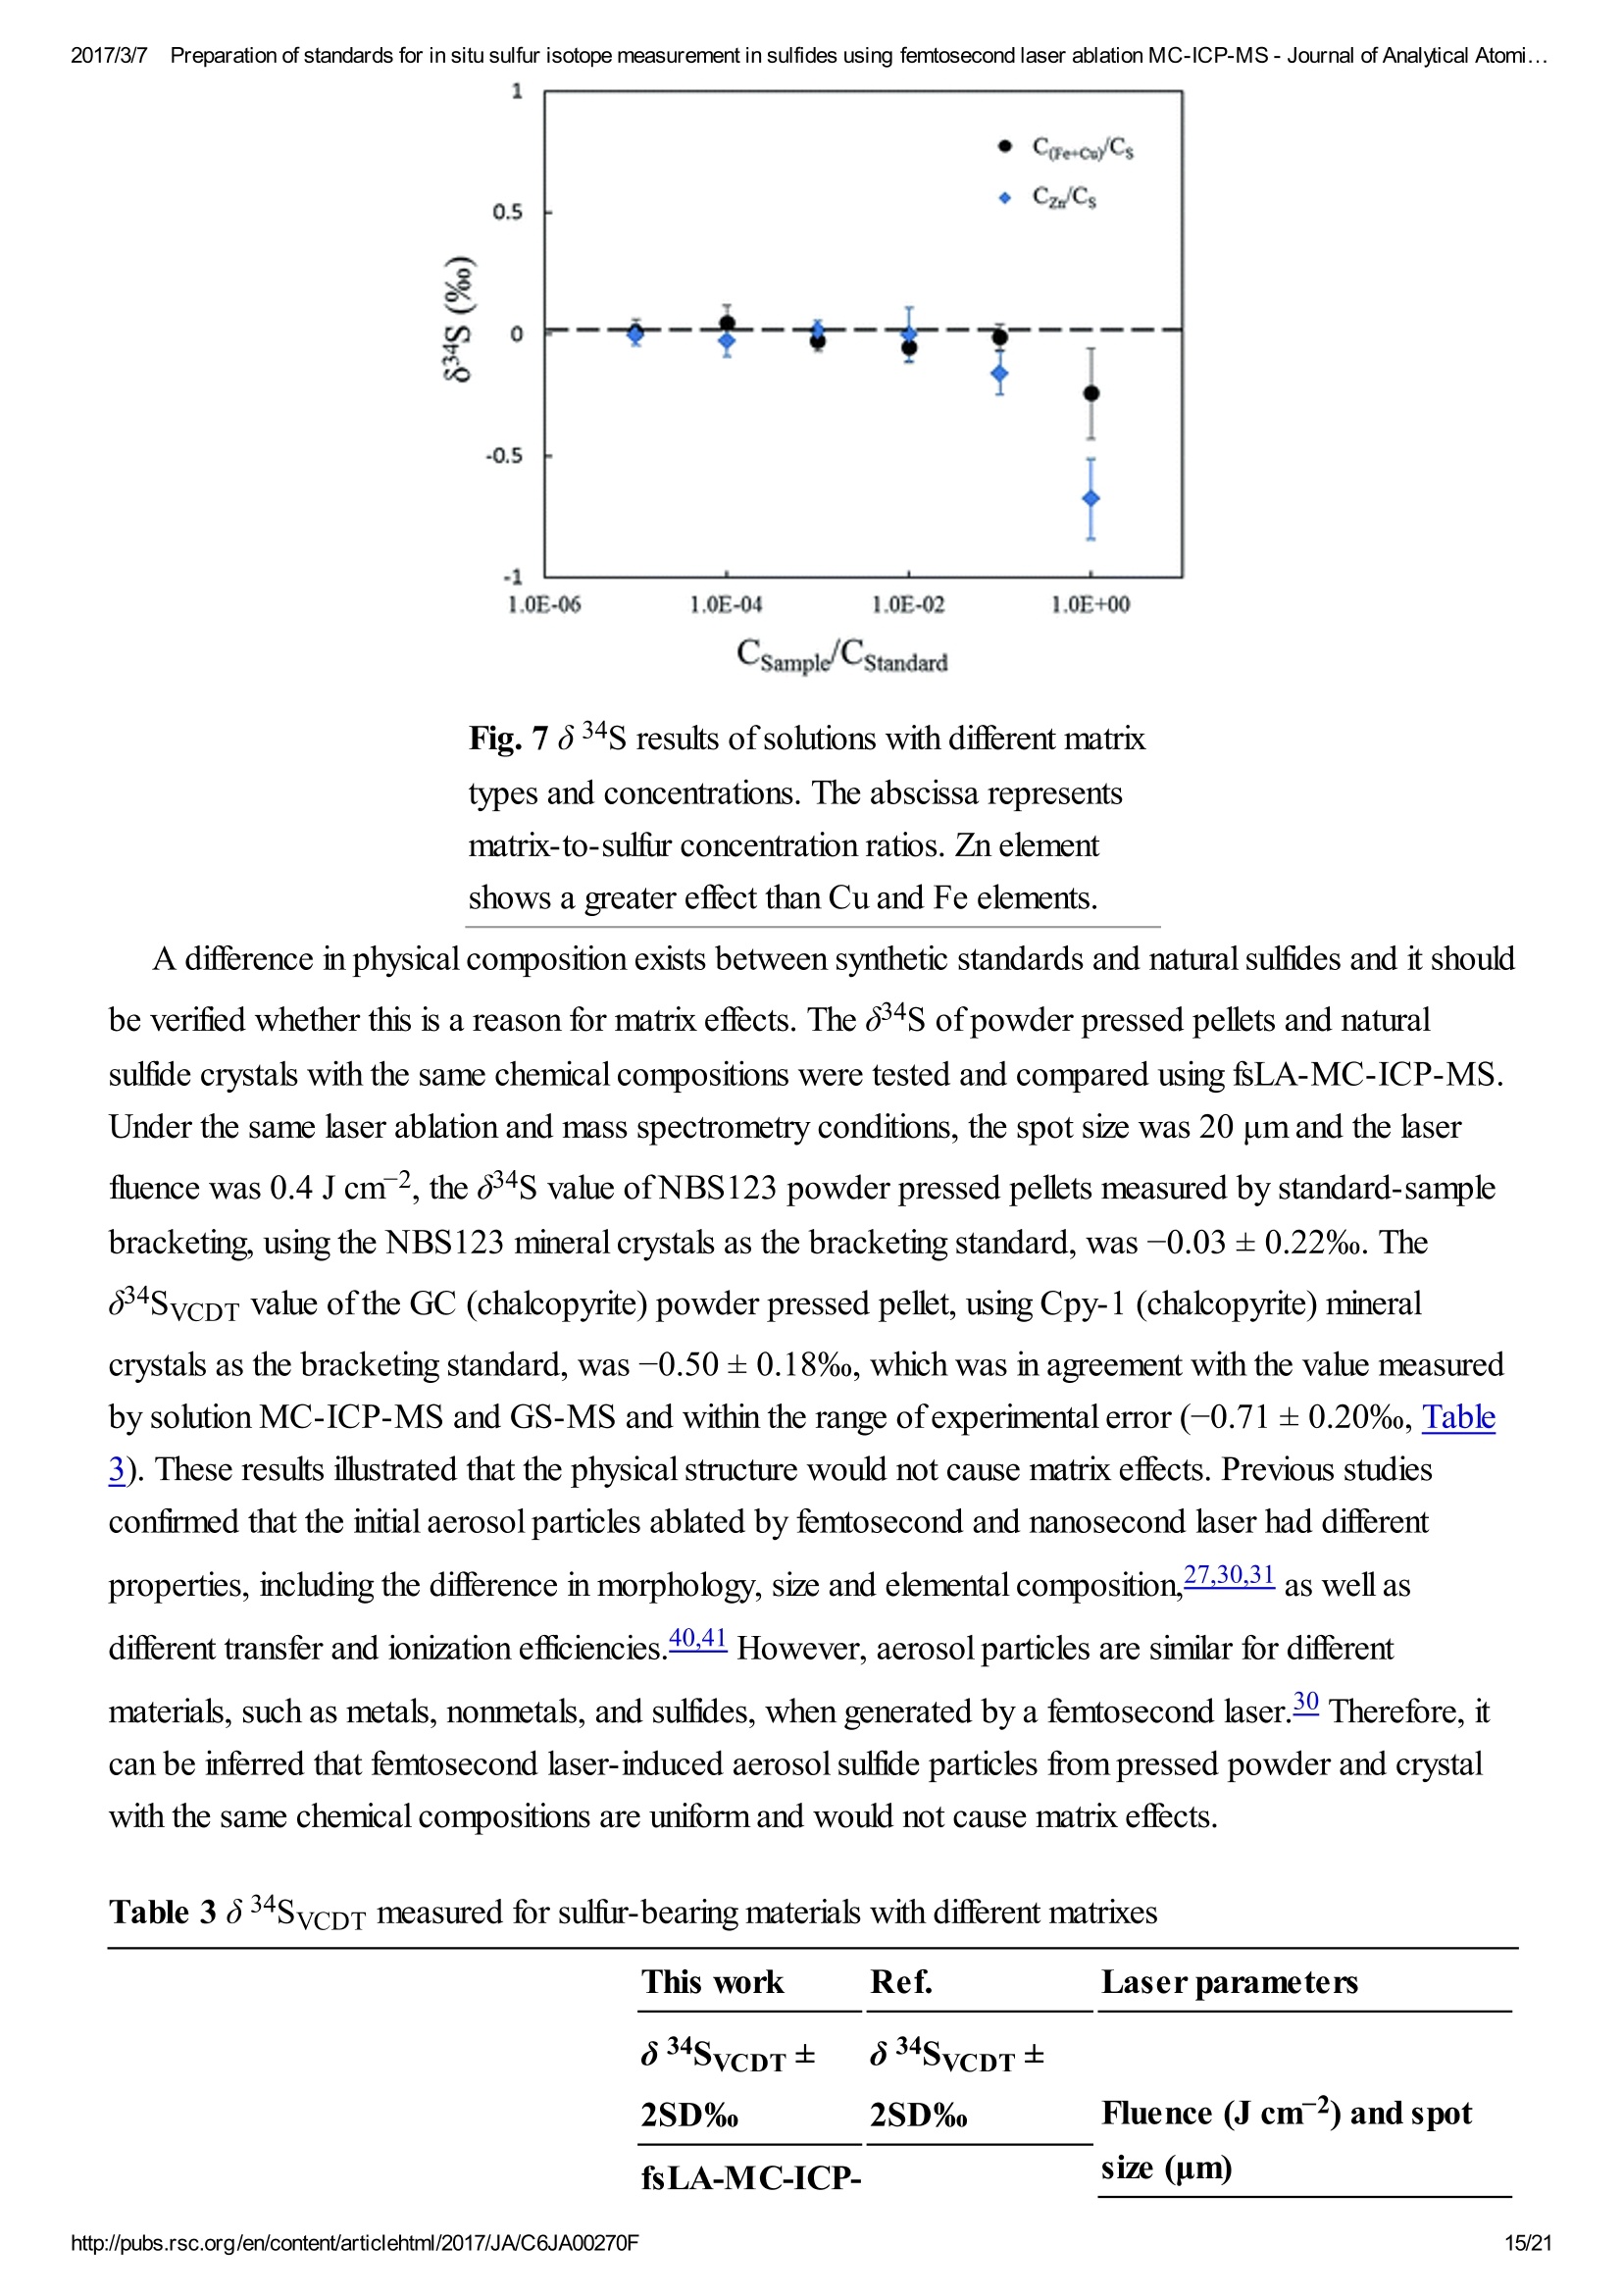
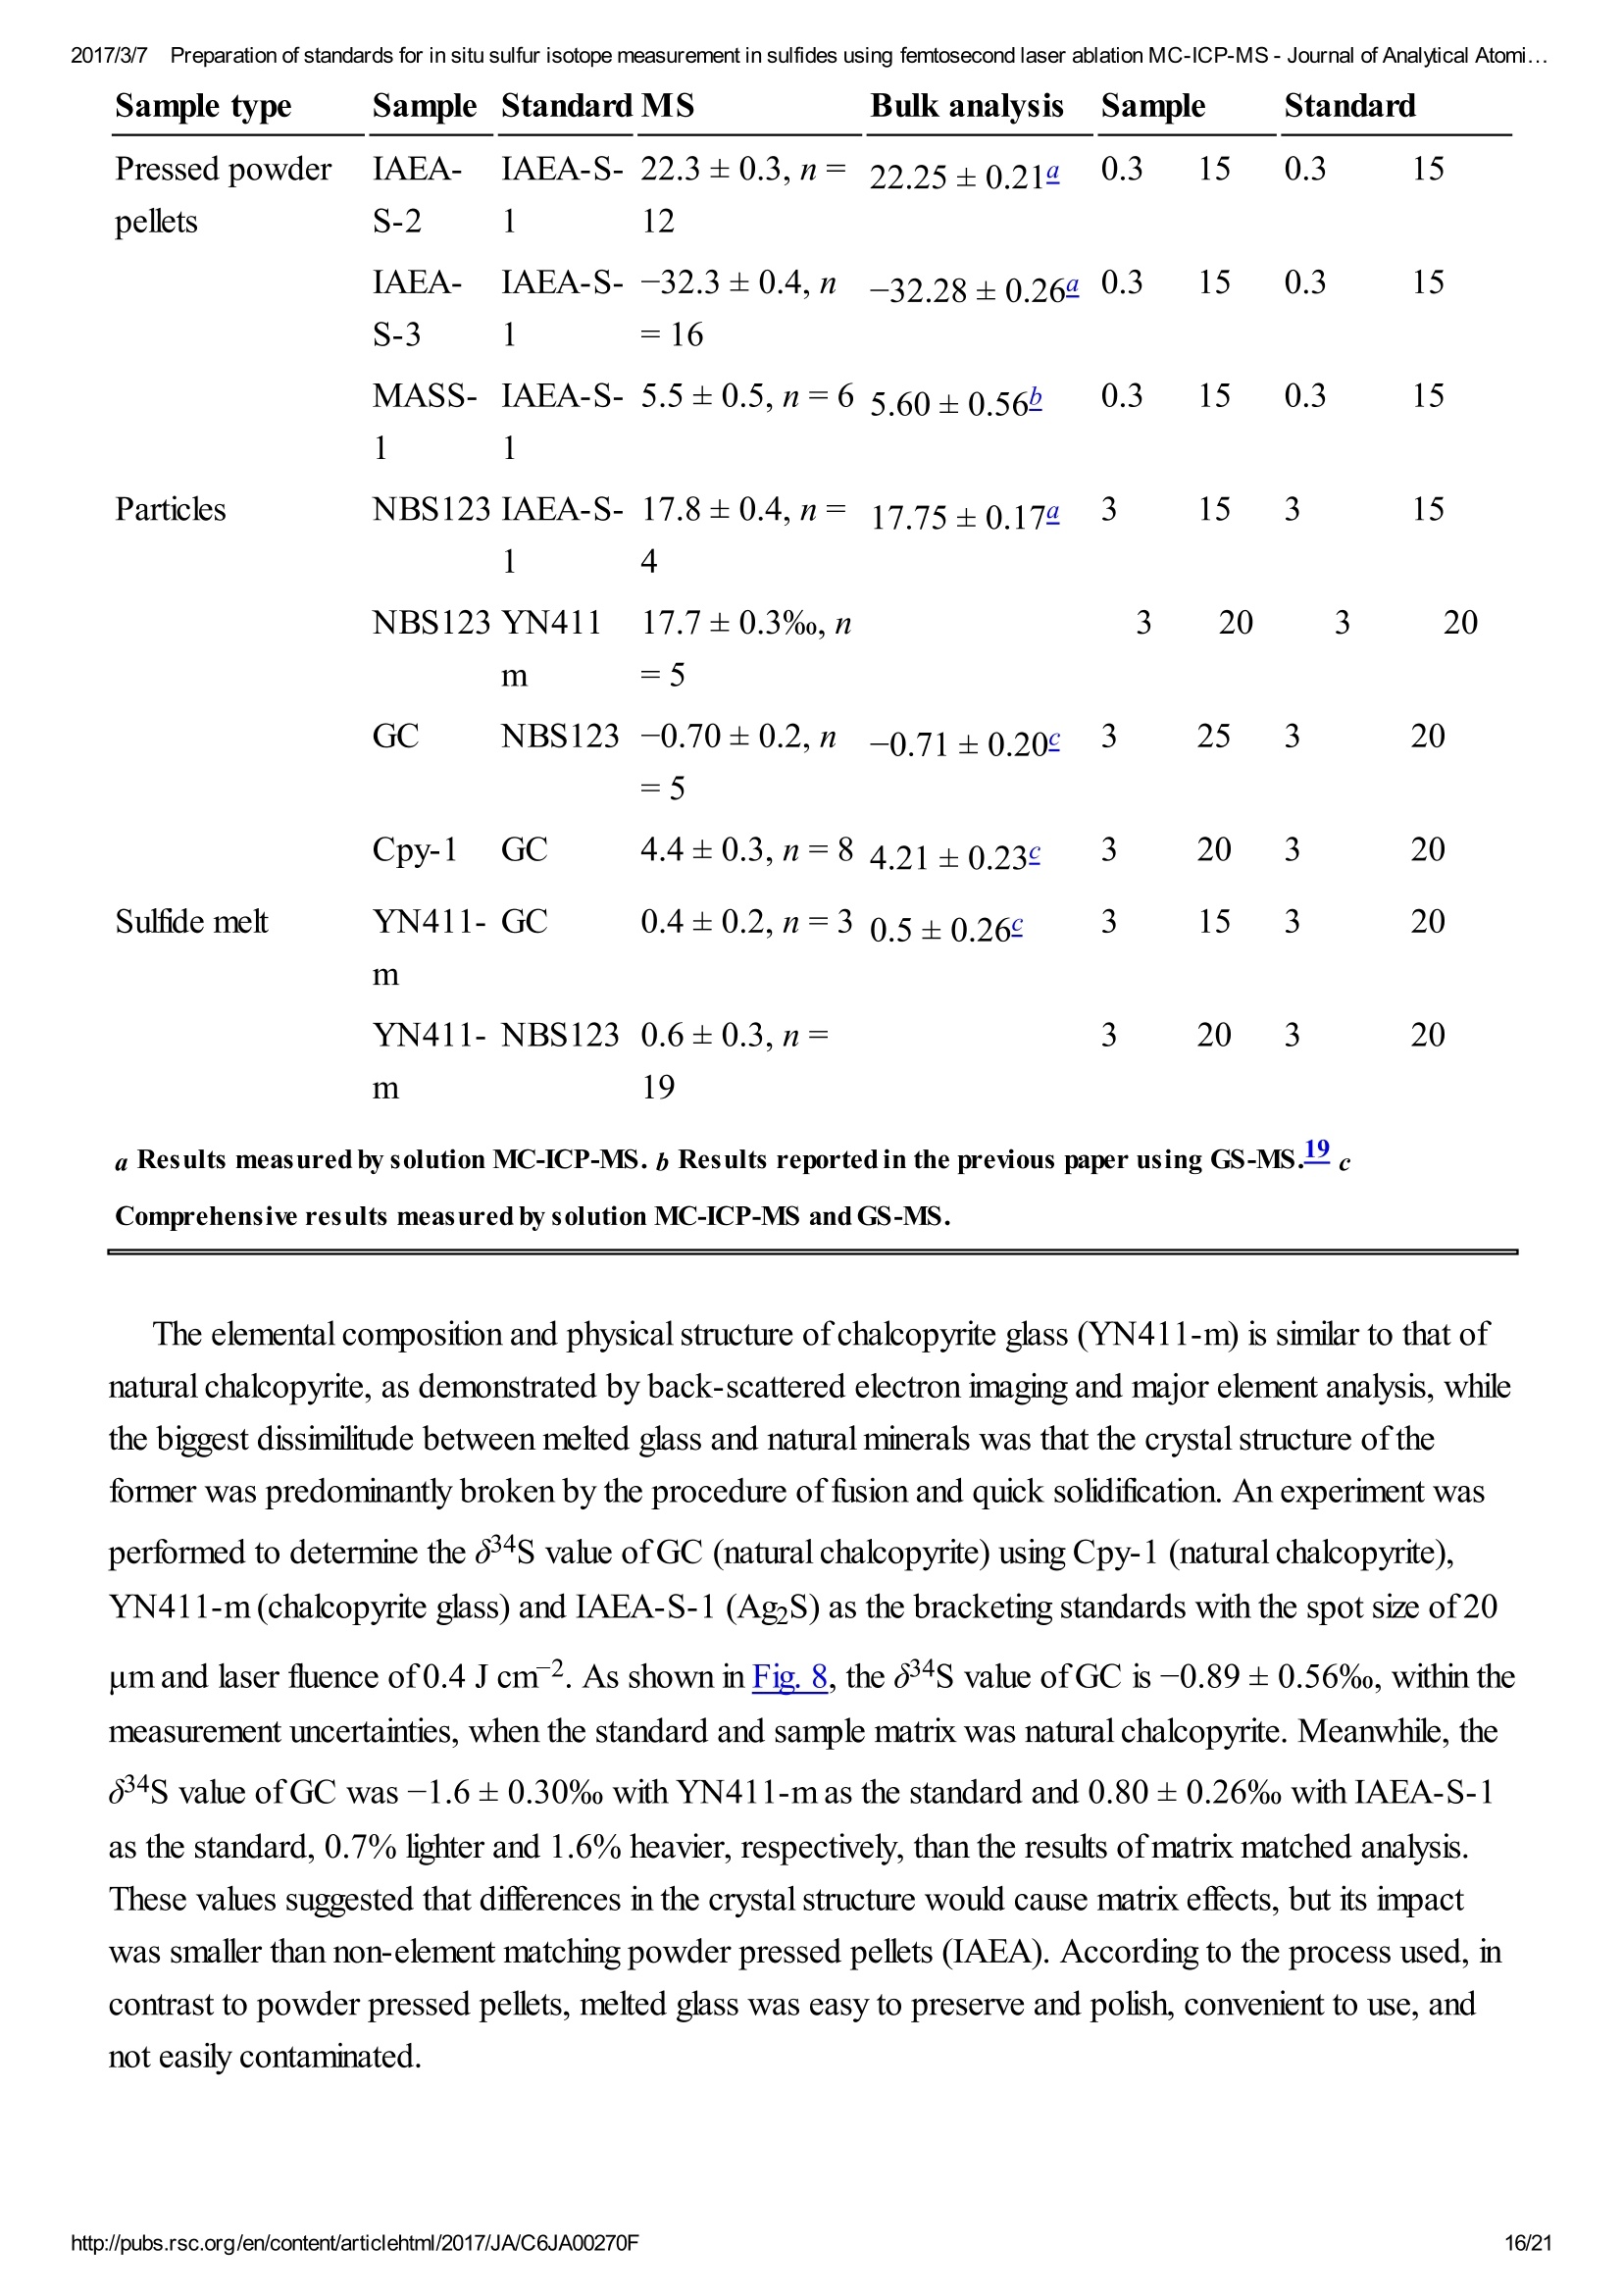
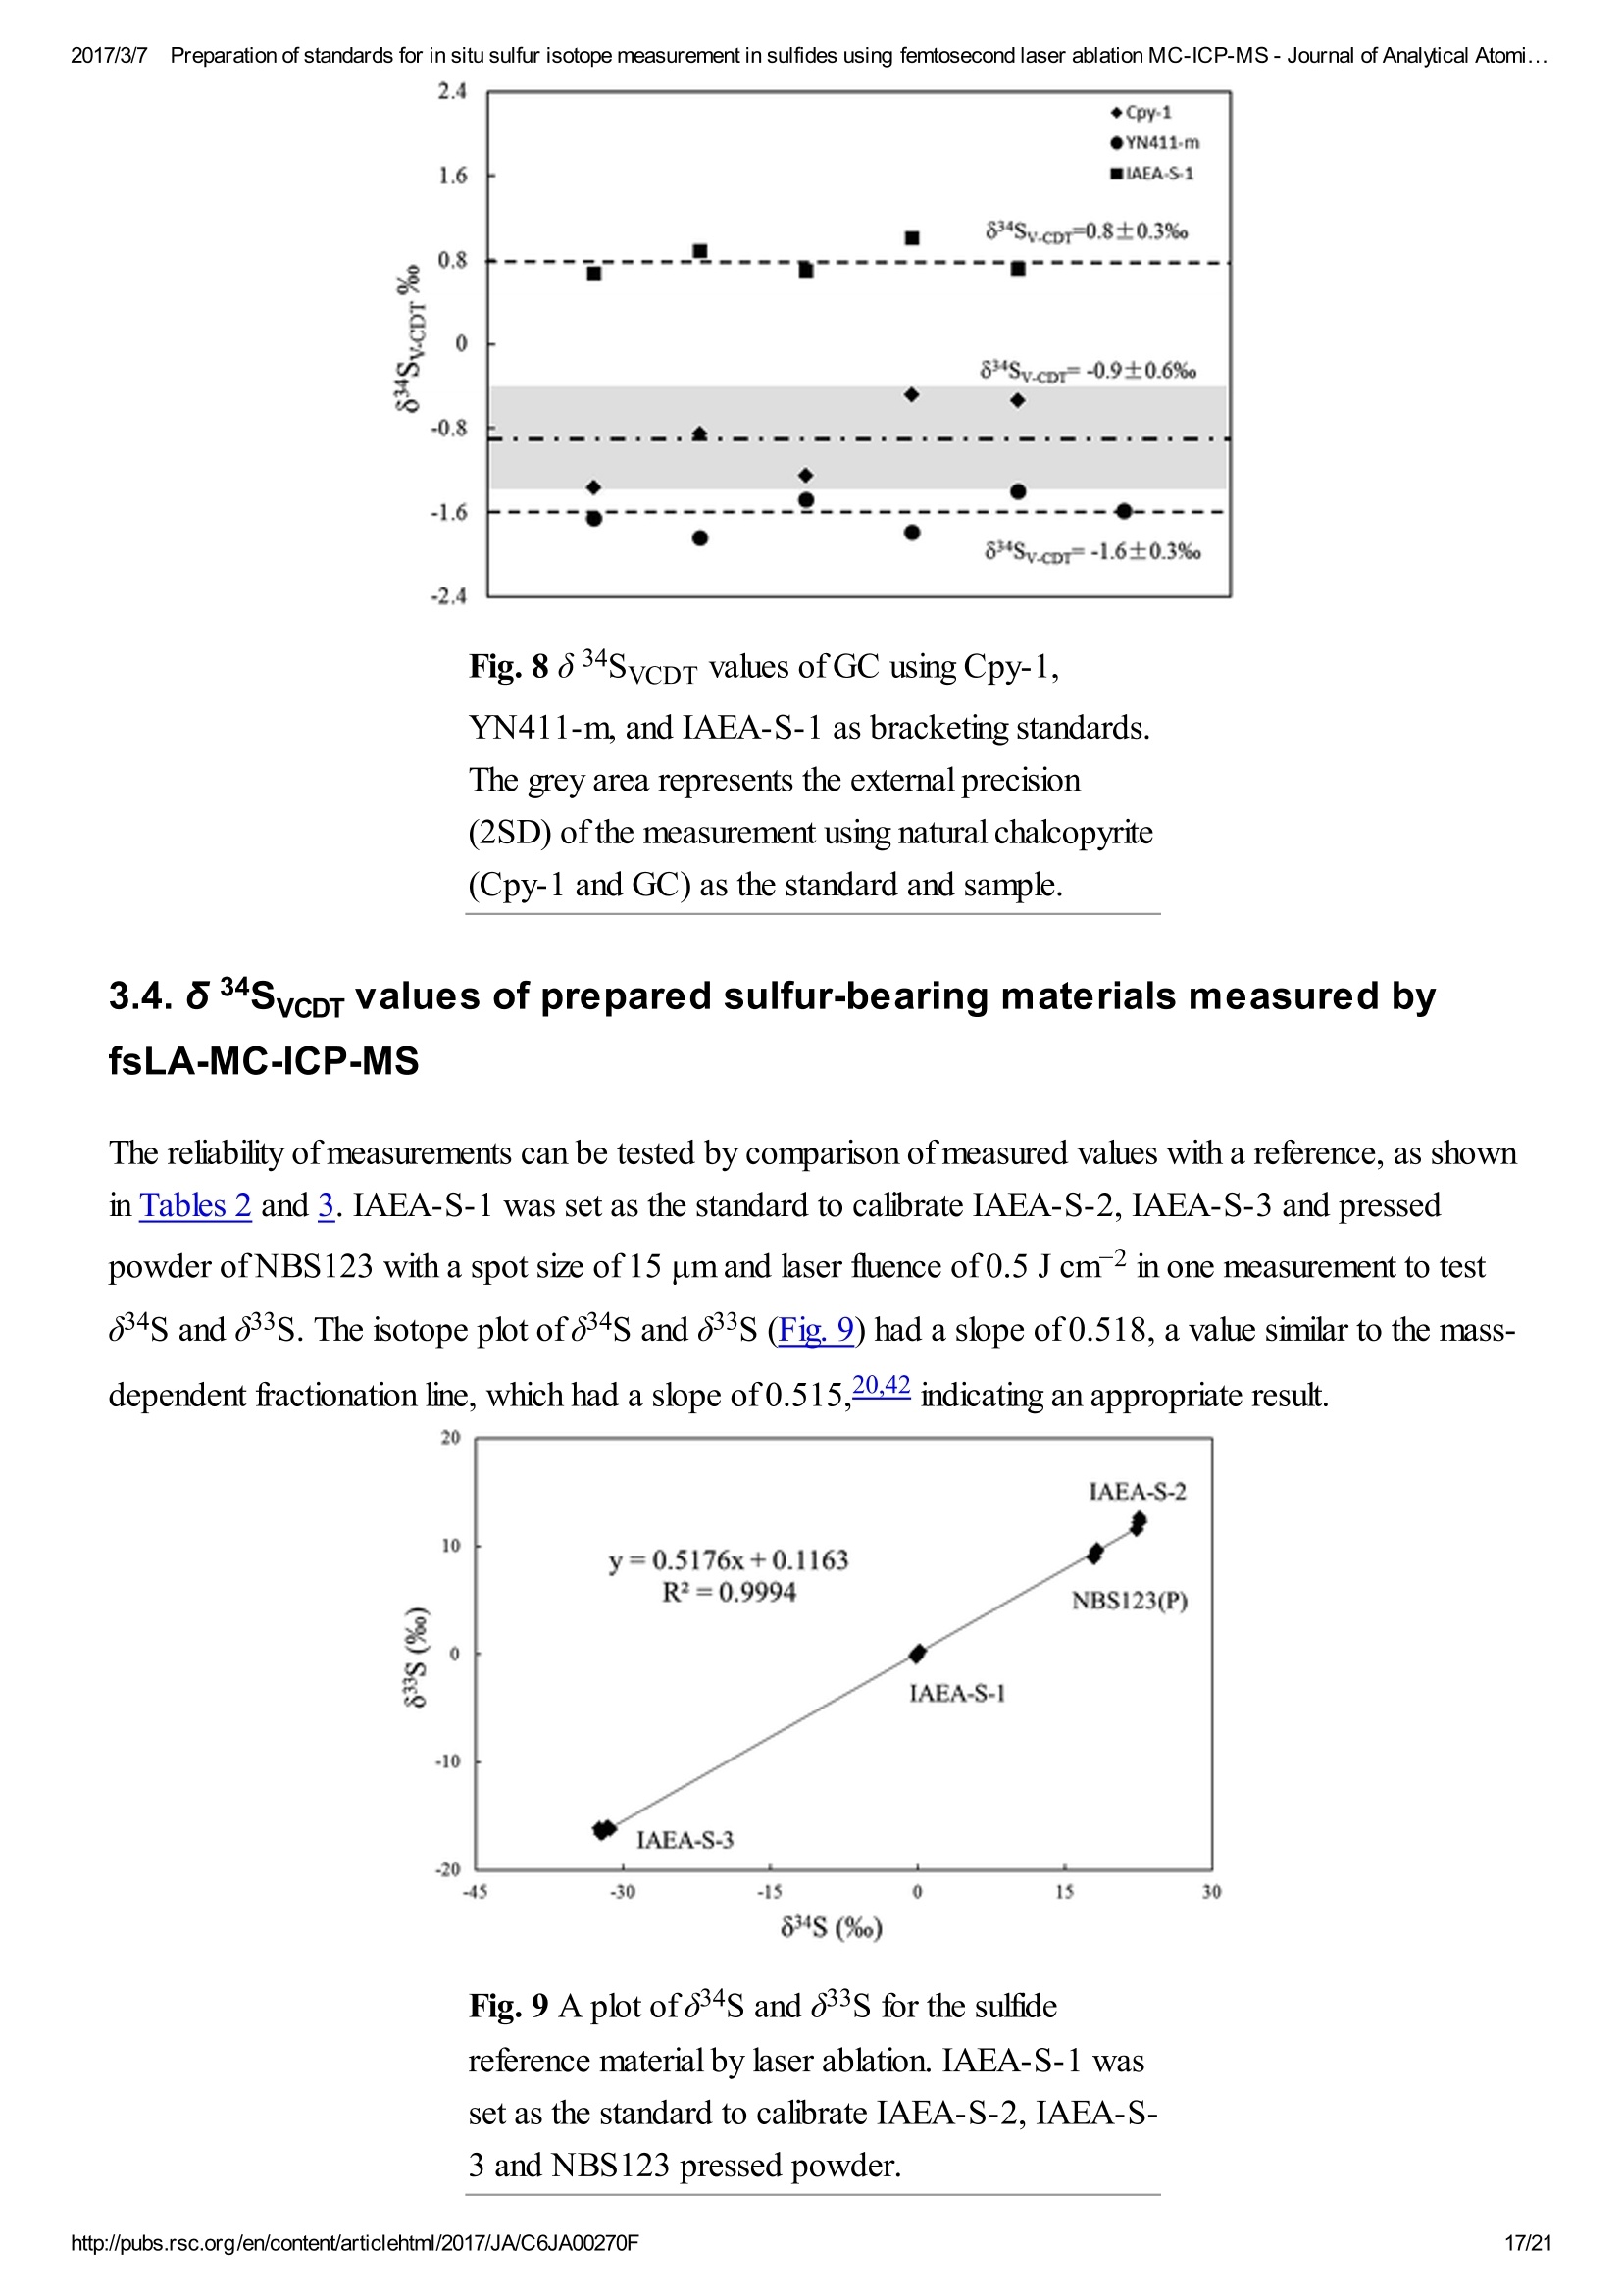
2017/3/77Preparation of standards for in situ sulfur isotope measurement in sulfides using femtosecond laser ablation MC-ICP-MS-Journal of Analytical Atomi...CrossMark(click for updatesView PDF Version Previous Article Next ArticleDOI: 10.1039/C6JA00270F (Paper)J. Anal. At. Spectrom.,2017,32,107-116 2017/3/77Preparation of standards for in situ sulfur isotope measurement in sulfides using femtosecond laser ablation MC-ICP-MS-Journal of Analytical Atomi... Preparation of standards for in situ sulfurisotope measurement in sulfides usingfemtosecond laser ablation MC-ICP-MS Lu Chen, Kaiyun Chen, Zhian Bao, Peng Liang, Tiantian Sun and Honglin Yuan * State Key Laboratory of Continental Dynamics, Department of Geology, Northwest University,Collaborative Innovation Center of Continental Tectonics, Xi'an 710069, China. E-mail:sklcd@nwu.edu.cn; Fax:+8629 88303447; Tel: +86 29 88305924 Received 25th July 2016, Accepted Ist November 2016 First published on the web 1st November 2016 We prepared a series of pressed powder tablets and chalcopyrite glass standards tocorrect mass bias when using standard-sample bracketing for in situ sulfur isotopemeasurements. A femtosecond laser ablation coupled multi-collector inductivelycoupled plasma mass spectrometry (fsLA-MC-ICP-MS) method was used todetermine the sulfur isotope composition of these standards. Chalcopyrite glass(YN411-m) was prepared by quickly quenching the fused chalcopyrite, which wasmelted at 1000 ℃ under a protective N2 atmosphere. Multiple experiments wereconducted for homogeneity testing of YN411-m by fsLA-MC-ICP-MS and theexternal precision was 0.28%o(n=35). Mineral particles, pressed powder tablets,and chalcopyrite glass were used as bracketing standards when determining the 84sofa natural chalcopyrite (GC). The results showed that the concentration, elementalcomposition, and crystal structure caused the matrix effect. Considering practicability,the melted glass was a more appropriate standard than the pressed powder tablet.We also found that the carrier gas flow rate, laser fluence, and spot size impacted theregularity ofresults. Therefore, we can obtain accurate 834s by adjusting the laser andMC-ICP-MS parameters when using non-matrix matching standards. Furthermore,fsLA-MC-ICP-MS is advantageous for in situ sulfur isotope measurement because 2017/3/77Preparation of standards for in situ sulfur isotope measurement in sulfides using femtosecond laser ablation MC-ICP-MS-Journal of Analytical Atomi... the sensitivity can be improved and it dramatically improves the spatial resolution (10-20 um), which can be used to explain the origin of multi-genesis deposits by analyzingsmaller mineral micro-areas, especially mineral fracture- filling sulfides later inmineralization. 1. Introduction Sulfur is abundant in nature, existing in versatile states such as gaseous H2S and SO2, and solid sulfide,sulfate, elemental sulfur, and organic sulfur. The fractionation of sulfur isotopes during geological processesis distinct because ofthe large difference in their atomic masses and valence states. Generally, the sulfurisotope compositions are presented as 84s:-2 8 34S is stabilized at around 0%o, or a small positive amount, in mantle-derived rocks, while the isotopiccomposition of sulfur in crust rocks, having undergone magmatism, sedimentation, metamorphism, andsupergenesis, has a large range of-50 to +35%.13.4 Therefore, sulfur isotopes serve as key tracers in ore-forming material sources in geochemical processes and sulfur cycling in nature.9 Conventional bulk analytical techniques for sulfur isotope ratios involve the use of gas-source massspectrometry (GS-MS) or a solution multi-collector inductively coupled plasma mass spectrometer (MC-ICP-MS).2,10-12 GS-MS requires sulfur to be converted from a solid powder to gaseous SO2 or SF6before being subjected to mass spectrometry analysis. Generally, GS-MS is considered the standardmethod for precise and accurate sulfur isotope measurements, but requires time-consuming samplepreparation and large samples (more than 10 mg for sulfide). Solution MC-ICP-MS can provide goodaccuracy, precision better than 0.2%o (2SD),2.12.13 and sample demand is lower than GS-MS, needing 500ug S. But the chemical purification of samples is complex, and the procedure of processing through resinsmay generate unnegligible resin originated blank (0.25 ug S).2 Recent studies have shown that solutionMC-ICP-MS can be used to measure very low sulfur samples (e.g., glacier, snow, and rainwater samples),having a sulfur demand as low as 2 pg.14.15 Though bulk analytical techniques have very high precision, it isdifficult to distinguish sulfur isotopes of zonation within a single grain or multi-genesis minerals in micro-areas. Therefore, in situ analytical techniques have been developed to resolve the problems. Previousresearch has combined laser ablation with GS-MS, but the spatial resolution was limited by the high GS-MS sample demand, usually~150 um.In comparison, secondary ion mass spectrometry (SIMS) andLA-MC-ICP-MS not only provided high precision, but also achieved better spatial resolution. Ushikubo-measured a standard pyrite, achieving a precision of0.23%o (2SD) with a primary beam size of~20 um bySIMS. Kozdon achieved±0.2%o precision in pyrite (2SD) with a 10 um spot size using SIMS. I’ Sincethere is no 36Ar interference to 36S, this technique can be used to test 836S, which cannot be accomplishedusing MC-ICP-MS. However, because SIMS is prone to serious matrix effects, this technique cannot 2017/3/77Preparation of standards for in situ sulfur isotope measurement in sulfides using femtosecond laser ablation MC-ICP-MS-Journal of Analytical Atomi... Most measurements used standard-sample bracketing to correct mass bias,2.21.22 with sulfur isotopecompositions presented as values relative to a reference; thus, the standard is a key factor in sulfurmeasurement. Because the recognized standard, Vienna Canon Diablo Troilite (VCDT),was used up,researchers are seeking for new sulfur isotope standards. Standards for LA-MC-ICP-MS can be naturalminerals, pressed powder tablets, or any other type of artificial solid sample.13.23.24 Natural sulfide orsulfate minerals commonly have an inhomogeneous sulfur composition resulting from the various origins ofsulfur and fractionation during mineral precipitation.25.26 Sulfides from magmatic deposits without laterhydrothermal alteration may have a homogeneous sulfur isotope composition owing to the single sulfurresource and high ore-forming temperature. Bendall (2006) used a pyrite from a Kambalda magmaticdeposit as the in-house standard, which had an external precision of 0.32%o (2SD) measured by LA-MC-ICP-MS.2 Gilbert et al. (2014) also used a natural pyrite standard (PPP-1) as an isotopic referencematerial with a reproducibility of 0.2%.2 In addition, metamorphosed massive sulfide deposits may containhomogeneous sulfides.28 The solid sulfide standards currently used in LA-MC-ICP-MS are IAEA series(Ag2S powder) and NBS123 (ZnS). IAEA powder was pressed into tablets for in situ sulfur isotopedetermination, but the matrix difference between the standard and sample caused diversity in thetransmission, vaporization, and ionization efficiency of laser-generated aerosols.2.13.29 The majority ofNBS123 crystals are too small (80-300 um) for analysis by most LA-MC-ICP-MS equipment in line scanmode and, due to crystal defects in some sphalerite particles (NBS123), they showed a moreheterogeneous ablation and vaporization behavior compared with tablets, resulting in poor precision.20Most NBS123 were ground into powder and pressed into tablets. Furthermore, Pribil (2015) used a ZnSglass as the in-house standard, which showed good homogeneity. Higher spatial resolution is very important for geological sample analysis, especially of small-sizedsulfides and fracture- filling sulfides during different mineralization stages. Compared with a nanosecondlaser, a femtosecond laser has a much shorter pulse duration,shorter, even, than the thermal relaxation timeofmaterials, so there is not enough time for the energy to transfer from electrons to the lattice and induceheating within and around the ablation volume to reduce thermal effects. Less thermal effects will result inless elemental fractionation, 30.32.33 indicating that a femtosecond laser is more appropriate for in situ sulfuranalysis. Beyond that, femtosecond lasers generate smaller and more uniform aerosol particles (usually onthe nanoscale), which enhances the transmission efficiency and signal intensity.30-36 Therefore, theapplication ofa femtosecond laser during in situ sulfur isotope analysis with a smaller ablation size is 2017/3/77Preparation of standards for in situ sulfur isotope measurement in sulfides using femtosecond laser ablation MC-ICP-MS-Journal of Analytical Atomi...possible and will improve spatial resolution. For mass spectrometry analysis, isotopic interferences frommolecular ions (e.g.,160-160+,32S-H* and 170_160-1H*) and doubly charged ions (e.g., 64Zn?+) havea negative effect on sulfur isotope analysis.2.13.22 This problem is commonly resolved using sufficient massresolution to enable the detection ofS isotopes on the interference-free plateau. However, the sulfur plateauis too narrow compared with the mixed peak, and values might be significantly affected by instrumentstability. In this study, we used a high-resolution MC-ICP-MS (Nu 1700) combined with a femtosecondlaser to analyze sulfur isotopes. Nu 1700 is able to completely separate any interference peaks in 32S usingmedium resolution mode (resolution power = 10 000) and in 33S using a higher resolution mode (resolutionpower=18 000). We prepared several standards for in situ sulfur isotope analysis using different methods, anddetermined their 84s values by GS-MS and solution MC-ICP-MS. We determined their feasibility asstandards by comparing their matrix effects using fsLA-MC-ICP-MS. Moreover, the application offemtosecond laser and high-resolution MC-ICP-MS can significantly improve spatial resolution,which canbe used to explain the origin of multi-genesis deposits by the analysis of smaller mineral micro-areas,especially the mineral fracture- filling sulfide during later mineralization. 2. Materials and methods 2.1. Instrumentation and analytical protocol Most experiments were conducted at the State Key Laboratory of Continental Dynamics, NorthwestUniversity, Xi'an, China.Isotopic measurements were performed using a Nu Plasma 1700 MC-ICP-MS(Nu instruments, UK). A NWR UP Femto (Electro Scientific Industries, Inc., USA) femtosecond laserablation system was used as the ablation source for in situ analysis. A JEOL JXA-8230 electron probewith 15 kV acceleration voltage, 20 nA beam current, 2 um beam size and 30 ms cumulative time for eachpoint was used for back-scattered electron images and major element analysis, including single and mapanalysis modes.Otherwise, a Delta V Plus gas-source mass spectrometer (GS-MS), housed in theanalytical laboratory of Beijing Research Institute ofUranium Geology, China, was used to determine the84s of prepared sulfur-bearing materials. During this experiment, sulfide powder was mixed with Cu2Opowder before being oxidized to SO2 under a vacuum of 2 ×10⁻² Pa and temperature of980 ℃. SO2was collected by the freezing method, and then was introduced into GS-MS to be tested. The NWR UP Femto femtosecond laser ablation system consisted ofa Quantronix Ti:sapphirefemtosecond laser amplifier Integra-HE and ESI NWR Femto laser ablation system. The laser outputultraviolet wavelength was 266 nm, which is the third harmonic of 800 nm, and its pulse duration was lessthan 130 fs. The instrument was equipped with a two-volume chamber that consisted of a large samplechamber (5000 cm’) and a high-sensitivity sample cell (1.6 cm’). Nu 1700 MC-ICP-MS was equippedwith sixteen Faraday cups and three ion counters. Cup configurations for sulfùr were H5 cup for 34S, Axcup for 33S, and L4 cup for 32S. Serious interference from molecular ions, especially oxygen species, was 2017/3/77Preparation of standards for in situ sulfur isotope measurement in sulfides using femtosecond laser ablation MC-ICP-MS- Journal of Analytical Atomi... present and mixed with the sulfur peaks. As shown in previous reports (Fig. 1a),sulfur isotopes weredetected on the lighter interference-free plateau.2.13.22 The sulfur plateau was so narrow compared with themixed peak that the obtained signal might be mixed with the interference signal, reducing the precision andaccuracy.Nu 1700 was able to separate any interference peaks completely for 32S in medium resolutionmode (resolution power=10 000) and for 33S in a higher resolution mode (resolution power=18 000).The determination of unmixed sulfur peaks ensures the stability and accuracy of results. Fig. 1 Peak shapes for S isotopes with masses of32(green dotted line), 33 (black solid line), and 34 (reddotted line), using different resolutions. (a) Peakshapes obtained by Nu HR with pseudo-mediumresolution and detected S isotopes on theinterference-free plateau at lower mass.(b) Peakshapes ofNu 1700 with high resolution andinterference from 160_160 and 32S-1H wereseparated from32S and 33S. (c)and (d) Peakshapes ofNu 1700 with medium resolution usingsolution and laser ablation to introduce samples. The properties of the laser systems and MC-ICP-MS are summarized in Table 1. Argon flow rates andvoltage were adjusted to give the best signal stability and intensity in mass spectrometry. Ultra-high purityHe with a flow rate of0.7 L min- carried sample aerosol into the pipe, which was mixed with Ar in a gas-mixing chamber before entering the ICP. The argon gas flow rate depended on mass spectrometerconditions. Time-resolved software data acquisition mode with an integration time of0.2 s was used tocollect and integrate signals introduced by laser ablation. Each sample acquisition consisted of backgroundcollection for 30 s, followed by ablation signal collection for 70 s, and a wash time of50 s to reduce 2017/3/77Preparation of standards for in situ sulfur isotope measurement in sulfides using femtosecond laser ablation MC-ICP-MS-Journal of Analytical Atomi...memory effects. Due to the high sensitivity, a relatively low laser energy (fluence ranged from 0.5 to 3.5 Jcm2) and 10 Hz frequency were used. Since many experiments have shown that line scan ablation resultsin higher and more stable signal intensities, and generates better precision for S isotope ratios,2.21 a line scanablation mode with an ablation speed of2 ums-l and a frequency of 10 Hz was applied in this study. Ingeneral, the 32S signal would be 8-20 V with a spot size of 10-20 um for most sulfides. Table 1 Instrumental parameters for the MC-ICP-MS and femtosecond laser ablation system Laser ablation setup Mass spectrometer setup MC-ICP-MSNu plasma 1700RF power1300 WAcceleration voltage (HV1)6000 VCooling gas flow rate13 L min, ArAuxiliary gas flow rate0.8 Lmin-1, ArCarrier gas flow rate~0.75-0.85 L min-1, HeInterface conesNi orifice Data acquisition parameters As for solution MC-ICP-MS, a CETAC AridusIIautosampler and a quartz nebulizer with an uptakerate of 100 pL min- were used to produce wet plasma and introduce it into the ICP torch. Data 2017/3/77Preparation of standards for in situ sulfur isotope measurement in sulfides using femtosecond laser ablation MC-ICP-MS-Journal of Analytical Atomi...acquisition type was static and signal- analysis protocol included 30 cycles with 8 s integration time percycle. Two vials of pure water were used as the washer, with a total washing time of140 s. The otherparameters ofMC-ICP-MS used in the solution method were same as those used in the in situ analysis,which are shown in the mass spectrometer setup ofTable 1. 2.2. Reagents and samples HNO3 and HCl were used as the acids in this work after sub-boiling preparation using a Savillex DST-1000. High-purity water was prepared using a Millipore Element (18.2 MQ cm, Millipore Corporation,USA). All containers directly in contact with the solution and powder samples were cleaned for a 12 hperiod in 50% nitric acid and rinsed three times with 18 MQ cm-1Milli-Q water prior to use. Solid sulfur-bearing materials included some international sulfur reference materials (IAEA-S-1, IAEA-S-2, IAEA-S-3 and NBS123), a polymetal sulfide (MASS-1) and some natural chalcopyrite samples(Cpy-1, GC and YN411). IAEA series are AgS powders from the International Atomic Energy Agency(IAEA).NBS123 is a sphalerite standard with a particle size of 80-300 um, obtained from the NationalInstitute of Standards and Technology (NIST). MASS-1 from United States Geological Survey (USGS) isa pressed powder tablet of polymetallic sulfide produced by precipitating amorphous metal sulfides fromsolution with a Fe-Cu-Zn-S matrix,24 and its S concentration was 24% (data from Certificate ofAnalysisprovided by USGS). GC is a copper ore from Guichi copper mine, Anhui, China. Cpy-1 and YN411 werechalcopyrites provided by the Institute of Geochemistry, Chinese Academy of Sciences, and TangdanCopper Mine, Yunnan, China, respectively. GC was made into slices and the size ofchalcopyrite rangedfromtens of microns to several millimeters. Cpy-1 is a big chalcopyrite aggregation and was carved intosmall pieces, with a size of5 millimeters, to make an epoxy resin target. YN411 consisted of purechalcopyrite particles. Sulfur-bearing solutions used in this work included Spex ((NH4)2SO4 solution from SSpex CertiPrep)and Alfa ((NH4)2SO4 solution from Alfa Aesar). They have a sulfur concentration of 10 000 ppm and werediluted to 10 ppm as in-house standards. In addition, all the solid sulfur-bearing materials were digested andpurified with reference to previously reported procedures2.14 for evaluation by solution MC-ICP-MS. GC,Cpy-1 and fused YN411 were sent to the analytical laboratory of Beijing Research Institute ofUraniumGeology for secondary evaluation by GS-MS. 2.3. Preparation of pressed tablet and melted glass The prepared solid sulfur-bearing materials included pressed powder tablets and glass chalcopyrite. Withthe exception ofIAEA-S-1,IAEA-S-2, and IAEA-S-3 powders, NBS123 and GC were ground to apowder with a major size distribution of 2.5 um, as determined by a Mastersizer 2000 Laser Particle SizeAnalysis System (Fig. 2a). Samples were ground using a ball mill (Retsch PM100) with agate vials usingvarious agate milling ball numbers and sizes. The grinding process was taken from a study producingundiluted nanoparticulate pressed powder tablets for elemental analysis using LA-ICP-MS.2Theprocedure for producing pressed powder tablets was as follows: (i) put the sample with a certain ratio of 2017/3/77Preparation of standards for in situ sulfur isotope measurement in sulfides using femtosecond laser ablation MC-ICP-MS-Journal of Analytical Atomi...sample mass, ball mass, and water volume (1g:17 g:2.5 mL) into an agate vial and grind for 60 min; (ii)after allowing to stand for 30 min, remove the upper water layer using a transfer pipette and dry theremaining sample at 70 ℃; (iii) transfer the powder into a plastic pipe (4 mm diameter, 5 mm thickness)and press into a tablet by applying 15 MPa for 2 min using a Maekawa Press. Fig. 2 Producing processes ofstandards:(a) sizedistribution of powder ground by ball milling. (b)Procedure of melting chalcopyrite; GAC is granularactive carbon and Cpy is chalcopyrite powder. YN411 (chalcopyrite) was converted into a sulfide glass (YN411-m) using the following procedure(Fig.2b):(i) pure and unoxidized chalcopyrite was picked out under a stereoscope, cleaned with Milli-Qwater, and dried in the air; (ii) pure chalcopyrite was ground down until the grain diameter was smaller than15 um; (iii) 1 g ofthe powder was compacted and sealed into a small ceramic crucible (AlO3), and theoperation was complete in a nitrogen-filled chamber; (iv) the small ceramic crucible was set inside a largerone loaded with granular active carbon and put into a KDF-S80 muffle furnace (applied temperature of100-1150℃, filled with nitrogen); (v) the chalcopyrite powder was melted for 3 min at 1000 ℃ under theprotection ofa nitrogen environment; (vi) the liquid melt was poured into iced high purity water with a smallceramic crucible as quickly as possible. The quenching process made the ceramic crucible easy to break,allowing the glass to be separated. GC was made into slices with a thickness of hundreds of micrometers and stuck on a glass. Cpy-1(chalcopyrite crystal) and YN411-m were made into epoxy resin targets. The surfaces ofthe slice andtargets were polished. 2.4. Data processing and calculation Instrument drift and mass bias were corrected using a sample-standard bracketing approach with repeated 2017/3/77Preparation of standards for in situ sulfur isotope measurement in sulfides using femtosecond laser ablation MC-ICP-MS-Journal of Analytical Atomi... measurement of the standard before and after each sample.2.21 Since the most reported 834S values ofIAEA-S-1 were consistent (84SvcDT=-0.3%o),2.11,13,15,37 pu-rpiufriiefdi eIdA EIzAEA-S-1 solution and IAEA-S-1pressed powder tablet were used as the bracketing standard for correcting the in-house standard (Spexsolution) in solution analysis and IAEA-S-2 or IAEA-S-3 pressed powder tablets in in situ analysisrespectively. The 84S of samples relative to IAEA-S-1 was normalized to the Vienna Canon DiabloTroilite (VCDT) scale using the following equation: 8 IAEA-S-1 34S vcDT means the 84S ofIAEA-S-1 is related to VCDT (84SVcDT=-0.3%), andSsampleSiAEA-S-i means the 84S of samples is related to IAEA-S-1. Accurate 84SvcDT values ofthe aforementioned solid sulfur-bearing materials were determined bysolution MC-ICP-MS and GS-MS (Table 2). For replicate analyses, external reproducibility was reportedat the 2SD (standard deviation). Error propagation should be considered when using an in-house standardto correct samples, using the error transfer formula, 2SD=√[(2SDsample)+(2SDstandard)?].220 Table 2 8 34S values for in-house standards using solution MC-ICP-MS and GS-MS Measured 84SvCDT±2SD (%o) Ref. 834SvcDT±2SD (%) Name MC-ICP-MS (solution) GS-MS MC-ICP-MS (solution) GS-MS IAEA-S-2 22.25±0.21 22.44±0.43a 22.64d 22.26±0.426 22.67e 22.30±0.36° 22.24±0.271 IAEA-S-3 -32.28±0.26 -32.29±0.456 -32.05d -32.62±0.62C -32.58±0.21 NBS123 17.75±0.17 17.77±0.26a GC -0.79±0.24 -0.63±0.12 Cpy-1 4.12±0.23 4.3 YN411-m0 0.37±0.24 0.53±0.23 MASS-1 5.60±0.568 a Published data: (Craddock et al.,2008);2(Das et al.,2012);15c(Han et al.,2013);38d(Ding,2001);e(Qi andCoplen, 2003);f(Ono et al.,2012);39g(Fu et al.,2016).19 3. Results and discussion 3.1. Composition and homogeneity of melted glass Fig. 3a presents the back-scattered electron image and major element analysis in map analysis mode ofYN411-m. They clearly indicated that the sulfur concentration in an ablation area (20×150 um) washomogeneous. Single and map analysis of Fe and Cu also showed good uniformity and an elementalcomposition similar to that of natural chalcopyrite. A small amount of Al existed in the cracks ofYN411-m,resulting from contamination with polishing powder. The sulfur isotope homogeneity ofthe glass wasevaluated by self-correcting (by setting YN411-m as the standard and samples simultaneously) using fsLA-MC-ICP-MS. As Fig. 3b shows, measurements were operated in four days' tests. Each session used itsproper spot size range from 10 to 20 um, and the same energy of3 J cm2.35 values were calculated andthe external precision of 834s was 0.28%(2SD). Fig. 3 (a) The left picture is the BSE image, and theright picture is the sulfur map analysis ofYN411-musing an electron probe. (b) Results of long time self-correcting i.e. using YN411-mas the standard andsamples simultaneously show the homogeneity ofYN411-m.The different symbols represent fourmeasurement sessions. Error bars for single analysesare internal precision(1 s). The grey area representsexternal precision (2SD) of35 measurements. 3.2. Sulfur isotopic compositions of pressed pellet and melted glass Solution MC-ICP-MS and GS-MS were used to determine the sulfur isotope composition of theaforementioned samples (Table 2). The good uniformity of results among MC-ICP-MS, GS-MS, andreported values indicated that results obtained in this study were reliable. The former was carried out at theState Key Laboratory of Continental Dynamics using the same MC-ICP-MS (Nu 1700) equipment as insitu analysis. Solution MC-ICP-MS is a relatively mature technology for sulfur isotope measurement andshowed good accuracy and reproducibility during multiple long experiments (Table 2). The 84s result forin-house standard SAlfa (10 ppm(NH4)2SO4 solution), corrected by in-house standard Spex (10 ppm(NH4)2SO4 solution), from 141 data points of 27 experiments was ospexSAlfa=-11.77±0.11%o (2SD),demonstrating excellent reproducibility. The sulfur isotope composition of Spex (834SvcDT=14.7±0.1%)was calibrated by IAEA-S-1 using MC-ICP-MS in multiple experiments. The 84S of sulfur-bearingmaterials was tested relative to Spex and the error propagation from Spex was calculated by the formula mentioned in Section 2.4. a -11.2 Fig. 4 Concentration and acidity effects of solutionMC-ICP-MS. (a) The relationship between 834Svalues and concentration ratios of samples andstandards.(b) The acidity effects on signal intensity;(C) the effects of acidity on precision and accuracy.Error bars for single analyses are internal precision(1 s) and the grey area shows the external precisionofmultiple tests (2SD). 3.3. Changes in 834S caused by differences between the standard andsamples for in situ analysis Due to the complex elemental and physical composition of natural sulfide, it was difficult to make the matrixof the standard identical to that ofthe sample. Therefore, the study ofeffects ruled by sulfur concentration,chemical components, and physical structure was significant in developing an applicable standard. Thefollowing experiments were performed after testing the 84s values of samples calibrated by the matrixmatched standard to avoid instrument induced bias. The first experiment was designed to test the influence of spot size on 834S values of natural sulfide. AsFig. 5 shows, GC and Cpy-1 were set as the standard and sample respectively. The 84S values of Cpy-1showed a tiny increase but still kept the accuracy within the error (84S=4.21±0.23%) when the spotsize was adjusted to 15 um, 20 um and 25 um for the standard and sample simultaneously. This suggested that the spot size only had a slight effect on the 834S values of sulfide minerals, and different spot sizes canbe used to adjust signal intensities in the following experiment. Fig. 5 The influence of spot size on 84S values ofCpy-1. Error bars are external precision (2SD) foreach experiment. The grey area represents accuratevalues within error determined by GS-MS andsolution MC-ICP-MS in this work. The effects resulting from concentration differences were tested by NBS123 crystal analysis (Fig.6).The spot size ofthe standard (NBS123) was 15 um, and spot sizes of samples (NBS123) were changedfrom 10 umto 25 um, so varying signal intensity ratios can beobtained. Fig. 6shows that with thedifference in changes of signal intensities between NBS123 standards and NBS123 samples, 84S valuespresented a trend similar to solution analysis (Fig.4a). The measured 84S values were positively associatedwith Isample/standard ratios and the slope became steeper when the Isample/standard ratio was less than 1.Only when Isample/standard ratios ranged from 0.7 to 1.5 could the deviation in 834S values be less than0.5%. Therefore, an appropriate spot size should be chosen for the standard and samples respectively tomake the signal intensities consistent when the differences in sulfur concentration between standards andsamples were significant. In general, signal intensity could reach 8-15 V using a spot size of 10 um forpyrite and 15 um for chalcopyrite, sphalerite, and AgS pressed powder pellets with a laser fluence of0.5 Jcm-2 Fig. 6 The relationship between 834S values andconcentration ratios of standards and samples for insitu S isotope ratio measurements by analysis ofNBS123 with variant spot size. Matrix elements can affect vaporization and ionization efficiency in the plasma2.13 and may have theirown unique influences on ionization conditions for sulfur isotopes, resulting in poor accuracy when usingnon-matrix-matched calibration. In this paper, research focused on Zn, which was studied in comparisonwith Cu and Fe as matrix elements, to explain the problems when NBS123 (ZnS) is used as a standard tocalibrate other sulfides. It is well known that the interferences of64Zn2+,66Zn2+, and 68Zn?+, on 32S, 33S,and 34S (m/△m =4263, 3907, 6233, respectively) are difficult to resolve with the mass resolution currentlyavailable. Bendall (2006) found that the intensity of Zn?+ was less than 0.2% of that of the S peaks,meaning that its effects could be ignored using a New Wave LUV 213 laser coupled with a Neptune MC-ICP-MS.22 Under the same conditions with fsLA-MC-ICP-MS, including RF power (1300 W), coolingand auxiliary gas flow rate, Zn+productivity was tested by solution MC-ICP-MS. A method for sulfurmeasurement was carried out to test pseudo-S signals ofa solution containing 10 ppm Zn, and the intensityof64Zn2+ was 1.5%o of the S peaks for a 10 ppm sulfur solution. This indicated that Zn?would have alarge influence on 84s values when the matrix contained an equal concentration of Zn and S. Fig. 7 showsthe deviation of 84S, which was less than 0.3%o resulting from Cu and Fe, and reached up to 0.7%resulting from Zn when the solution contained an equal concentration of matrix elements and sulfur.Therefore, it was better to use matrix-matched standards when calibrating sphalerite samples. Fig. 7 8 34S results of solutions with different matrixtypes and concentrations. The abscissa representsmatrix-to-sulfur concentration ratios. Zn elementshows a greater effect than Cu and Fe elements. A difference in physical composition exists between synthetic standards and natural sulfides and it shouldbe verified whether this is a reason for matrix effects. The 84S of powder pressed pellets and naturalsulfide crystals with the same chemical compositions were tested and compared using fsLA-MC-ICP-MS.Under the same laser ablation and mass spectrometry conditions, the spot size was 20 um and the laserfluence was 0.4 J cm2, the 84s value ofNBS123 powder pressed pellets measured by standard-samplebracketing, using the NBS123 mineral crystals as the bracketing standard, was -0.03±0.22%o. The84SvcpT value ofthe GC (chalcopyrite) powder pressed pellet, using Cpy-1 (chalcopyrite) mineralcrystals as the bracketing standard, was -0.50±0.18%o, which was in agreement with the value measuredby solution MC-ICP-MS and GS-MS and within the range ofexperimental error (-0.71±0.20%o, Table3). These results illustrated that the physical structure would not cause matrix effects. Previous studiesconfirmed that the initial aerosol particles ablated by femtosecond and nanosecond laser had differentproperties, including the difference in morphology, size and elemental composition, 27.30.31 as well asdifferent transfer and ionization efficiencies.40.41 However, aerosol particles are similar for differentmaterials, such as metals, nonmetals, and sulfides, when generated by a femtosecond laser.3 Therefore, itcan be inferred that femtosecond laser-induced aerosol sulfide particles from pressed powder and crystalwith the same chemical compositions are uniform and would not cause matrix effects. Table 38 34SvcpT measured for sulfur-bearing materials with different matrixes Pressed powder IAEA- IAEA-S- 22.3±0.3,n= 22.25±0.21丝 0.3 15 0.3 15 pellets S-2 12 IAEA- IAEA-S- -32.3±0.4, n -32.28±0.26 0.3 15 0.3 15 S-3 =16 MASS-IAEA-S-5.5±0.5,n=6 5.60±0.56 0.3 15 0.3 15 Particles NBS123 IAEA-S- 17.8±0.4,n= 17.75±0.174 3 15 3 15 4 NBS123 YN411 17.7±0.3%o,n 3 20 3 20 m =5 GC NBS123 -0.70±0.2, n -0.71±0.20C 3 25 3 20 =5 Cpy-1 GC 4.4±0.3,n=84.21±0.239 3 20 3 20 Sulfide melt YN411- GC 0.4±0.2,n=30.5±0.26 3 15 3 20 m YN411-NBS123 0.6±0.3,n= 3 20 3 20 m 19 Comprehensive results measured by solution MC-ICP-MS and GS-MS. The elemental composition and physical structure ofchalcopyrite glass (YN411-m) is similar to that ofnatural chalcopyrite, as demonstrated by back-scattered electron imaging and major element analysis, whilethe biggest dissimilitude between melted glass and natural minerals was that the crystal structure oftheformer was predominantly broken by the procedure of fusion and quick solidification. An experiment wasperformed to determine the 84s value ofGC (natural chalcopyrite) using Cpy-1 (natural chalcopyrite),YN411-m(chalcopyrite glass) and IAEA-S-1 (Ag2S) as the bracketing standards with the spot size of20um and laser fluence of0.4 J cm2. As shown in Fig. 8, the 834s value ofGC is -0.89±0.56%o, within themeasurement uncertainties, when the standard and sample matrix was natural chalcopyrite. Meanwhile, the834S value ofGC was -1.6±0.30%o with YN411-m as the standard and 0.80±0.26%o with IAEA-S-1as the standard, 0.7% lighter and 1.6% heavier, respectively, than the results of matrix matched analysis.These values suggested that differences in the crystal structure would cause matrix effects, but its impactwas smaller than non-element matching powder pressed pellets (IAEA). According to the process used, incontrast to powder pressed pellets, melted glass was easy to preserve and polish, convenient to use, andnot easily contaminated. Fig. 8 834SvcDT values ofGC using Cpy-1,YN411-m, and IAEA-S-1 as bracketing standards.The grey area represents the external precision (2SD) ofthe measurement using natural chalcopyrite(Cpy-1 and GC) as the standard and sample. 3.4. 8 34SvcpT values of prepared sulfur-bearing materials measured byfsLA-MC-ICP-MS The reliability of measurements can be tested by comparison of measured values with a reference, as shownin Tables 2 and 3. IAEA-S-1 was set as the standard to calibrate IAEA-S-2,IAEA-S-3 and pressedpowder ofNBS123 with a spot size of15 um and laser fluence of0.5 J cm2in one measurement to test84S and 83S. The isotope plot of 834S and 83S (Fig.9) had a slope of0.518, a value similar to the mass-dependent fractionation line, which had a slope of 0.515,20.42 indicating an appropriate result. IAEA-S-2 y=0.5176x+0.1163 R2=0.9994NBS123(P) IAEA-S-1 IAEA-S-3 Fig. 9 A plot of 834S and 83S for the sulfidereference material by laser ablation. IAEA-S-1 wasset as the standard to calibrate IAEA-S-2,IAEA-S-3 and NBS123 pressed powder. A reported study suggested that particle evaporation and phase explosion are the major mechanisms ofablation in fs-LA, and that thermal effects are negligible at low laser fluence due to fast energy depositionand the formation of plasma after the laser pulse ends.30.3l Therefore, thermal effects in various samples arenot the reason for matrix effects. Taking into account the above contrasting experiments, the concentration,elemental composition, and crystal structure were the reasons for the shifted values for non-matrix matchingexperiments. In addition, it was observed that carrier gas flow rate, laser fluence and spot size might resultin sulfur isotope fractionation even though matrixes of the standard and sample were matched well. Inparticular, the results were accurate when the Ar and He flow rates were kept within a range from 0.72 Lmin-l to 0.82 L min-l and 0.65 L min-l to 0.8 L min- respectively. The effects of spot size and laserfluence on pressed powder (IAEA) were larger than on natural crystals. Only laser fluence ranging from 0.3to 1.5 J cm-2 can lead to accurate ratios when testing IAEA series, and the values (834S) increased withlaser fluence. But for chalcopyrite crystals, the values can be accurate even with a fluence of3 J cm2. Webelieved that the impacts of laser fluence and spot size may result from different particles produced byfemtosecond laser and transfer efficiency of the cell we used in this research. The way to avoid valuedeviation in the matrix matched test was to choose suitable Ar and He flow rates, low laser fluence, andsuitable spot size according to the sulfur concentration of materials to keep high transfer efficiency. For thematrix unmatched test, how particles with different matrixes work in ICP is unclear, but we can test thedegree of deviation from the true value for different matrixes and calibrate the results by the laws of laserfluence and spot size. Table 3 shows 84SvcpT of aforementioned standards using fsLA-MC-ICP-MS, forwhich accurate values were obtained with matrix matching and unmatching using same or different operationparameters. When NBS123 and YN411-m are set as the sample and standard, it is easy to obtain correctvalues with the same laser parameters. For instance, considering the value in the fifth line of Table 3, the84SvcpT value ofNBS123 was 17.7±0.28%o using YN411-m as the bracketing standard withparameters of 0.5 J cm2 laser fluence, and 20 um spot size. However, when IAEA is set as the standardto calibrate other materials, the matrix effects were dramatic, so the signal intensity and laser parametersshould be coordinated. As shown in line 4 of Table 3, when the signal difference between NBS123 andIAEA-S-1 was 40%, the 84SvcDT value ofNBS123 against IAEA-S-1 was 17.8±0.38%o withparameters of3 J cm-2laser fluence, and 15 um spot size. For the materials with similar signal intensities,different spot sizes were used to obtain correct values. The 84SvcpT value ofGC in the sixth line of Table3, for example, was correct and obtained with 25 um spot size for GC and 20 um spot size for NBS123. 4. Conclusion The fsLA-MC-ICP-MS technique showed obvious advantages for improving the sensitivity and spatialresolution in in situ sulfur isotope analysis. A signal of 8-20 V could be achieved with a spot size of10-20um. A series of sulfur-bearing materials with different matrixes were prepared as in-house standards bypowder-pressing and sulfide-melting under high temperatures with a protective N2 atmosphere. Back-scattered electron images and major element analysis in map analysis mode of YN411-m indicated that the 2017/3/77Preparation of standards for in situ sulfur isotope measurement in sulfides using femtosecond laser ablation MC-ICP-MS-Journal of Analytical Atomi...concentration of sulfur in an ablation area was homogeneous. Multiple experiments were conducted forhomogeneity tests ofYN411-m by fsLA-MC-ICP-MS and the external precision was 0.28%o(n=35).We conducted a series ofexperiments to study the matrix effects of these sulfur-bearing materials and foundthat differences in concentration, elemental composition, and crystal structure between standards andsamples caused the shifted values. Furthermore, differences in elemental composition made values worsethan differences in the crystal structure, resulting in a value much closer to the reference when usingYN411-m as the bracketing standard to calibrate chalcopyrite instead ofIAEA-S-1. Considering theprocess used, melted glass was easy to preserve and polish, convenient to use, and not easily contaminated;more importantly, it had less matrix effects than the IAEA-S-1 powder pressed pellet and was, therefore,more suitable for in situ sulfur isotope analysis. Acknowledgements Financial support for this work was jointly provided by the National Natural Science Foundation of China(Grant No. 41427804, 41421002,41373004), the Program for Changjiang Scholars and InnovativeResearch Team in University (Grant No. IRT1281), and the MOST Research Foundation from the StateKey Laboratory of Continental Dynamics (BJ08132-1). References ( 1. H. G. Thode, Geochim. Cosmochim. Acta, 1961, 25 , 150-174 CrossRef ) 2. P.R. Craddock, O. J. Rouxel, L. A. Ball and W. Bach, Chem. Geol.,2008,253,102-113,DOI10.1016/j.chemgeo.2008.04.017 ( 3. R . R. Seal, Rev. Mineral. Geochem., 2006, 61, 6 3 3-677, DOI: 10.2138/rmg.2006.61.12 ) ( 4. 4 J. Hoefs, Stable Isotope Geochemistry, Springer Ver S earch Pub Med lag, 3r d edn, 1987 5 ) 5. Y. Ozen and F. Arik, Ore Geol. Rev., 2015,70,262-280, DOI:10.1016/j.oregeorev.2015.04.001 6. N.J. Hill,G. R. T. Jenkin, A. J. Boyce, C. J. S. Sangster,D. J. Catterall, D. A. Holwell, J. Nadenand C. M. Rice, How the Neoproterozoic S-isotope record illuminates the genesis ofvein goldsystems: an example from the Dalradian Supergroup in Scotland,Geological Society, SpecialPublications, London, 2013, vol.393, pp.213-247, DOI:110.1144/sp393.9. 7. M. Chen, Z. Zhang, M. Santosh, Y. Dang and W. Zhang, J. Asian Earth. Sci., 2015, 103,115-128, DOI:110.1016/j.jseaes.2014.08.022 8. M.C. Stam, P. R. D. Mason, C. Pallud and P. Van Cappellen, Chem. Geol.,2010,278,23-30,DOII10.1016/j.chemgeo.2010.08.006 9. R. Tostevin, A. V. Turchyn, J. Farquhar, D. T. Johnston, D. L. Eldridge,J. K. B. Bishop and M.McIlvin, Earth Planet. Sci. Lett., 2014, 396, 14-21, DOI:10.1016/j.epsl.2014.03.057 10. F. Fourel, F. Martineau, M. Seris and C. Lecuyer, Geostand.Geoanal.Res.,2015,39,47-53,DOI10.1111/j.1751-908x.2014.00297.x 11. H. P. Qiand T. B. Coplen, Chem. Geol.,2003,199,183-187, DOI:10.1016/s0009-2541(03)00075-5. 12. R. Clough, P. Evans, T. Catterick and E. H. Evans, Anal. Chem., 2006, 78, 6126-6132, 2017/3/77Preparation of standards for in situ sulfur isotope measurement in sulfides using femtosecond laser ablation MC-ICP-MS- Journal of Analytical Atomi... DOI:10.1021/ac060875h 13. M.J. Pribil, W. I. Ridley and P. Emsbo, Chem. Geol.,2015,412,99-106,DOI:10.1016/j.chemgeo.2015.07.014 14. G. Paris, A. L. Sessions, A. V. Subhas and J. F. Adkins, Chem. Geol.,2013,345,50-61,DOI:10.1016/j.chemgeo.2013.02.022 15. A. Das, C.-H. Chung, C.-F. You and M.-L. Shen, J. Anal. At. Spectrom., 2012,27,2088, 10.1039/c2ja30189j 16. S. Ono, B. Wing, D. Rumble and J. Farquhar, Chem. Geol., 2006,225,30-39,DOI:10.1016/j.chemgeo.2005.08.005 17.T.Ushikubo,K. H. Williford, J. Farquhar, D. T. Johnston, M. J. Van Kranendonk and J. W. Valley,Chem. Geol.,2014,383,86-99, DOI: 10.1016/j.chemgeo.2014.06.006 18. R. Kozdon,N. T.Kita, J. M. Huberty, J. H. Fournelle, C. A. Johnson and J. W. Valley, Chem.Geol.,2010,275,243-253, DOI: 10.1016/j.chemgeo.2010.05.015 19. J. Fu, Z. Hu, W. Zhang, L. Yang, Y. Liu, M. Li, K. Zong, S. Gao and S. Hu, Anal. Chim. Acta,2016,911,14-26,DOI: 10.1016/j.aca.2016.01.026 20. B. Bihn,R. V. Santos, M. A. Dardenne and C. G. de Oliveira, Chem. Geol., 2012,312-313,163-176, DOI: 10.1016/j.chemgeo.2012.04.003 21. P.R. D. Mason, J.Kosler, J. C. M. de Hoog, P. J. Sylvester and S. Meffan-Main, J. Anal. At.Spectrom.,2006, 21,177-186,110.1039/b510883g 22. C. Bendall, Y. Lahaye, J. Fiebig, S. Weyer and G. P. Brey, Appl. Geochem., 2006, 21,782-787,DOI: 10.1016/j.apgeochem.2006.02.012 23. D. Garbe-Schonberg and S. Miiller,J. Anal. At. Spectrom.,2014,29,990,10.1039/c4ja00007b 24. S. A. Wilson, W. I. Ridley and A. E. Koenig, J. Anal. At. Spectrom., 2002,17,406-409,10.1039/b108787h 25. A. Fiege, F. Holtz, N. Shimizu, C. W. Mandeville, H. Behrens and J. L. Knipping, Geochim.Cosmochim. Acta, 2014,142,501-521, DOI:10.1016/j.gca.2014.07.015 26. Y. Kajiwara and H. R. Krouse, Can. J. Earth Sci., 1971,8,1397-1408CrossRefCAS 27. S. E. Gilbert, L. V. Danyushevsky, T. Rodemann, N. Shimizu, A. Gurenko, S. Meffre, H. Thomas, R. R. Large and D. Death, J. Anal. At. Spectrom., 2014, 29,1042-1051,10.1039/c4ja00011k28. D. E. Crowe and R. G. Vaughan, Am. Mineral., 1996, 81,187-193, DOI:10.10/00on 29. X. P. Bian, T. Yang, A. J. Lin and S. Y. Jiang, Talanta, 2015,132,8-14,DOI: 10.1016/j.talanta.2014.08.053 30. R. Glaus, R. Kaegi, F. Krumeich and D. Gunther, Spectrochim. Acta, Part B, 2010, 65,812-822,DOI:10.1016/j.sab.2010.07.005 31. M. E. Shaheen, J. E. Gagnon and B. J. Fryer,Spectrochim. Acta, Part B, 2015,107,97-109,DOI:10.1016/j.sab.2015.02.010| 32. C.C. Garcia, H. Lindner, A. von Bohlen, C. Vadla and K. Niemax,J. Anal. At. Spectrom., 2008,23,470-478,10.1039/b718845e 2017/3/77Preparation of standards for in situ sulfur isotope measurement in sulfides using femtosecond laser ablation MC-ICP-MS-Journal of Analytical Atomi... 33. G. Steinhoefel, I. Horn and F. von Blanckenburg, Chem. Geol., 2009, 268,67-73,DOI:10.1016/j.chemgeo.2009.07.010 34. M. Lazarov and I. Horn, Spectrochim. Acta, Part B, 2015, 111, 64-73,DOI: 10.1016/j.sab.2015.06.013 35. H. Yuan, K. Chen, B. ZhiAn, C. Zong, M. Dai, C. Fan and C. Yin, Chin. Sci. Bull.,2013,58,3914-3921, DOI: 10.1007/s11434-013-5804-4 36. K. Ikehata, K. Notsu and T. Hirata, J. Anal. At. Spectrom., 2008, 23,1003,10.1039/b801044g 37. T. Ding, S. Valkiers, H. Kipphardt, P. De Bievre, P. D. P. Taylor, R. Gonfiantini and R. Krouse,Geochim. Cosmochim. Acta,2001,65,2433-2437 CrossRefCAS 38. S.-H. Han, Z. Varga, J. Krajko, M. Wallenius, K. Song and K. Mayer, J. Anal. At. Spectrom.,2013,28,1919,10.1039/c3ja50231g 39. S. Ono, N. S. Keller, O. Rouxel and J. C. Alt, Geochim. Cosmochim. Acta,2012,87,323-340,DOI:10.1016/j.gca.2012.04.016 40. S.E. Gilbert, L. V. Danyushevsky, K. Goemann and D. Death, J. Anal. At. Spectrom., 2014,29,1024-1033,10.1039/c4ja00012a 41. P. Sylvester, Laser-Ablation-ICPMS in the Earth Sciences, Canadian Mineral Association,2001sSearch PubMed 42. D. T. Johnston, Earth-Sci. Rev.,2011,106, 161-183, DOI: 10.1016/j.earscirev.2011.02.003 This journal is C The Royal Society of Chemistry 2017 ttp://pubs.rsc.org/en/content/articlehtml/JA/CJA 在使用标准样品进行原位微区硫同位素测定时,我们制备了一系列粉末压片和黄铜矿玻璃标准样品来纠正质量偏差。采用飞秒激光剥蚀多收集器电感耦合等离子体质谱法(fsLA-MC-ICP-MS)测定了标准样品的硫同位素组成。黄铜矿玻璃(YN411-m)是将黄铜矿在N2保护条件下于1000°C融化,然后快速淬火制成。采用fsLA-MS-ICP-MS对YN411-m进行了多次均匀性测定,外部精度为0.28‰(n = 35)。当测定黄铜矿(GC)δ34S时,使用矿物颗粒、粉末压片、黄铜矿玻璃片作为标准。结果表明,基体效应是由浓度、元素组成和晶体结构引起的。从实用性考虑,熔融玻璃比粉状压片更合适作为标准样品。我们还发现载气流量、激光通量和光斑尺寸对结果的规律性有影响。因此,我们可以不使用匹配的标准样品,通过调整激光和MC-ICP-MS的参数来获得准确的δ34S结果。此外,fsLA-MC-ICP-MS由于可以极大地提高灵敏度、空间分辨率(10 - 20μm)因此非常有利于原位微区硫同位素测定。可以通过分析较小的矿物微区,特别是成矿后期充填的硫化物矿物,来解释多成因矿床的成因
确定
还剩19页未读,是否继续阅读?

产品配置单
上海凯来仪器有限公司为您提供《硫化物中原位微区硫同位素检测方案(激光剥蚀进样)》,该方案主要用于其他中含量分析检测,参考标准--,《硫化物中原位微区硫同位素检测方案(激光剥蚀进样)》用到的仪器有ESLfemto 飞秒激光剥蚀系统
推荐专场