


为了研究海洋中微量金属的生物地球化学循环,需要一种能够同时分析痕量和超痕量多种元素的快速、自动化、高通量分析方法。这里我们提出一个分析方法使用商用自动预浓缩设备(SeaFAST)准确体积加载和在线pH缓冲的样本在装船前螯合树脂和光)(kouichi和随后的同步分析铁(Fe)、锌(锌)、铜(铜)、镍(镍)、镉(Cd)、铅(Pb),钴(Co)和锰(Mn)highresolution电感耦合等离子体质谱法(HR-ICP-MS)。采用同位素稀释法测定样品中Fe、Zn、Cu、Ni、Cd、Pb的含量,标准添加Co、Mn。结果表明,该螯合树脂对所有分析元素均具有较高的亲和力,除Mn(60%)和Ni(48%)外,其余元素的回收率均在83 ~ 100%之间,与NOBIAS螯合- pa1树脂相比,Ni、Cd、Pb、Co、Mn的回收率较高。采用WAKO树脂对镍和锰的还原回收率不影响定量精度。在较大pH范围(pH 5e8)内,除Mn外,其他微量金属的保留效率相对稳定。Mn量化使用标准除了要求准确样品酸度与*恢复调整7.5±0.3。紫外消解使海水中Co和Cu的回收率分别提高了15.6%和11.4%,达到了对添加的含钴维生素B12复合物的充分分解。使用高纯试剂可以达到较低的空白水平和检测限(如0.029 nmol L“1为Fe, 0.028 nmol L”1为Zn)。采用安全S、D1及D2参考海堤进行精度及准确度评估,所得结果与现有共识值一致。该方法适用于沿海和海洋海域微量元素的高通量同时分析。我们成功地应用了
对2014年6月在大西洋东北部采集的样品的分析方法
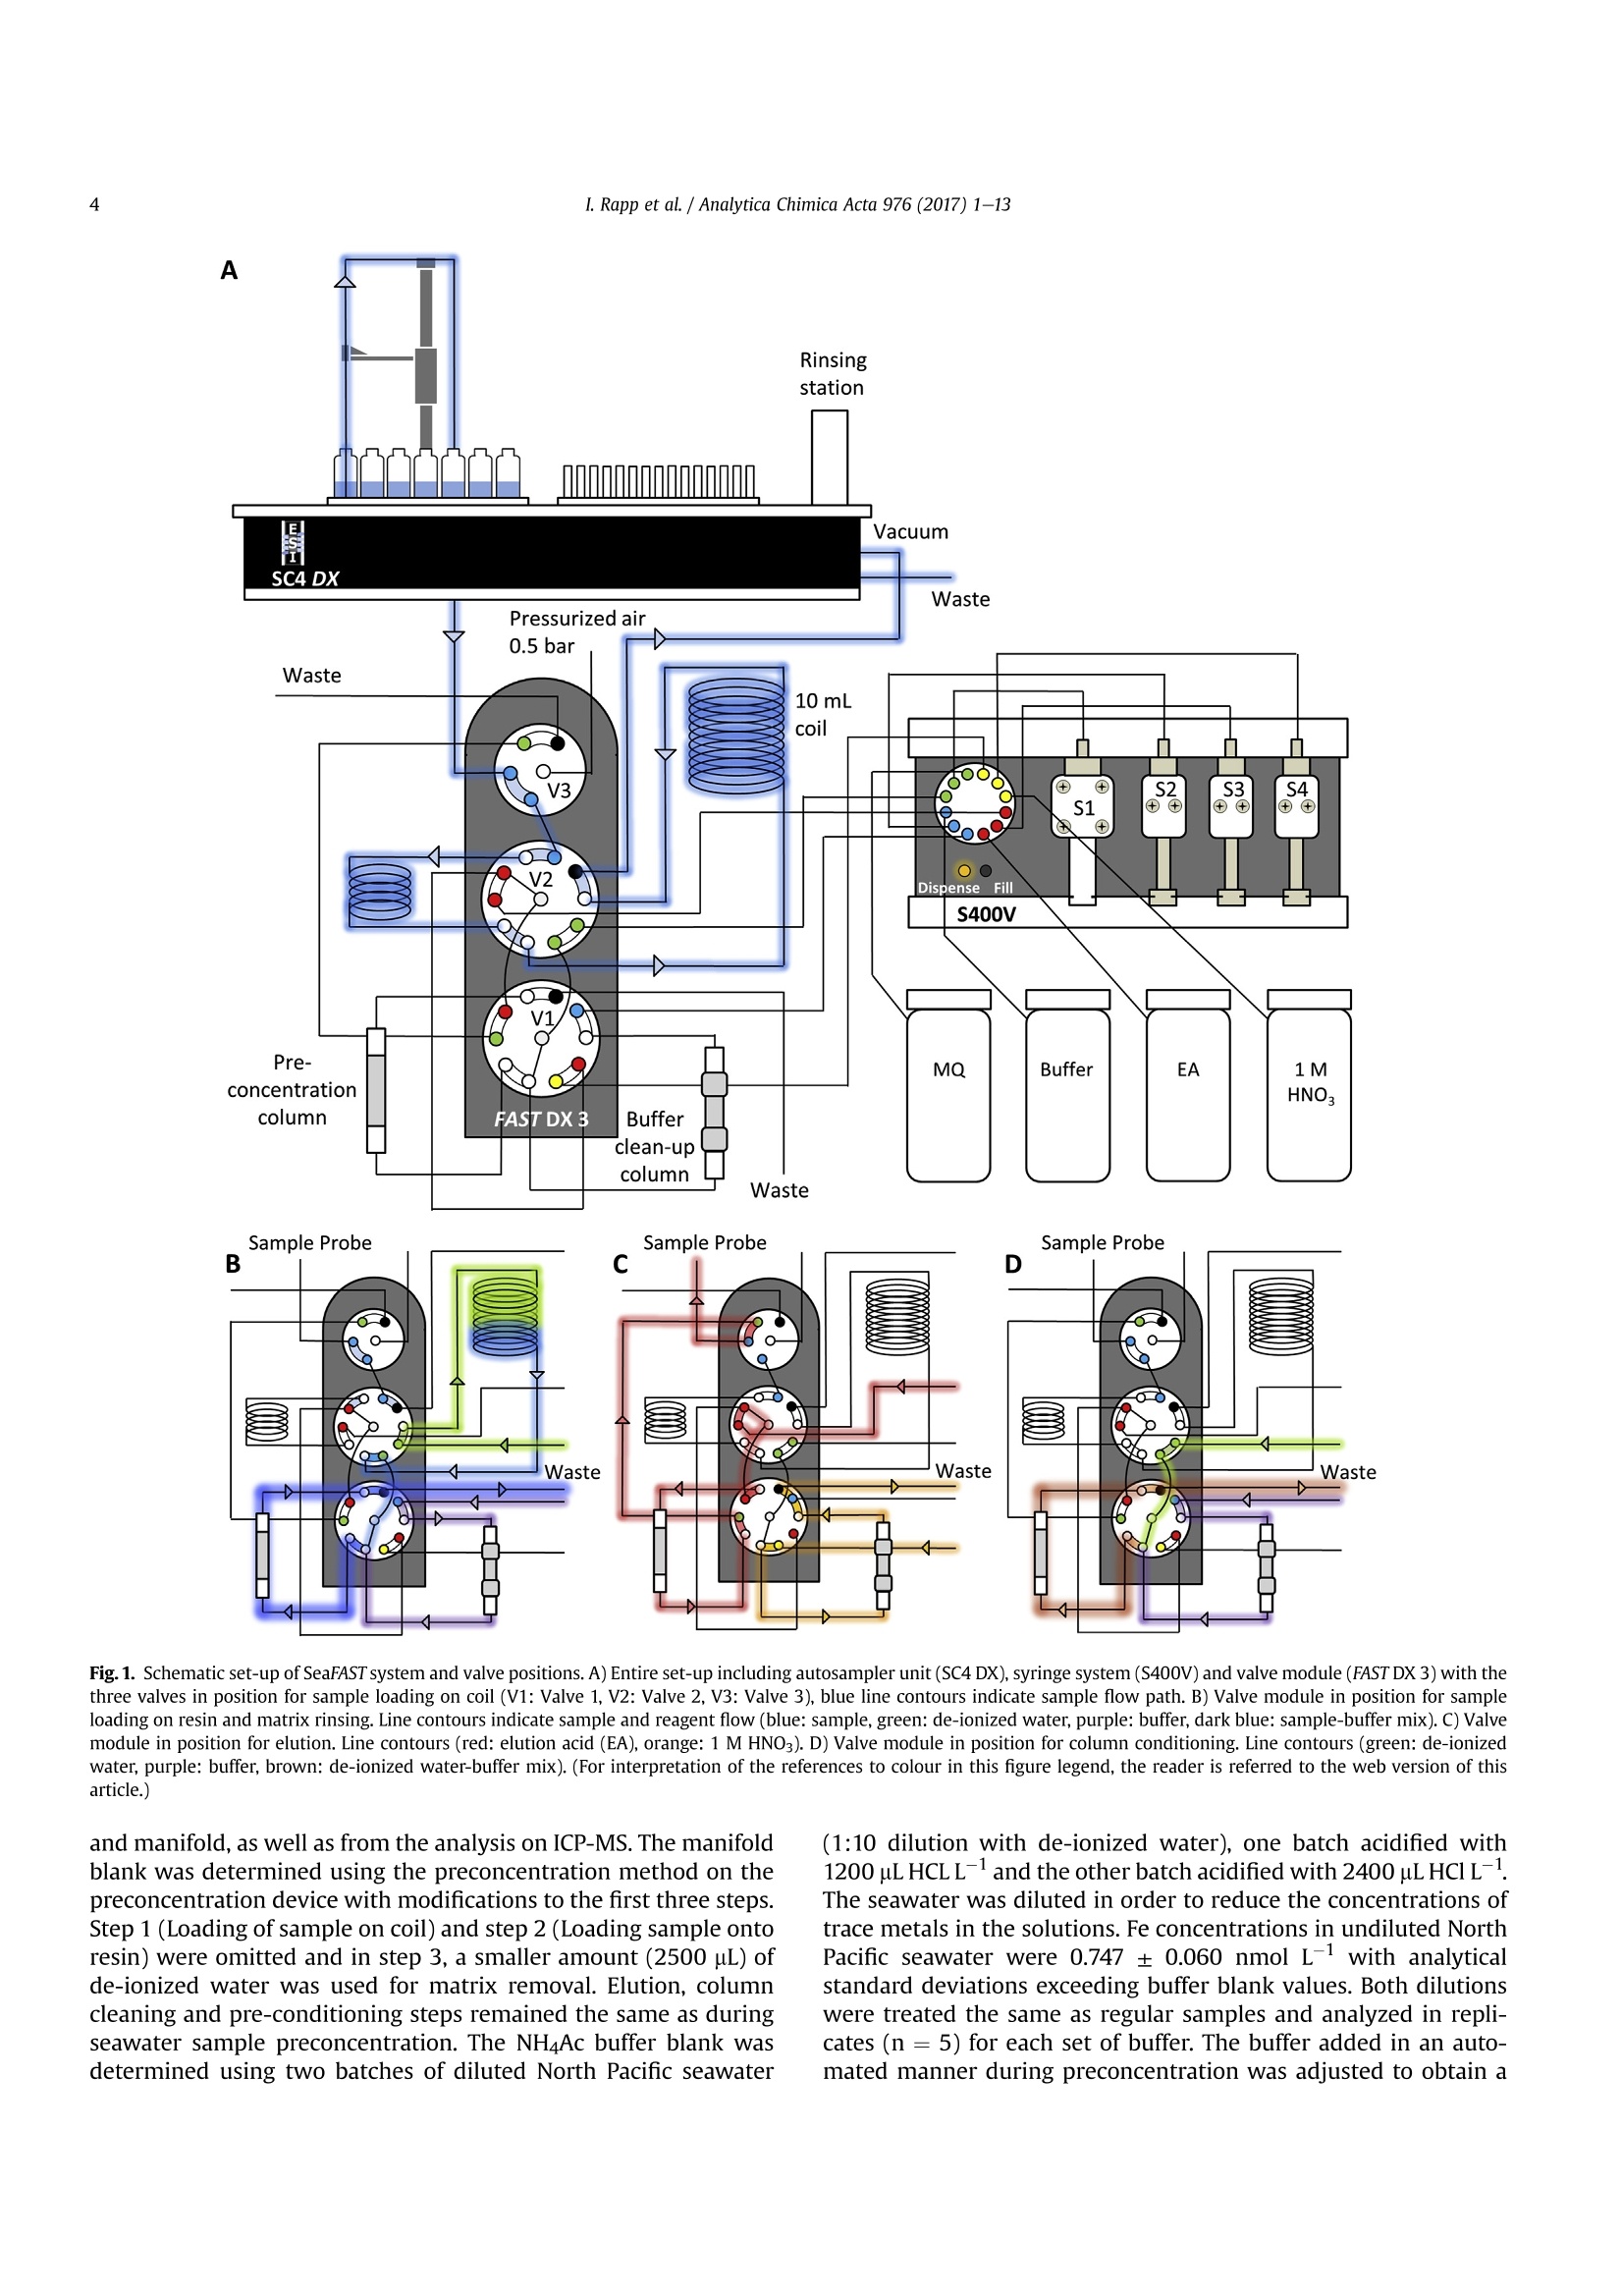
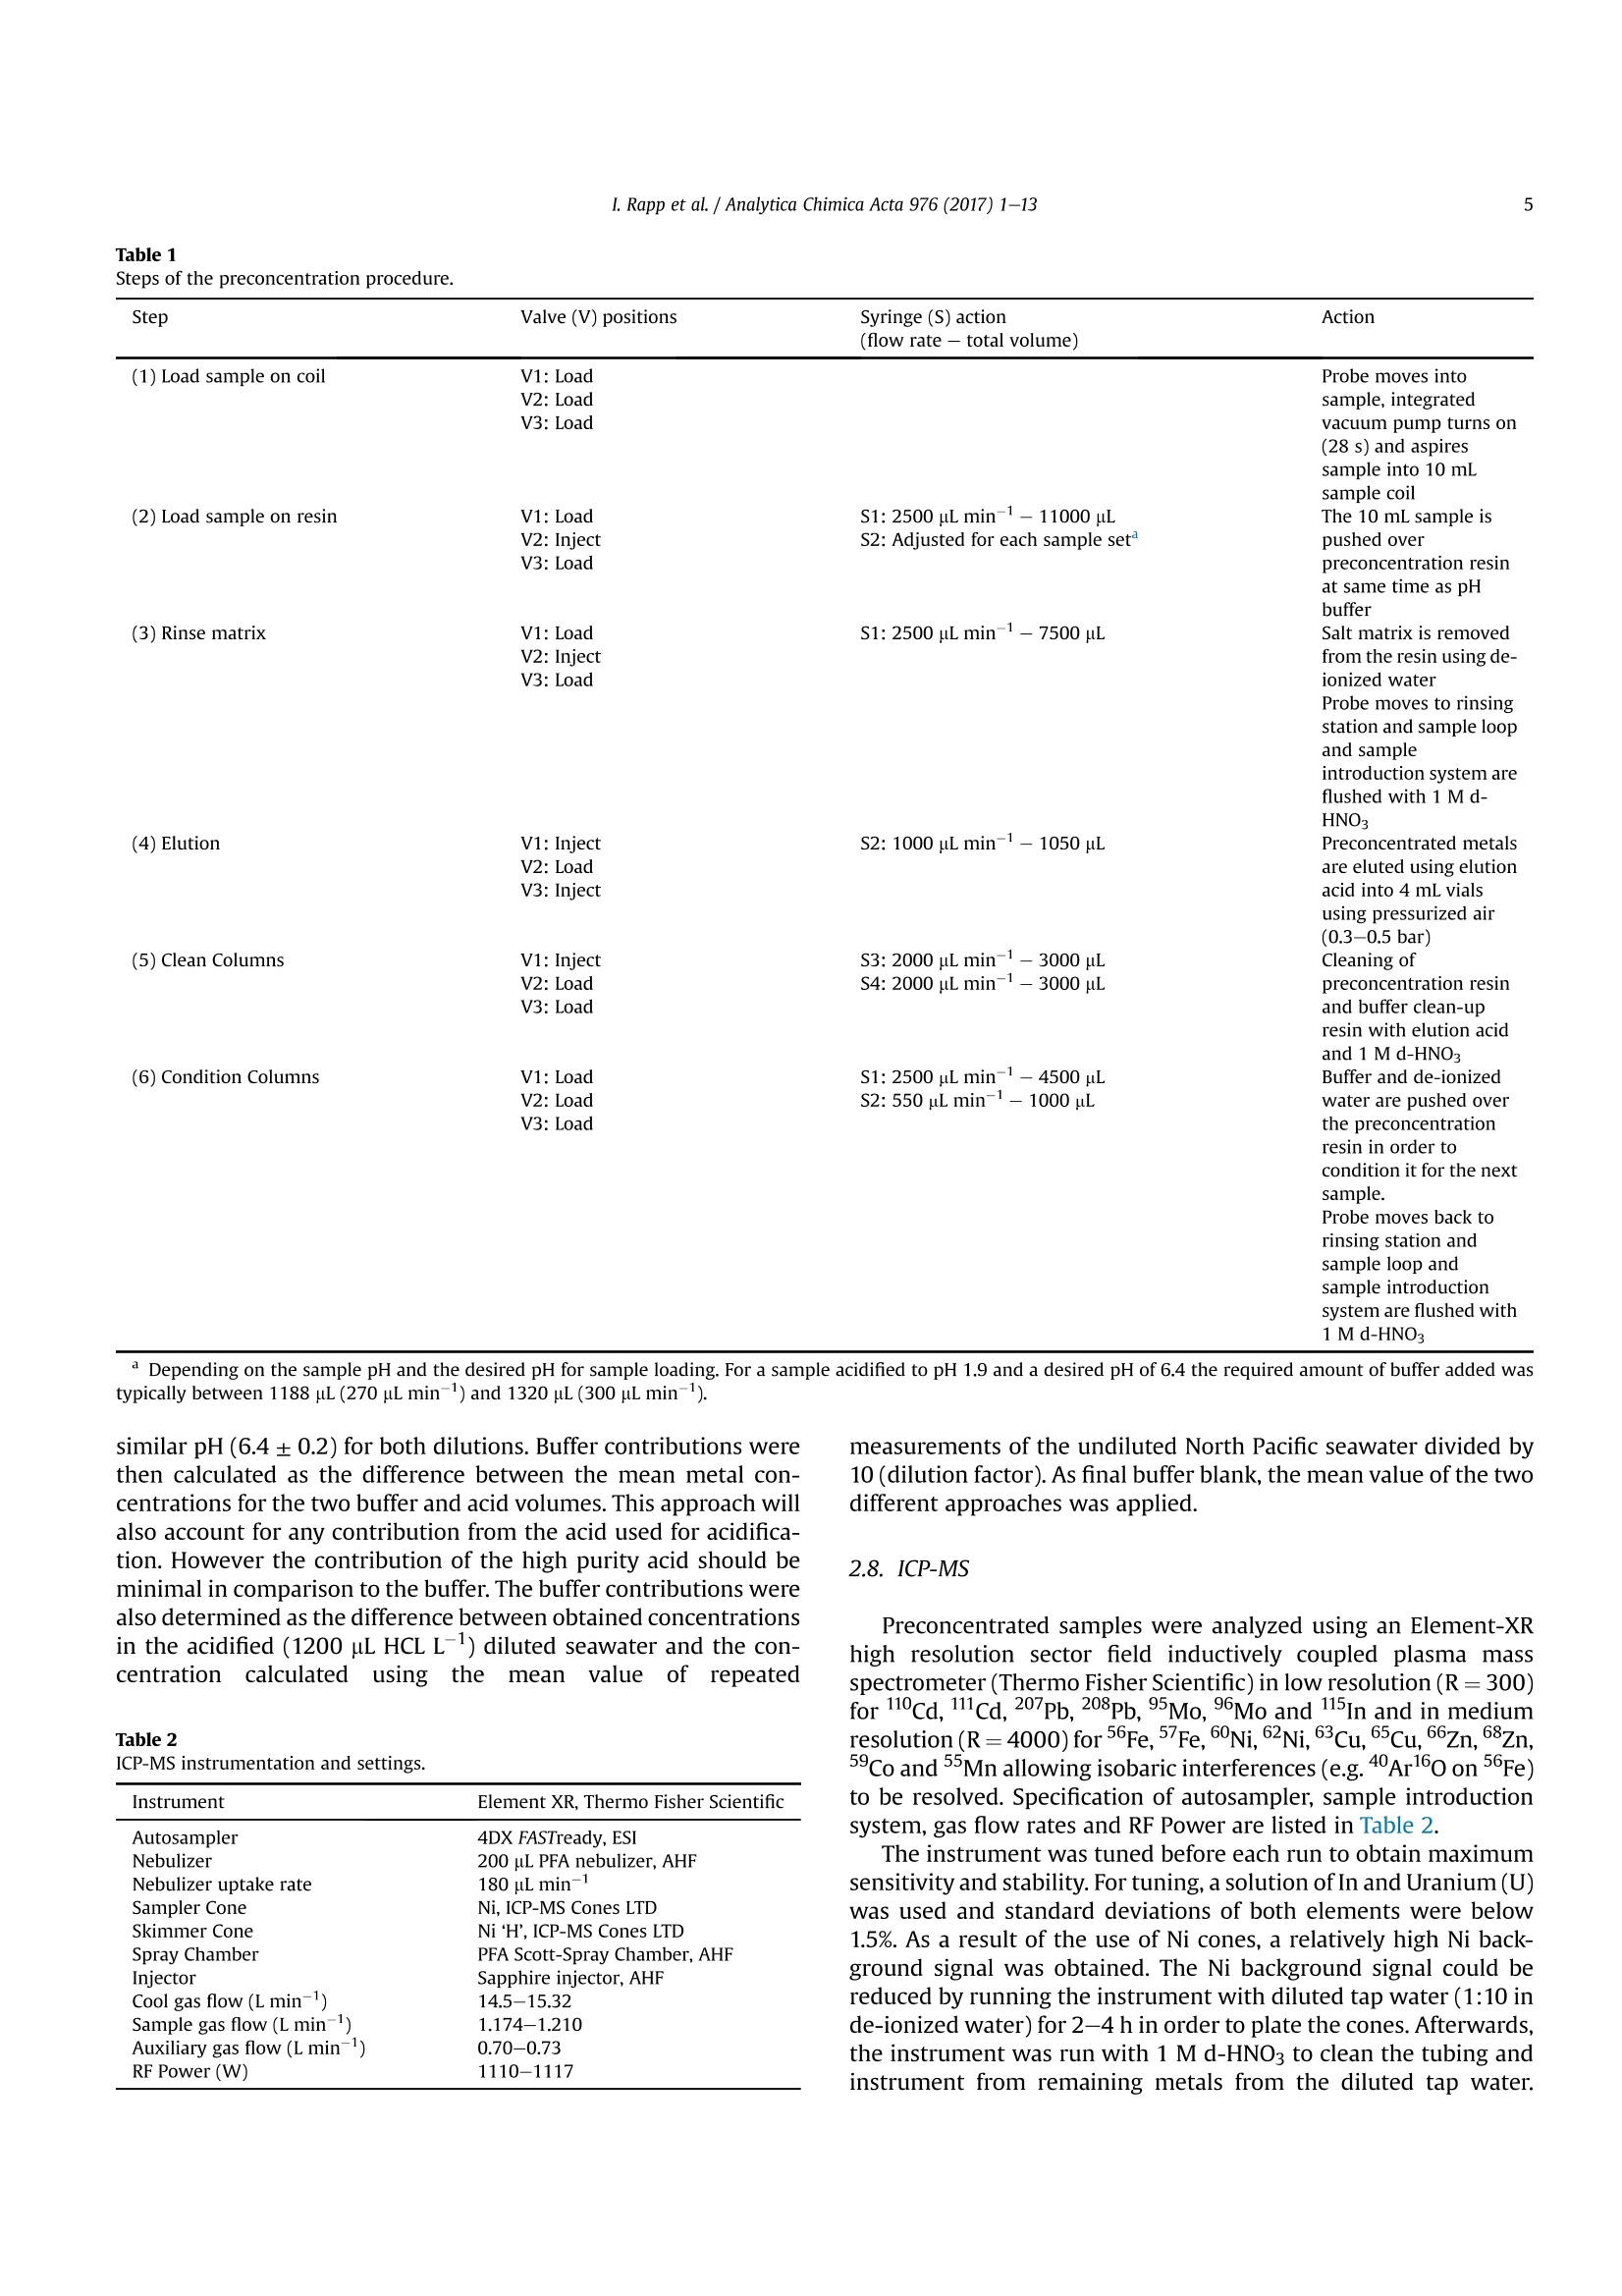
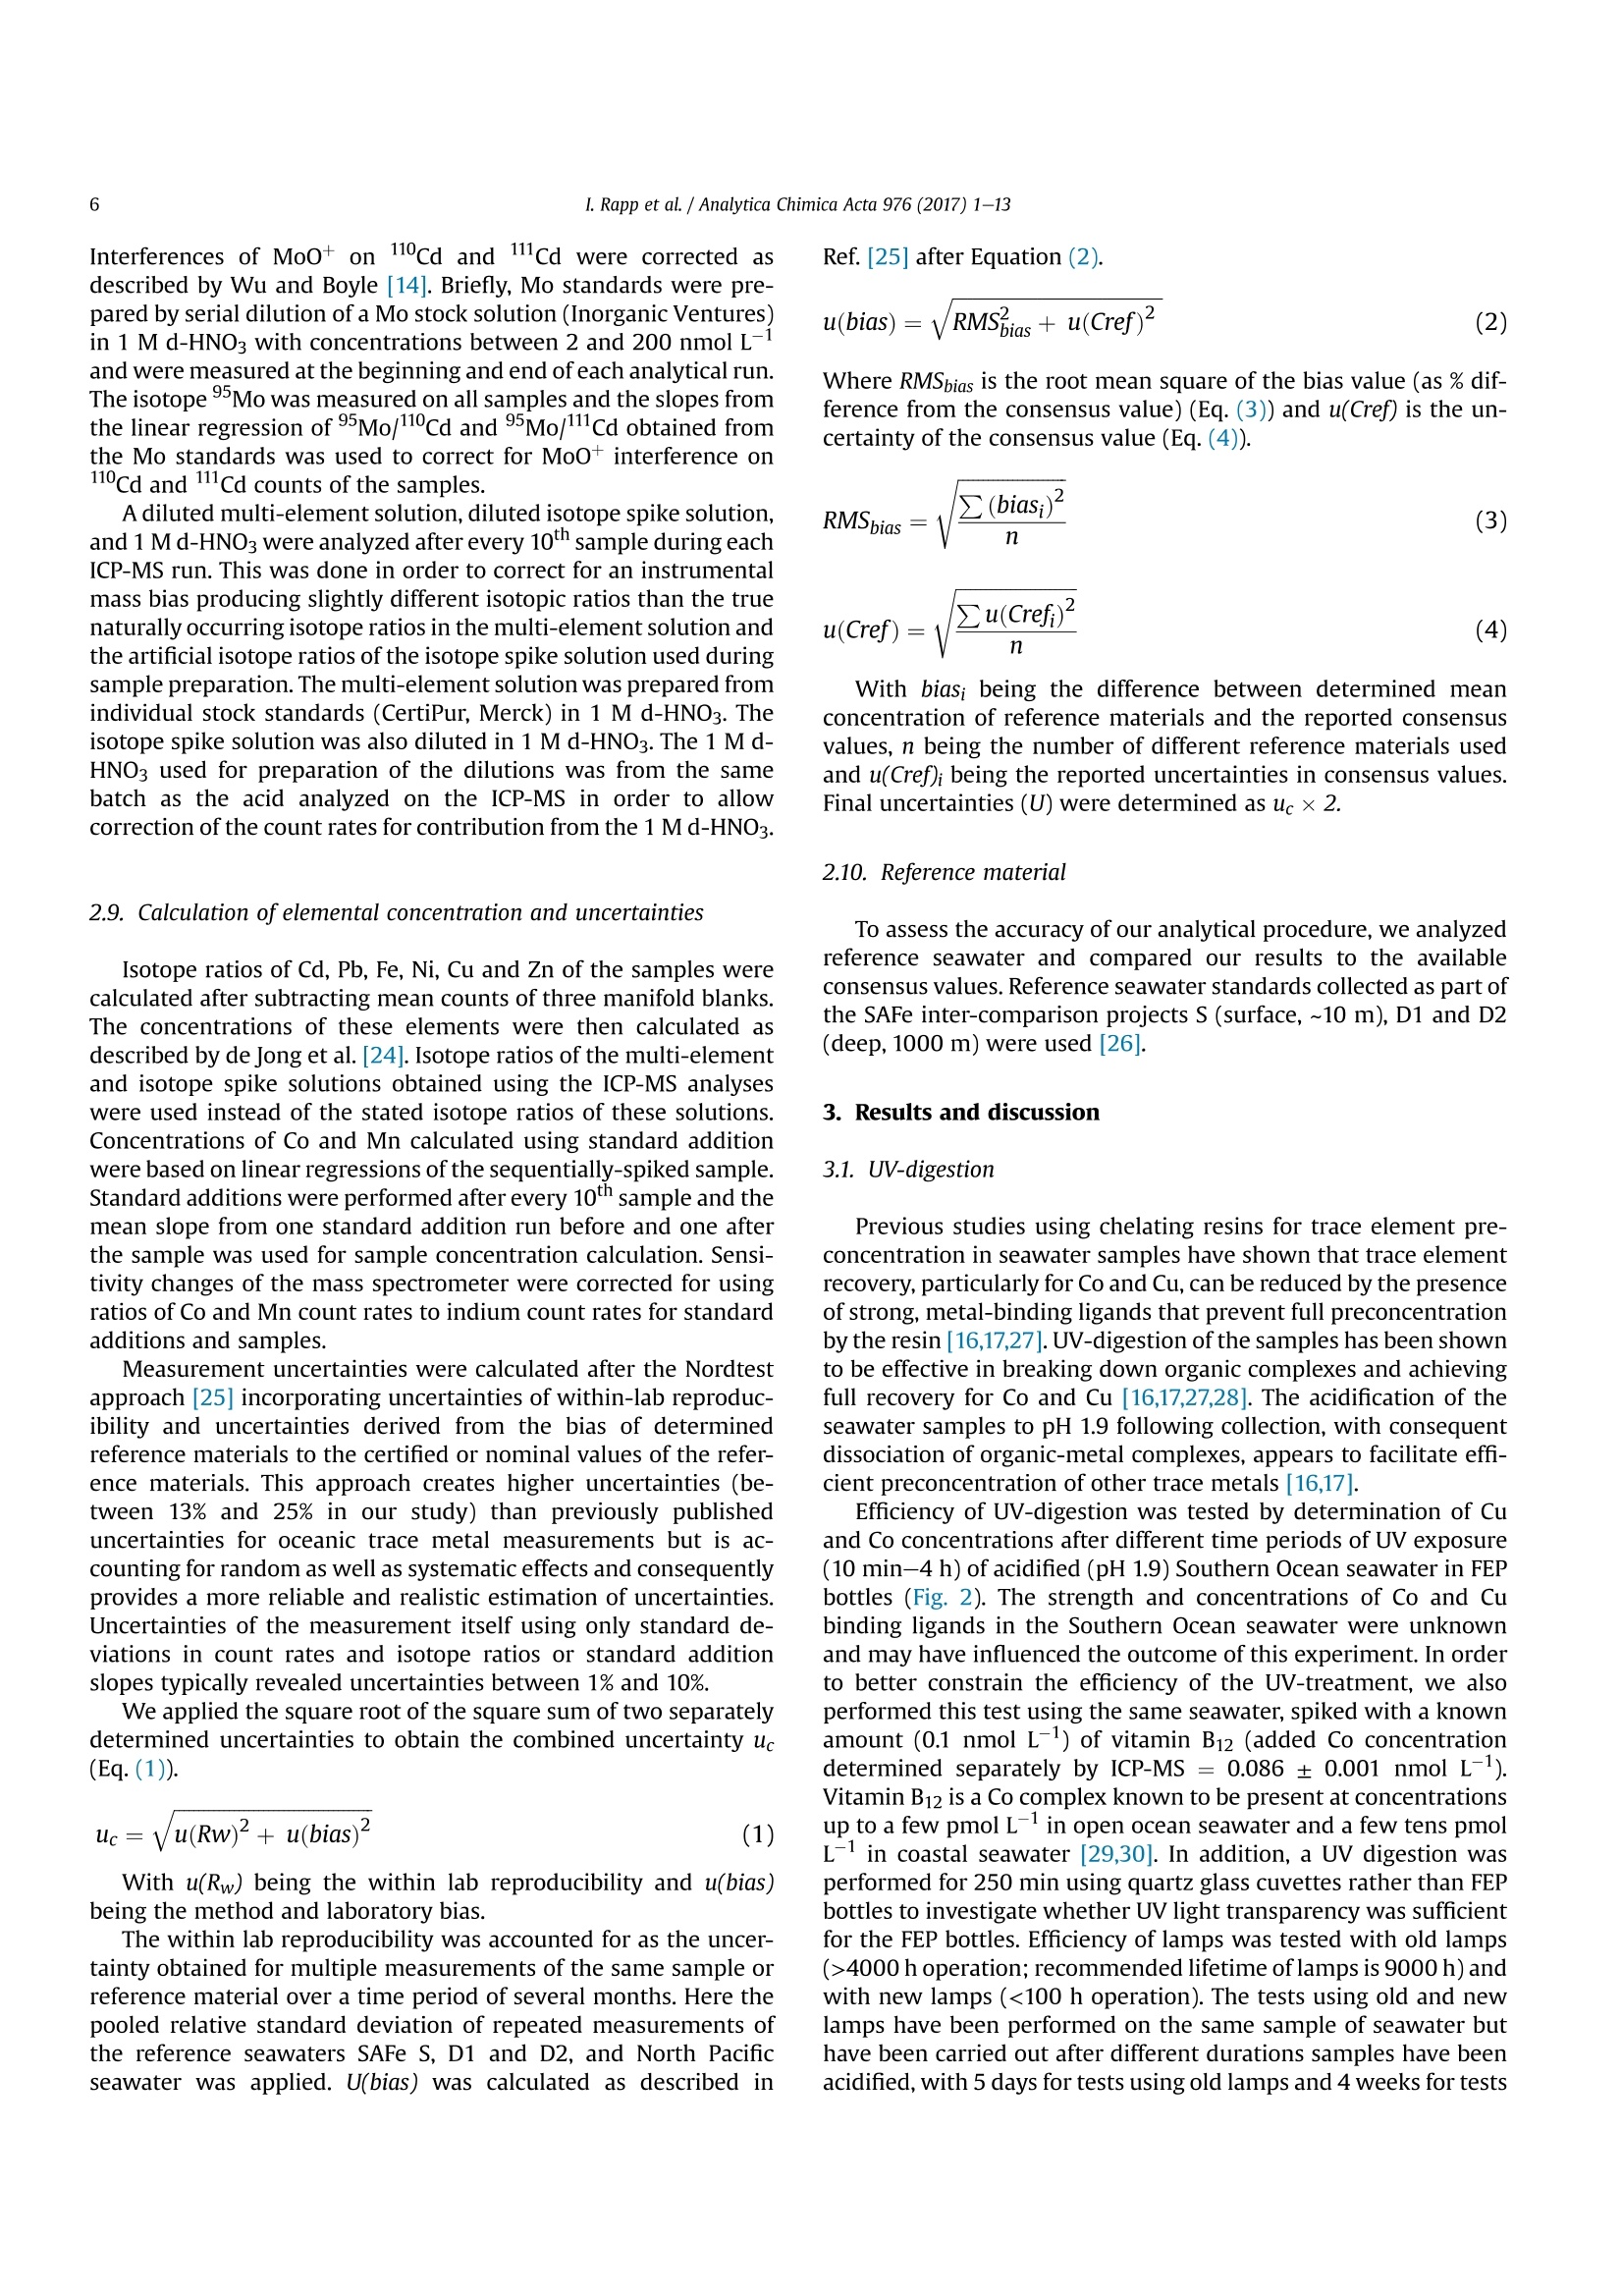
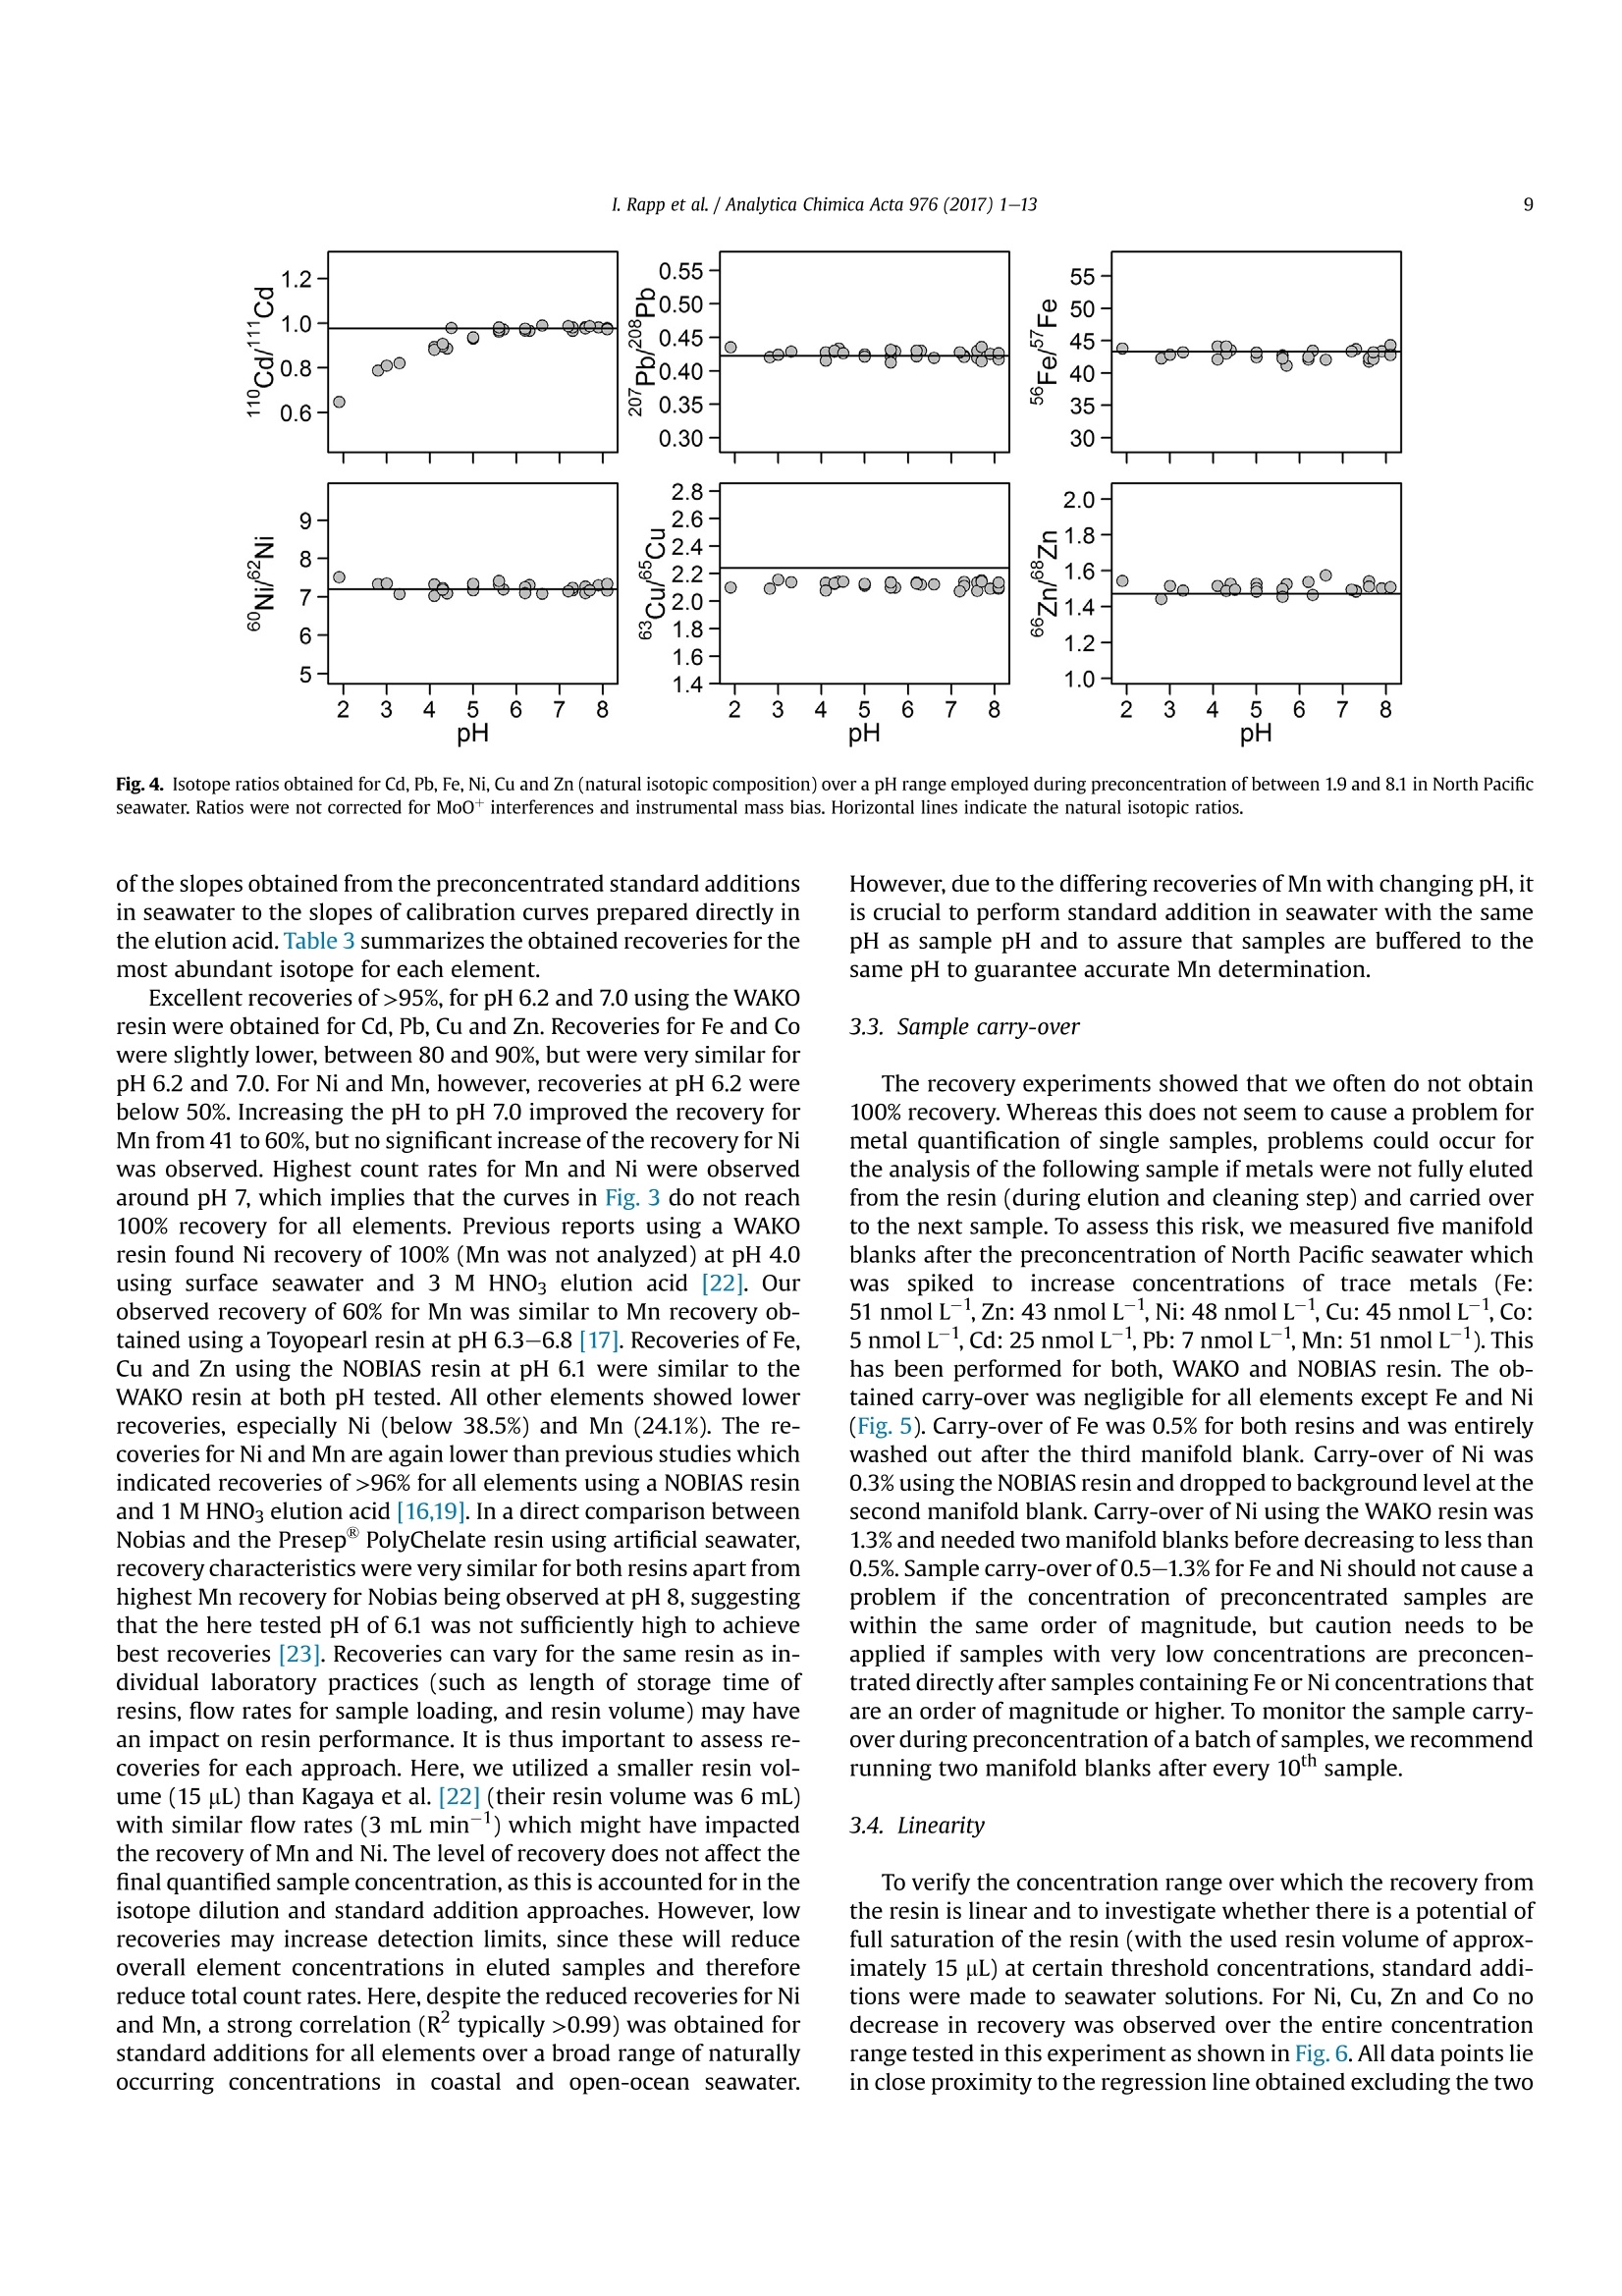
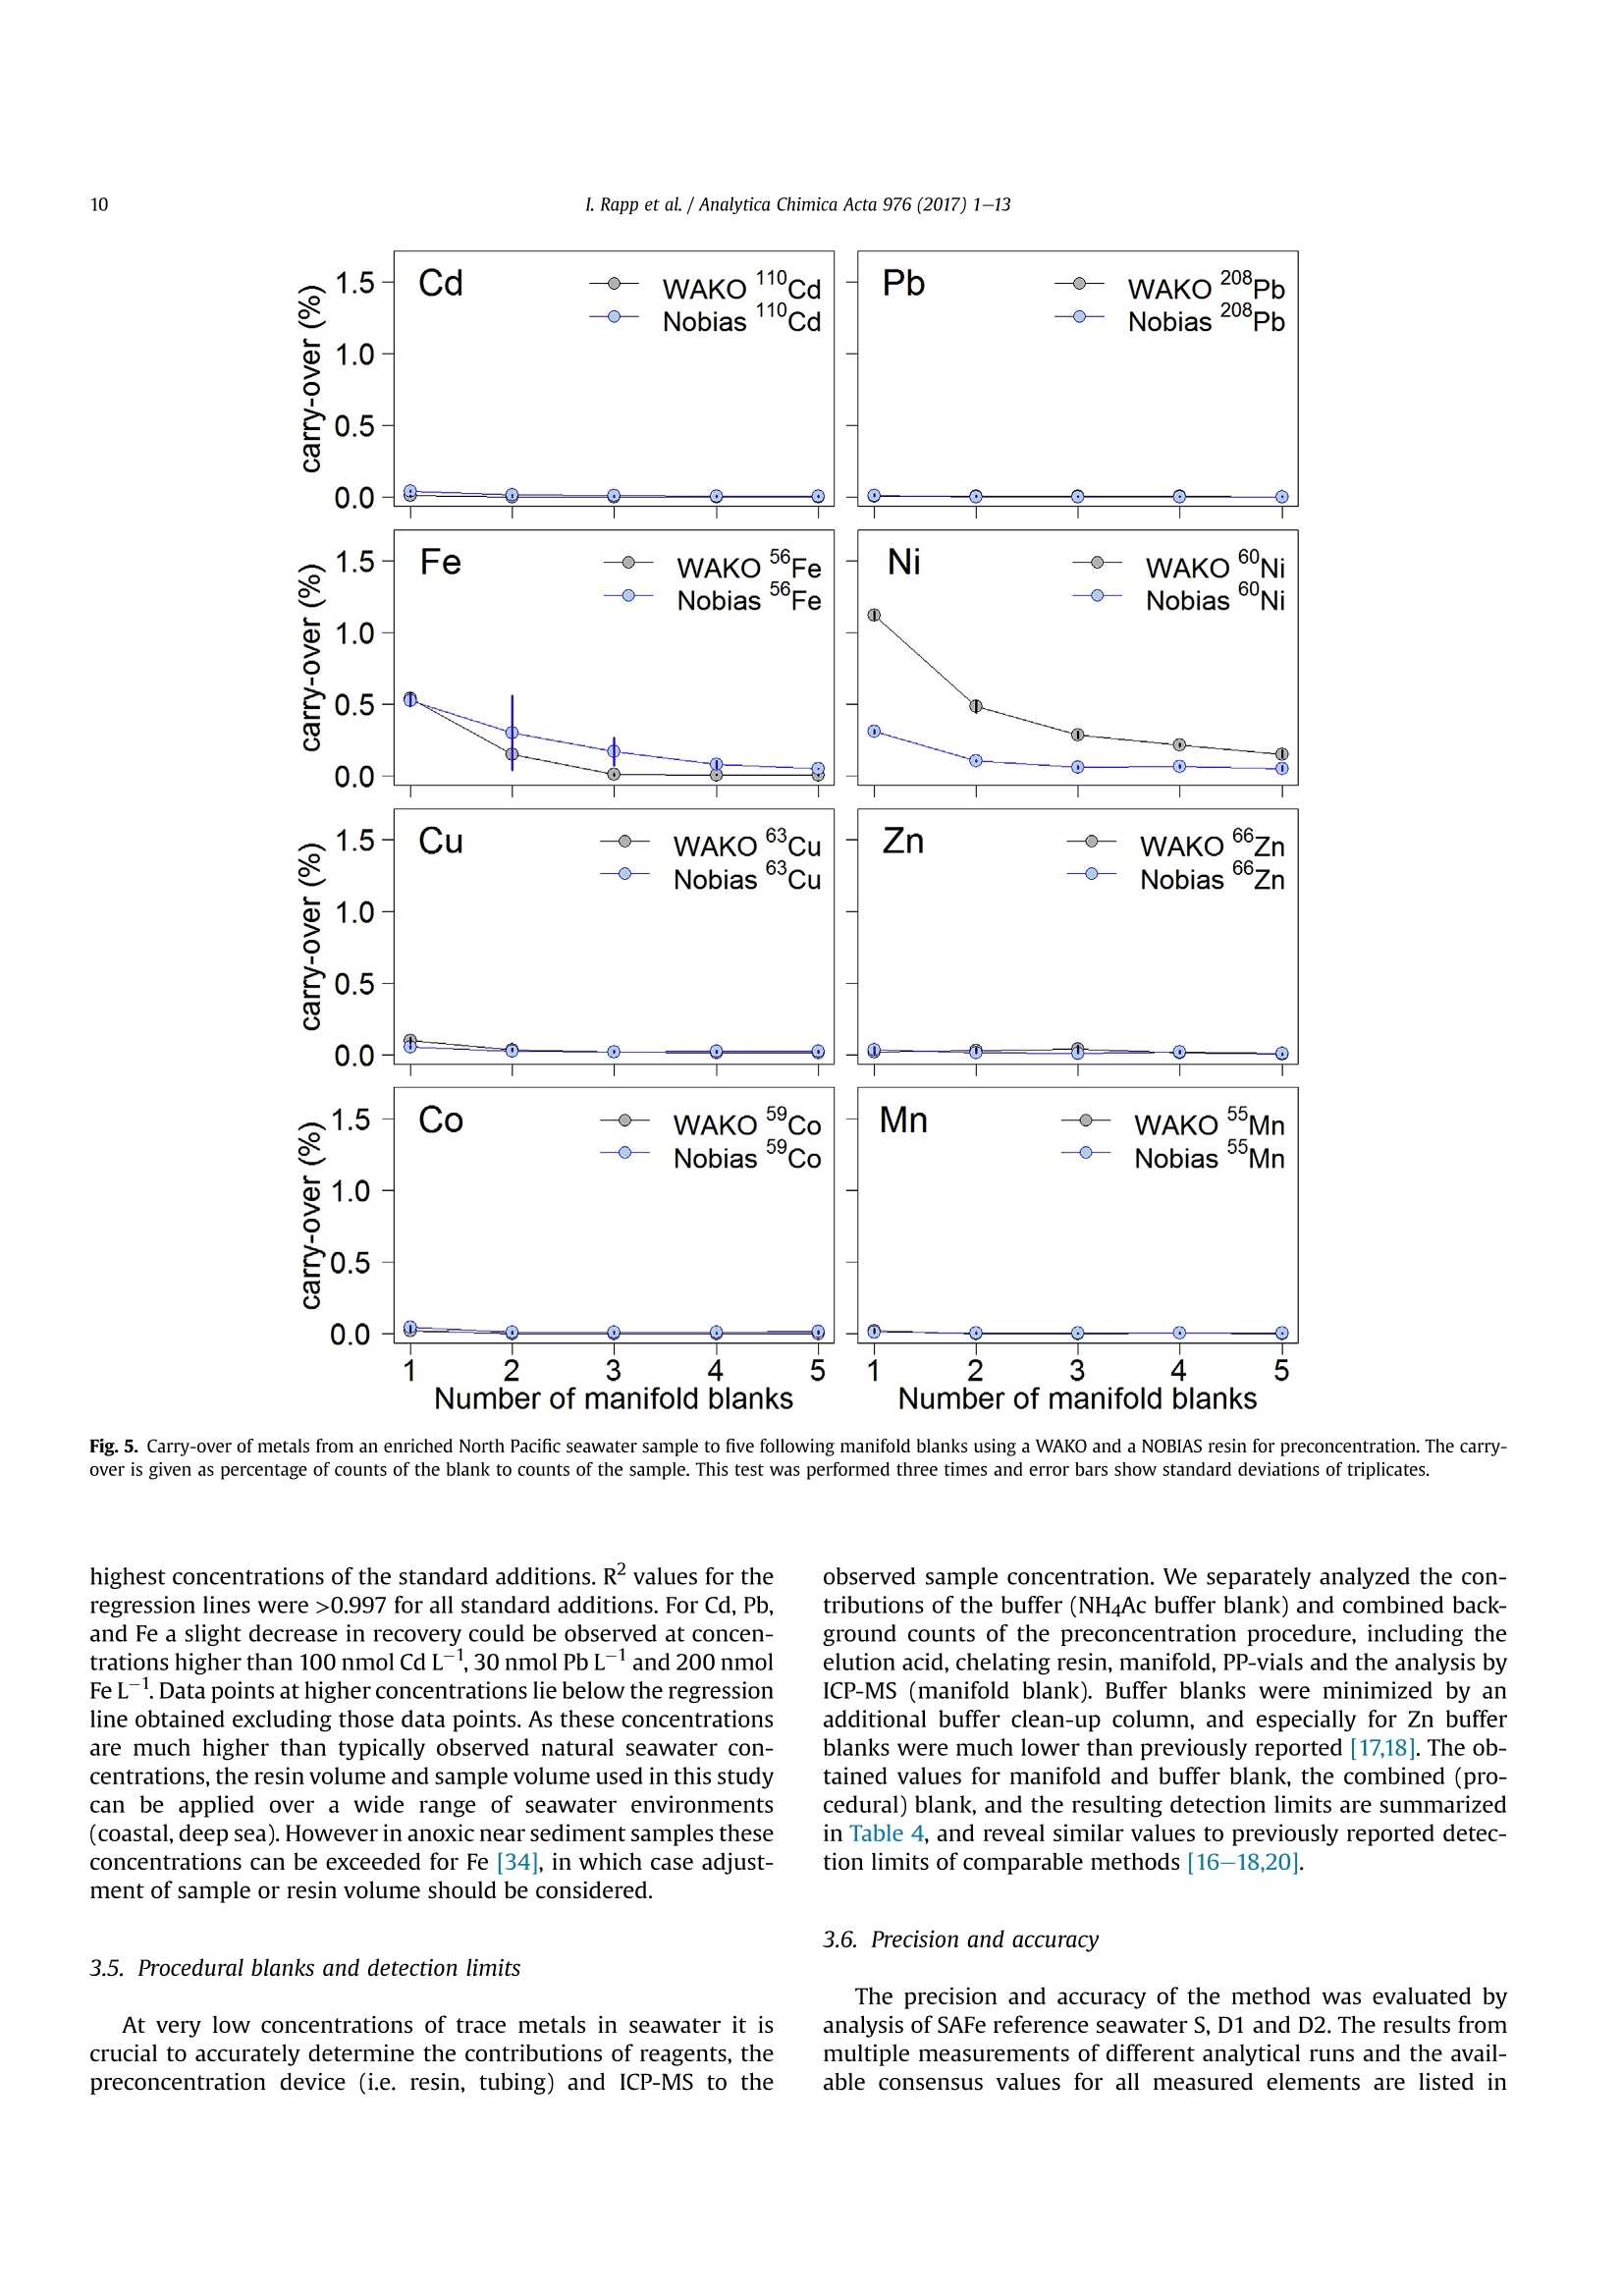
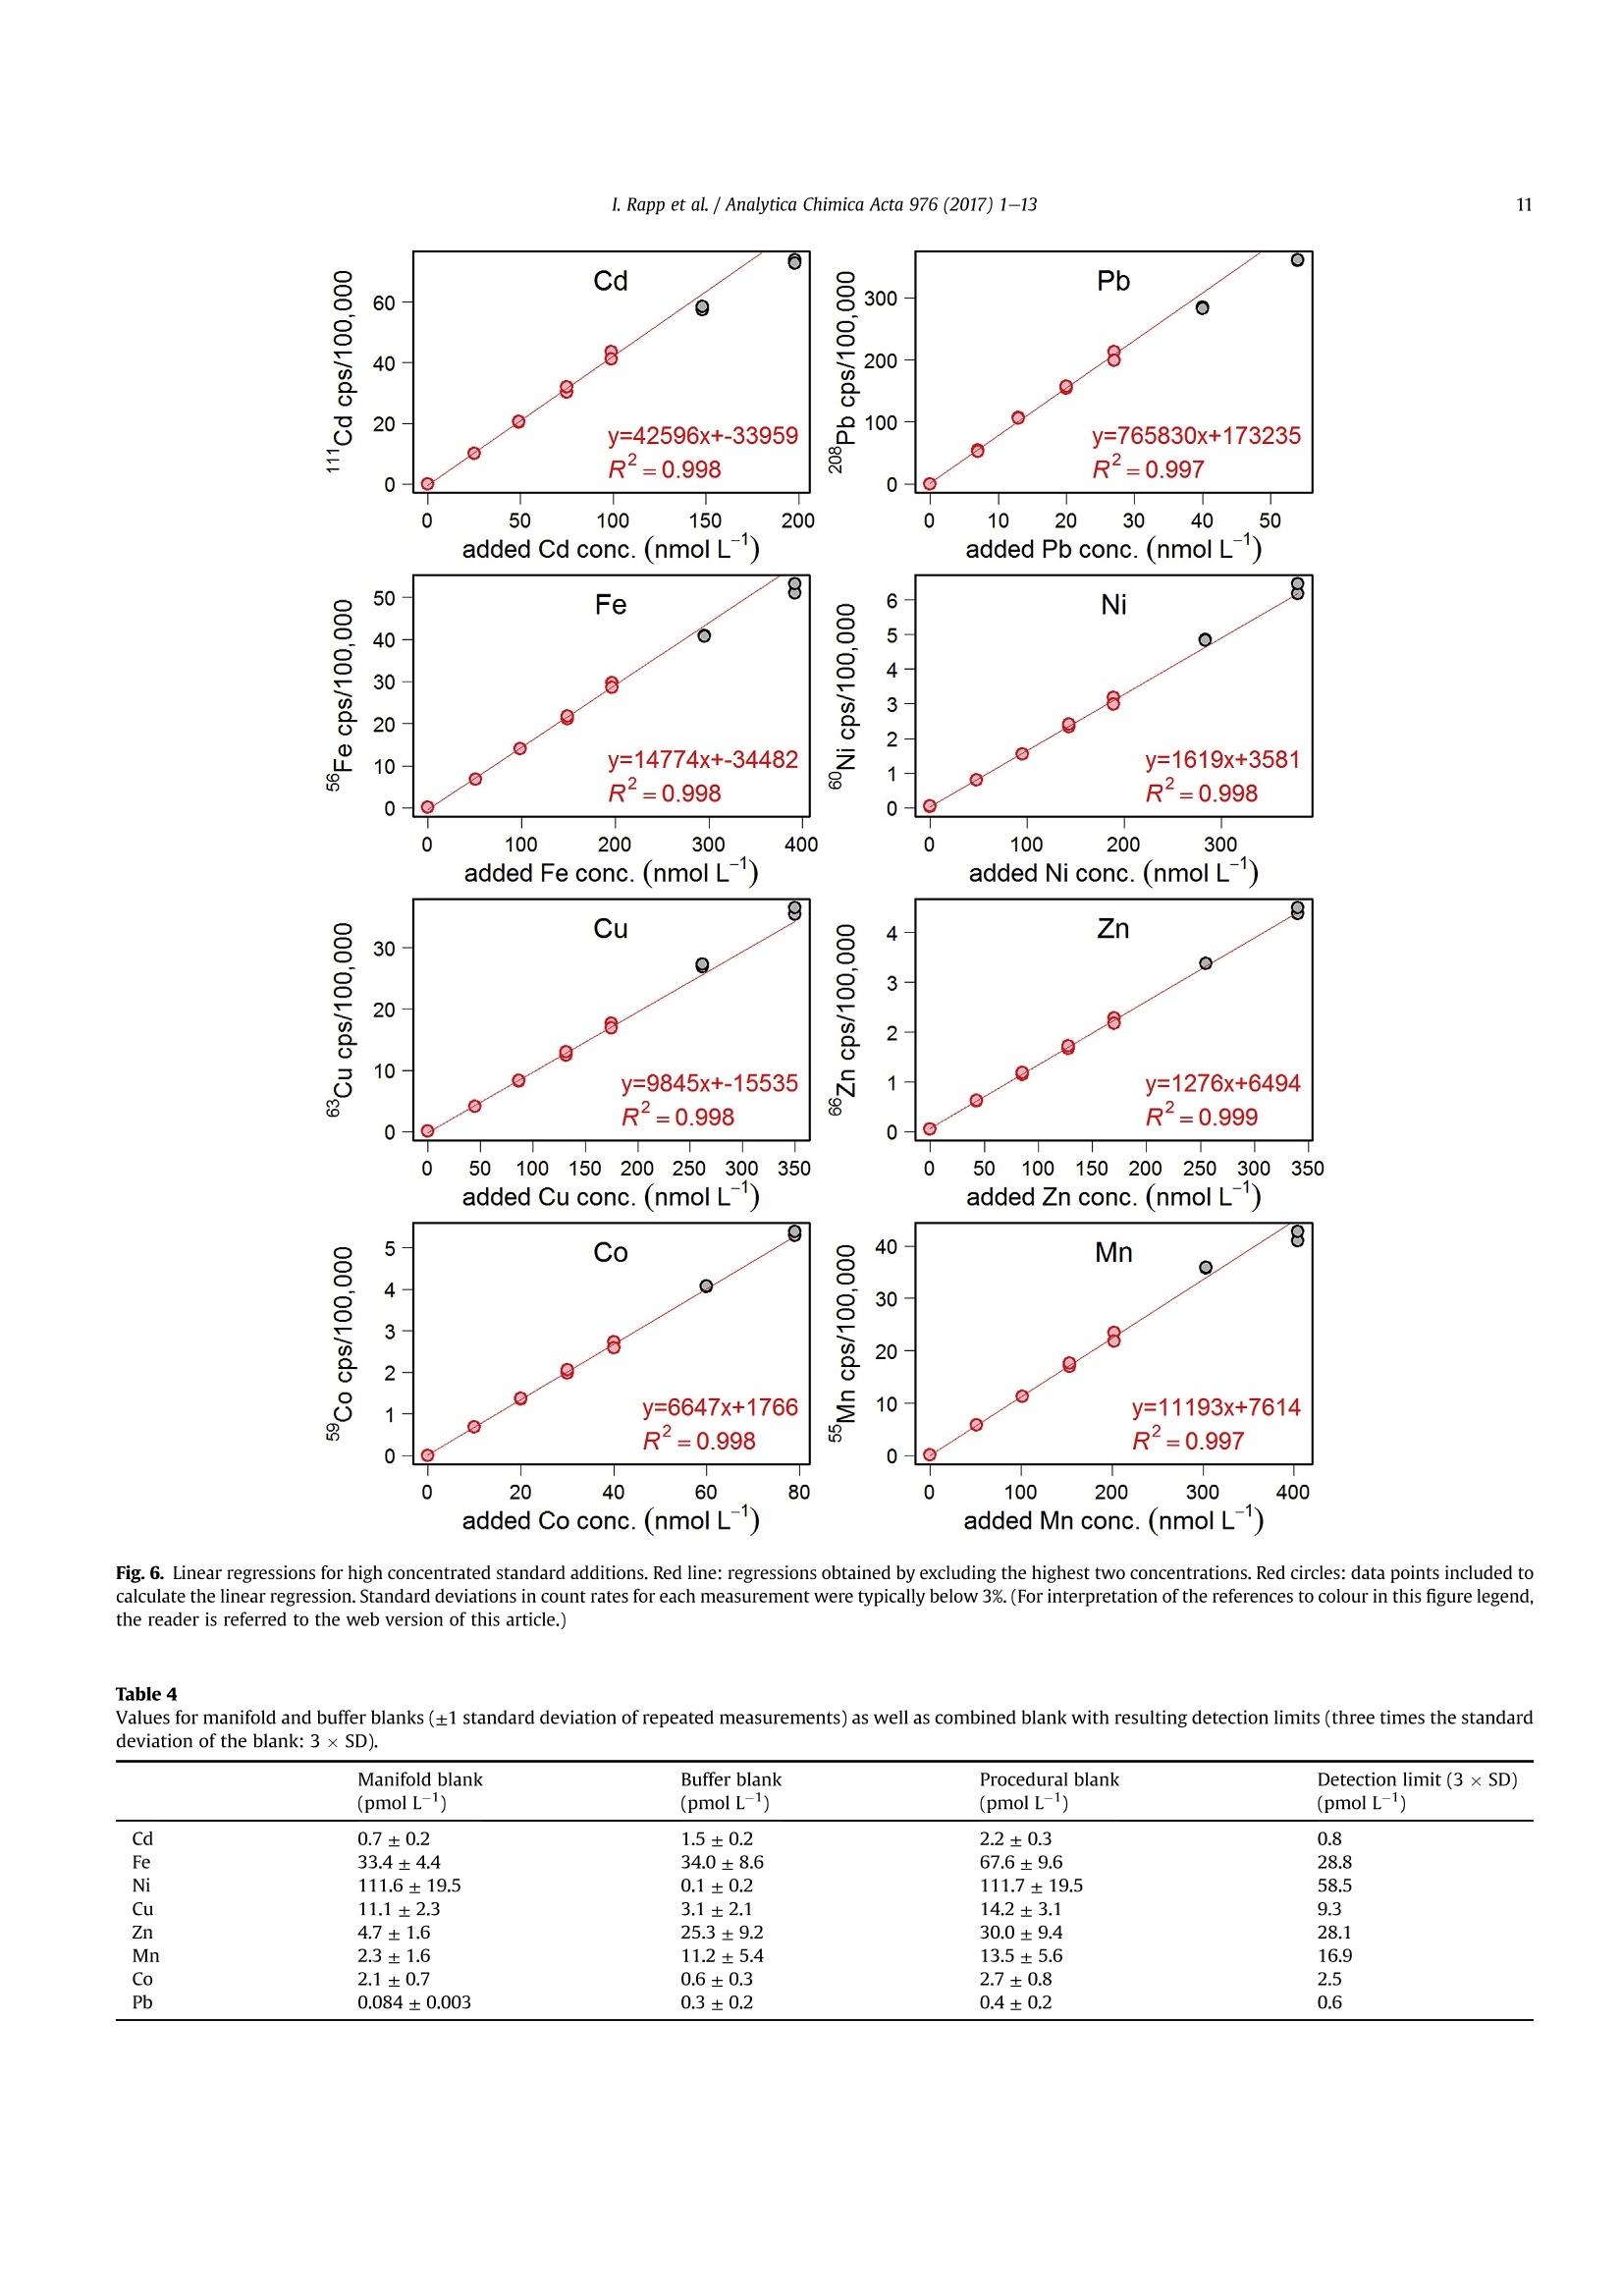
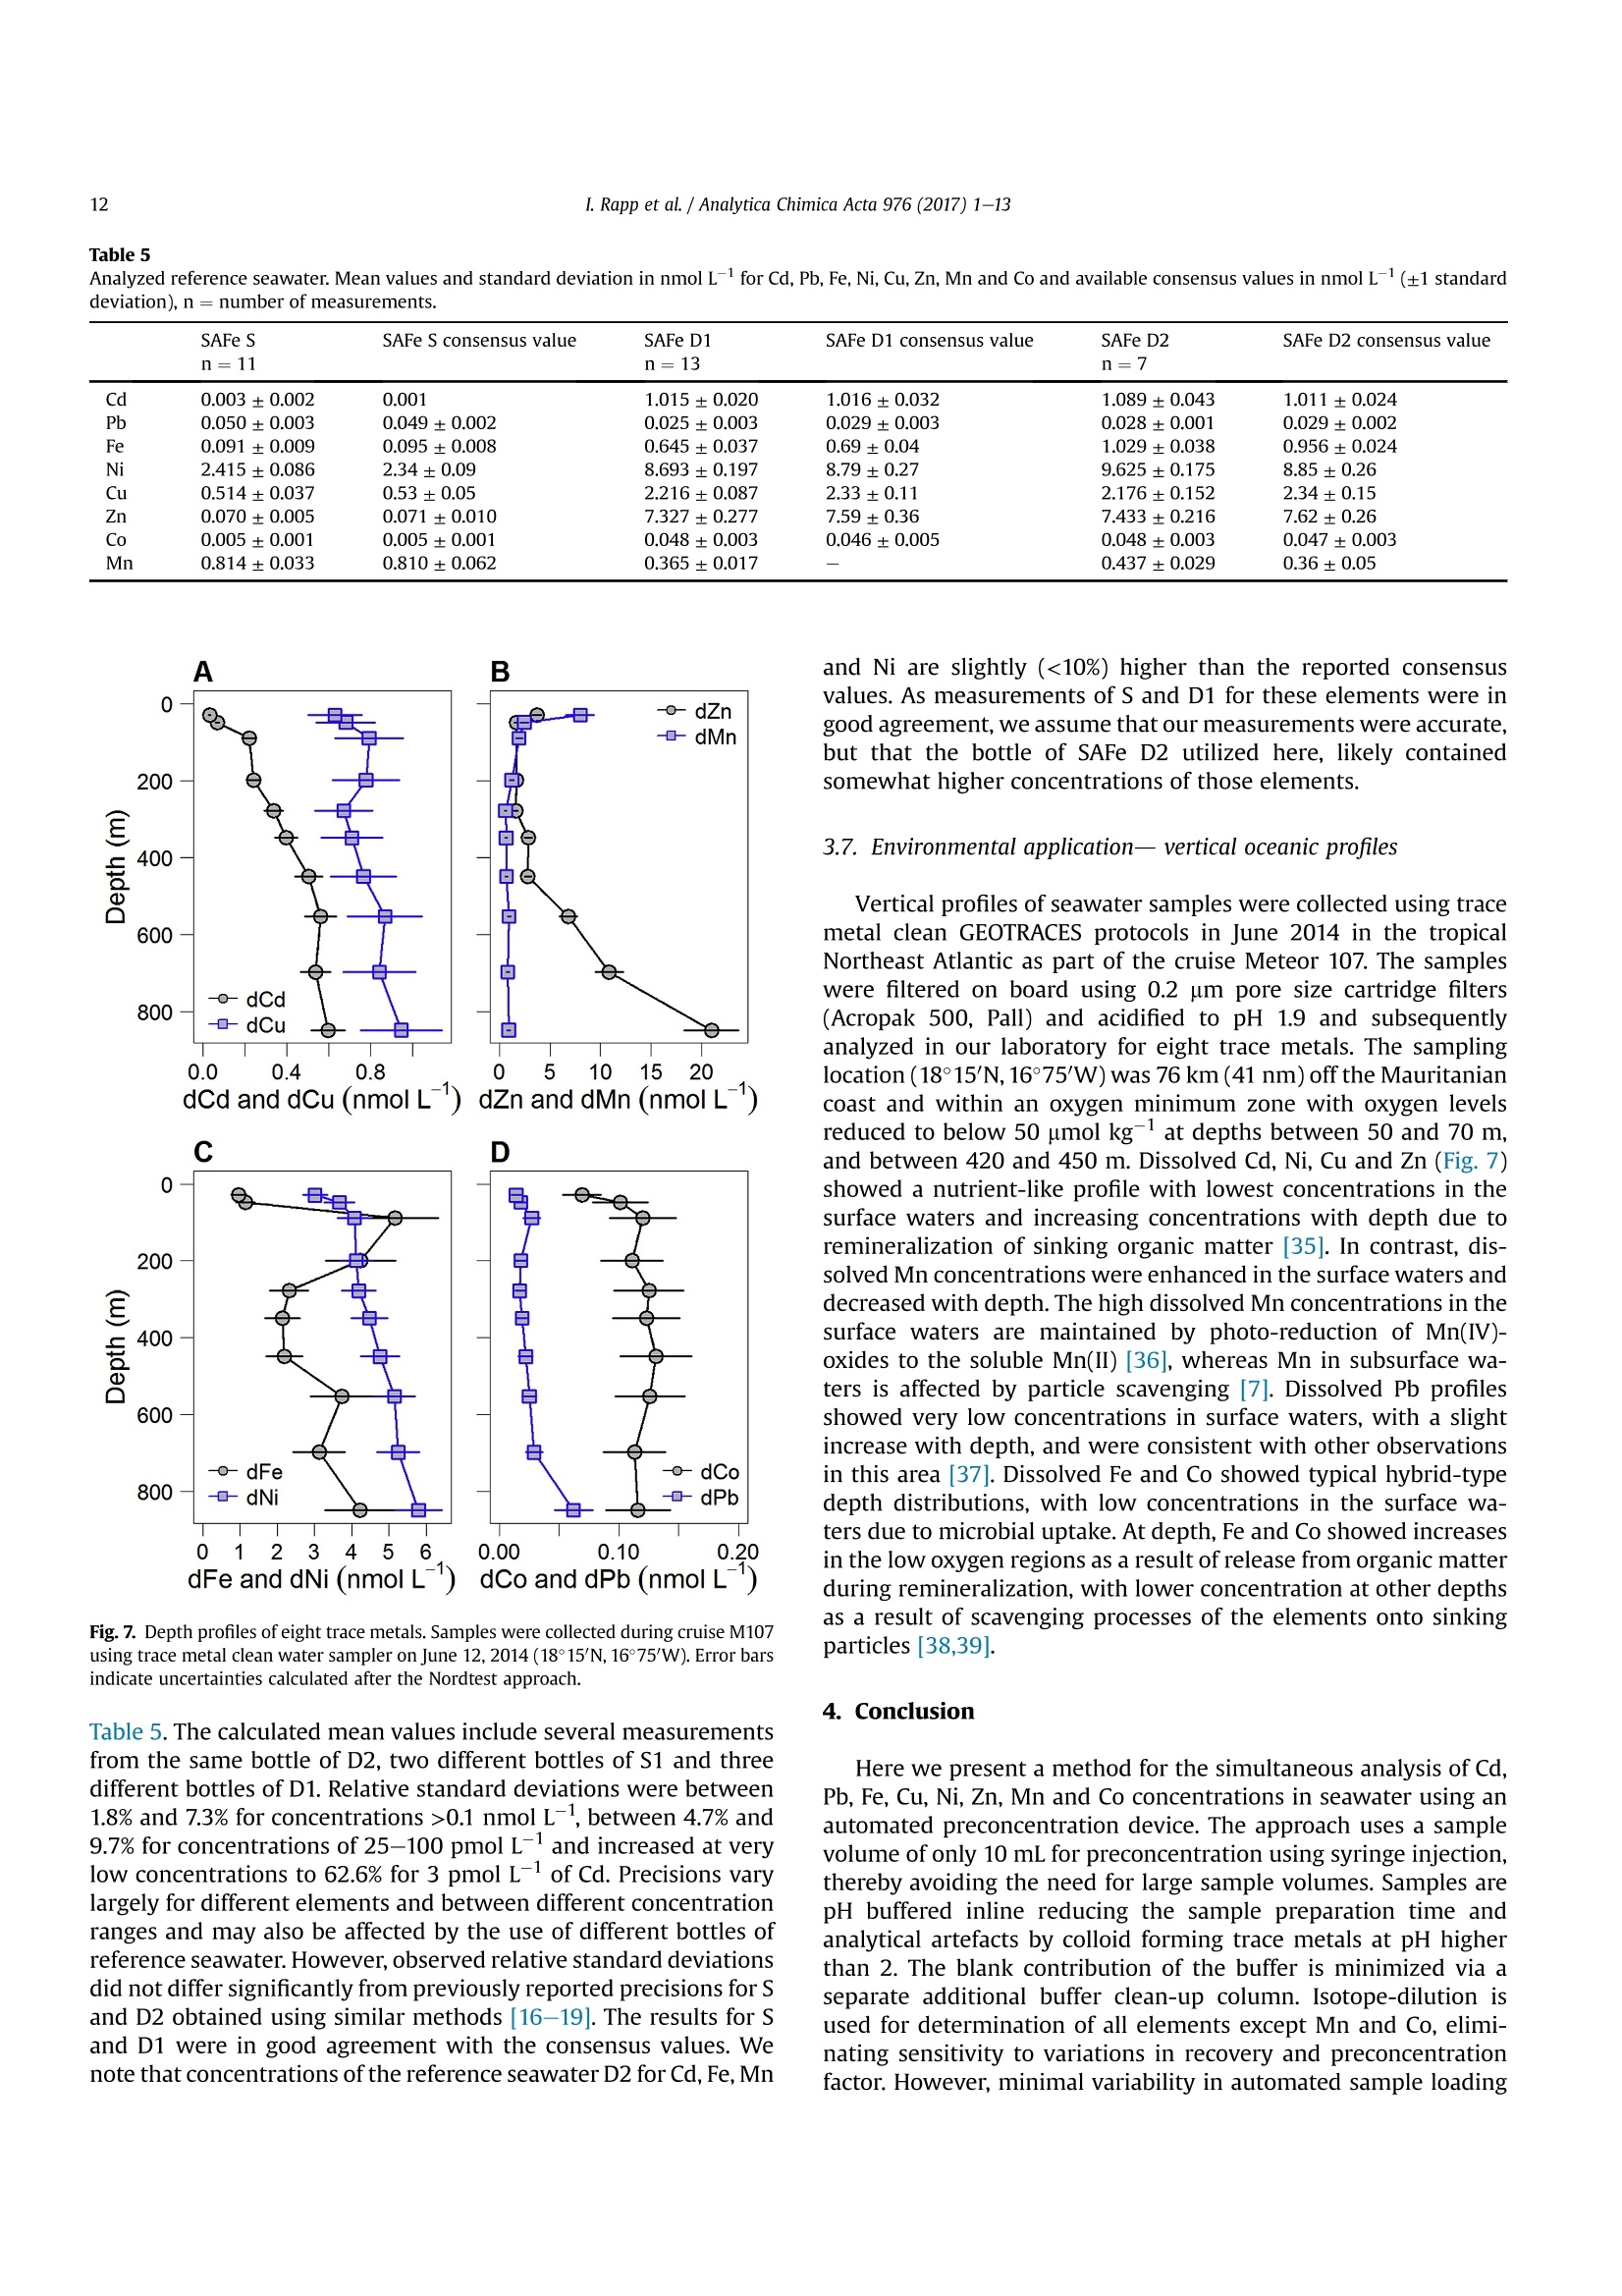
方案详情

Analytica Chimica Acta 976 (2017) 1-13Contents lists available at ScienceDirectAnalytica Chimica Actajournal homepage:www.elsevier.com/locate/aca 2I. Rapp et al./ Analytica Chimica Acta 976 (2017) 1-13 5 Automated preconcentration of Fe, Zn, Cu, Ni, Cd, Pb, Co, and Mn inseawater with analysis using high-resolution sector field inductively-coupled plasma mass spectrometry CrossMark Insa Rappa*, Christian Schlosser, Dagmara Rusieckaab,Martha Gledhill,Eric P. Achterberga Chemical Oceanography, GEOMAR Helmholtz Centre for Ocean Research, 24148 Kiel, Germany "Ocean and Earth Sciences, University of Southampton, National Oceanography Centre Southampton, SO14 3ZH, UK HIGHLIGHTS GRAPHICALABSTRACT ·A rapid automated analytical methodfor simultaneous analysis of multipletrace metals in small volumes ofseawater. Isotope dilution is utilized for con-centration quantification, eliminatingsensitivity to variation in recovery. ●Automatedsamplee loading andelution volumes allow precise quan-tification via standard addition formonoisotopic elements. High accuracy was confirmed byanalysis of reference seawaters SAFeS, D1 and D2. ·Improved recoveries for most testedtrace metals using a WAKO resin incomparison to a NOBIAS Chelate-PA1resin. ARTICLEEINFO Article history: Received 16 February 2017 Received in revised form8 May 2017 Accepted 12 May 2017 Available online 13 May 2017 Keywords: Trace metals Seawater Isotope dilutionPreconcentrationChelating resin ICP-MS ( * Corresponding author. ) ( E-mail a ddress: irapp@geomar . de (I . R app). ) ABSTRACT A rapid, automated, high-throughput analytical method capable of simultaneous analysis of multipleelements at trace and ultratrace levels is requiredto investigate the biogeochemical cycle of trace metalsin the ocean. Here we present an analytical approach which uses a commercially available automatedpreconcentration device (SeaFAST) with accurate volume loading and in-line pH buffering of the sampleprior to loading onto a chelating resin (WAKO) and subsequent simultaneous analysis of iron (Fe), zinc(Zn), copper (Cu), nickel (Ni), cadmium (Cd), lead (Pb), cobalt (Co) and manganese (Mn) by high-resolution inductively-coupled plasma mass spectrometry (HR-ICP-MS). Quantification of sample con-centration was undertaken using isotope dilution for Fe, Zn, Cu, Ni, Cd and Pb, and standard addition forCo and Mn. The chelating resin is shown to have a high affinity for all analyzed elements, with recoveriesbetween 83 and 100% for all elements, except Mn (60%) and Ni (48%), and showed higher recoveries forNi, Cd, Pb, Co and Mn in direct comparison to an alternative resin (NOBIAS Chelate-PA1). The reducedrecoveries for Ni and Mn using the WAKO resin did not affect the quantification accuracy. A relativelyconstant retention efficiency on the resin over a broad pH range (pH 5-8) was observed for the tracemetals, except for Mn. Mn quantification using standard addition required accurate sample pH adjustment with optimal recoveries at pH 7.5±0.3. UV digestion was necessary to increase recovery ofCo and Cu in seawater by 15.6% and 11.4%, respectively, and achieved full break-down of spiked Co-containing vitamin B12 complexes. Low blank levels and detection limits could be achieved (e.g.,0.029 nmol L-1 for Fe and 0.028 nmol L-1 for Zn) with the use of high purity reagents. Precision andaccuracy were assessed using SAFe S, D1, and D2 reference seawaters, and results were in good agree-ment with available consensus values. The presented method is ideal for high throughput simultaneousanalysis of trace elements in coastal and oceanic seawaters. We present a successful application of theanalytical method to samples collected in June 2014 in the Northeast Atlantic Ocean. ◎ 2017 Elsevier B.V. All rights reserved. 1. Introduction A number of trace metals are essential micronutrients forphytoplankton growth and play important roles in ocean biogeo-chemical cycles [1,2]. In particular iron (Fe) has been identified as amicronutrient that directly limits phytoplankton growth in highnitrate low chlorophyll regions, which constitute ~30% of theoceans surface [1], and also controlling di-nitrogen fixation inoligotrophic gyres [3]. Other trace metals such as cobalt (Co), zinc(Zn), cadmium (Cd), manganese(Mn) and copper (Cu) may also be(co-)limiting for phytoplankton growth and/or influence phyto-plankton community composition [2,4,5]. Major sources of tracemetals to the ocean include continental shelf sediments, mineraldust, river discharge, submarine hydrothermal activity, and glacialmelt waters [6]. Trace metal distributions are modulated byadvection and diffusion, biological uptake, solubility, scavenging,organic ligand complexation and remineralization [6]. In addition,some trace metals can be used as tracers for source inputs (e.g. Mnfor lateral transport from continental margins; [7,8], and Pb foranthropogenic inputs [9,10]) Due to the complexity of these processes,and a paucity of data,our understanding of the distributions and dynamics of tracemetals in the ocean remains limited. In response, the internationalGEOTRACES program was launched to sample and measure tracemetal distributions throughout all of the major ocean basins inorder to resolve controls on sources, sinks, and oceanic cycling oftrace elements [11]. These sampling campaigns generate largenumbers of seawater samples (often >1000) that require reliable,high throughput analytical methods to determine the concentra-tions of a range of trace metals. Trace metals occur typically at very low concentrations inseawater, ranging from a few pmol L-1 to nmol L-1 which arechallenging to measure. In addition, alkali and alkaline earth ele-ments are present at relatively high concentrations of up to severalhundred mmol L-, and may cause challenges during ICP-Msanalysis as a result of salt precipitation in parts of the instrumentand isobaric interferences with the analyte of interest. Conse-quently, for most seawater samples preconcentration of the ana-lytes and removal of the salt matrix is required prior to analysis. Arange of preconcentration and extraction methods have beendeveloped, including organic solvent extraction [12,13], co-precipitation with magnesium hydroxide [14,15], and solid phaseextraction using chelating resins in columns or as a batch extractiononto suspended resin beads [16-20]. A variety of resins have been developed with different func-tional groups that retain trace metals over a wide range of pHconditions, with recovery using diluted acids. For example, Toyo-pearl AF-Chelate-650 M with iminodiacetic acid (IDA) functionalgroups has been used in conjunction with ICP-MS detection fordetermination of seawater Fe, Mn, Co, Ni, Cu, Zn, Cd and Pb [17]. Anitrilotriacetic acid (NTA)-type Superflow resin has been employed with a single batch extraction and ICPMS detection for Fe, Pb, Cdand1Cu[20]. NOBIAS)Chelate-PA1,. containing ethylene-diaminetriacetic acid and IDA functional groups on a hydrophilicmethacrylate resin, has been applied for the analysis of Al, Mn, Fe,Co,Ni, Cu,Zn, Cd and Pb with ICP-MS detection [16,19]. Here we present a new method for simultaneous, accurate, andprecise determination of dissolved Cd, Pb, Fe,Cu, Ni, Zn, Co and Mnin seawaters using a commercially available automated pre-concentration device with subsequent analysis by ICP-MS. Weapplied a resin with immobilized carboxymethylated pentaethy-lenehexamine (CM-PEHA) functional groups (WAKO; Kagaya et al.,2009). Sample quantification was undertaken using isotope dilu-tion for all elements apart from the monoisotopic elements, Co andMn. Accuracyand precision were examined using standard refer-ence seawater and resin performance was extensively tested overpH ranges between 1.9 and 8.1 to assess whether this newly testedresin can achieve constant recoveries over a wider pH range thanpreviously studied resins. Resin performance was also directlycompared to an alternative resin (NOBIAS Chelate-PA1) using thesame preconcentration set-up. 2. Experimental 2.1. Reagents for sample pre-concentration All reagents were prepared in de-ionized water (>18.2 MQ cm;Milli-Q,Millipore). Nitric acid (SpA, Romil) was purified by singledistillation in a sub-boiling perfluoroalkoxy-polymere (PFA) distil-lation unit (DST-1000,Savillex). Glacial acetic acid and ammoniumhydroxide (20-22%) were of the highest purity (Optima, FisherScientific). Ammonium acetate (NH4Ac) buffer (1.5 M) was pre-pared in de-ionized water using 140 mL ammonium hydroxidesolution and 90 mL acetic acid for 1 L buffer, and adjusted to pH8.5±0.05 using ammonium hydroxide or acetic acid. 1 M nitric acidwas prepared using subboiled distilled nitric acid(d-HNO3) dilutedwith de-ionized water. For preparation of the elution acid, 1 M d-HNO3 was spiked with 250 ng L-1indium (In) for drift correctionduring ICP-MS analysis. All reagents were stored in cleaned poly-propylene (PP) containers provided by Elemental Scientific Inc.(ESI). All containers and sample bottles were cleaned by soaking in2%Decon for 1 day,1.2 M HCl (reagent grade) for 5 days, 1.5 M HNO3(reagent grade) for5 days and a final rinse with de-ionized waterand in between the soaking steps. The buffer and diluted acid wereprepared inside a fume hood within a clean laboratory (ISO 5).Further reagent handling was carried out in an ISO 3 laminar flowbench with a HEPA filter unit. 2.2. Spike solutions Quantification of samples and reference seawater was per-formed for Fe, Zn, Cu, Ni, Cd and Pb using isotope dilution, and for the monoisotopic elements Mn and Co using standard addition. Toassess changes in recovery following resin preconcentration, whichaffects both naturally occurring and spiked isotope, quantificationusing standard addition is necessary for all elements. Therefore, wedistinguished between three different spikes used during samplepreparation: (1) Isotope spike, (2) multi-element spike (for stan-dard additions) and (3) Co-Mn spike. The employed isotope spike solution contained artificiallyenriched 5Fe, 62Ni, 65Cu, 68zn, 111 cd and 207Pb. The isotopes werereceived in solid form (ISOFLEX USA) and were dissolved inconcentrated d-HNO3. After mixing in 2% HNO3, concentrationswere verified by ICP-optical emission spectroscopy (ICP-OES; 7500Agilent) and by reverse isotope dilution using a multicollector ICP-MS(MC-ICP-MS; ThermoFisher Neptune). Spike ratios for 56FeFe,60Ni/62Ni, 63cu/65Cu,66zn/68zn,110cd/1l1Cd and 207Pb/208pb weredetermined by MC-ICP-MS. A multi-element spike for standardadditions containing Cd, Pb, Mn, Co, Fe, Ni, Zn, and Cu was preparedby serial dilution of individual stock standards (CertiPur, Merck) in0.45 M d-HNO3. For lower concentrated standard additions, furtherdilutions were prepared in 0.045 M d-HNO3. A Co-Mn spike wasprepared in a similar way as the multi-element spike by serialdilution of Co and Mn stock standards in 0.045 M d-HNO3. 2.3. Seawater sample preparation Sample preparation was performed in a laminar flow bench.Alllow-density polyethylene (LDPE) and fluorinated ethylene propyl-ene (FEP) bottles used for sample preparation and standard solu-tions, were acid washed according to protocols for washing ofsample bottles described above [21]. After each use the FEP bottleswere rinsed with de-ionized water, filled with 0.35 M hydrochloricacid (HCl), and stored for a minimum of 4 days before next usage.Prior to use, the FEP-bottles were rinsed 5 times with de-ionizedwater and once with a few mL of the sample. Pipette tips wererinsed three times with 3 M HCl (Trace Metal Grade, Fisher) and 3times with de-ionized water. Method tests were made using filtered (0.2 um Sartobrancapsule filter, Sartorius) North Pacific (Cruise NH1417, 2014, 25 mdepth) and Southern Ocean seawater (Cruise JR271, 2012, surfacewater), as specified. Seawater was sub-sampled from 25 L carboysinto 1 L LDPE bottles (Nalgene) and acidified to pH 1.9 usingconcentrated HCl (UpA, Romil).15 mL aliquots of acidified seawaterwere transferred into 30 mL FEP bottles (Nalgene). Seawater andreference seawater samples (SAFe S1, D1 andD2) were spiked with125 uL of diluted isotope-spike. To determine Co and Mn concen-trations in these samples, standard additions using the Co-Mn spikewere performed on several(n=4-7) 15 mL aliquots of North Pa-cific seawater covering aa concentration range of0.005-0.4 nmol L-1 for Co and 0.25-20 nmol L-1 for Mn. Prior topreconcentration, samples were UV-digested by placing the filledFEP-bottles into a homemade UV light box equipped with four lowpressure mercury vapor lamps (25 Watt, Philips)[17]. Samplebottles were UV irradiated for 4 h (unless stated differently). Fortests on efficiency of UV digestion and recovery, no isotope-spikewas added to the seawater and standard addition (n = 7) wasperformed for all elements using the multi-element spike. 2.4. Pre-concentration set-up An automated system (SC-4 DX SeaFAST pico; ESI) with onlinepH buffering was used for sample preconcentration and seawatermatrix removal. The preconcentration device (Fig.1) was equippedas recommended by the manufacturer. The autosampler (4DXFASTready) was equipped with a sample probe with 1.0 mm innerdiameter (ID), a vacuum pump for sample aspiration and two independent rinse pumps supplying the rinsing station with 1 Md-HNO3 from 4 L reservoirs. The reagents were distributed by a sy-ringe system (S400V) consisting of an ethylene chlorotrifluoro-ethylene (CTFE) valve with PFA rotor and four syringes: one 12 mLCTFE/polytetrafluoroethylene (PTFE) syringe (S1), and three 3 mLquartz/PFA syringes (S2, 3 and 4). The reagent flow paths werecontrolled by a valve module (FAST DX 3) with two 11-port CTFEvalves (V1 and V2) and one 5-port CTFE valve (V3), all three with aPFA rotor. The sample coil utilized in this study had a volume of10 mL. All tubing connecting the valves was made of PFA. Valve 3was connected to pressurized air for sample elution. The pressur-ized air was pre-filtered (ReZist Syringe Filter, PTFE, 5.0 um,Whatman) in order to minimize any particle introduction. Thebuffer was cleaned in-line before mixing with the sample by aclean-up column (Nobias,ESI). Samples were eluted into 4 mL PPscintillation vials (Novodirect). The PP scintillation vials werecleaned in 2% Decon for1 day, rinsed with tap water followed byde-ionized water, soaked 1 day in 1 M HCl heated to 45°C, rinsedwith de-ionized water, soaked 1 day in 1.5 M HNO3 heated to 45C,rinsed 5 times with de-ionized water, and dried in a laminar flowbench. 2.5. Resins for pre-concentration Trace elements were preconcentrated with a WAKO chelateresin (similar to Presep" PolyChelate, Wako Pure Chemical In-dustries, Japan) with immobilized carboxymethylated pentaethy-lenehexamine (CM-PEHA) functional groups: [22]. The resinmaterial was obtained from Wako Pure Chemical Industries via S.Kagaya (University of Toyama, Japan) and showed the same char-acteristics for trace metal recovery as Presep@PolyChelate which iscommercially available as a packed resin [22,23]. The performanceof the WAKO resin was compared to the NOBIAS Chelate-PA1chelating resin (Sigma Aldrich) in tests on recovery and samplecarry-over. Both resin columns were prepared in 2 cm tapered minicolumns with an internal volume of 27 uL (Global FIA) by fillingapproximately half the column with resin material (10-15 pL). Thepacked resins were cleaned by flushing for at least 4 h with 1 M d-HNO3. 2.6. Pre-concentration and extraction The ESI SC-Autosampler and preconcentration device wascontrolled using a modified protocol of the ESI Software Version2.9.0.82c. The preconcentration procedure (Table1) includesloading of the sample into a coil (Fig. 1A), loading the sample ontothe resin and rinsing off the seawater matrix using de-ionizedwater (Fig. 1B), rinsing the sample introduction parts with 1 M d-HNO3, eluting the sample using elution acid (Fig.1C), cleaning thesample and buffer clean-up resins using elution acid and 1 M d-HNO3 (Fig. 1C, with change in position of valve 3), final rinsing ofsample introduction/elution parts using 1 M d-HNO3 and pre-conditioning of the preconcentration resin using the 1.5 M NH4Acbuffer and de-ionized water (Fig.1D). In the utilized set-up, up to 63samples (including samples for standard addition and referencesamples) can be preconcentrated in one batch with a throughput ofca. 4 samples h- which is similar to less automated methods[16,17] but in the absence of an analyst. 2.7. Blanks Blank contributions were determined as two separate parts, themanifold blank and the NH4Ac buffer blank. The manifold blankaccounted for contributions from the elution acid, any componentof the preconcentration procedure (except buffer contributions) Fig. 1. Schematic set-up of SeaFAST system and valve positions. A) Entire set-up including autosampler unit (SC4DX), syringe system (S400V) and valve module (FAST DX3) with thethree valves in position for sample loading on coil (V1: Valve 1, V2: Valve 2, V3: Valve 3), blue line contours indicate sample flow path. B) Valve module in position for sampleloading on resin and matrix rinsing. Line contours indicate sample and reagent flow (blue: sample, green: de-ionized water, purple: buffer, dark blue: sample-buffer mix). C) Valvemodule in position for elution. Line contours (red: elution acid (EA), orange: 1 M HNO3). D) Valve module in position for column conditioning. Line contours (green: de-ionizedwater,purple: buffer, brown: de-ionized water-buffer mix). (For interpretation of the references to colour in this figure legend, the reader is referred to the web version of thisarticle.) and manifold, as well as from the analysis on ICP-MS. The manifoldblank was determined using the preconcentration method on thepreconcentration device with modifications to the first three steps.Step 1 (Loading of sample on coil) and step 2 (Loading sample ontoresin) were omitted and in step 3, a smaller amount (2500 uL) ofde-ionized water was used for matrix removal. Elution, columncleaning and pre-conditioning steps remained the same as duringseawater sample preconcentration. The NH4Ac buffer blank wasdetermined using two batches of diluted North Pacific seawater (1:10 dilution with de-ionized water), one batch acidified with1200uL HCL L-1 and the other batch acidified with 2400 uL HClL-.The seawater was diluted in order to reduce the concentrations oftrace metals in the solutions. Fe concentrations in undiluted NorthPacific seawater were 0.747 ± 0.060 nmol L-1 with analyticalstandard deviations exceeding buffer blank values. Both dilutionswere treated the same as regular samples and analyzed in repli-cates (n =5) for each set of buffer. The buffer added in an auto-mated manner during preconcentration was adjusted to obtain a Table1Steps of the preconcentration procedure. sample introduction system are flushed with similar pH (6.4±0.2) for both dilutions. Buffer contributions werethen calculated as the difference between the mean metal con-centrations for the two buffer and acid volumes. This approach willalso account for any contribution from the acid used for acidifica-tion. However the contribution of the high purity acid should beminimal in comparison to the buffer. The buffer contributions werealso determined as the difference between obtained concentrationsin the acidified (1200 pL HCL L-) diluted seawater and the con-centration calculatedusing the mean value of repeated Table 2 ICP-MS instrumentation and settings. Instrument Element XR, Thermo Fisher Scientific Autosampler 4DX FASTready, ESI Nebulizer 200 uL PFA nebulizer, AHF Nebulizer uptake rate 180 uL min Sampler Cone Ni, ICP-MS Cones LTD Skimmer Cone Ni ‘H’, ICP-MS Cones LTD Spray Chamber PFA Scott-Spray Chamber, AHF Injector Sapphire injector, AHF Cool gas flow (L min-) 14.5-15.32 Sample gas flow (L min-) 1.174-1.210 Auxiliary gas flow (L min -1 0.70-0.73 RF Power (W) 1110-1117 measurements of the undiluted North Pacific seawater divided by10 (dilution factor). As final buffer blank, the mean value of the twodifferent approaches was applied. 2.8. ICP-MS The instrument was tuned before each run to obtain maximumsensitivity and stability. For tuning, a solution of In and Uranium (U)was used and standard deviations of both elements were below1.5%. As a result of the use of Ni cones, a relatively high Ni back-ground signal was obtained. The Ni background signal could bereduced by running the instrument with diluted tap water (1:10 inde-ionized water) for 2-4h in order to plate the cones. Afterwards,the instrument was run with 1 M d-HNO3 to clean the tubing andinstrument from remaining metals from the diluted tap water. Interferences of MoO+ on 110cd and 111cd were corrected asdescribed by Wu and Boyle [14]. Briefly, Mo standards were pre-pared by serial dilution of a Mo stock solution (Inorganic Ventures)in 1 M d-HNO3 with concentrations between 2 and 200 nmol L-and were measured at the beginning and end of each analytical run.The isotope 95Mo was measured on all samples and the slopes fromthe linear regression of 95Mo/110Cd and 95Mo/ll1Cd obtained fromthe Mo standards was used to correct for Moo+ interference on110Cd and 111Cd counts of the samples. A diluted multi-element solution, diluted isotope spike solution,and 1M d-HNOs were analyzed after every 10th sample during eachICP-MS run. This was done in order to correct for an instrumentalmass bias producing slightly different isotopic ratios than the truenaturally occurring isotope ratios in the multi-element solution andthe artificial isotope ratios of the isotope spike solution used duringsample preparation.The multi-element solution was prepared fromindividual stock standards (CertiPur, Merck) in 1 M d-HNO3. Theisotope spike solution was also diluted in 1 M d-HNO3. The 1 M d-HNO3 used for preparation of the dilutions was from the samebatch as the acid analyzed on the ICP-MS in order to allowcorrection of the count rates for contribution from the 1 M d-HNO3. 2.9. Calculation of elemental concentration and uncertainties Isotope ratios of Cd, Pb, Fe, Ni, Cu and Zn of the samples werecalculated after subtracting mean counts of three manifold blanks.The concentrations of these elements were then calculated asdescribed by de Jong et al. [24]. Isotope ratios of the multi-elementand isotope spike solutions obtained using the ICP-MS analyseswere used instead of the stated isotope ratios of these solutions.Concentrations of Co and Mn calculated using standard additionwere based on linear regressions of the sequentially-spiked sample.Standard additions were performed after every 10th sample and themean slope from one standard addition run before and one afterthe sample was used for sample concentration calculation. Sensi-tivity changes of the mass spectrometer were corrected for usingratios of Co and Mn count rates to indium count rates for standardadditions and samples. Measurement uncertainties were calculated after the Nordtestapproach [25] incorporating uncertainties of within-lab reproduc-ibility and uncertainties derived from the bias of determinedreference materials to the certified or nominal values of the refer-ence materials. This approach creates higher uncertainties (be-tween 13% and 25% in our study) than previously publisheduncertainties for oceanic trace metal measurements but is ac-counting for random as well as systematic effects and consequentlyprovides a more reliable and realistic estimation of uncertainties.Uncertainties of the measurement itself using only standard de-viations in count rates and isotope ratios or standard additionslopes typically revealed uncertainties between 1% and 10%. We applied the square root of the square sum of two separatelydetermined uncertainties to obtain the combined uncertainty uc(Eq.(1)). With u(Rw) being the within lab reproducibility and u(bias)being the method and laboratory bias. The within lab reproducibility was accounted for as the uncer-tainty obtained for multiple measurements of the same sample orreference material over a time period of several months. Here thepooled relative standard deviation of repeated measurements ofthe reference seawaters SAFe S, D1 and D2, and North Pacificseawater was applied. U(bias) was calculated as described in Ref. [25] after Equation (2). Where RMSbias is the root mean square of the bias value (as % dif-ference from the consensus value) (Eq. (3)) and u(Cref) is the un-certainty of the consensus value (Eq.(4)). With biasi being the difference between determined meanconcentration of reference materials and the reported consensusvalues, n being the number of different reference materials usedand u(Cref)i being the reported uncertainties in consensus values.Final uncertainties (U) were determined as uc× 2. 2.10. Reference material To assess the accuracy of our analytical procedure, we analyzedreference seawater and compared our results to the availableconsensus values. Reference seawater standards collected as part ofthe SAFe inter-comparison projects S (surface, ~10 m), D1 and D2(deep,1000 m) were used [26]. 3. Results and discussion 3.1. UV-digestion Previous studies using chelating resins for trace element pre-concentration in seawater samples have shown that trace elementrecovery, particularly for Co and Cu, can be reduced by the presenceof strong, metal-binding ligands that prevent full preconcentrationby the resin [16,17,27].UV-digestion of the samples has been shownto be effective in breaking down organic complexes and achievingfull recovery for Co and Cu [16,17,27,28]. The acidification of theseawater samples to pH 1.9 following collection, with consequentdissociation of organic-metal complexes, appears to facilitate effi-cient preconcentration of other trace metals [16,17]. Efficiency of UV-digestion was tested by determination of Cuand Co concentrations after different time periods of UV exposure(10min-4 h) of acidified (pH 1.9) Southern Ocean seawater in FEPbottles (Fig. 2). The strength and concentrations of Co and Cubinding ligands in the Southern Ocean seawater were unknownand may have influenced the outcome of this experiment. In orderto better constrain the efficiency of the UV-treatment, we alsoperformed this test using the same seawater, spiked with a knownamount (0.1 nmol L-1) of vitamin B12 (added Co concentrationdetermined separately by ICP-MS =0.086 ±0.001 nmol L-1).Vitamin B12 is a Co complex known to be present at concentrationsup to a few pmol L- in open ocean seawater and a few tens pmolL-1 in coastal seawater [29,30]. In addition, a UV digestion wasperformed for 250 min using quartz glass cuvettes rather than FEPbottles to investigate whether UV light transparency was sufficientfor the FEP bottles. Efficiency of lamps was tested with old lamps(>4000 hoperation; recommended lifetime of lamps is 9000 h) andwith new lamps (<100 h operation). The tests using old and newlamps have been performed on the same sample of seawater buthave been carried out after different durations samples have beenacidified, with 5 days for tests using old lamps and 4 weeks for tests Fig. 2. UV digestion efficiency experiment for Co and Cu with Southern Ocean water. A) Cu concentrations (in nmol L-) determined after UV exposure of up to 240 min with old Uvlamps>4000 h and new UV lamps <100 h, and using quartz glass cuvettes rather than FEP bottles. Error bars show the standard deviation of three repeated samples. B) The same asA for Co. C) The same as B after spiking the seawater with vitamin B12. The Co concentration after 10 min of UV treatment was higher than at any other time points, indicatingpossible contamination. using new lamps. Co and Cu concentrations increased by 15.6% and 11.4%,respectively, between non UV-treated Southern Ocean seawatersamples (Co: 0.117 ±0.003 nmol L-1, Cu: 0.678±0.034 nmol L-1)and samples UV treated for 30 min. After 30 min, no further sig-nificant increase was observed (t-test, p >0.05). The Co concen-tration in vitamin B12 spiked seawater with no UV treatment wasonly slightly higher by 0.006 nmol L-1(0.123±0.003 nmol L-1) tothe original seawater concentration. After 20 min of UV exposure,Co added as the B12 complex was quantitatively recovered. Totalmeasured Co concentration was 0.223±0.012 nmol L-1. Thisdemonstrates that Co in the vitamin B12 molecule was not retainedon the resin, and after about 10-20 min of UV exposure, all Co wasreleased from the vitamin B12 and quantitatively recovered on theresin. We did not observe any significant difference between usedand new UV lamps (t-test, p> 0.05), indicating that after >4000 hoperation, the UV lamps were still efficiently degrading organiccompounds that complexed Co and Cu. In all tests, Cu and Coconcentrations obtained after 250 min of UV exposure in quartzcuvettes were indistinguishable (t-test, p> 0.05) from those in FEPbottles, indicating the FEP bottles are as suitable as quartz cuvettesfor UV treatment. Cu and Co concentrations in seawater without UVtreatment increased by 7.3% and 8.2%, respectively, with increasedduration of storage from 5 days to 4 weeks of the acidified samplesprior to preconcentration. Hence, it is possible that after 4 weeks ofstorage a fraction of the Cu and Co-complexes was broken downunder acidic conditions, increasing the recovery. Co concentrationsin vitamin B12 spiked seawater increased only slightly in compari-son to the concentration obtained after UV digestion. This indicatesCo-vitamin B12 complexes, do not significantly dissociate by acidi-fication to pH 1.9 for a period of less than 4 weeks. 3.2. Recovery and pH The chelation of metals by the functional groups on the resin isinfluenced by pH, and consequently the recovery of the trace metaldepends on the pH of the sample. Therefore it is necessary to bufferthe acidified sample to a pH where best recoveries are achieved.However,trace metal colloids can be formed after acidified samplesare buffered to a pH higher than 2 and may alter the retention oftrace metal on the resin [31,32]. In this study, pH is adjusted onlineprior to loading onto the resin, minimizing the time trace metalcolloids can be formed and increasing the reproducibility byeliminating changes in time periods samples have been bufferedbefore loading on the resin. To assess the optimal pH for thechelating resin used in this study, we tested the recoveries for Fe,Zn, Cu, Ni, Cd, Pb, Co, and Mn in the range of pH 1.9 and 8.1. Toreduce analytical variability at low concentrations we spiked North Pacific seawater with the multi-element spike (final concentra-tions: 5.35 nmol Fe L-1, 5.76 nmol Zn L-, 7.14 nmol Ni L-1,4.77 nmol Cu L-, 0.98 nmol Co L-1, 2.45 nmol Cd L-1, 0.68 nmol PbL-, 6.14 nmol Mn L-1). Modifications to seawater pH were ach-ieved by addition of different amounts of buffer to the sample priorto loading onto the WAKO resin. Fig. 3 displays the count rates(exact recoveries were only quantified at pH 6.2 and 7.0; seeTable 3) obtained for the different elements and isotopes from thesame seawater sample buffered to different pH values. Count rateswere not corrected for blank contributions and isobaric in-terferences. Hence, a slight increase in count rates for some metalscould have been achieved by an increased buffer contribution withincreasing amounts of buffer added. But these contributions werevery low (<1% at pH 6.4) compared to the concentrations in theutilized seawater (see section ‘3.5 Procedural blanks and detectionlimits'). All elements apart from Cu showed significantly lower re-coveries at the lowest pH of 1.9 and recovery typically increasedwith increasing pH. Cu recoveries were remarkably constant overthe entire pH range tested with slightly lower recoveries at pH 1.9.Recoveries of Cd, Pb, Fe, Zn and Mn showed a decrease at thehighest pH of 8.1. Between pH 5 and 7.9 most elements (Cd, Pb, Cu,Zn and Co) showed a relatively constant recovery, whereas Mn andNi showed an increase in count rates up to pH 7.1. The recovery of Feshowed a maximum between pH 5.6 and 7.4. Good recoveries for allelements apart from Mn at pH 5-8 are very similar to previouslyobserved pH ranges for Toyopearl [17] and NOBIAS [16] resins. Mnrecoveries at pH 5 were about 50% of the maximum recoveryachieved at pH 7.5±0.3 (Fig.3), whereas a low retention of Mn (lessthan 10% of maximum recovery) was obtained at pH 5.0 for theToyopearl resin [17]. Nevertheless, Mn recoveries still increasedsignificantly up to pH 6.2. Isotopic ratios for Pb, Fe, Ni, Cu and Zn were constant over theentire range of pH investigated (Fig.4), which shows that calcula-tions of concentrations of these elements by isotope dilution ispossible over a wide range of pH without any significant bias to oneisotope, provided recovery does not drop sufficiently to alterquantification accuracy. However, Cd showed a decrease of110cd/111Cd ratio with decreasing pH, which can be contributed toMoo+ interferences for both 1Cd and 110cd, with stronger inter-ference for 111cd due to the natural isotope ratio of 96Mo/95Mo of1.73 (we observed 1.7 times larger interference for 111 cd than for110cd). The significance of Moo+ interferences increases withdecreasing pH due to the decrease in Cd recovery, whereas bestrecovery for Mo on the WAKO resin was between pH 2 and 4.5[22].Thus, for Cd analysis it is important to operate at a buffered pHhigher than pH 5 in order to minimize potential MoO+ in-terferences. During a typical analytical run with Cd concentrations Fig.3. Count rates (cps) for the most abundant isotope of Cd, Pb, Fe, Ni, Cu, Zn, Co and Mn in North Pacific seawater with added spikes of trace metals over a pH range between 1.9. and 8.1. Displayed count rates are not corrected for blank contributions and isobaric interferences and were obtained in one analytical session. Recoveries obtained for Cd, Pb, Fe,Ni, Cu, Zn, Co and Mn using a WAKO resin with sample preconcentration pH 6.2 and 7.0 and a NOBIAS resin at pH 6.1 110cd(%) 208Pb(%) 56Fe (%) 60Ni (%) 63Cu (%) 66Zn (%) 59Co (%) 55Mn (%) WAKO pH 6.2 97.1±2.6 96.4±2.8 80.3±2.6 46.2±1.1 99.3±2.7 99.0±2.8 87.8±3.1 41.0±0.9 WAKO pH 7.0 98.4±0.5 96.5±2.5 83.2±0.9 48.0±0.4 100.8±1.2 99.9±1.4 83.3±1.2 59.6±2.4 NOBIAS pH 6.1 85.5±3.1 88.5±1.6 83.1±2.6 38.5±1.4 102.7±3.4 95.0±3.4 73.1±3.2 24.1±0.2 ranging from 0.011 to 1.089 nmol L-1, observed Moo* interferencesresulted in an overestimation of Cd concentrations of 3-9 pmol L-,compared to Moo+ corrected concentrations. This level of inter-ference is negligible at deep water Cd concentrations, but con-tributes a large fraction to surface seawater Cd concentrations,which are typically below 10 pmol L-[33]. For optimal recovery for all eight trace metals using the WAKOresin, a pH range between 6 and 7.5 appears suitable. Preconcen-tration at the lower end of this pH range is preferential to keep thevolume addition of buffer, and consequently the buffer trace element contribution, to a minimum. Recoveries were quantifiedfor all elements using the WAKO resin at pH 6.2 and 7.0, andcompared to the NOBIAS resin at pH 6.1 (optimal pH range:6.2±0.3[16]). To quantify trace metal recovery from the chelatingresin, standard additions using multi-element spike were per-formed in triplicate (duplicate for WAKO at pH 7.0) in North Pacificseawater. Exact preconcentration factors (loaded sample volumedivided by volume of eluate) were determined by mass in thepreconcentrated samples and used to determine the added con-centrations in the eluate. Recoveries were determined as the ratio Fig. 4. Isotope ratios obtained for Cd, Pb, Fe, Ni, Cu and Zn (natural isotopic composition) over a pH range employed during preconcentration of between 1.9 and 8.1 in North Pacificseawater. Ratios were not corrected for MoO+ interferences and instrumental mass bias. Horizontal lines indicate the natural isotopic ratios. of the slopes obtained from the preconcentrated standard additionsin seawater to the slopes of calibration curves prepared directly inthe elution acid. Table 3 summarizes the obtained recoveries for themost abundant isotope for each element. However, due to the differing recoveries of Mn with changing pH, itis crucial to perform standard addition in seawater with the samepH as sample pH and to assure that samples are buffered to thesame pH to guarantee accurate Mn determination. 3.3. Sample carry-over The recovery experiments showed that we often do not obtain100% recovery. Whereas this does not seem to cause a problem formetal quantification of single samples, problems could occur forthe analysis of the following sample if metals were not fully elutedfrom the resin (during elution and cleaning step) and carried overto the next sample. To assess this risk, we measured five manifoldblanks after the preconcentration of North Pacific seawater whichwas spiked to increase concentrations of trace metals (Fe:51 nmol L-1, Zn: 43 nmol L-1, Ni: 48 nmol L-, Cu: 45 nmol L-1, Co:5 nmol L-, Cd: 25 nmol L-1, Pb: 7 nmol L-1, Mn: 51 nmol L-1). Thishas been performed for both, WAKO and NOBIAS resin. The ob-tained carry-over was negligible for all elements except Fe and Ni(Fig. 5). Carry-over of Fe was 0.5% for both resins and was entirelywashed out after the third manifold blank. Carry-over of Ni was0.3%using the NOBIAS resin and dropped to background level at thesecond manifold blank. Carry-over of Ni using the WAKO resin was1.3% and needed two manifold blanks before decreasing to less than0.5%. Sample carry-over of 0.5-1.3% for Fe and Ni should not cause aproblem if the concentration of preconcentrated samples arewithin the same order of magnitude, but caution needs to beapplied if samples with very low concentrations are preconcen-trated directly after samples containing Fe or Niconcentrations thatare an order of magnitude or higher. To monitor the sample carry-over during preconcentration of a batch of samples, we recommendrunning two manifold blanks after every 10th sample. 3.4. Linearity To verify the concentration range over which the recovery fromthe resin is linear and to investigate whether there is a potential offull saturation of the resin (with the used resin volume of approx-imately 15 pL) at certain threshold concentrations, standard addi-tions were made to seawater solutions. For Ni, Cu, Zn and Co nodecrease in recovery was observed over the entire concentrationrange tested in this experiment as shown in Fig. 6. All data points liein close proximity to the regression line obtained excluding the two Fig. 5. Carry-over of metals from an enriched North Pacific seawater sample to five following manifold blanks using a WAKO and a NOBIAS resin for preconcentration. The carry-over is given as percentage of counts of the blank t2318o counts of the sample. This test was performed three times and error bars show standard deviations of triplicates. highest concentrations of the standard additions. R2values for theregression lines were >0.997 for all standard additions. For Cd,Pb,and Fe a slight decrease in recovery could be observed at concen-trations higher than 100 nmol Cd L-1,30 nmol Pb L-1 and 200 nmolFe L-. Data points at higher concentrations lie below the regressionline obtained excluding those data points. As these concentrationsare much higher than typically observed natural seawater con-centrations, the resin volume and sample volume used in this studycan be applied over a wide range of seawater environments(coastal, deep sea). However in anoxic near sediment samples theseconcentrations can be exceeded for Fe [34], in which case adjust-ment ofsample or resin volume should be considered. 3.5. Procedural blanks and detection limits At very low concentrations of trace metals in seawater it iscrucial to accurately determine the contributions of reagents, thepreconcentration device (i.e. resin, tubing) and ICP-MS to the observed sample concentration. We separately analyzed the con-tributions of the buffer (NH4Ac buffer blank) and combined back-ground counts of the preconcentration procedure, including theelution acid, chelating resin, manifold, PP-vials and the analysis byICP-MS (manifold blank). Buffer blanks were minimized by anadditional buffer clean-up column, and especially for Zn bufferblanks were much lower than previously reported [17,18]. The ob-tained values for manifold and buffer blank, the combined (pro-cedural) blank, and the resulting detection limits are summarizedin Table 4, and reveal similar values to previously reported detec-tion limits of comparable methods [16-18,20]. 3.6. Precision and accuracy The precision and accuracy of the method was evaluated byanalysis of SAFe reference seawater S, D1 and D2. The results frommultiple measurements of different analytical runs and the avail-able consensus values for all measured elements are listed in added Co conc.(nmol_) Fig. 6. Linear regressions for high concentrated standard additions. Red line: regressions obtained by excluding the highest two concentrations. Red circles: data points included tocalculate the linear regression. Standard deviations in count rates for each measurement were typically below 3%. (For interpretation of the references to colour in this figure legend,the reader is referred to the web version of this article.) Table 4 Values for manifold and buffer blanks (±1 standard deviation of repeated measurements) as well as combined blank with resulting detection limits (three times the standarddeviation of the blank: 3 xSD). Manifold blank Buffer blank Procedural blank Detection limit (3×SD) (pmol L) (pmol L-1) (pmol L-) (pmolL-) Cd 0.7±0.2 1.5±0.2 2.2±0.3 0.8 Fe 33.4±4.4 34.0±8.6 67.6±9.6 28.8 Ni 111.6±19.5 0.1±0.2 111.7±19.5 58.5 Cu 11.1±2.3 3.1±2.1 14.2±3.1 9.3 Zn 4.7±1.6 25.3±9.2 30.0±9.4 28.1 Mn 2.3±1.6 11.2±5.4 13.5±5.6 16.9 Co 2.1±0.7 0.6±0.3 2.7±0.8 2.5 Pb 0.084±0.003 0.3±0.2 0.4±0.2 0.6 Analyzed reference seawater. Mean values and standard deviation in nmol L- for Cd, Pb, Fe, Ni, Cu, Zn, Mn and Co and available consensus values in nmol L-(±1 standarddeviation),n= number of measurements. SAFeS SAFe S consensus value SAFe D1 SAFe D1 consensus value SAFe D2 SAFe D2 consensus value n=11 n=13 n=7 Cd 0.003±0.002 0.001 1.015±0.020 1.016±0.032 1.089±0.043 1.011±0.024 Pb 0.050±0.003 0.049±0.002 0.025±0.003 0.029±0.003 0.028±0.001 0.029±0.002 Fe 0.091±0.009 0.095±0.008 0.645±0.037 0.69±0.04 1.029±0.038 0.956±0.024 Ni 2.415±0.086 2.34±0.09 8.693±0.197 8.79±0.27 9.625±0.175 8.85±0.26 Cu 0.514±0.037 0.53±0.05 2.216±0.087 2.33±0.11 2.176±0.152 2.34±0.15 Zn 0.070±0.005 0.071±0.010 7.327±0.277 7.59±0.36 7.433±0.216 7.62±0.26 Co 0.005±0.001 0.005±0.001 0.048±0.003 0.046±0.005 0.048±0.003 0.047±0.003 Mn 0.814±0.033 0.810±0.062 0.365±0.017 一 0.437±0.029 0.36±0.05 Fig.7. Depth profiles of eight trace metals. Samples were collected during cruise M107using trace metal clean water sampler on June 12, 2014(18°15'N,16°75'W). Error barsindicate uncertainties calculated after the Nordtest approach. Table 5. The calculated mean values include several measurementsfrom the same bottle of D2, two different bottles of S1 and threedifferent bottles of D1. Relative standard deviations were between1.8% and 7.3% for concentrations >0.1 nmol L-. between 4.7% and9.7% for concentrations of 25-100 pmol L-1 and increased at verylow concentrations to 62.6% for 3 pmol L-1 of Cd. Precisions varylargely for different elements and between different concentrationranges and may also be affected by the use of different bottles ofreference seawater. However, observed relative standard deviationsdid not differ significantly from previously reported precisions for Sand D2 obtained using similar methods [16-19]. The results for Sand D1 were in good agreement with the consensus values. Wenote that concentrations of the reference seawater D2 for Cd, Fe,Mn and Ni are slightly (<10%) higher than the reported consensusvalues. As measurements of S and D1 for these elements were ingood agreement, we assume that our measurements were accurate,but that the bottle of SAFe D2 utilized here, likely containedsomewhat higher concentrations of those elements. 3.7. Environmental application一 vertical oceanic profiles Vertical profiles of seawater samples were collected using tracemetal clean GEOTRACES protocols in June 2014 in the tropicalNortheast Atlantic as part of the cruise Meteor 107. The sampleswere filtered on board using 0.2 um pore size cartridge filters(Acropak 500, Pall) and acidified to pH 1.9 and subsequentlyanalyzed in our laboratory for eight trace metals. The samplinglocation (18°15'N,16°75'W) was 76 km (41 nm) off the Mauritaniancoast and within an oxygen minimum zone with oxygen levelsreduced to below 50 umol kg-1 at depths between 50 and 70 m,and between 420 and 450 m. Dissolved Cd, Ni, Cu and Zn (Fig. 7)showed a nutrient-like profile with lowest concentrations in thesurface waters and increasing concentrations with depth due toremineralization of sinking organic matter [35]. In contrast, dis-solved Mn concentrations were enhanced in the surface waters anddecreased with depth. The high dissolved Mn concentrations in thesurface waters are maintained by photo-reduction of Mn(IV)-oxides to the soluble Mn(II)[36], whereas Mn in subsurface wa-ters is affected by particle scavenging [7]. Dissolved Pb profilesshowed very low concentrations in surface waters, with a slightincrease with depth, and were consistent with other observationsin this area [37]. Dissolved Fe and Co showed typical hybrid-typedepth distributions, with low concentrations in the surface wa-ters due to microbial uptake. At depth, Fe and Co showed increasesin the low oxygen regions as a result of release from organic matterduring remineralization, with lower concentration at other depthsas a result of scavenging processes of the elements onto sinkingparticles 38,391. 4. Conclusion Here we present a method for the simultaneous analysis of Cd,Pb, Fe, Cu, Ni, Zn, Mn and Co concentrations in seawater using anautomated preconcentration device. The approach uses a samplevolume of only 10 mL for preconcentration using syringe injection,thereby avoiding the need for large sample volumes. Samples arepH buffered inline reducing the sample preparation time andanalytical artefacts by colloid forming trace metals at pH higherthan 2. The blank contribution of the buffer is minimized via aseparate additional buffer clean-up column. Isotope-dilution isused for determination of all elements except Mn and Co, elimi-nating sensitivity to variations in recovery and preconcentrationfactor. However, minimal variability in automated sample loading or elution volumes allows accurate quantification via standardaddition which is particularly important for the monoisotopic ele-ments Co and Mn. Observed concentrations of reference seawaterare in good agreement with available consensus values, confirmingthe high levels of accuracy. Full recovery of Co and Cu were ach-ieved only after UV digestion of samples. Collectively, best re-coveries for the suite of elements studied here were between pH6-7.5 for the WAKO resin. This was mainly determined by lowrecoveries of Mn and increased MoO+ interferences on Cd at lowerpH. In direct comparison, of the WAKO to the NOBIAS resin, wecould achieve better recoveries for most elements using the WAKOresin which is particularly important at very low concentrations oftrace metals such as <10 pmol L-1 for Cd and Co in surface waters.Further improvement in time efficiency and sensitivity might beachieved by on-line coupling of the preconcentration systemdirectly to ICP-MS. Acknowledgements The authors would like to thank Shigehiro Kagaya for facilitatingthe supply of the WAKO resin and the Captain and crew of the R/VMeteor. We also thank two anonymous reviewers for theirconstructive comments on this manuscript. This work was sup-ported by The Deutsche Forschungsgemeinschaft as part of Son-derforschungsbereich(SFB) 754: 'Climate-BiogeochemistryInteractions in the Tropical Ocean'. References ( [ 1] P .W. B o yd, T. J i c kells, C .S. Law, S . B lai n , E.A. Boyle, K.O. B uessele r , K.H. C o a le , JJ. Culle n , H . J.W. de B a ar, M . F ol l ows, M . Harv e y, C . L a n c elo t , M . L e vasseur, N.P.J. Owens,R. P o llard , R . B . Rivk in , J. Sarmiento, V . Schoemann, V . S metacek , S. T a k eda, A. Ts u d a, S. Turner, A.J . Watson, Mesoscale i ron e n r ichment e x -periments 1 993-2005: s y nth es is and f u tur e directions, Scie n ce 315 (2007) 612-617 . ) ( [ 2] F .M.M. Morel, N . M. P r ice, The biogeochemical cycles of trace metals in t he oceans, Science 300 (2003)944 - 9 4 7. ) ( [3] C .M. M o ore, M. M . Mil l s, E. P . A c h ter ber g, R. J . G e i de r, J . L a Roc h e, M . I. L u c a s,E.L . McDonagh,X. Pan , A.J. Po u l ton,M.J.A. Rijkenberg, D .J. Suggett, S.J. U ssh e r,E.M.S. Woodward, L a r ge-scale d i stribut i on o f A t l anti c ni t r ogen f i xation control l e d b y i ron a vailability, Nat . Geosci . 2 (2009) 867 -8 71. ) ( [4] C.M. Moore, M .M. M i ll s , K .R. Arrigo, I . Berman - Frank, L . Bopp, P.W. Boyd, E .D. G albraith, R .J . G eide r , C . G uieu, S . L. J a ccard, T . D. J i c kells, J . L a R o che, T.M. L e n to n, N .M. M ahowald, E. M ara n on, I. Marin o v,J. K . Moore,T. Nakatsuka, A. Oschl i es, M .A. Saito, T .F. T hin gstad, A. T suda, O . U l lo a , P r ocesses an d pat - terns of oceanic nutr i en t limitation , Nat. Geosci. 6 (2013) 70 1 - 7 1 0. ) ( [5] M . A. S a ito, T . J . G oep f ert, J . T . Ri t t , So m e t houghts on th e con c ept of c o l - i mitation: t hree d efinit i ons a nd t h e i m p o rtance of b i o a v ailab i l i ty , Li m nol. Ocean o gr. 53 (2008) 276-290. ) [6] K.W. Bruland, M.C. Lohan, Controls of trace metals in seawater, in:H. Elderfield (Ed.), The Oceans and Marine Geochemistry, Elsevier, Oxford,2006, pp. 23-47. W.M. Landing, K.W. Bruland, Manganese in the North pacific, Earth Planet S. C.Lett. 49 (1980)45-56. A.M. Aguilar-Islas, K.W. Bruland, Dissolved manganese and silicic acid in theColumbia River plume: a major source to the California current and coastalwaters off Washington and Oregon, Mar. Chem.101 (2006)233-247. [9]B.K. Schaule, C.C. Patterson, Lead concentrations in the Northeast pacific -evidence for global anthropogenic perturbations, Earth Planet S. C. Lett. 54(1981)97-116. [10]E.A. Boyle, S.D. Chapnick, G.T. Shen, M.P. Bacon, Temporal variability of lead inthe western North-Atlantic,J. Geophys Res. Oceans 91 (1986)8573-8593. ( [1 11] ( G .M. H e nderson, R.F. Anderson,J. Adkins, P. Anderss o n, E. A . B o yle,G . C u tte r , H . de Baar , A. Eisenhauer,M. Frank, R. F rancois,K. O rians,T . G am o , C . G erman , W. J e nkins, J . M offe t t, C. J eandel, T. j ickells , S . Kr i shnaswami, D. M ackey , C. I. Measures, J.K . Moore, A. Osch l ies, R. Pollard , M.R.D . van der Loeff, R . Schlitzer, M. S harma , K. vo n Damm,J. Zhang, P . M a sq u e,S.W.Grp, G E O- T R AC ES - a n i nternation a l s t u dy o f the glo b a l marine biogeoche m i c al cycl e s of trace elements and t h eir isotope s , Chem.Erde-Geochem . 67 (2007)85- 13 1. ) [12]K.W. Bruland, R.P. Franks, G.A. Knauer, J.H. Martin, Sampling and analyticalmethods for the determination of copper, cadmium, zinc, and nickel at thenanogram per liter level in sea-water, Anal. Chim. Acta 105 (1979)233-245. [13]L.G. Danielsson, B. Magnusson, S. Westerlund, Improved metal extractionprocedure for determination of trace-metals in sea-water by atomic-absorption spectrometry with electrothermal atomization, Anal. Chim. Acta98 (1978) 47-57. [14] J.F. Wu, E.A. Boyle, Low blank preconcentration technique for the determi-nation of lead, copper, and cadmium in small-volume seawater samples byisotope dilution ICPMS, Anal. Chem. 69 (1997) 2464-2470. [15]J.F. Wu, Determination of picomolar iron in seawater by double Mg(OH)2precipitation isotope dilution high-resolution ICPMS, Mar. Chem. 103 (2007)370-381. ( [16] D .V. B i ller, K.W. B r u la n d, A n a lysis o f M n , Fe , C o, N i, C u , Z n, C d, a nd P b i n seawater usin g the N obias-c h e l a t e P A 1 r e sin a n d mag n etic se c tor in d uc t ivelycou p led plasma m ass spect r ometry (ICP- M S), M ar. Chem. 1 3 0 (201 2 )12-2 0 . ) ( [171 A . Mil n e, W. Landing,M. B i z imis, P. M o rton, Dete r m i nation of Mn , Fe , Co , Ni , C u , Zn, Cd a nd Pb i n seawater using hi g h resolution magnetic se c tor induc- t ive l y c ou p led mass spec t rometry ( HR-I C P-MS ) , Anal. Chim. A cta 665 ( 2010) 200-207. ) [18]M.E. Lagerstrom, M.P. Field, M. Seguret, L. Fischer, S. Hann, R.M. Sherrell,Automated on-line flow-injection ICP-MS determination of trace metals (Mn,Fe, Co, Ni, Cu and Zn) in open ocean seawater: Application to the GEOTRACESprogram, Mar. Chem. 155 (2013) 71-80. [19]Y. Sohrin, S. Urushihara, S.Nakatsuka, T.Kono, E. Higo, T. Minami, K.Norisuye,S. Umetani, Multielemental determination of GEOTRACES key trace metals inseawater by ICPMS after preconcentration using an ethylenediaminetriaceticacid chelating resin, Anal. Chem. 80 (2008)6267-6273. [201J.-M. Lee, E.A. Boyle, Y. Echegoyen-Sanz, J.N. Fitzsimmons, R. Zhang,R.A. Kayser, Analysis of trace metals (Cu, Cd, Pb, and Fe) in seawater usingsingle batch nitrilotriacetate resin extraction and isotope dilution inductivelycoupled plasma mass spectrometry, Anal. Chim. Acta 686 (2011)93-101. [21]E.P. Achterberg,T.W. Holland, A.R. Bowie, R. Fauzi, C. Mantoura, P.J. Worsfold,Determination of iron in seawater, Anal. Chim. Acta 442 (2001)1-14.一 [22]S.Kagaya, E. Maeba, Y. Inoue, W. Kamichatani,T. Kajiwara, H. Yanai, M. Saito,K. Tohda, A solid phase extraction using a chelate resin immobilizing car-boxymethylated pentaethylenehexamine for separation and preconcentrationof trace elements in water samples, Talanta 79 (2009) 146-152. [23]S. Kagaya, Y. Saeki, D. Morishima, R. Shirota, T. Kajivvara, T. Kato, M. Gemmei-Ide, Potential of presep(R) polychelate as a chelating resin: Comparativestudy with some aminocarboxylic acid-type resins, Anal. Sci. 29 (2013)1107-1112. [24]1J. de Jong, V. Schoemann, D. Lannuzel, J.L. Tison, N. Mattielli, High-accuracydetermination of iron in seawater by isotope dilution multiple collectorinductively coupled plasma mass spectrometry (ID-MC-ICP-MS) using nitri-lotriacetic acid chelating resin for pre-concentration and matrix separation,. Anal. Chim. Acta 623 (2008) 126-139. [25] B. Magnusson, T. Naykki, H. Hovind, M. Krysell, Handbook for Calculation ofMeasurement Uncertainty in Environmental Laboratories, Nordic Innovation,Oslo, Norway, 2012. www.nordtest.info [26] K.W. Bruland, Geotraces and SAFe Intercalibrations, Consensus Values for theGEOTRACES 2008 and SAFe Reference Samples, 2009. http://es.ucsc.edu/~kbruland/GeotracesSaFe/kwbGeotracesSaFe.html. [27]E.P. Achterberg, C.B. Braungardt, R.C. Sandford, P.J. Worsfold, UV digestion ofseawater samples prior to the determination of copper using flow injectionwith chemiluminescence detection, Anal. Chim. Acta 440 (2001)27-36. [28]M. Vega, C.M.G. van den Berg, Determination of cobalt in seawater by catalyticadsorptive cathodic stripping voltammetry, Anal. Chem. 69 (1997) 874-881. [29]S. Bonnet, A. Tovar-Sanchez, C. Panzeca, C.M. Duarte, E. Ortega-Retuerta,S.A. Sanudo-Wilhelmy, Geographical gradients of dissolved vitamin B12 in theMediterranean sea, Front. Microbiol. 4 (2013). |30Q.Z.Zhu, R.C. Aller, A. Kaushik, Analysis of vitamin B12 in seawater and ma-rine sediment porewater using ELISA, Limnol. Oceanogr. Meth. 9 (2011)515-523. [31]C. Schlosser, C.L. De La Rocha, P.L. Croot, Effects of iron surface adsorption andsample handling on iron solubility measurements, Mar. Chem. 127 (2011)48-55. [32]K. Kremling, M.O. Andreae, L. Brigmann, C.M.G. van den Berg, A. Prange,M. Schirmacher, E. Koroleff, K. Kremling, J. Kus, Determination of trace ele-ments, in: K. Grasshoff, K. Kremling, M. Ehrhardt(Eds.), Methods of SeawaterAnalysis, Wiley-VCH Verlag GmbH, 2007, pp. 253-364. [33]R.F.C. Xie, S.J.G. Galer, W. Abouchami, M.J.A. Rijkenberg,J.De Jong, H.J.W. deBaar, M.O. Andreae, The cadmium-phosphate relationship in the westernSouth Atlantic - The importance of mode and intermediate waters on theglobal systematics, Mar. Chem. 177 (2015)110-123. [34]F. Scholz,C.R. Loscher, A. Fiskal, S. Sommer, C. Hensen, U. Lomnitz, K. Wuttig,J. Gottlicher, E. Kossel, R. Steininger, D.E. Canfield, Nitrate-dependent ironoxidation limits iron transport in anoxic ocean regions, Earth Planet S. C. Lett.454(2016)272-281. [35]K.W. Bruland, Oceanographic distributions of cadmium, zinc, nickel, andcopper in the North pacific, Earth Planet S. C. Lett. 47 (1980) 176-198. [36]W.G. Sunda,S.A. Huntsman, Photoreduction of manganese oxides in seawater,Mar.Chem. 46 (1994) 133-152. [37] A.E. Noble, Y. Echegoyen-Sanz, E.A. Boyle, D.C. Ohnemus, P.J. Lam, R. Kayser,M. Reuer, J.F. Wu, W. Smethie, Dynamic variability of dissolved Pb and Pbisotope composition from the US North Atlantic GEOTRACES transect, Deep-Sea Res. Pt Ii 116 (2015) 208-225. 38]P.W. Boyd,M.J. Ellwood,The biogeochemical cycle of iron in the ocean, Nat.Geosci. 3 (2010)675-682. [39]M.A. Saito, J.W. Moffett, Temporal and spatial variability of cobalt in theAtlantic Ocean, Geochim. Cosmochim. Ac 66 (2002) 1943-1953. 为了研究海洋中微量金属的生物地球化学循环,需要一种能够同时分析痕量和超痕量多种元素的快速、自动化、高通量分析方法。这里我们提出一个分析方法使用商用自动预浓缩设备(SeaFAST)准确体积加载和在线pH缓冲的样本在装船前螯合树脂和光)(kouichi和随后的同步分析铁(Fe)、锌(锌)、铜(铜)、镍(镍)、镉(Cd)、铅(Pb),钴(Co)和锰(Mn)highresolution电感耦合等离子体质谱法(HR-ICP-MS)。采用同位素稀释法测定样品中Fe、Zn、Cu、Ni、Cd、Pb的含量,标准添加Co、Mn。结果表明,该螯合树脂对所有分析元素均具有较高的亲和力,除Mn(60%)和Ni(48%)外,其余元素的回收率均在83 ~ 100%之间,与NOBIAS螯合- pa1树脂相比,Ni、Cd、Pb、Co、Mn的回收率较高。采用WAKO树脂对镍和锰的还原回收率不影响定量精度。在较大pH范围(pH 5e8)内,除Mn外,其他微量金属的保留效率相对稳定。Mn量化使用标准除了要求准确样品酸度与最优恢复调整7.5±0.3。紫外消解使海水中Co和Cu的回收率分别提高了15.6%和11.4%,达到了对添加的含钴维生素B12复合物的充分分解。使用高纯试剂可以达到较低的空白水平和检测限(如0.029 nmol L“1为Fe, 0.028 nmol L”1为Zn)。采用安全S、D1及D2参考海堤进行精度及准确度评估,所得结果与现有共识值一致。该方法适用于沿海和海洋海域微量元素的高通量同时分析。我们成功地应用了对2014年6月在大西洋东北部采集的样品的分析方法
确定


还剩11页未读,是否继续阅读?

产品配置单
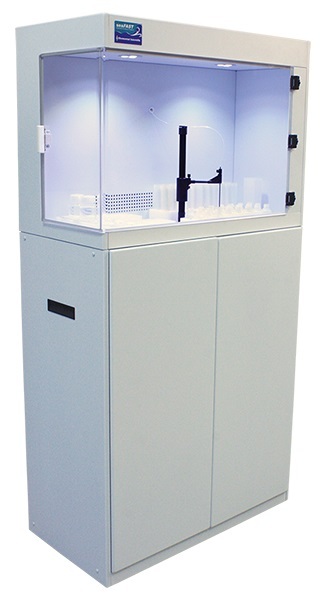
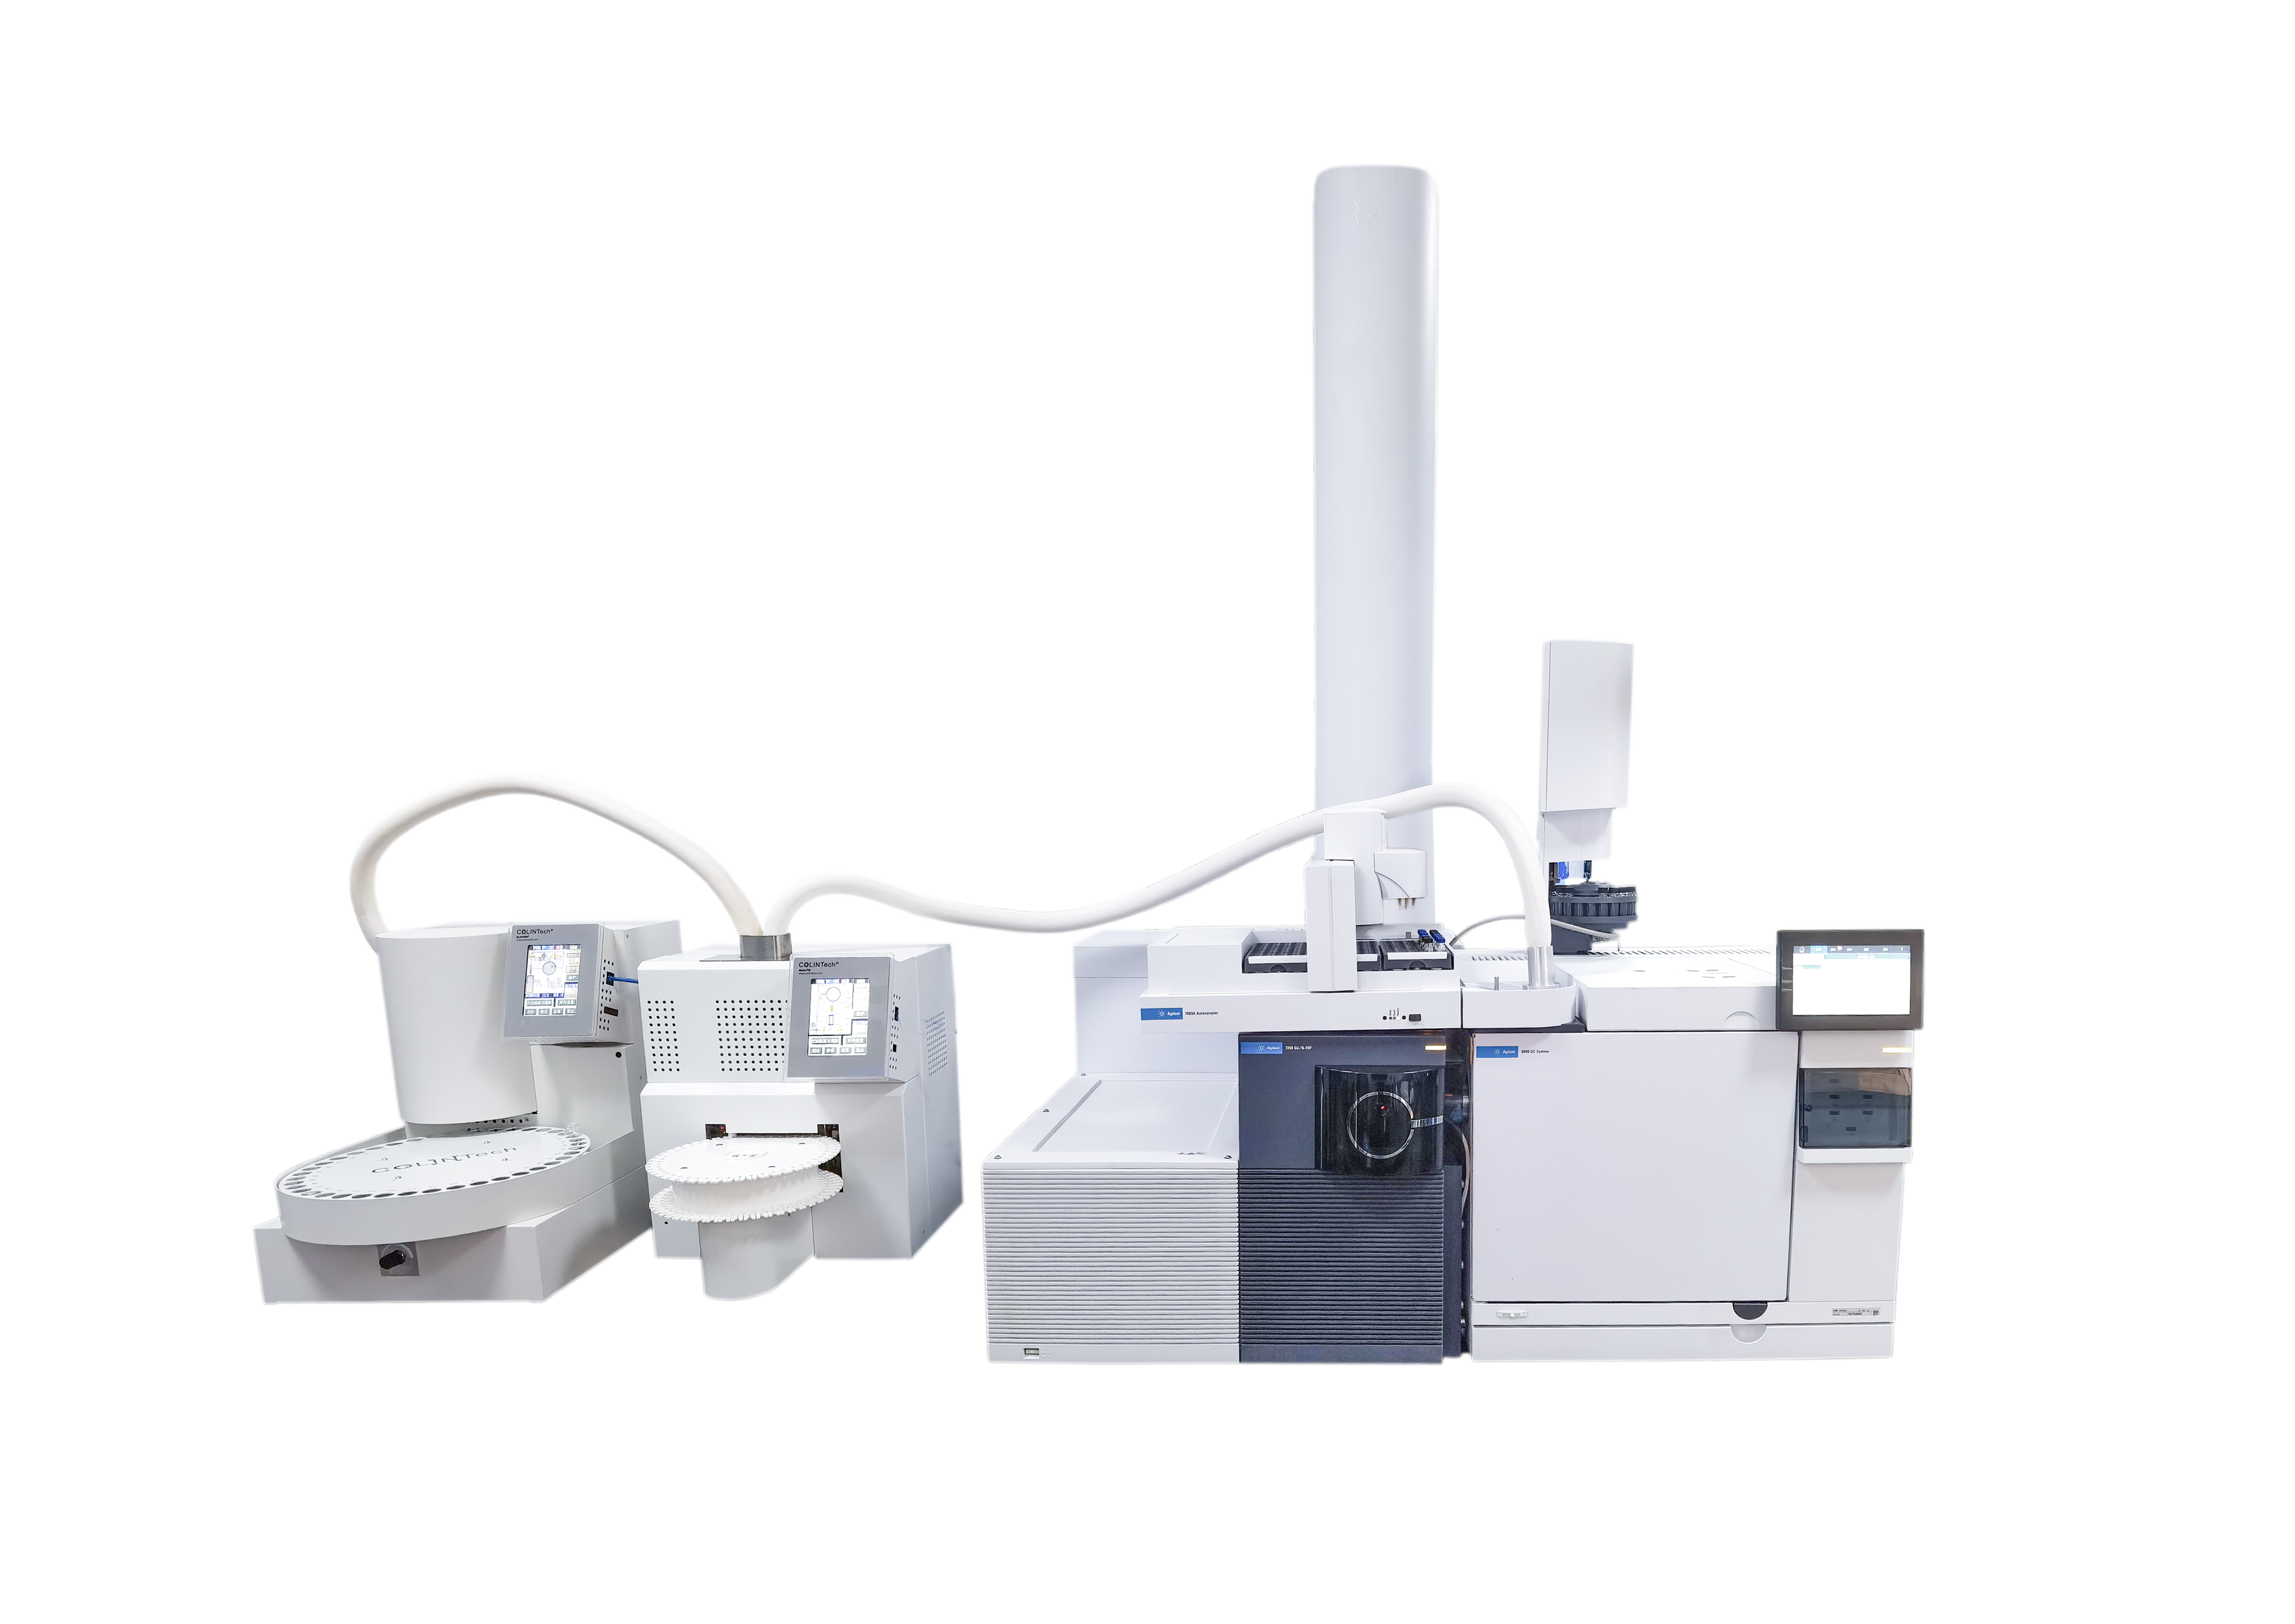
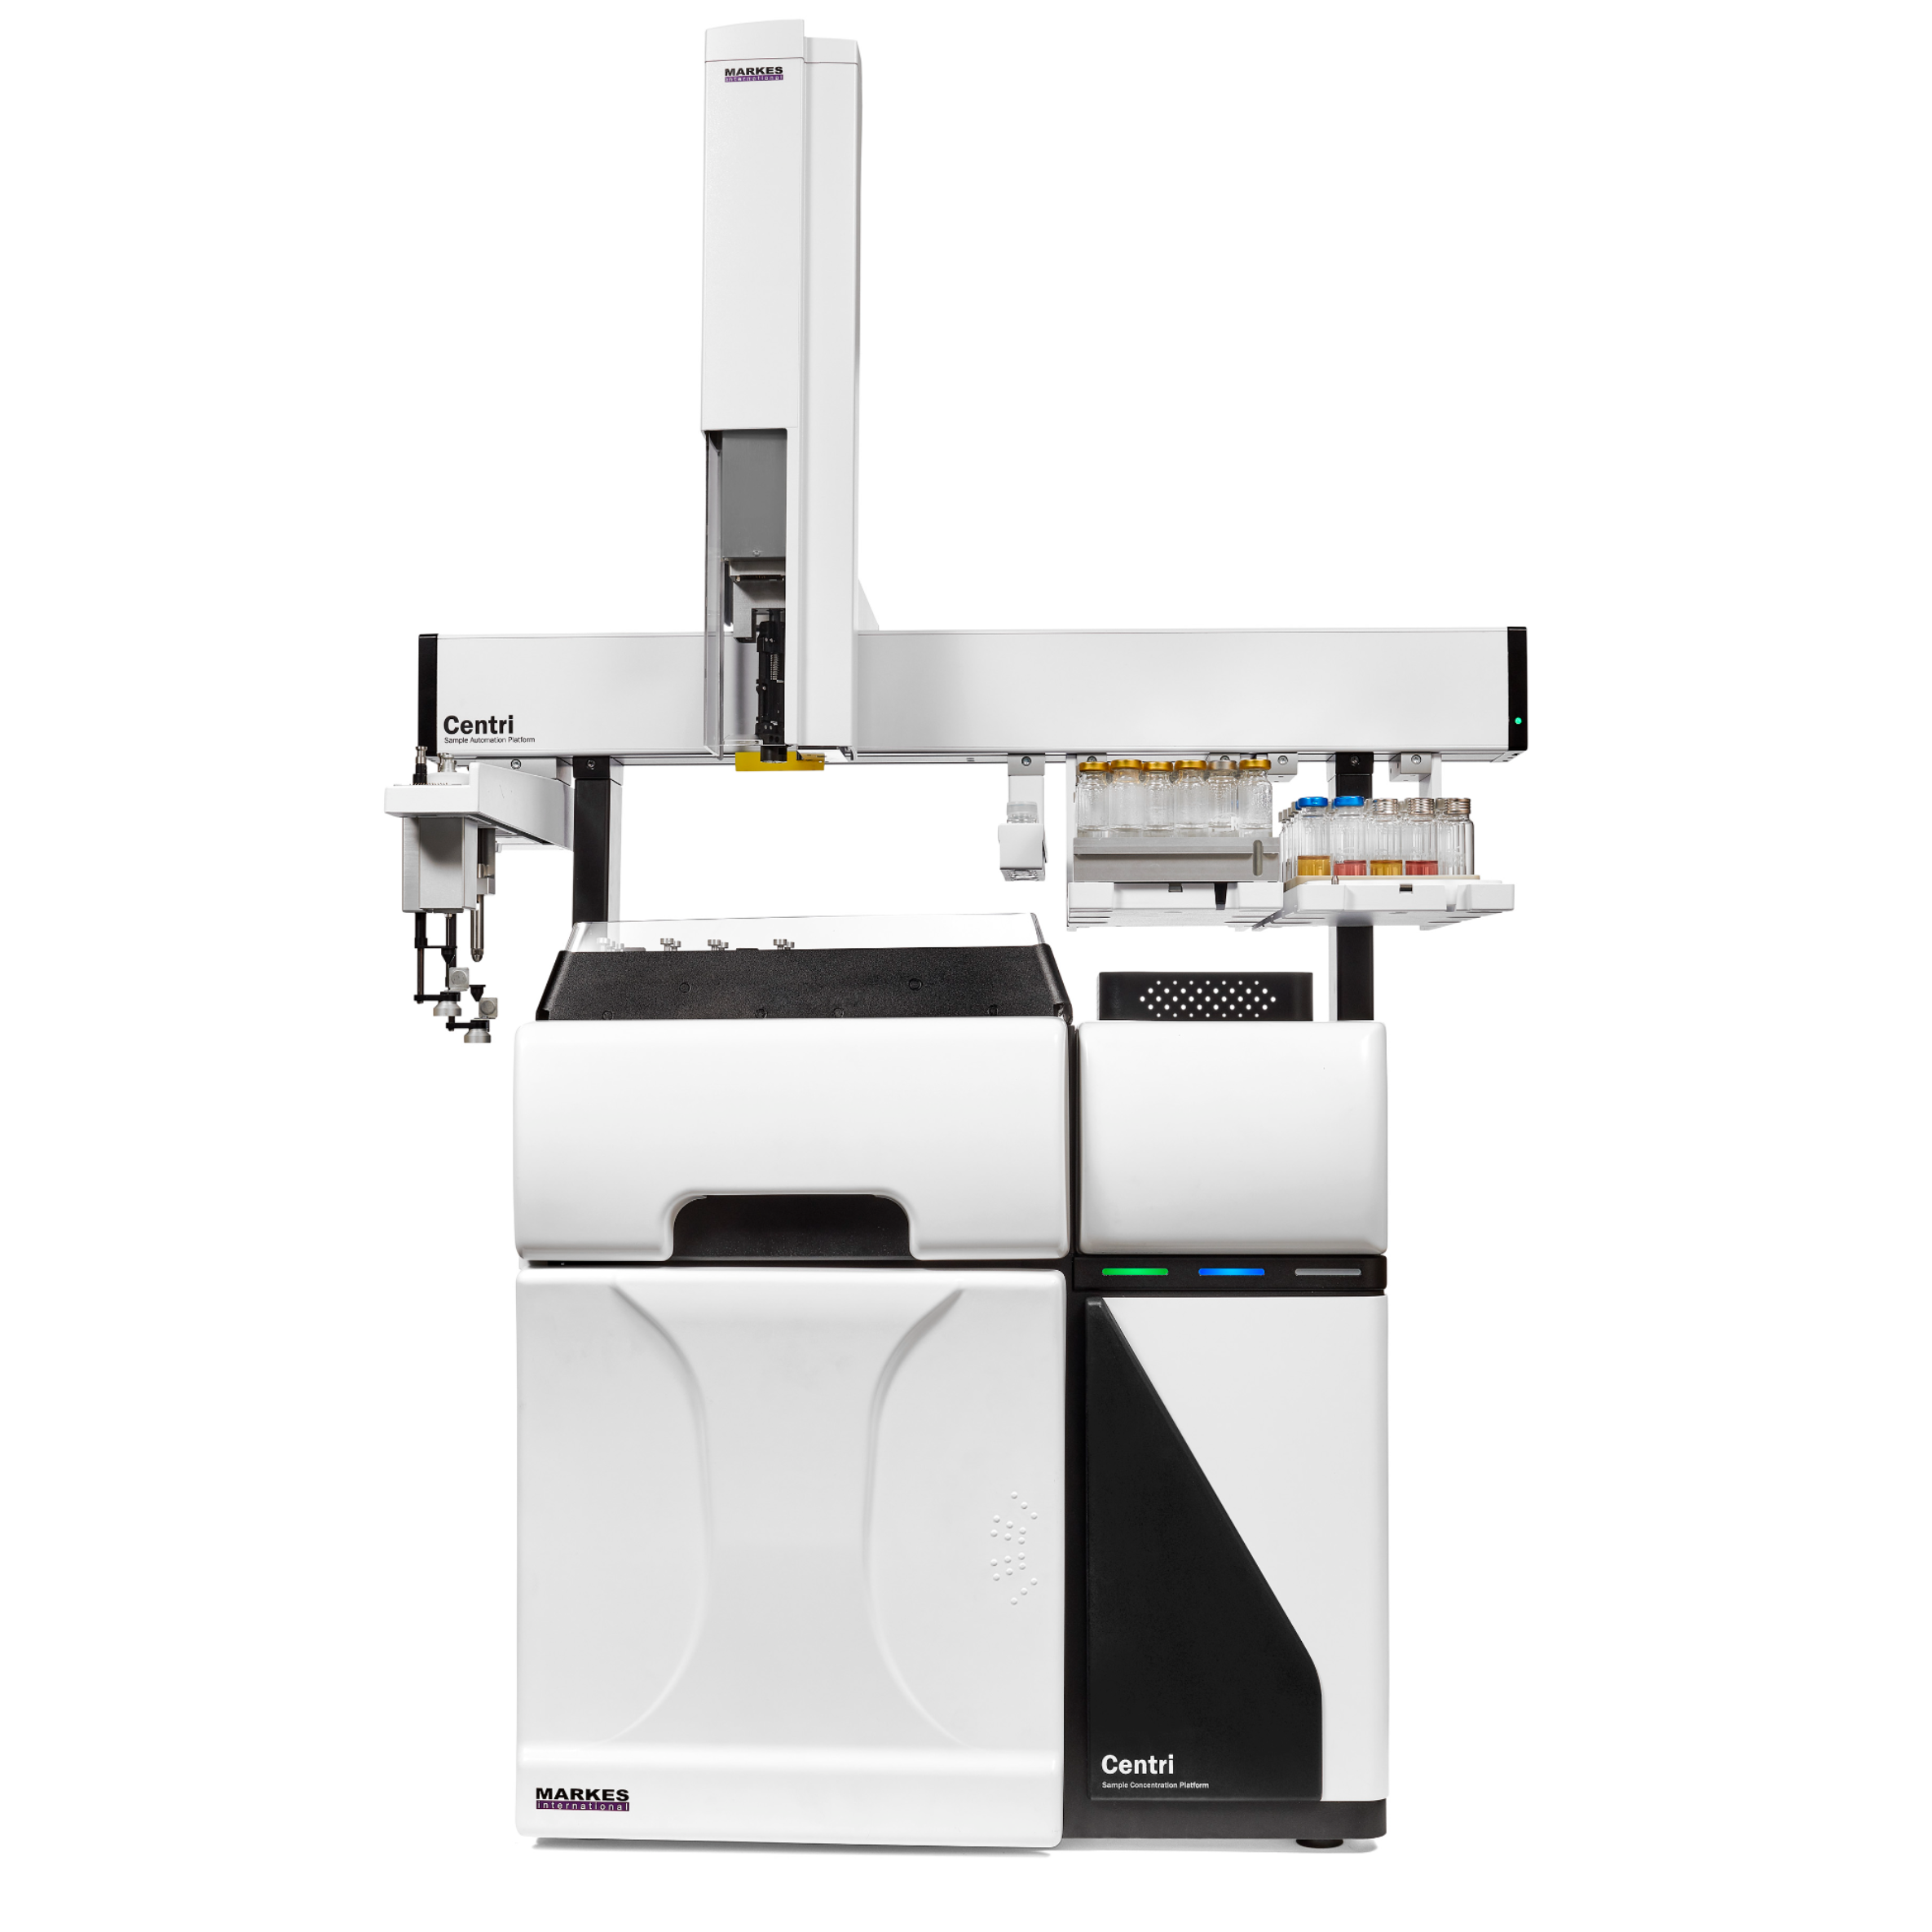
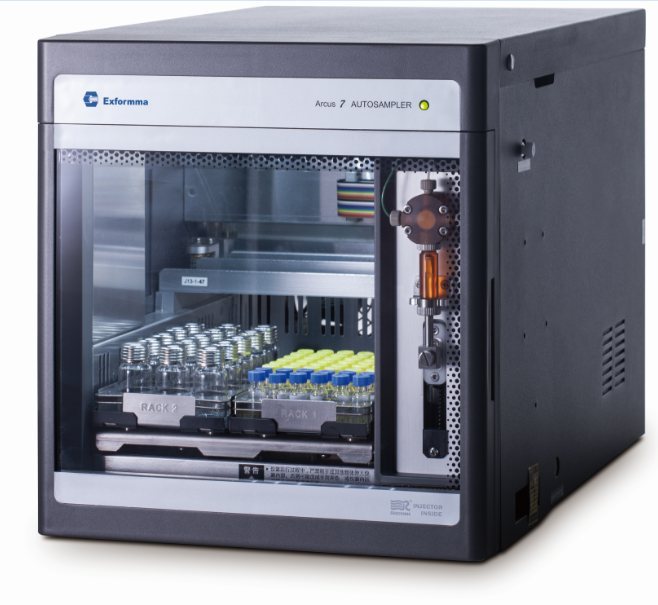
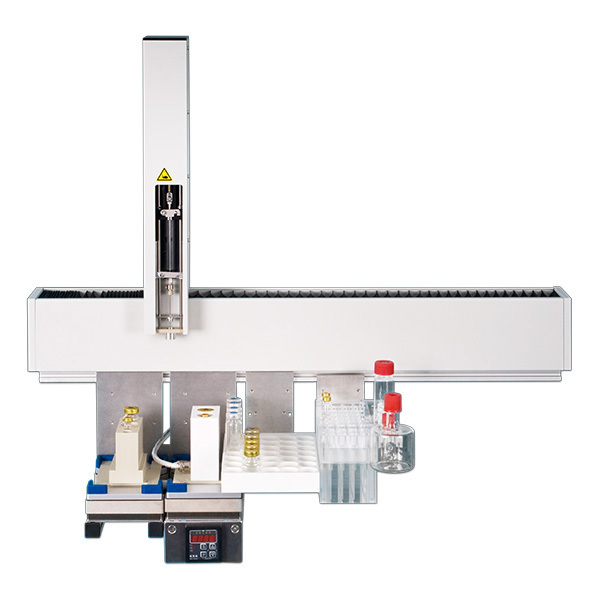
上海凯来仪器有限公司为您提供《海水中Fe、Zn、Cu、Ni、Cd、Pb、Co、Mn等离子体检测方案(等离子体质谱)》,该方案主要用于环境水(除海水)中(类)金属及其化合物检测,参考标准--,《海水中Fe、Zn、Cu、Ni、Cd、Pb、Co、Mn等离子体检测方案(等离子体质谱)》用到的仪器有seaFAST 全自动海水预浓缩系统
推荐专场
相关方案
更多
该厂商其他方案
更多