


方案详情
文
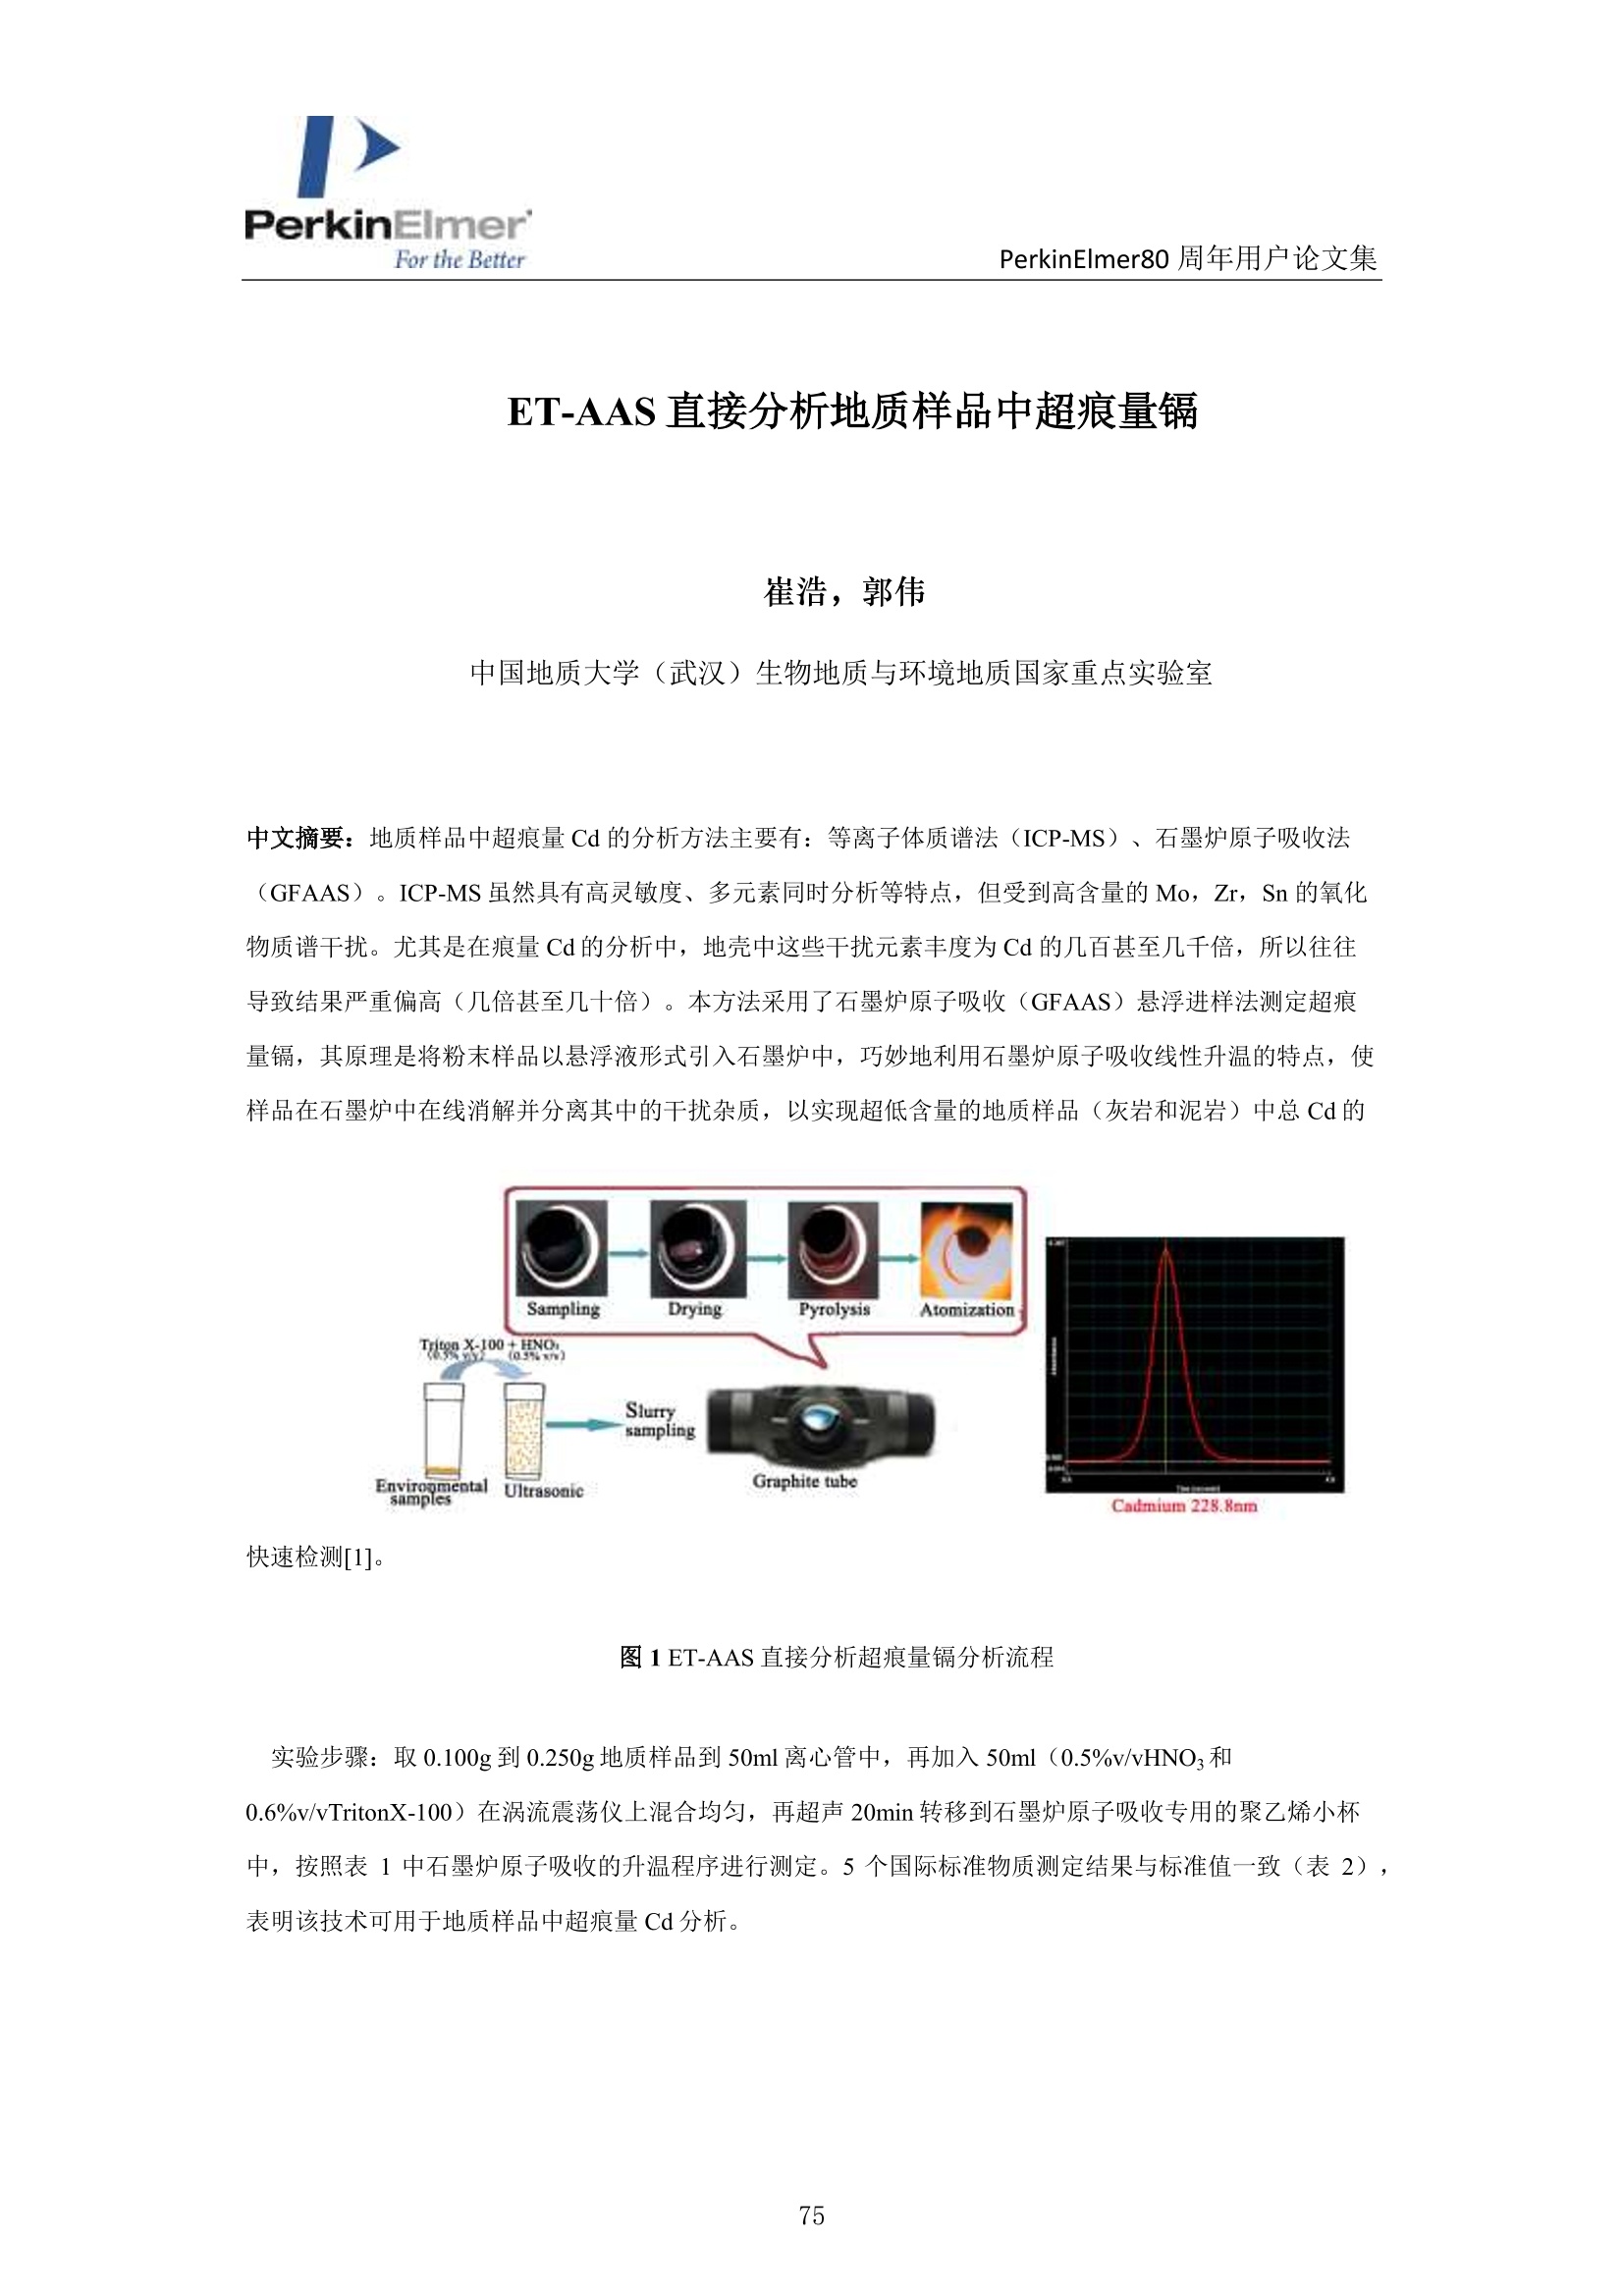
地质样品中超痕量Cd 的分析方法主要有:等离子体质谱法(ICP-MS)、石墨炉原子吸收法(GFAAS)。ICP-MS 虽然具有高灵敏度、多元素同时分析等特点,但受到高含量的Mo,Zr,Sn 的氧化物质谱干扰。尤其是在痕量Cd 的分析中,地壳中这些干扰元素丰度为Cd 的几百甚至几千倍,所以往往导致结果严重偏高(几倍甚至几十倍)。本方法采用了石墨炉原子吸收(GFAAS)悬浮进样法测定超痕量镉,其原理是将粉末样品以悬浮液形式引入石墨炉中,巧妙地利用石墨炉原子吸收线性升温的特点,使样品在石墨炉中在线消解并分离其中的干扰杂质,以实现超低含量的地质样品(灰岩和泥岩)中总Cd 的快速检测
方案详情

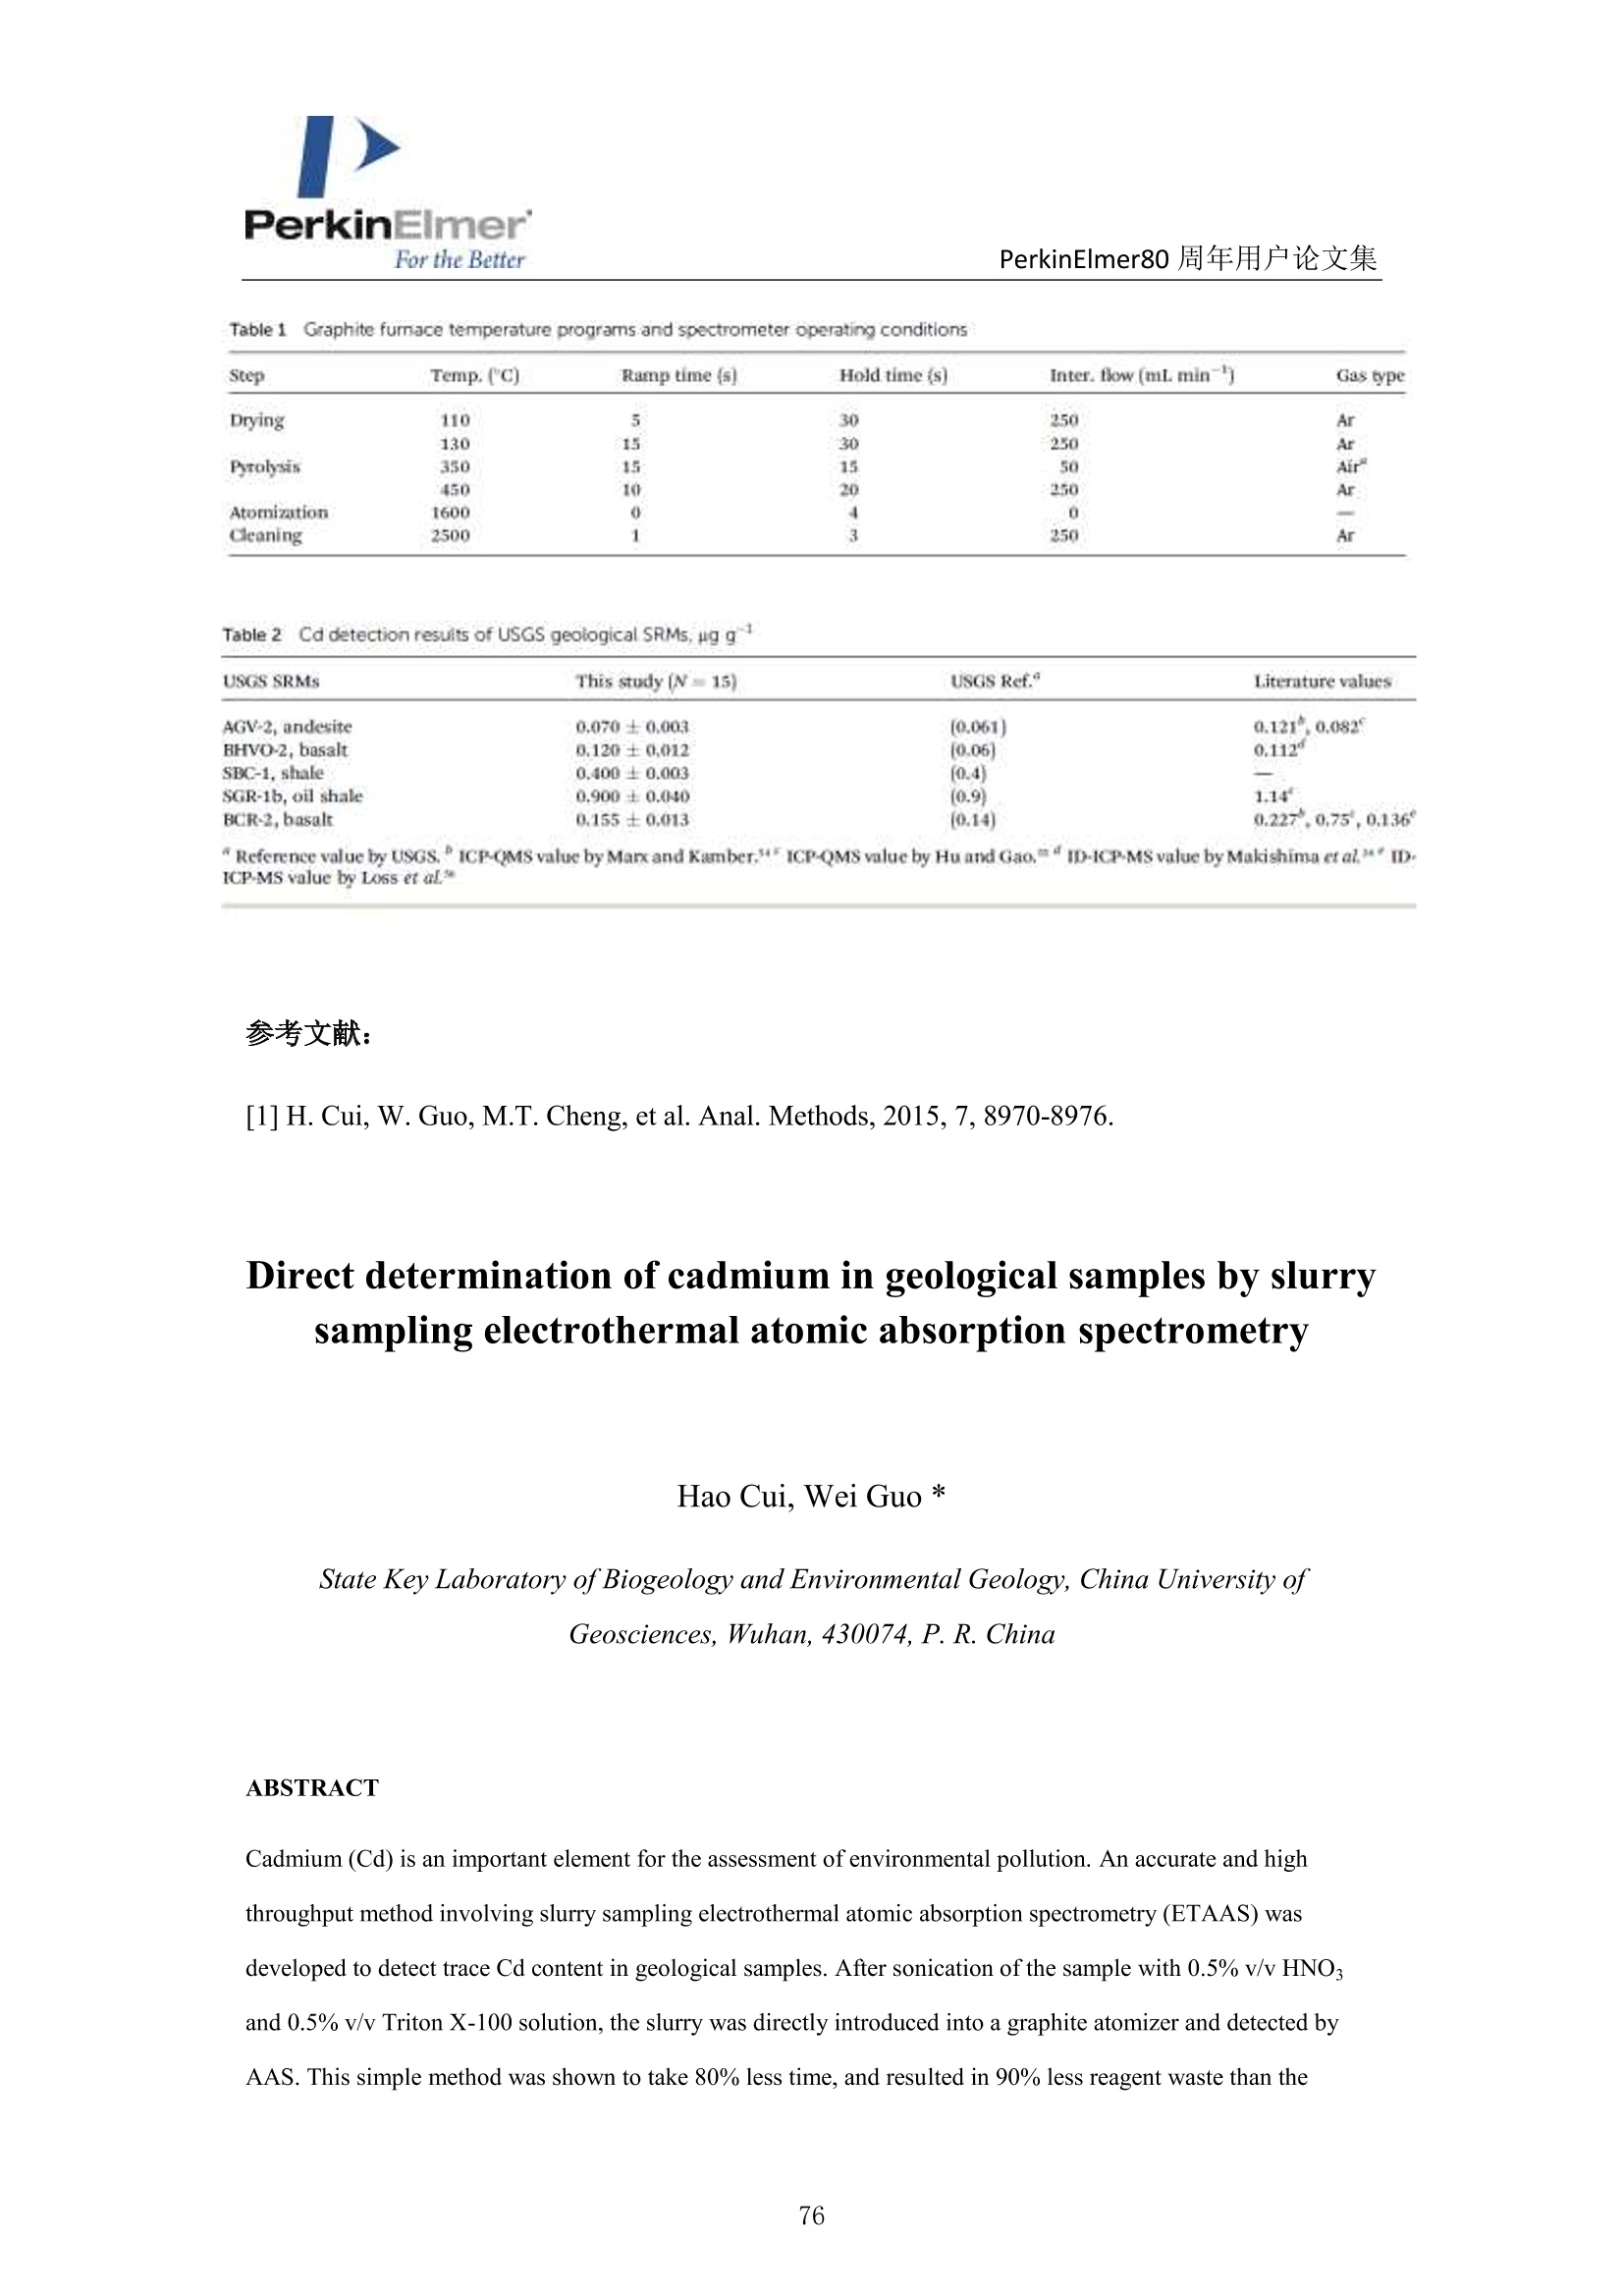
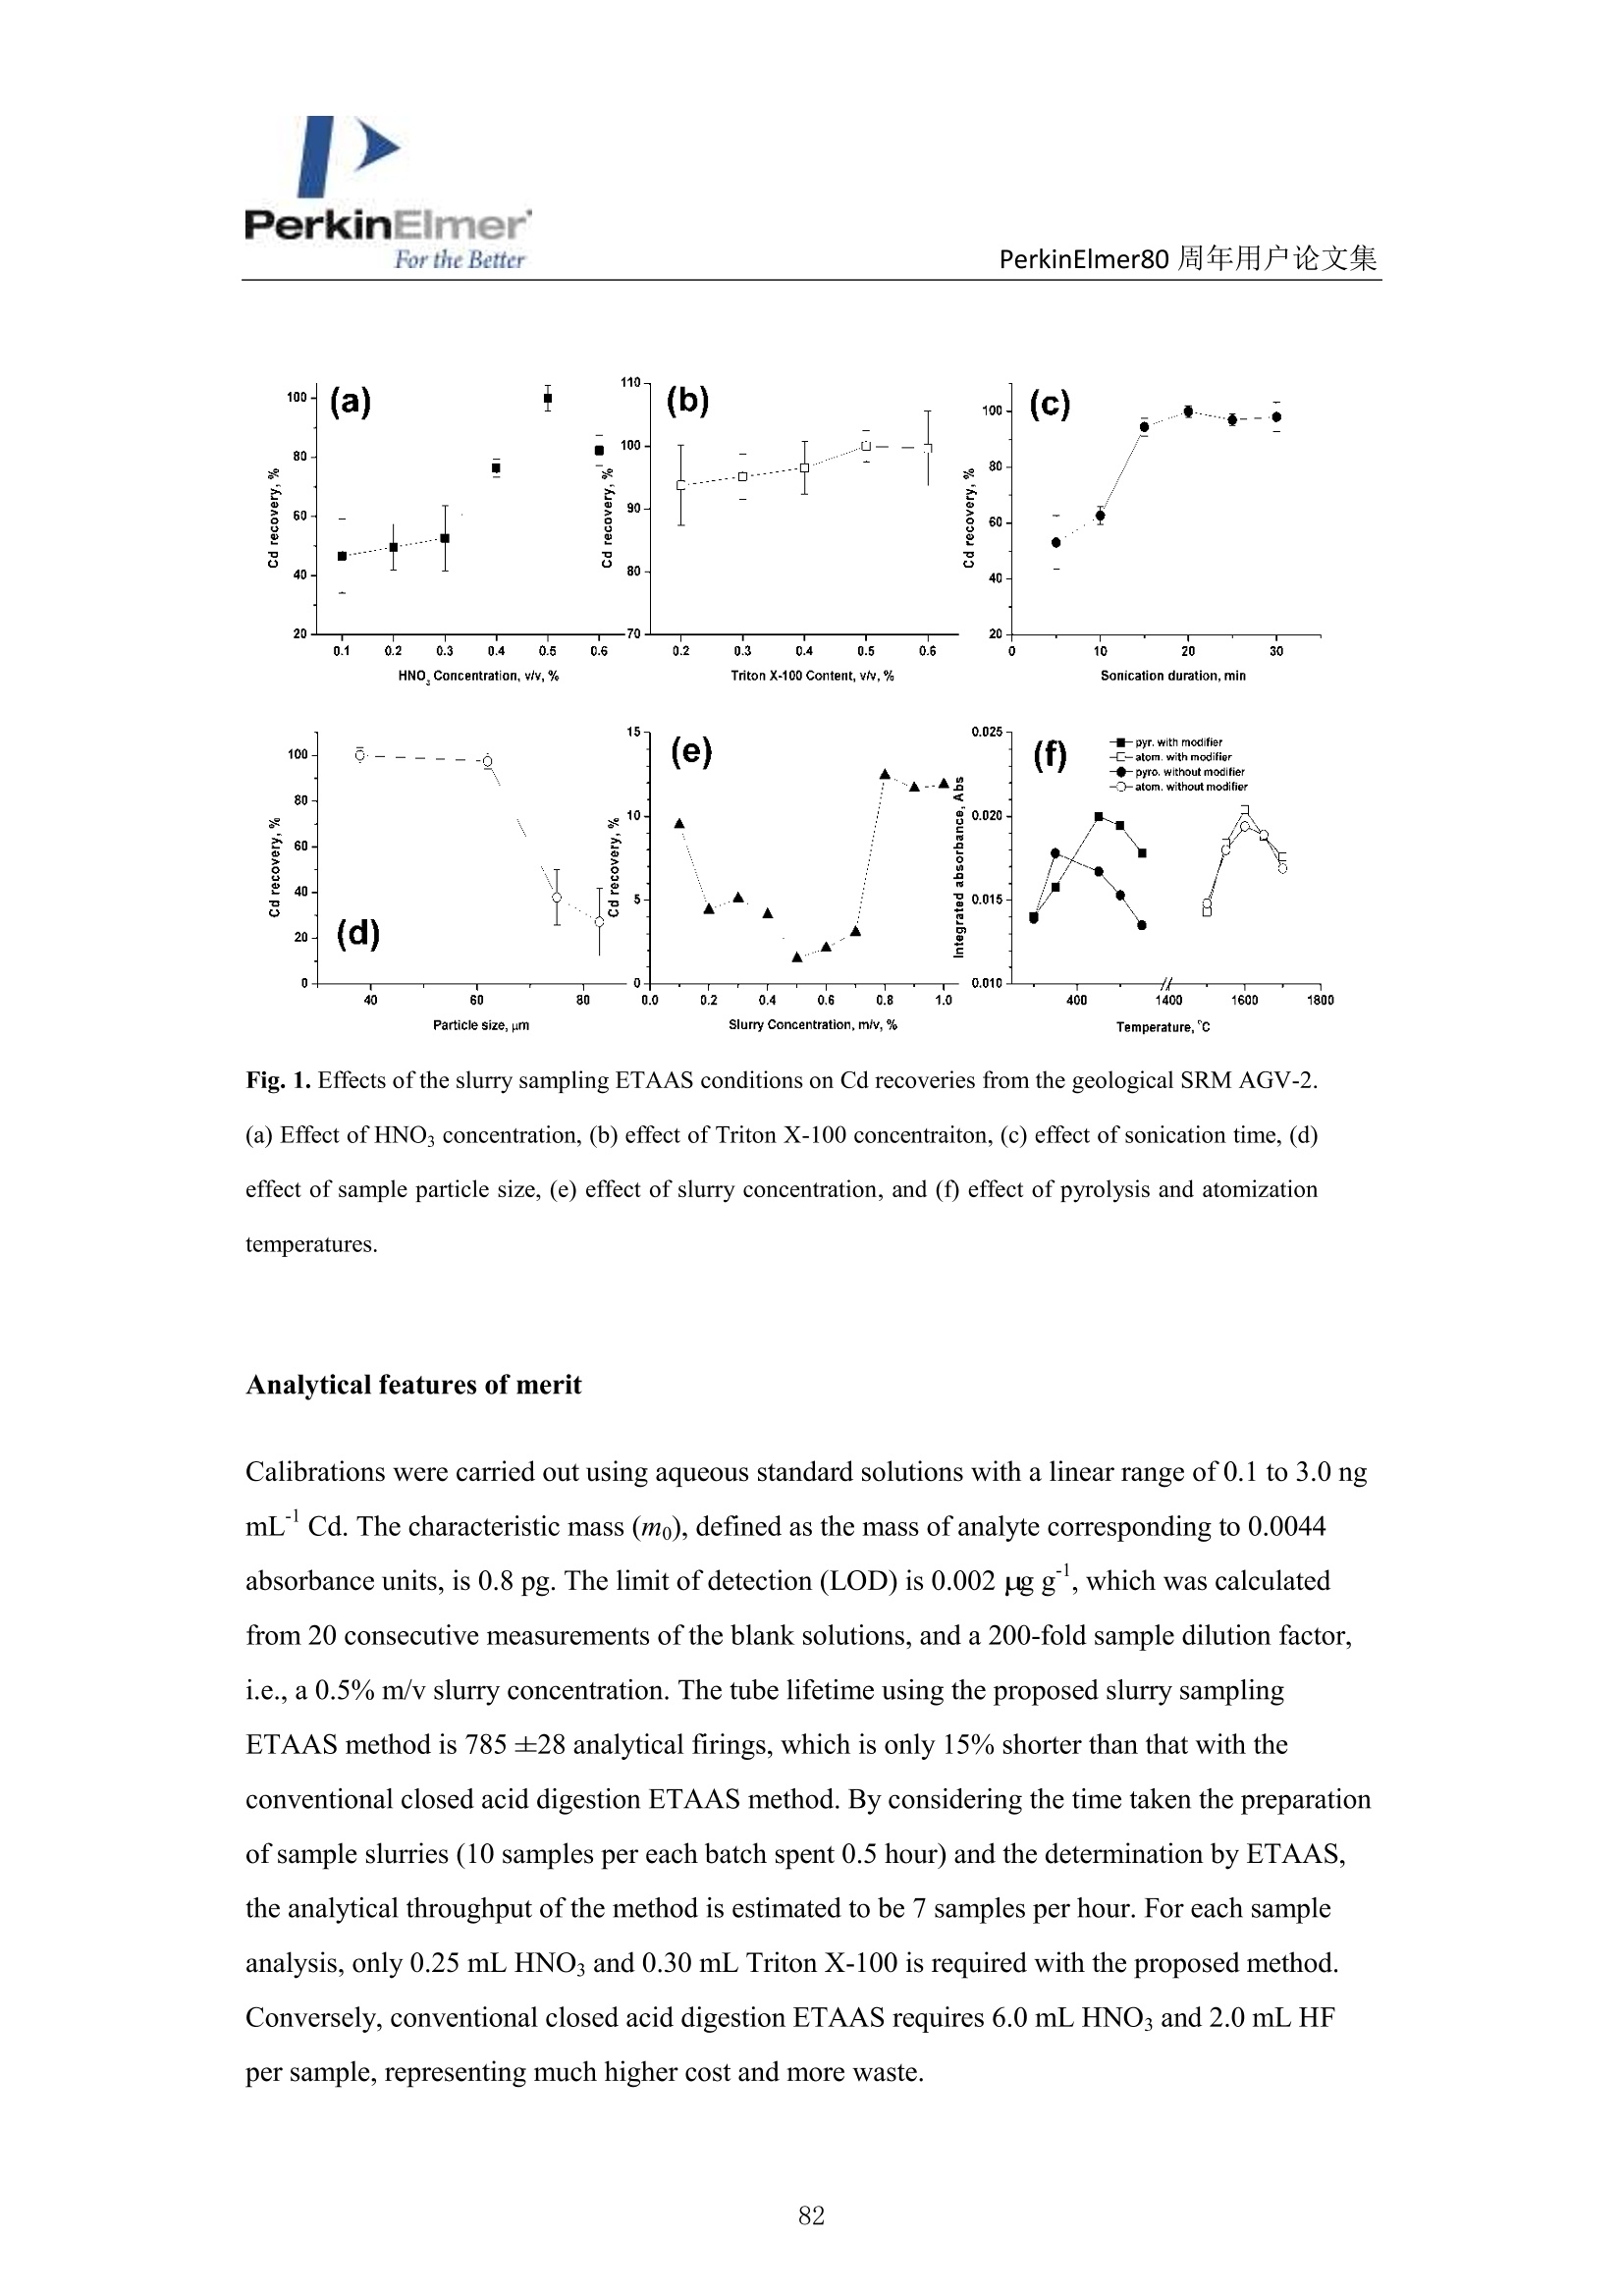
PerkinElmerFor the BetterPerkinElmer80 周年用户论文集 PerkinElmerFor the BetterPerkinElmer80 周年用户论文集 ET-AAS 直接分析地质样品中超痕量镉 崔浩,郭伟 中国地质大学(武汉)生物地质与环境地质国家重点实验室 中文摘要:地质样品中超痕量Cd的分析方法主要有:等离子体质谱法(ICP-MS)、石墨炉原子吸收法(GFAAS)。ICP-MS 虽然具有高灵敏度、多元素同时分析等特点,但受到高含量的Mo, Zr, Sn 的氧化物质谱干扰。尤其是在痕量 Cd的分析中,地壳中这些干扰元素丰度为 Cd 的几百甚至几千倍,所以往往导致结果严重偏高(几倍甚至几十倍)。本方法采用了石墨炉原子吸收(GFAAS)悬浮进样法测定超痕量镉,其原理是将粉末样品以悬浮液形式引入石墨炉中,巧妙地利用石墨炉原子吸收线性升温的特点,使样品在石墨炉中在线消解并分离其中的干扰杂质,以实现超低含量的地质样品(灰岩和泥岩)中总 Cd 的 快速检测[1]. 图1ET-AAS直接分析超痕量镉分析流程 实验步骤:聚0.100g到 0.250g地质样品到50ml离心管中,再加入50ml (0.5%v/vHNOs和0.6%v/vTritonX-100)在涡流震荡仪上混合均匀,再超声20min 转移到石墨炉原子吸收专用的聚乙烯小杯中,按照表1中石墨炉原子吸收的升温程序进行测定。5个国际标准物质测定结果与标准值一致(表2),表明该技术可用于地质样品中超痕量 Cd分析。 Table 1 Graphite fumace temperature programs and spectrometer operating conditions Step Temp.(C) Ramp time(s) Hold time (s] Inter. flow (mL min) Gas type Drying 110 5 30 250 Ar 130 15 30 250 Ar Pyrolysis 350 15 15 50 Air 450 I0 20 250 Ar Atornization 1600 0 4 0 ame Cleaning 2500 1 3 250 Ar Table 2 Cd detection resuits of USGS geological SRMs, ng g USGS SRMs This study (N=15) USGS Ref. Literaturevalues AGV-2, andesite 0.070±0.003 [0.061) 0.1210.082 BHVO-2, basalt 0.120±0.012 [0.05] 0.112 SDC-1,shale 0.400±0.003 [0.4) SGR-1b, oil shale 0.900±0.040 (0.9) 1.14 BCR-2,basalt 0.155±0.013 10.14] 0.227*.0.75,0.136° “Reference value by USGS. "ICP-QMS value by Marx and Kamber.ICP-QMS value by Hu and Gao,“ID-ICPMS value byMakishima et al.ID. ICP-MS value by Loss et al* ( 参考文献: ) [1] H. Cui, W. Guo, M.T. Cheng, et al. Anal. Methods, 2015, 7,8970-8976. Direct determination of cadmium in geological samples by slurrysampling electrothermal atomic absorption spectrometry Hao Cui, Wei Guo * State Key Laboratory of Biogeology and Environmental Geology, China University ofGeosciences, Wuhan, 430074, P. R. China ABSTRACT Cadmium (Cd) is an important element for the assessment of environmental pollution. An accurate and highthroughput method involving slurry sampling electrothermal atomic absorption spectrometry (ETAAS) wasdeveloped to detect trace Cd content in geological samples. After sonication of the sample with 0.5% v/v HNO3and 0.5% v/v Triton X-100 solution, the slurry was directly introduced into a graphite atomizer and detected byAAS. This simple method was shown to take 80% less time, and resulted in 90% less reagent waste than the conventional acid digestion method. Under optimized conditions (sample size ≤75um, sonication time: 20 min,pyrolysis temperature: 450℃, and atomization temperature: 1600 ℃), the characteristic mass and limit ofdetection for Cd were 0.8 pg and 0.002 gg, respectively. The proposed method was applied to the determinationof Cd in 86 soil, sediment, and rock standard reference materials (SRMs). The results for 78 of these materialswere in good agreement with the reference values. The Cd levels in five limestone SRMs (GUI-1, GUI-2, DIAN-1,DIAN-2, and DIAN-3) and one clay SRM (GBW03103) were reported for the first time. The proposed methodshows great potential for the direct determination of trace Cd in various geological samples. Introduction The assessment of cadmium (Cd) in the environment or geological is important in the study ofenvironmental pollution because of the toxic effect of Cd on human health and the fact that Cd-contaminated crops can grow from polluted soil. 1-3 The abundance of Cd in upper continentalcrust is only 0.09 ug g. Therefore, the concentration of Cd is at trace or ultra-trace levels innatural soils, sediments, and rocks (except for Cd mineral deposits). 4-6 Consequently, highlysensitive and high-throughput analytical methods are needed for Cd determination of solidenvironmental samples. In addition, accurate determination of Cd is imperative for Cd isotopicanalysis, which is vital for the study of cosmology, the tracing of anthropogenic sources,the studyof micronutrient cycling, and oceanography. Two main techniques have been proposed that can be used for the accurate determination oftrace Cd in soils, sediments, or rocks in typical geological laboratories. One method is inductivelycoupled plasma mass spectrometry (ICP-MS), which has high sensitivity, low detection limits, andis capable of simultaneous multi-element analysis. 8-19 However, isobaric and/or polyatomicinterferences derived from the presence of high concentrations of matrix elements are significantlimitations of this technology. 2All isotopes of Cd are subject to interferences from variousisobaric ions and/or oxide or hydroxide ions of Pd, Sn, In, Zr, Mo, Ru, Nb, and Y.2 Complicatedseparation procedures, such as chromatography, precipitation, extraction, and volatile speciesgeneration, are usually required to eliminate these interferences 22-25. Isotope dilution ICP-MS (IDICP-MS) 26,27 and dynamic reaction cell ICP-MS (DRC ICP-MS) 28,29 have been demonstrated asvalid methods to accurately detect trace Cd in environmental or geological samples. However, thehigh cost and complex operating procedures associated with these methods prevent their routineuse in a high-throughput geological laboratory. The other method is electrothermal atomic absorption spectrometry (ETAAS), which has emerged as a better technique than ICP-MS fortrace Cd determination as it is less subject to interference, more economical, relatively simple, andis capable of direct determination of Cd in complex matrices. 30-33 Sample preparation is the most time-consuming step for solid environmental sample analysis,and microwave-assisted or high-pressure closed acid digestion has been extensively employed forsample dissolution which avoids analyte losses and contamination.34The main drawbacks are thehigh cost of vessels and ovens, the risk of explosions, low sample throughput, and the long timerequired for the cooling step. 3 Direct solid sampling ETAAS (DSS-ETAAS) may be used tosimplify sample preparation procedures, and to avoid sample contamination. 36-41 However, theDSS-ETAAS method was not widely accepted until recently, owing to the difficulty in handlingand introducing small sample masses, the high imprecision of the results due to the heterogeneityof some natural samples, the difficulty in calibration due to the requirement of solid standards withsimilar matrix composition and structure, the limited linear working range of AAS, and thedifficulty in diluting solid samples.35 Another attractive alternative is the use of slurry sampleintroduction in ETAAS, which combines the advantages of liquid and solid sampling and avoidsmany problems associated with direct solid sampling. Here, simple aqueous standards are usedinstead of solid-sample matrix calibration, the sample concentration can easily be changed bydilution, it can avoid weighted errors and inhomogeneity problems are eliminated, and the analyteconcentration falls within the linear range. Furthermore, slurry can be directly sampled using theconventional autosampler used in ETAAS, avoiding the need for specialized expensive equipmentsuch as a microbalance and solid sampling accessories. 42,43 Slurry sampling ETAAS techniqueshave been proposed for trace Cd determination in various biological and food materials, such asplant, honey, wheat, and rice. 32, 33,44,45 However, limited literature is available regarding Cddetermination in environmental soil or sediment samples. 46,47 Most literature relates to aciddigestion procedures but not direct slurry sampling. Therefore, to investigate whether the slurrysampling method is effective for non-soft matrices, such as soil, sediment, and rock, it is necessaryto carefully optimize various operating conditions and comprehensively evaluate the accuracy andprecision of this method for Cd determination. The aim of this work was to develop an easy, accurate, reliable, green, and routine methodfor determination of trace Cd in solid geological samples using slurry sampling ETAAS. Theoptimization of the technique and its analytical performance, as well as its application to the determination of trace Cd in 86 soil, sediment, and rock standard reference materials (SRMs) arediscussed in detail. Experimental Instrumentation All measurements were performed with a PinAAcleM 900T atomic absorption spectrometer(PerkinElmer, Inc., Shelton, USA), which was equipped with a longitudinal AC Zeemanbackground correction system, a transversely heated graphite atomizer (THGA), PerkinElmer Cdelectrodeless discharge lamps (EDL), and an AS 900 autosampler. A TubeViewTM color furnacecamera was used to monitor the process of slurry sampling in the graphite tube (Table 1). Table 1 Graphite furnace temperature programs and spectrometer operating conditions Step Temp. (℃) Ramp. time Hold time Inter. flow (mL Gas type (s) (s) min) Drying 110 5 30 250 Ar 130 15 30 250 Ar Pyrolysis 350 15 15 50 Air 450 10 20 250 Ar Atomization 1600 0 4 0 / Cleaning 2500 1 3 250 Ar Wavelengh/nm: 228.8 Measurement mode: Peak area ( Air gas come from the air compressor. ) De-ionized water used for the preparation of all blank, standard, and sample solutions wasobtained from a water purification system (Merck Millipore, Fontenay-sous-Bois, France). The Cdstandard solution (1000 ug L) was purchased from the National Center for Analysis and Testingof Steel Materials, China. Nitric acid (65-70%, w/w, 99.999%) and Triton X-100(>99%) werepurchased from Alfa Aesar Ltd. (Tianjin, China). Eighty-six geological SRMs were used toevaluate the accuracy of the proposed method, which covers 26 soil SRMs, 25 sediment SRMs,and 35 rock SRMs. Five of these SRMs were purchased from the United States Geological Survey(USGS) and the remainder from the Institute of Geophysical and Geochemical Exploration ofChina (IGGE). Slurry sampling procedures Slurries were prepared by weighing 0.1000 to 0.3500 g of the sample in a 50 mL conicalpolypropylene tube and diluting to 50 mL with 0.5% v/v HNO3 containing 0.6% v/v Triton X-100After homogenizing in an ultrasonic bath (Branson,USA) for 20 min, the uniform slurries weretransferred into acid-cleaned propylene autosampler cups. Then, 20 uL of slurry was taken up anddelivered to the graphite tube for ETAAS analysis. For comparison, a conventional digestion method employing closed acid digestion with a mixtureof HF+ HNO3 was also used48-50 Results and discussion Optimization of slurry sampling ETAAS conditions To obtain accurate results with the slurry sampling ETAAS techniques, the slurry samplingprocedures and graphite furnace heating parameters were optimized in detail. AGV-2, which is anandesite SRM provided by USGS with a certified Cd content of 0.069 g g, was used to optimizeall of the parameters. As shown in Fig. 1a, the recovery of Cd from the AGV-2 with HNO3 wasinvestigated by varying the HNO3 concentrations from 0.1% and 0.6%(v/v),while otherparameters, such as particle size (62 um), sonication duration (20 min), Triton X-100concentration (0.5% v/v), and slurry concentration (0.5%m/v), pyrolysis temperature (450℃),and atomization temperature (1600℃), were kept constant. As is evident from the figure, the bestrecovery of Cd is obtained when 0.5% v/v HNO is used. Sonication and the addition of the stabilizing medium Triton X-100 were used to improvethe homogeneity of the sample slurries, and similar optimization procedures as for HNOsconcentration were performed for Triton X-100 concentration and sonication time, as shown inFig. 1b and Fig. 1c. Under the optimized Triton X-100 concentration (0.5% v/v) and sonicationtime (20 min), sample particles formed homogenous and stable slurries. It is important to optimize particle size in order to attain quantitative recoveries with the heatextraction procedure. Different particle sizes ranges of a soil sample with a Cd content of 0.230±0.012 ug g (determined by the closed acid digestion ETAAS method) were studied. Particlesizes of 83 um, 75 um, 62 um, and 38 um were investigated, as shown in Fig.1d, and quantitativerecoveries were attained for particles both 38 um(97%) and 62 um (98%) in size. 10 min ofsample grinding in a ball mill is required to obtain a particle size of 38 um. However, only 4 minis required to obtain a particle size of 62 um. Therefore, 62 um particle sizes (240 mesh) wasemployed for the rest of this work. The concentration of slurry suspensions is an important factor, which can affect themeasurement precision. Here, a number of suspensions with different percentages of SRM AGV-2were prepared, and the precision (RSD, %) of the integrated absorbance results was explored. Fig.1e shows the relationship between precision and slurry concentration in the range 0.1- 1.0%(m/v). The optimum concentration ranges from 0.2% to 0.7% (m/v). Although quantitativerecovery in the slurry sampling procedure is achieved for sample concentrations outside this range(>0.7% m/v or <0.2%), a high level of error (RSD > 9.5%) is observed. As it is a volatile element, Cd is lost from the graphite atomizer at temperatures higher than300 ℃ in the absence of a chemical modifier. 51,52 To increase the thermal stability of Cd andallow higher pyrolysis temperatures for the removal of higher levels of concomitants,Pd(NO3)2solution was assayed as a chemical modifier. The effect of the pyrolysis and atomizationtemperature on the integrated absorbance were studied in experiments on the AGV-2 SRM slurrywith or without a Pd(NO3)2 chemical modifier. As shown in Fig. 1f, the addition of 5 pL 0.05%m/v Pd(NO3)2 modifier allowed the optimum pyrolysis temperature to increase from 350℃(without modifier) to 450 ℃. The optimum atomization temperature was found to be 1600 C (Fig.1f), which is similar to that ofwithout a modifier. In addition to the graphite furnace temperatureprograms described in Table 1, a pre-pyrolysis step (350℃) using air was added to avoid carbonresidues on the platform of the graphite tube. Fig. 1. Effects of the slurry sampling ETAAS conditions on Cd recoveries from the geological SRM AGV-2.(a) Effect of HNOs concentration, (b) effect of Triton X-100 concentraiton, (c) effect of sonication time, (d)effect of sample particle size, (e) effect of slurry concentration, and (f) effect of pyrolysis and atomizationtemperatures. Analytical features of merit Calibrations were carried out using aqueous standard solutions with a linear range of 0.1 to 3.0 ngmLCd. The characteristic mass (mo), defined as the mass of analyte corresponding to 0.0044absorbance units, is 0.8 pg. The limit of detection (LOD) is 0.002 ugg, which was calculatedfrom 20 consecutive measurements of the blank solutions, and a 200-fold sample dilution factor,i.e., a 0.5% m/v slurry concentration. The tube lifetime using the proposed slurry samplingETAAS method is 785 ±28 analytical firings, which is only 15% shorter than that with theconventional closed acid digestion ETAAS method. By considering the time taken the preparationof sample slurries (10 samples per each batch spent 0.5 hour) and the determination by ETAAS,the analytical throughput of the method is estimated to be 7 samples per hour. For each sampleanalysis, only 0.25 mL HNOs and 0.30 mL Triton X-100 is required with the proposed method.Conversely, conventional closed acid digestion ETAAS requires 6.0 mL HNO3 and 2.0 mL HFper sample, representing much higher cost and more waste. Geological sample analysis Five USGS SRMs were assessed using the proposed method (Table2). For comparison, the USGScertified Cd values and those reported elsewhere in the literature are also listed in Table 2. Cdcontents determined for SRMs AGV-2, SBC-1, SGR-1b, and BCR-2 are in agreement with theUSGS reference values. The reference value of BHVO-2 (USGS) is 0.06 ugg, which is lowerthan our reported value of 0.116±0.011 ug g.However, our result is consistent with the valueobtained by isotope dilution ICP-MS (0.112 ug g ), 26 which is regarded as the most reliablemethod for Cd detection. To further confirm that our reported values are reasonable, ten separatealiquots of BHVO-2 were analyzed over a period of three months, and consistent results (0.093-0.123 ug g) were obtained (Fig.a). The Cd content of BCR-2 obtained by ICP-MS (0.227 ugg,5 and 0.75 ug g ,55 etc.) is significantly higher than the USGS reference value (0.14 ugg) andthe values obtained by ID-ICP-MS (0.136 ug g1 56), and our proposed ETAAS method (0.142+0.008 ugg). The large errors obtained using the ICP-MS method could be attributed to thepresence of large amounts of Zr (Zr/Cd>1880) and Mo (Mo/Cd>2510) in BCR-2. Similarresults were observed for AGV-2 and SGR-1b, which further confirms that our slurry samplingETAAS method is more reliable than ICP-MS. The method we report herein was also used to determine Cd levels in 81 Chinese geologicalSRMs, comprising 25 soil, 26 sediment, and 30 rocks. The obtained values and their certifiedvalues compared in Fig. 3, except for those of one clay (GBW03103), and one ultra-basic rock(GBW07101), and five limestone (GUI-1, GUI-2, DIAN-1, DIAN-2, and DIAN-3) samples,which have no available certified or literature values. As shown in Fig. 3, the Cd levels of 74 ofthe geological SRMs are in good agreement with the certified values or reference values. Asshown in Table 3, the Cd content found for the ultra-basic rock GBW07101 is 0.044±0.002 ug g, which is nearly twice its reference value 0.024 ug g. This SRM was analyzed ten times over athree-month period, and the results ranged from 0.043 to 0.047 ug g (Fig.2b). The proposedmethod was also used to analyze one clay SRM GBW03103, and five limestone SRMs (GUI-1,GUI-2, DIAN-1,DIAN-2, and DIAN-3),which have no reported Cd value available (Table 3).Our recommended values are 0.108±0.009ugg(GBW03103), 0.056±0.005 ugg(GUI-1),0.176±0.012 ugg(GUI-2), 0.134±0.009ugg(DIAN-1), 0.335±0.005 ugg(DIAN-2), and0.244±0.004 ugg(DIAN-3), respectively. The results of repeated analysis over a period ofthree months are very stable (Fig. 4), which further confirms that our reported values are reasonable. In addition, these values are in good agreement with the conventional closed aciddigestion ETAAS method (Table 3). Fig. 2. Results of repeated analyses of (a) a basalt SRM BHVO-2, and (b) an ultra-basic rock SRM GBW07101. The average values of Cd in BHVO-2 and GBW07101 are 0.116±0.011 ugg and 0.044±0.002 ugg, respectively. Ten separate aliquots ofthe samples were analyzed during a period of three months. Reference values by IGGE, ug g Fig. 3. Obtained Cd values for 74 Chinese geological SRMs by slurry samplingETAAS vs. their reference values. Fig. 4. The stability of Cd values obtained by our method in six geological SRMs: (a) clay SRM GBW03103, (b) limestone SRM GUI-1, (c) limestone SRM GUI-2, (d) limestone SRM DIAN-1, (e) limestoneSRM DIAN-2, and (f) limestone SRM DIAN-1. Ten separate aliquots of the samples were analyzed during aperiod of three months. Table 2 Cd detected results ofUSGS geological SRMs, ugg USGS SRMs This study (N=15) USGSRef. Literature values AGV-2, andesite 0.070±0.003 (0.061) 0.121,0.082, BHVO-2. basalt 0.120±0.012 (0.06) 0.112 SBC-1, shale 0.400±0.003 (0.4) SGR-1b, oil shale 0.900±0.040 (0.9) 1.14 BCR-2, basalt 0.155±0.013 (0.14) 0.227,0.75°,0.136° ( "Reference value by USGS ) “ID-ICP-MS value by Makishim et al. °ID-ICP-MS value by Loss et al. Table 3 Updated Cd values for seven SRMs determined by this method, ugg Geological SRMs This work (N=10) Reference Closed acid digestion values ETAAS method (N=3) GBW07101, Ultrabasic rock 0.044±0.004 (0.024) 0.048±0.012 GBW03103, Clay 0.108±0.009 /b 0.108±0.029 GUI-1, Limestone 0.056±0.005 /b 0.060±0.012 GUI-1, Limestone 0.176±0.012 b 0.185±0.015 DIAN-1, Limestone 0.134±0.009 /b 0.142±0.022 DIAN-2, Limestone 0.335±0.005 b 0.342±0.025 DIAN-3, Limestone 0.244±0.004 b 0.238±0.018 "Reference value by the Institute of Geophysical and Geochemical Exploration of China No reference or reported value Conclusion A method using slurry sampling ETAAS to accurately determine trace Cd in various soils,sediments, and rocks was developed and validated. In our method, sample digestion is not needed;thus, the problems related to conventional acid digestion, such as the use ofconcentrated acids,time consumption, the risk of contamination, and possible analyte loss are avoided. Using of theproposed method, Cd levels were determined for 78 international geological SRMs,and the resultswere found to be in good agreement with their certified or literature values of the samples. The Cdlevels in five limestone SRMs (GUI-1,GUI-2, DIAN-1, DIAN-2, and DIAN-3) and one clay SRM(GBW03103) were reported for the first time in the literature, and the values for one ultra-basicrock SRM (GBW07101) and one basalt SRM (BHVO-2) were updated. In conclusion, our methodhas great potential for the direct determination of trace levels of Cd in various solid geologicalsamples. Acknowledgement This work was supported by the National Nature Science Foundation of China (No.21175120andid21207120))aandd ttlhe National Key Scientific Instrument and EquipmentDevelopment Projects of China (No. 2011YQ06010008), and the Fundamental Research Fundsfor the Central Universities, China University of Geosciences (Wuhan) (No. CUGL140411). References ( 1. X. F . Mao, J. X. Liu, Y. T. Huang, L . Feng, L. H . Zhang, X. Y. Tang, J. Zhou, Y. Z . Q ian and M. Wang, Journal ofagricultural and food chemistry, 2013,61, 84 8-853. ) ( 2. K.Ono, Journal ofhazardous materials,2013,262,741-747. ) ( 3. S. Enamorado, J. M . Abril, A. Delgado, J. L. Ma s , O. Polvillo and J. M. Qu i ntero, Journal of hazardous materials, 2014, 266,122-131. 4. R. J. Bian, S. Joseph, L. Q. Cui, G . X. Pan, L . Q. L i , X. Y . L i u, A . Zhang, H. Rutlidge, S. W. Wong, C.Chia, C. Marjo, B. Gong, P. Munroe and S . D o nne, Journal ofhazardous materials, 2014, 272, 121 - 128. ) ( 5. E. G alunin, J . Ferreti, I . Z apelini, I . Vieira, C. R . T . Tarley, T. Abrao an d M. J . Sant o s, Jour n al of hazardous materials,2014,265,280-287. ) ( 6. D. W . Xue, H. Jiang, X . X . Deng, X. Q. Zhang, H. Wang, X. B. Xu, J. Hu , D. L. Zeng, L. B. Guo and Q. Qian, Journal ofhazardous materials,2014,280,269-278. ) ( 7. A. D. S chmitt, S. J. G . Galer and W. Abouchami, E a rth Planet Sc Lett, 2009,277,262-272. ) ( 8. R. F. Wei, Q. J. Guo, H. J. Wen, J.X. Yang,M . Peters, C . W. Zhu, J. Ma, G. X. Zhu, H. Z. Zhang, L. Y.Tian,C. Y. Wang and Y. X. Wan, Analytical Methods, 2015, 7, 24 7 9-2487. ) 9. Z. H. Wang, Q. Z. Xu, S. Y. Li, L. Y. Luan, J. Li, S. X. Zhang and H. H. Dong, Analytical Methods,2015, 7,1140-1146. 10. J.Sun, Z. G. Yang, H. W. Lee and L. Wang, Analytical Methods,2015,7,2653-2658. 11. Y.X. Liu, T. Zhou, J. Y. Wang, Y. L. Wang,D. Zhao and Q.Zhang, Analytical Methods, 2015, 7,1872-1877. 12. D. P. Bishop, D. J. Hare, A. de Grazia, F. Fryer and P. A. Doble, Analytical Methods, 2015,7,5012-5018. 13. A. Philippe, M. Gangloff,D. Rakcheev and G. E. Schaumann, Analytical Methods, 2014,6,8722-8728. 14. P. Li, X. Q. Zhang, Y. J. Chen, H. Z. Lian and X. Hu, Analytical Methods, 2014, 6, 4205-4211. 15. C. Han,J.N. Sun, H. Y. Cheng, J. H. Liu and Z. G. Xu, Analytical Methods, 2014, 6,5369-5375. 16. S. Z. Chen, X. L. Guo, Y. Zhang and D. B. Lu, Analytical Methods,2014,6,3668-3673. 17. M.Balski, H. Kipphardt, A. Berger, S. Meyer and U. Panne, Analytical Methods, 2014,6,77-85. 18. Z. Bao, H. L. Yuan, R. Wen and K. Y. Chen, Analytical Methods,2015,7,5034-5040. 19. N. I. Rousis, L. N. Pasias and N. S. Thomaidis, Analytical Methods, 2014, 6,5899-5908. 20. W. Guo, S. H. Hu, J. A. Zhao, S. S. Jin, W. J. Liu and H. F. Zhang, Microchemical Journal, 2011, 97,154-159. 21. T. W. May and R. H. Wiedmeyer, Atomic Spectroscopy,1998,19,150-155. 22. T. C. Duan, X. J. Song, P. R. Guo, H. F. Li, L. H. Pan, H. T. Chen and J. W. Xu, Journal Of AnalyticalAtomic Spectrometry, 2007, 22,403-406. 23. X. Y. Jia, Y. Han, X. L. Liu, T. C. Duan and H. T. Chen, Microchim Acta,2010,171, 49-56. 24. P. H. Liao, S. J. Jiang and A. C. Sahayam, Journal Of Analytical Atomic Spectrometry, 2012,27, 1518-1524. 25. W. N. Chen, S. J. Jiang, Y. L. Chen and A. C. Sahayam, Analytica chimica acta, 2015, 860, 8-14. 26. A. Makishima, H. Kitagawa and E. Nakamura, Geostand Geoanal Res, 2011, 35,57-67. 27. R.Q. Thompson and S. J. Christopher, Analytical Methods, 2013,5,1346-1351. ( 28. W. G uo, S. H. Hu, Y. F. Xiao, H. F. Zhang and X. J. Xi e , Chemosphere , 2010,81,1 46 3-1468. ) ( 29. J . M. Jarrett, G . Xiao,K. L. Caldwell, D. Henahan, G. Shakirova a n d R. L . J o nes, Journal Of Analytical Atomic Spectrometry,2008,23,962-967. ) ( 30. Naeemullah, T . G. Kazi, H . I . A fridi, F. Shah, S. S. Arain , A. H. Panhwar,S. A . A rain and M . B . Arain, Analytical Methods, 2014,6, 6909-6915. ) ( 31. S. M ohajer, M . Chamsaz and M. H. Entezari, Analytical Methods,2014, 6,9490-9496. ) ( 32. R. F . de Oliveira, C. C. W indmoller, W . B. Ne t o, C. C. de Sou z a, M. A . Beinner and J. B. B . da S ilva, Analytical Methods,2013,5,5746-5752. ) 33. I. C. F. Damin, A. V. Zmozinski, A. R. Borges, M. G. R. Vale and M. M. da Silva, Analytical Methods,2011,3,1379-1385. ( 34. Y. Z. Yi, S. J. Jiang and A. C. Sahayam,Journal Of Analytical Atomic Spectrometry, 2012,27,426-431. ) 35. J. Sardans, F. Montes and J. Penuelas, Spectrochim Acta B,2010,65,97-112. 36. P. Torok and M. Zemberyova, Spectrochim Acta B,2011,66,93-97. ( 37. A. d e Jesus, A. V. Zmozinski, I. C. F . D amin, M . M. Silva and M. G. R. Vale, Spe c trochim Acta B, 20 1 2, 71-72,86-91. ) 38. P.Torok and M. Zemberyova, Food chemistry, 2012,132,554-560. ( 39. A. V . Z mozinski, L . D . P a ssos, I . C . F . D amin, M . A. B. E. Sa n to, M. G. R. V al e and M. M . S i lva,Analytical Methods,2013,5,6416-6424. ) ( 40. A. V. Zmozinski, T. Pretto, A. R. Borges and M . G. R. Vale, Analytical Methods, 2015,7,37 3 5-3741. ) 41. M. Resano, A. C. Lapena and M. A. Belarra, Analytical Methods,2013,5,1130-1139. 42. M. C. Santos,J. A. Nobrega,N. Baccan and S. Cadore, Talanta, 2010,81,1781-1787. 43. A. R. Borges, E. M. Becker, C. Lequeux, M. G. R. Vale, S. L. C. Ferreira and B. Welz, Spectrochim ActaB,2011,66,529-535. 44. R. A. Sanchez-Moreno, M.J. Gismera, M. T. Sevilla and J. R. Procopio, Phytochem Analysis, 2010, 21,340-347. 45. C. K. de Andrade, V. E. dos Anjos, M. L. Felsner, Y. R. Torres and S. P. Quinaia, Food chemistry, 2014,146,166-173. 46. D. Baralkiewicz and H. Gramowska, Analytica chimica acta,2004,510,249-256. 47. A. L. Souza, F. F. da Silva, G. A. R. Kelmer and P. V. Oliveira, Analytical Methods, 2013,5,2059-2063. 48. W. Guo, S. H. Hu, X. J. Wang, J. Y. Zhang, L. L. Jin, Z. L. Zhu and H. F. Zhang, Journal Of AnalyticalAtomic Spectrometry,2011,26,1198-1203. ( 49. W. Guo, S. H. H u , J. Y. Z hangL. L. Jin, X. J. W a ng, Z. L. Zhu and H. F. Zhang, Jou r nal Of AnalyticalAtomic Spectrometry,2011,26,2076-2080. ) ( 50. W. G uo, S. H. Hu, J. Y. Zhang and H. F. Zhang, Sc i Total Environ, 2011,409,2981-2986. ) 51. E. C. Lima, F. Barbosa and F. J. Krug, Fresen J Anal Chem, 2001,369,496-501. ( 52. P. W u, C. H. Li, J. B. Chen, C. B. Zheng and X. D. Hou, Appl Spectrosc Rev,2012,47,327-370. ) ( 53. W. G uo, P. Zhang, L . L . Jin and S. H. Hu, Journal Of Analytical Atomic Spectrometry, 2014, 29, 1949- 1954. ) ( 54. S. K. Marx a nd B . S. Kamber, Applied G eochemistry, 2010,25,12 2 1-1237. ) 55. Z.C. Hu and S. Gao, Chem Geol,2008,253,205-221. ( 56. R. D . L oss, K . J . R. Rosman a n d J. R . D e laeter, G eochimica Et Cosmochimica Acta, 1984 , 48, 1677 - 1681. ) 实验步骤:取0.100g 到0.250g 地质样品到50ml 离心管中,再加入50ml(0.5%v/vHNO3 和0.6%v/vTritonX-100)在涡流震荡仪上混合均匀,再超声20min 转移到石墨炉原子吸收专用的聚乙烯小杯中,按照表1 中石墨炉原子吸收的升温程序进行测定。5 个国际标准物质测定结果与标准值一致(表2),表明该技术可用于地质样品中超痕量Cd 分析。
确定


还剩13页未读,是否继续阅读?

产品配置单
珀金埃尔默企业管理(上海)有限公司为您提供《灰岩样品中超痕量镉检测方案(原子吸收光谱)》,该方案主要用于非金属矿产中超痕量镉检测,参考标准--,《灰岩样品中超痕量镉检测方案(原子吸收光谱)》用到的仪器有原子吸收光谱仪PerkinElmer PinAAcle 900
推荐专场
相关方案
更多
该厂商其他方案
更多