


方案详情
文
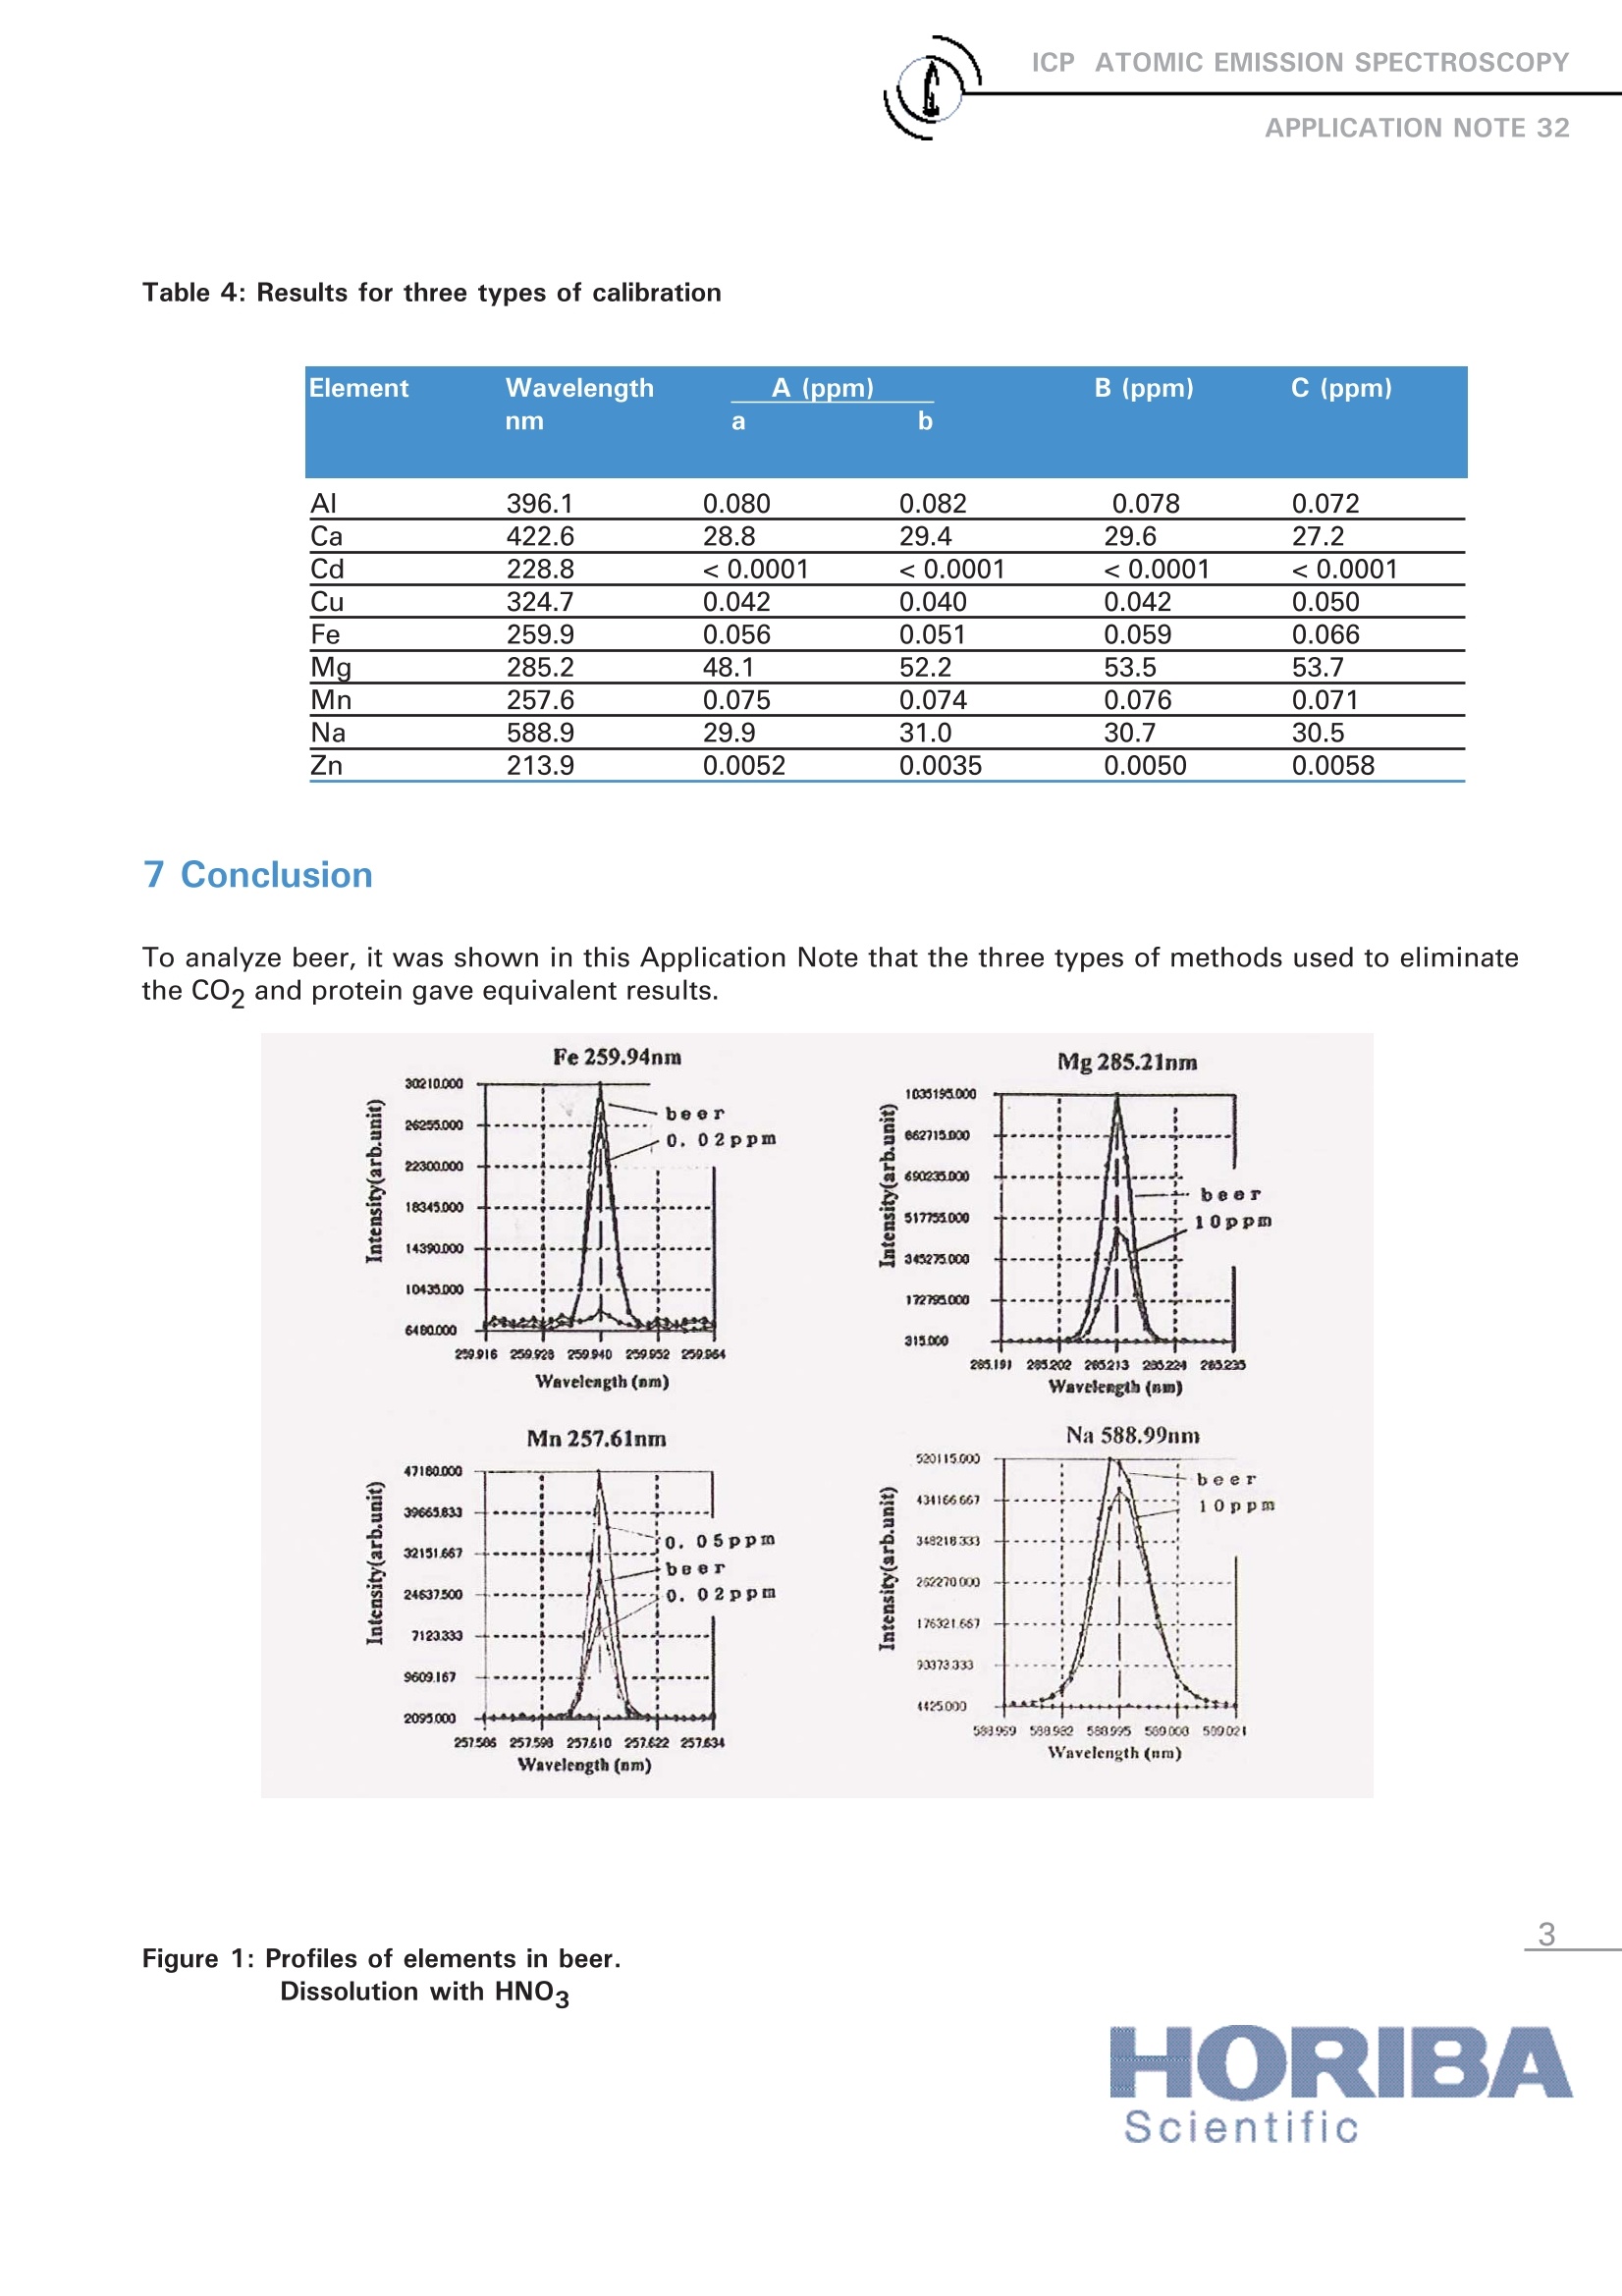
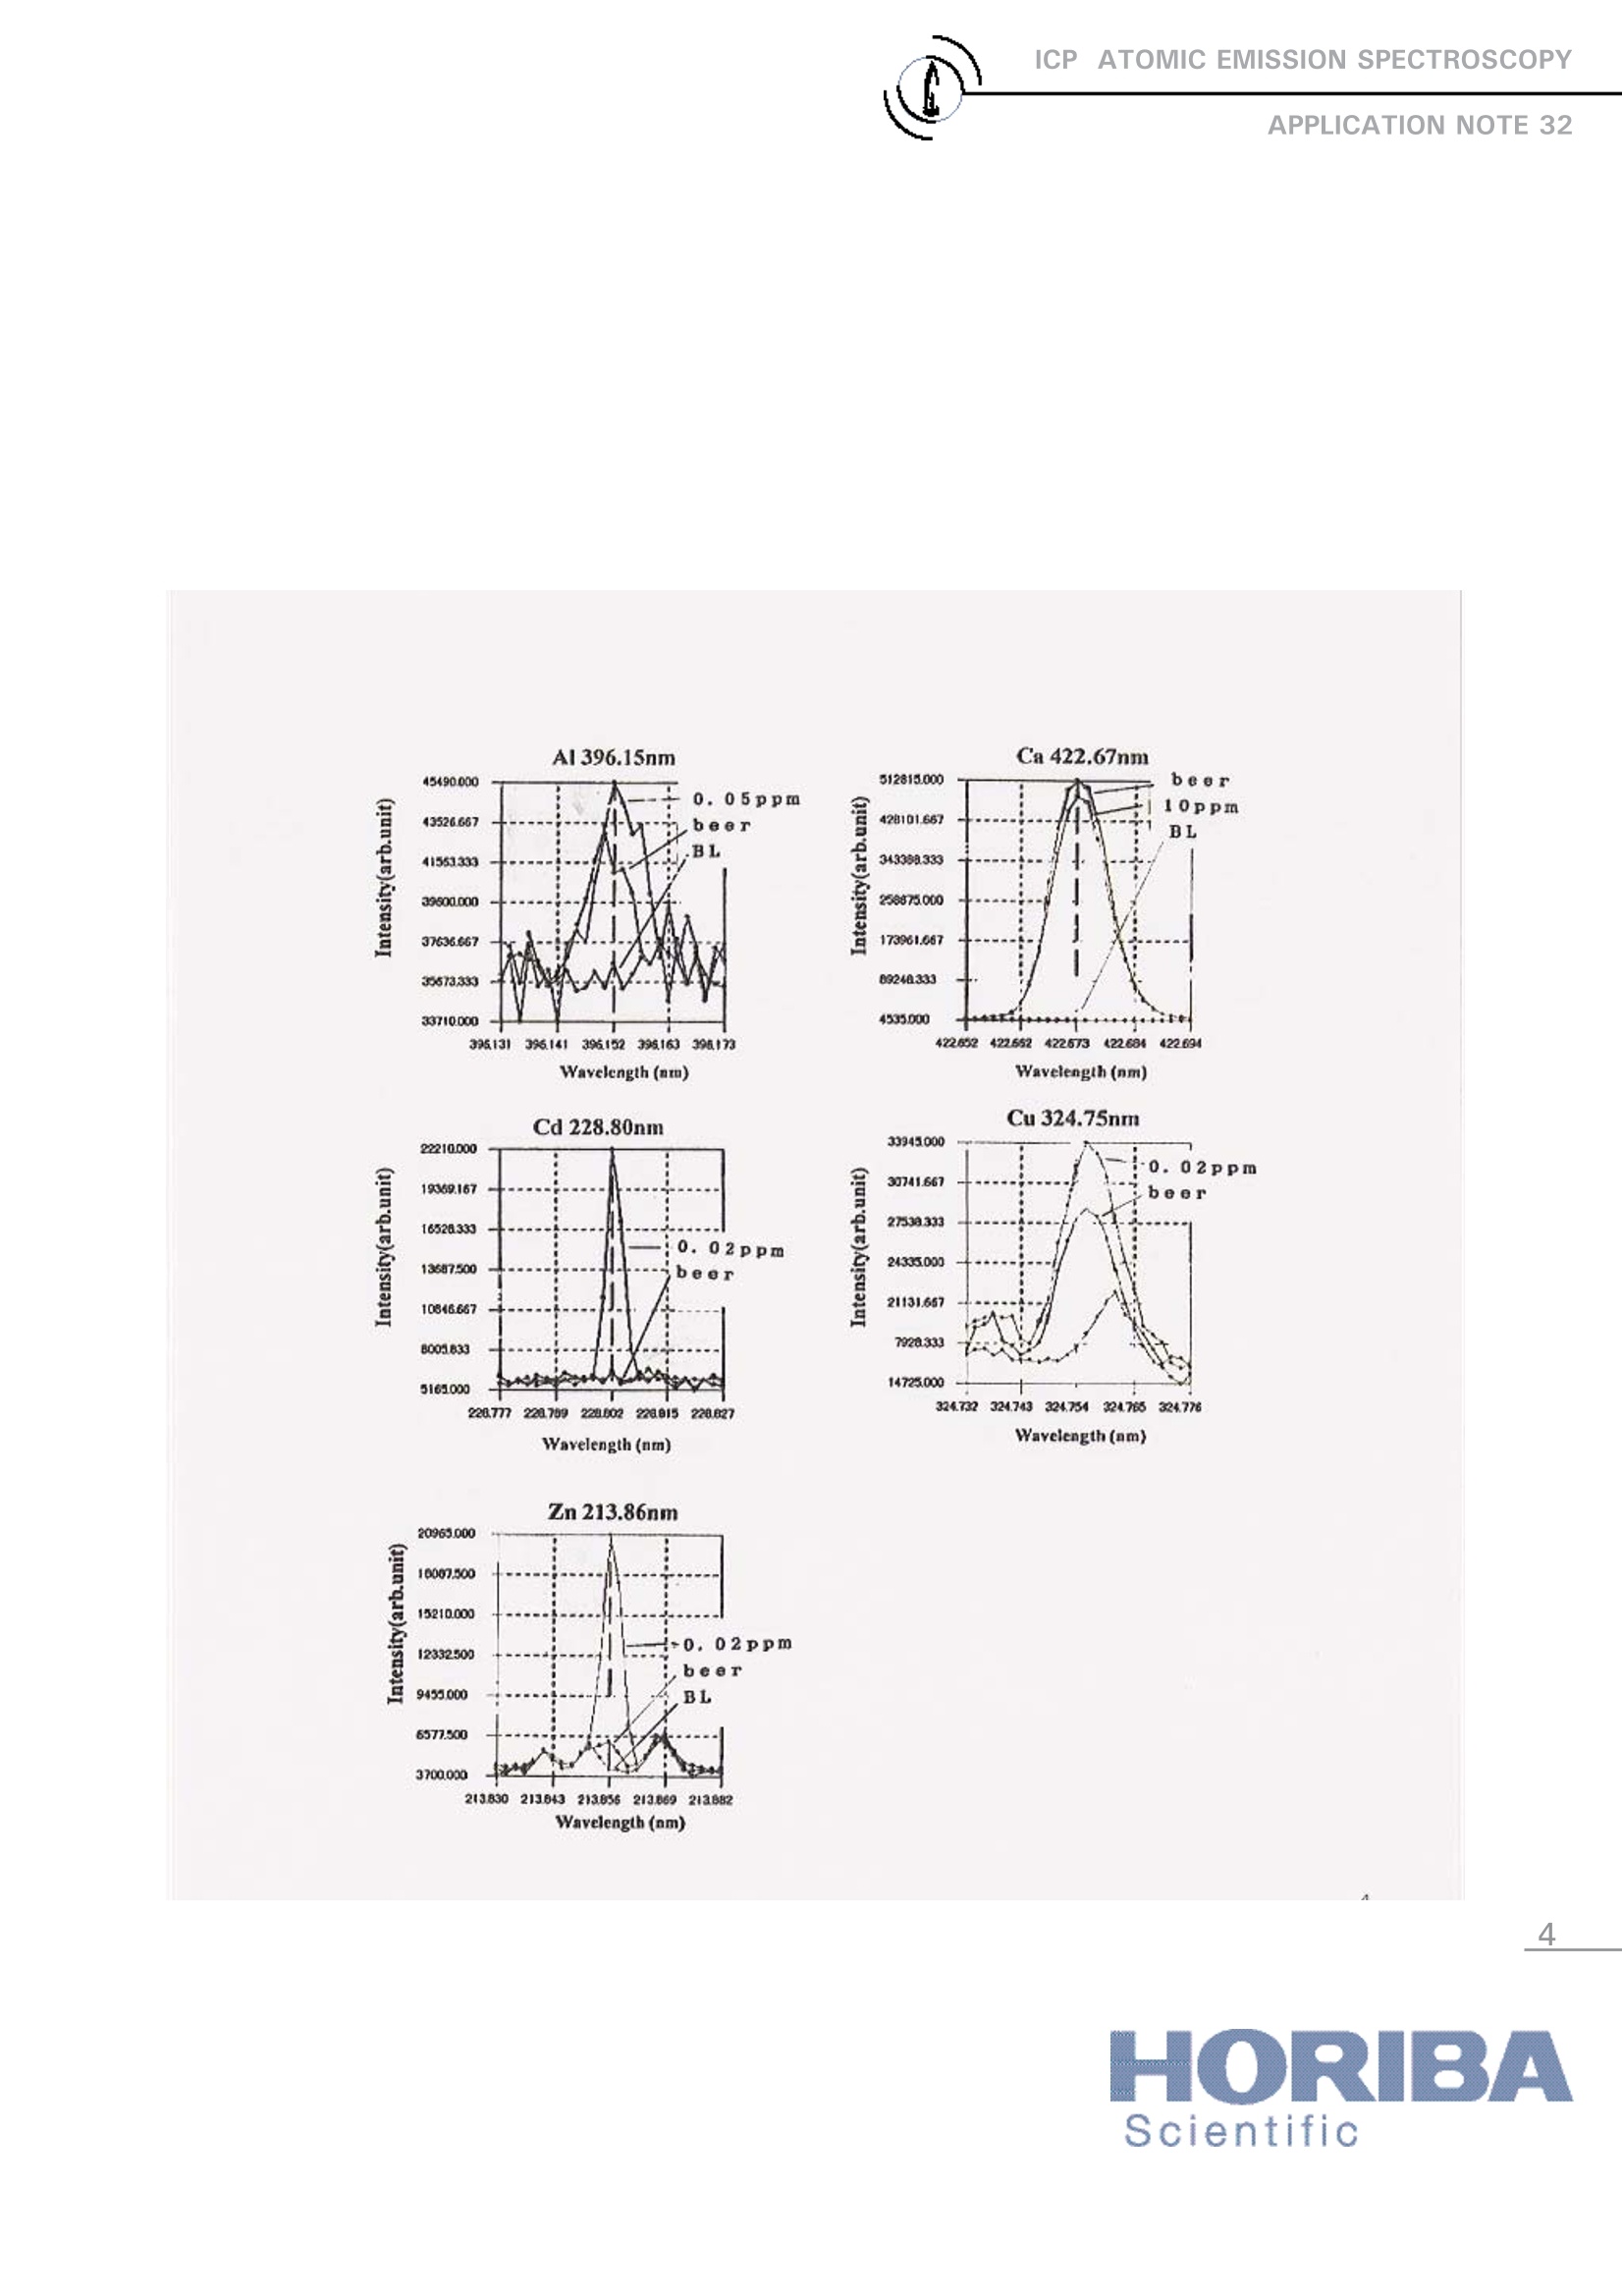
To analyze beer, it was shown in this Application Note that the three types of methods used to eliminate the CO2 and protein gave equivalent results.
方案详情

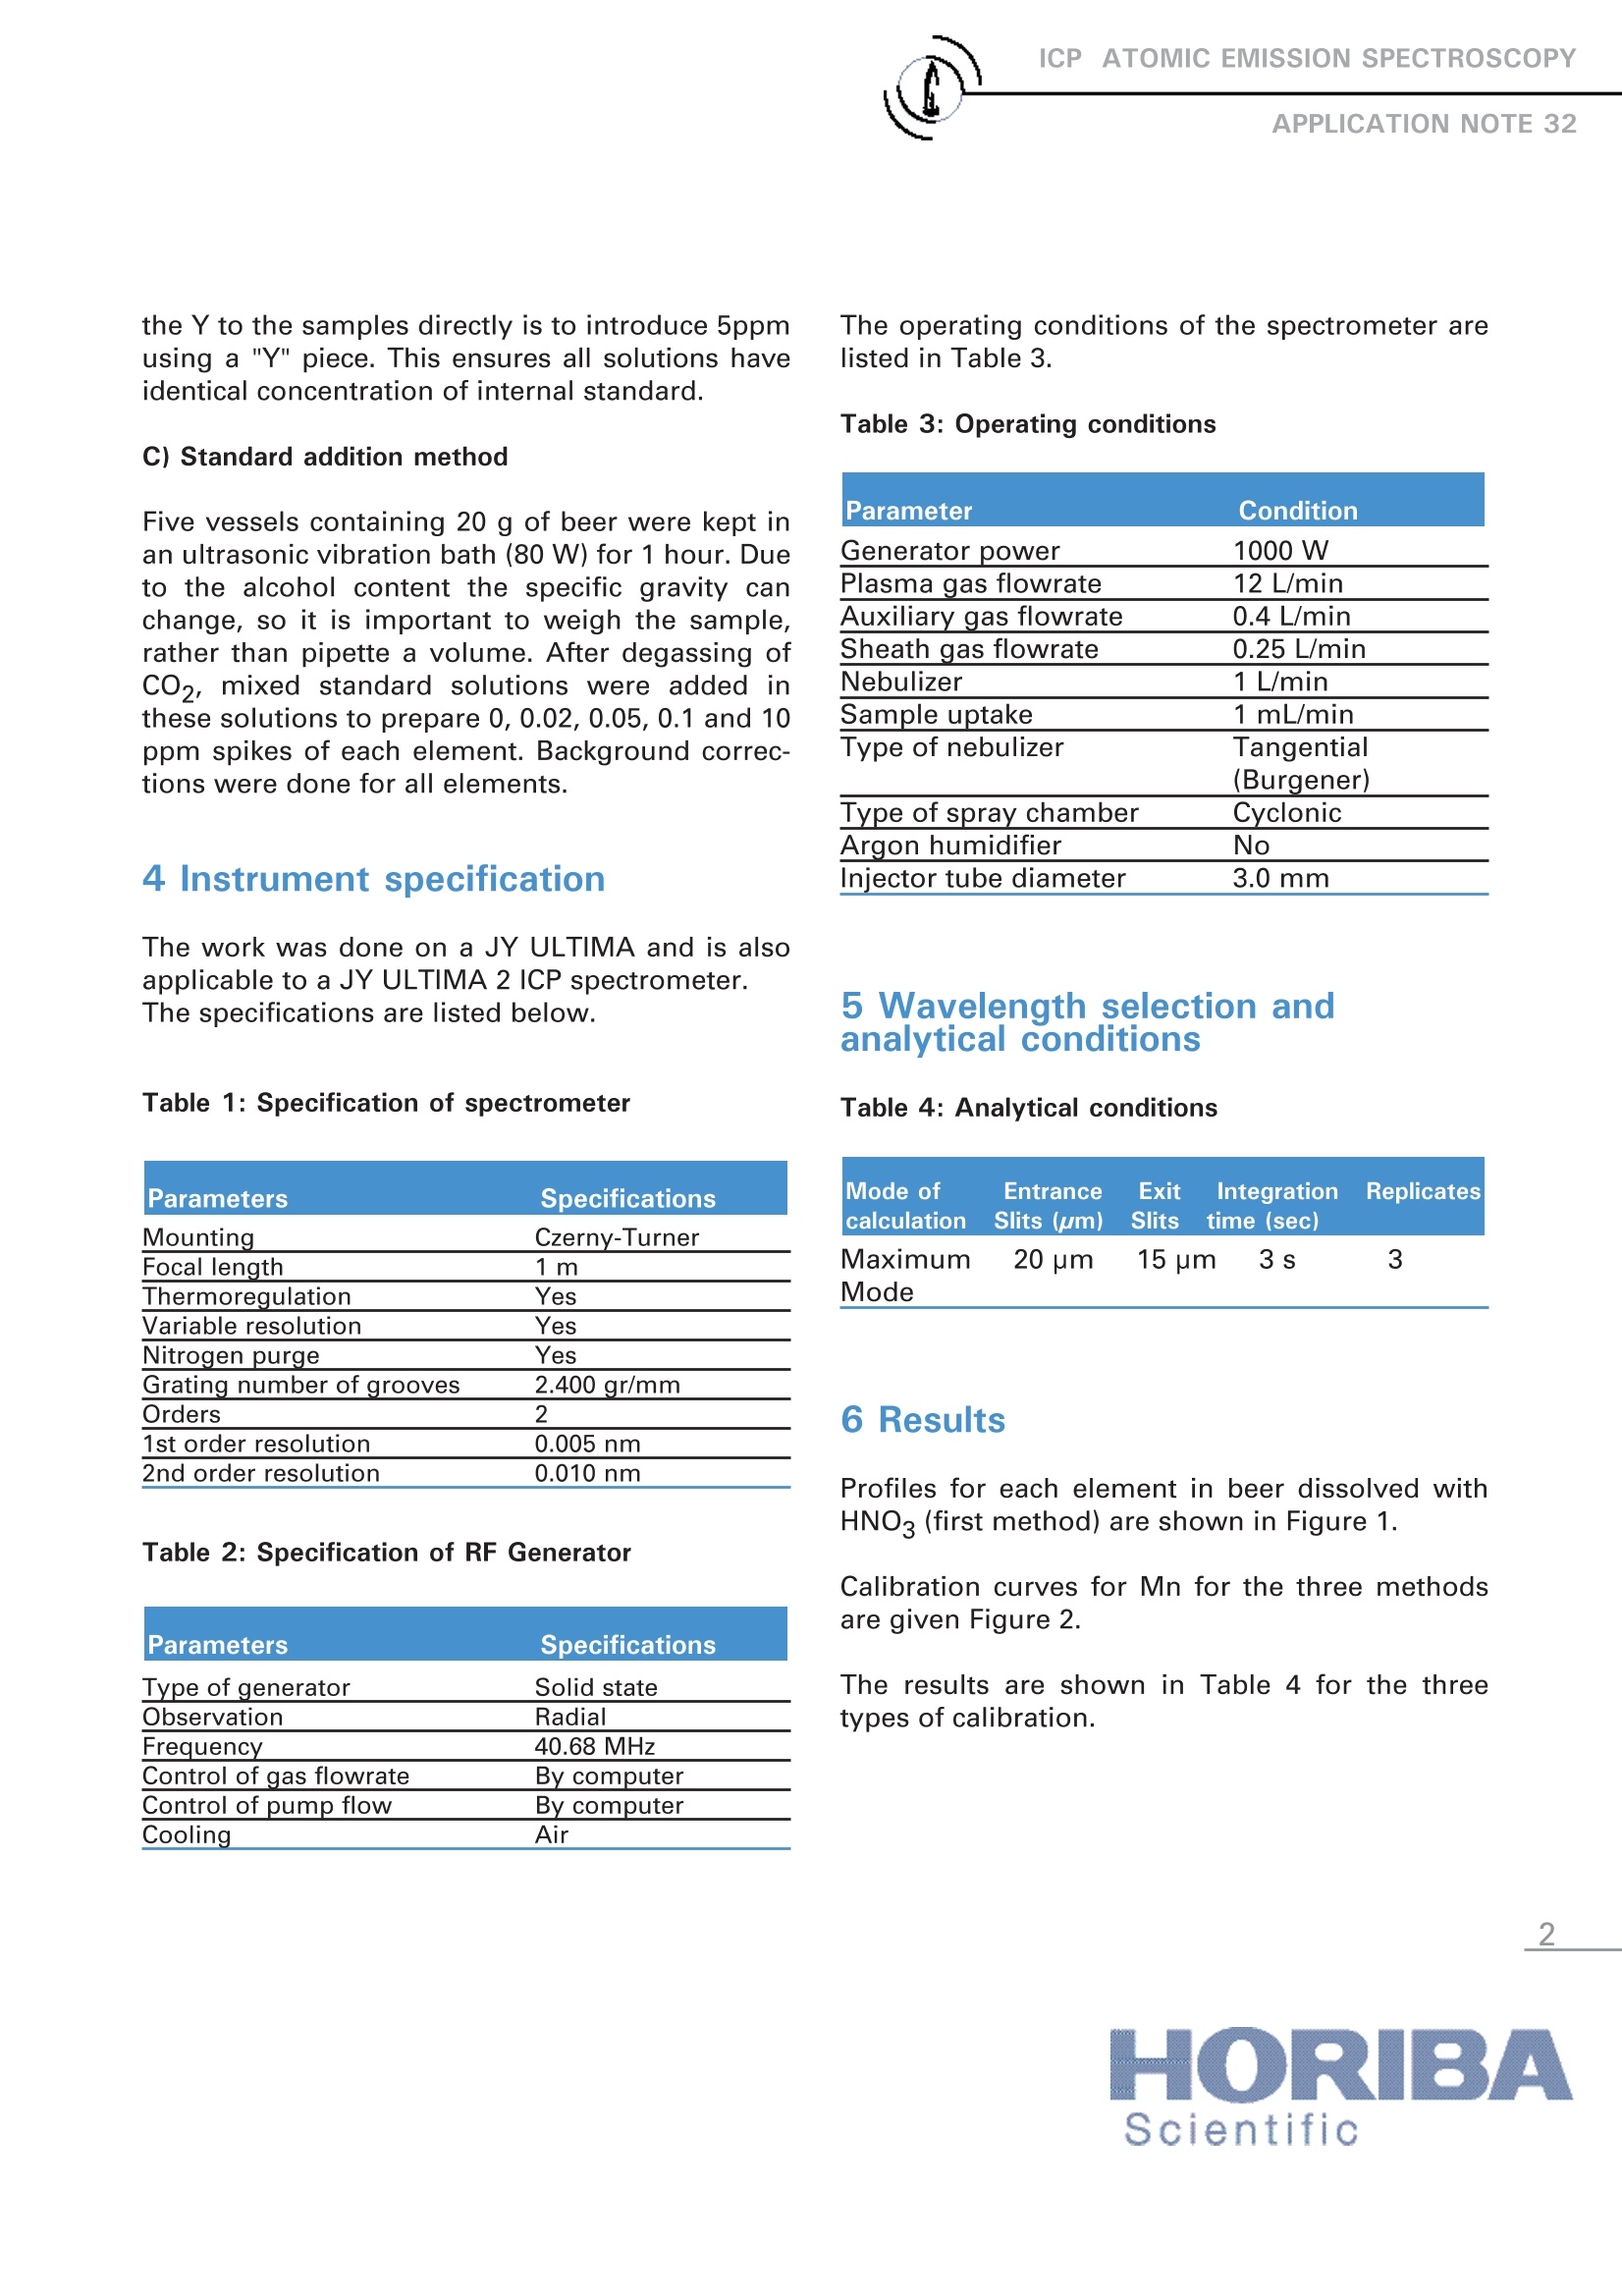
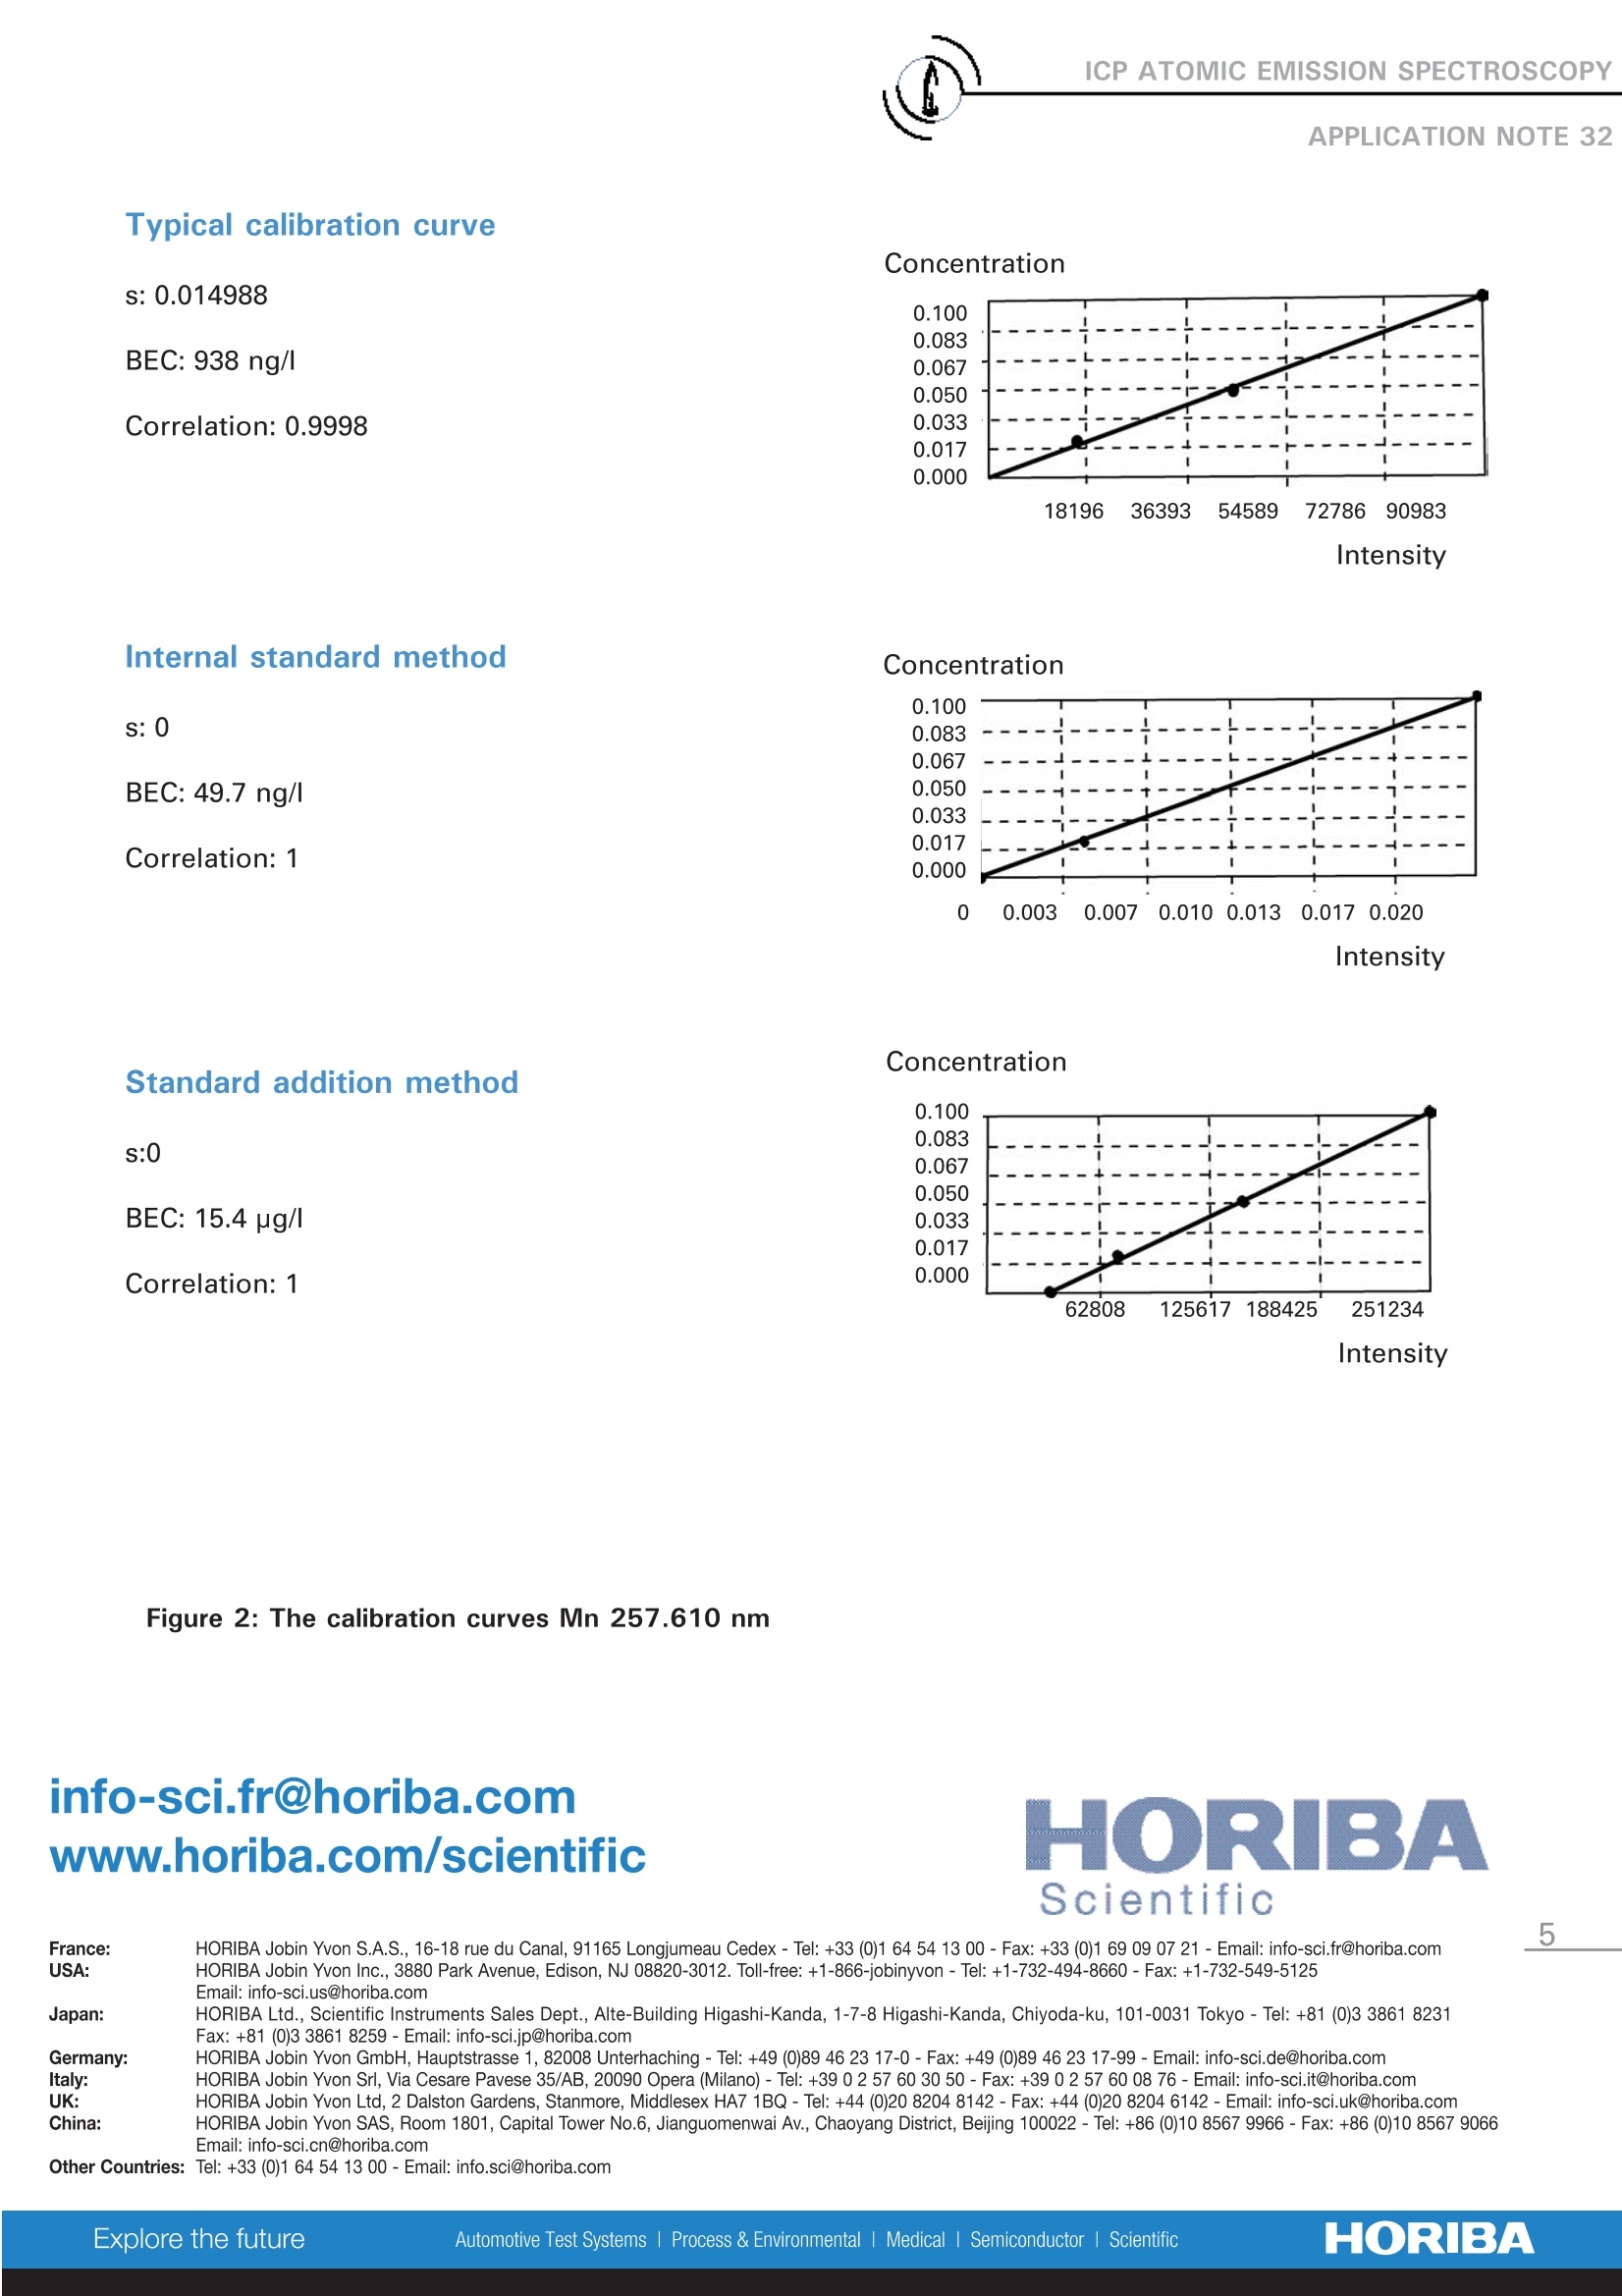
ICP ATOMIC EMISSION SPECTROSCOPYAPPLICATION NOTE 32 Keywords: food, beverage, method developmentElements: Al, Ca, Cd, Cu, Fe, Mg, Mn, Na, Zn 1 Introduction The analysis of beer is important to the breweryindustry, both for production purposes as wellas to the final consumer. The analysis can poseseveral problems due to both the CO2 gas dis-solved in the beer and the dissolved and undis-solved protein. This report demonstrates sever-al appplroaches aanndd compares theresultsobtained. 2 Principle 2.1 Technique used The elemental analysis of these samples wasundertaken by Inductively Coupled PlasmaAtomic Emission Spectrometry (ICP-AES).Thesample is nebulized then transferred to anargon plasma. It is decomposed, atomized andionized whereby the atoms and ions are excited.We measure the intensity of the light emittedwhen the atoms or ions return to lower levels ofenergy. Each element emits light at characteris-tic wavelengths and these lines can be used forquantitative analysis after a calibration. 2.2 Wavelength choice The choice of the wavelength in a given matrixcan be made using the profile function, or byusing "Win-Image", which is rapid semi-quanti-tative analysis mode using multiple wave-lengths. The principle is the same in either case:record the scans of analytes at low concentra-tion, and of the matrix. By superimposing thespectra, we see possible interferences. 3 Sample Preparation The analysis of beer is affected by CO, andorganic materials such as protein. The COmust be degassed, otherwise CO, breaks out ofsolution during the pumping stage and nebu-lization. There are several methods to achievethis including bubbling N2 into the solution,ultrasonic vibration and heating. We tried three methods for the analysis. A) Typical calibration curve B) Internal standard method C) Standard addition method A) Typical calibration curve To each 20 g or 40 g sample of beer, about 5 mlof concentrated HNO3 was added to dissolveorganic materials. It was heated at 80 °℃ for 3minutes. The action of HNO3 and heat is todegas the CO2. Distilled water was added to a totalvolume of 50 mL. The standards for the calibration, for all ele-ments, were made from Spex Certiprep Mixstandard solutions. B) Internal standard method A vessel containing 20 g of beer was kept in anultrasonic vibration bath (80W) for 1 hour todegas the CO2 in the beer. Due to the alcoholcontent the specific gravity can change, so it isimportant to weigh the sample, rather thanpipette a volume. Then, 5 ppm Yttrium wasadded as an internal standard element in thissolution and distilled water was added to makea total weight of 50 g. The standards for calibra-tion curves, for each element, was made fromSpex Certiprep Mix standard solutions and 5ppm Yttrium was added at the same concentra-tions as the samples. An alternative to adding the Y to the samples directly is to introduce 5ppmusing a "Y" piece. This ensures all solutions haveidentical concentration of internal standard. C) Standard addition method Five vessels containing 20 g of beer were kept inan ultrasonic vibration bath (80 W) for 1 hour. Dueto the alcohol content the specific gravity canchange, so it is important to weigh the sample,rather than pipette a volume. After degassing ofCO2, mixed standard solutions were added inthese solutions to prepare 0, 0.02, 0.05, 0.1 and 10ppm spikes of each element. Background correc-tions were done for all elements. 4 Instrument specification The work was done on a JY ULTIMA and is alsoapplicable to a JY ULTIMA 2 ICP spectrometer.The specifications are listed below. Table 1: Specification of spectrometer Parameters Specifications Mounting Czerny-Turner Focal length 1 m Thermoregulation Yes Variable resolution Yes Nitrogen purge Yes Grating number of grooves 2.400 gr/mm Orders 2 1st order resolution 0.005 nm 2nd order resolution 0.010 nm Table 2: Specification of RF Generator Parameters Specifications Type of generator Solid state Observation Radial Frequency 40.68 MHz Control of gas flowrate By computer Control of pump flow By computer Cooling Air The operating conditions of the spectrometer arelisted in Table 3. Table 3: Operating conditions Parameter Condition Generator power 1000 W Plasma gas flowrate 12 L/min Auxiliary gas flowrate 0.4 L/min Sheath gas flowrate 0.25 L/min Nebulizer 1 L/min Sample uptake 1 mL/min Type of nebulizer Tangential (Burgener) Type of spray chamber Cyclonic Argon humidifier No Injector tube diameter 3.0mm 5 Wavelength selection andanalytical conditions Table 4: Analytical conditions Mode of Entrance Exit Integration Replicates calculation Slits (um) Slits time (sec) Maximum 20 um 15 um 3 s 3 Mode 6 Results Profiles for each element in beer dissolved withHNO3 (first method) are shown in Figure 1. Calibration curves for Mn for the three methodsare given Figure 2. The results are shown in Table 4 for the threetypes of calibration. Element Wavelength A (ppm) B (ppm) C (ppm) nm a b Al 396.1 0.080 0.082 0.078 0.072 Ca 422.6 28.8 29.4 29.6 27.2 Cd 228.8 <0.0001 <0.0001 <0.0001 <0.0001 Cu 324.7 0.042 0.040 0.042 0.050 Fe 259.9 0.056 0.051 0.059 0.066 Mg 285.2 48.1 52.2 53.5 53.7 Mn 257.6 0.075 0.074 0.076 0.071 Na 588.9 29.9 31.0 30.7 30.5 Zn 213.9 0.0052 0.0035 0.0050 0.0058 7 Conclusion Figure 1: Profiles of elements in beer.Dissolution with HNO Typical calibration curve Concentration s: 0.014988 0.100 1 0.083 BEC: 938 ng/l 0.067 0.050 Correlation: 0.9998 0.033 0.017 0.000 18196 36393 54589 7278690983 Intensity Internal standard method Concentration s: 0 BEC: 49.7 ng/I Correlation: 1 Concentration Standard addition method s:0 BEC: 15.4 pg/l Correlation: 1 Intensity Figure 2: The calibration curves Mn 257.610 nm France: HORIBA Jobin Yvon S.A.S., 16-18 rue du Canal, 91165 Longjumeau Cedex-Tel: +33 (0)1 64 54 13 00-Fax: +33 (0)1 69 09 07 21-Email: info-sci.fr@horiba.comUSA: HORIBA Jobin Yvon Inc., 3880 Park Avenue, Edison, NJ 08820-3012. Toll-free:+1-866-jobinyvon-Tel: +1-732-494-8660-Fax:+1-732-549-5125Email: info-sci.us@horiba.com Japan: HORIBA Ltd., Scientific Instruments Sales Dept., Alte-Building Higashi-Kanda, 1-7-8 Higashi-Kanda, Chiyoda-ku, 101-0031 Tokyo - Tel: +81 (0)3 3861 8231Fax: +81 (0)3 3861 8259-Email: info-sci.jp@horiba.com Germany: HORIBA Jobin Yvon GmbH, Hauptstrasse 1, 82008 Unterhaching- Tel: +49 (0)89 46 23 17-0- Fax: +49 (0)89 46 23 17-99-Email: info-sci.de@horiba.com Italy: HORIBA Jobin Yvon Srl, Via Cesare Pavese 35/AB, 20090 Opera (Milano)- Tel: +39 0 2 57 60 30 50-Fax: +39 0 2 57 60 08 76-Email: info-sci.it@horiba.com UK: HORIBA Jobin Yvon Ltd, 2 Dalston Gardens, Stanmore, Middlesex HA7 1BQ-Tel:+44 (0)20 82048142-Fax: +44 (0)20 8204 6142-Email: info-sci.uk@horiba.com China: HORIBA Jobin Yvon SAS, Room 1801, Capital Tower No.6, Jianguomenwai Av., Chaoyang District, Beijing 100022 -Tel: +86 (0)10 8567 9966-Fax: +86 (0)10 8567 9066 Email: info-sci.cn@horiba.com Other Countries: Tel: +33 (0)164 54 13 00-Email: info.sci@horiba.com HORIBAScientific To analyze beer, it was shown in this Application Note that the three types of methods used to eliminate the CO2 and protein gave equivalent results.
确定
还剩3页未读,是否继续阅读?

产品配置单

HORIBA(中国)为您提供《啤酒中元素Cd检测方案(ICP-AES)》,该方案主要用于啤酒中营养成分检测,参考标准--,《啤酒中元素Cd检测方案(ICP-AES)》用到的仪器有HORIBA Ultima Expert高性能ICP光谱仪
推荐专场
相关方案
更多
该厂商其他方案
更多