


方案详情
文
Inadequate oxygen concentration in the root zone is a constraint to plant performance particularly in heavy, compacted and/or saline soils. Sub-surface drip irrigation (SDI) offers a means of increasing
oxygen to plant roots in such soils, provided irrigation water can be hyper-aerated or oxygenated. Hydrogen peroxide (HP) at the rate of 5 litre ha-1 at the end of each irrigation cycle was injected
through SDI tape to a field-grown zucchini (courgette) crop (Cucurbita pepo) on a saturated heavy clay soil in Queensland, Australia. Fruit yield, number and shoot weight increased by 25%, 29% and 24% respectively due to HP treatment compared to the control. Two pot experiments with vegetable soybean (Glycine max) and cotton (Gossypium hirsutum) compared the effectiveness of HP and air injection using a MazzeiTM air injector (a venturi), throughout the irrigation cycle in raising crop yield in a heavy clay soil kept at saturation or just under field capacity. Fresh pod yield of vegetable soybean increased by 82-96% in aeration treatments compared with the control. The yield increase was associated
with more pods per plant and greater mean pod weight. Significantly higher above ground biomass and light interception were evident with aeration, irrespective of soil water treatment. Similarly cotton
lint yield increased by 14-28% in aeration treatments compared with the control. The higher lint yield was associated with more squares and bolls per plant which accompanied greater above ground biomass
and an increase in root mass, root length and soil respiration. Air injection and HP effected greater water use, but also brought about an enhancement of water use efficiency (WUE) for pod and lint
yield, and increased leaf photosynthetic rate in both species but had no effect on transpiration rate and stomatal conductance per unit leaf area.
方案详情

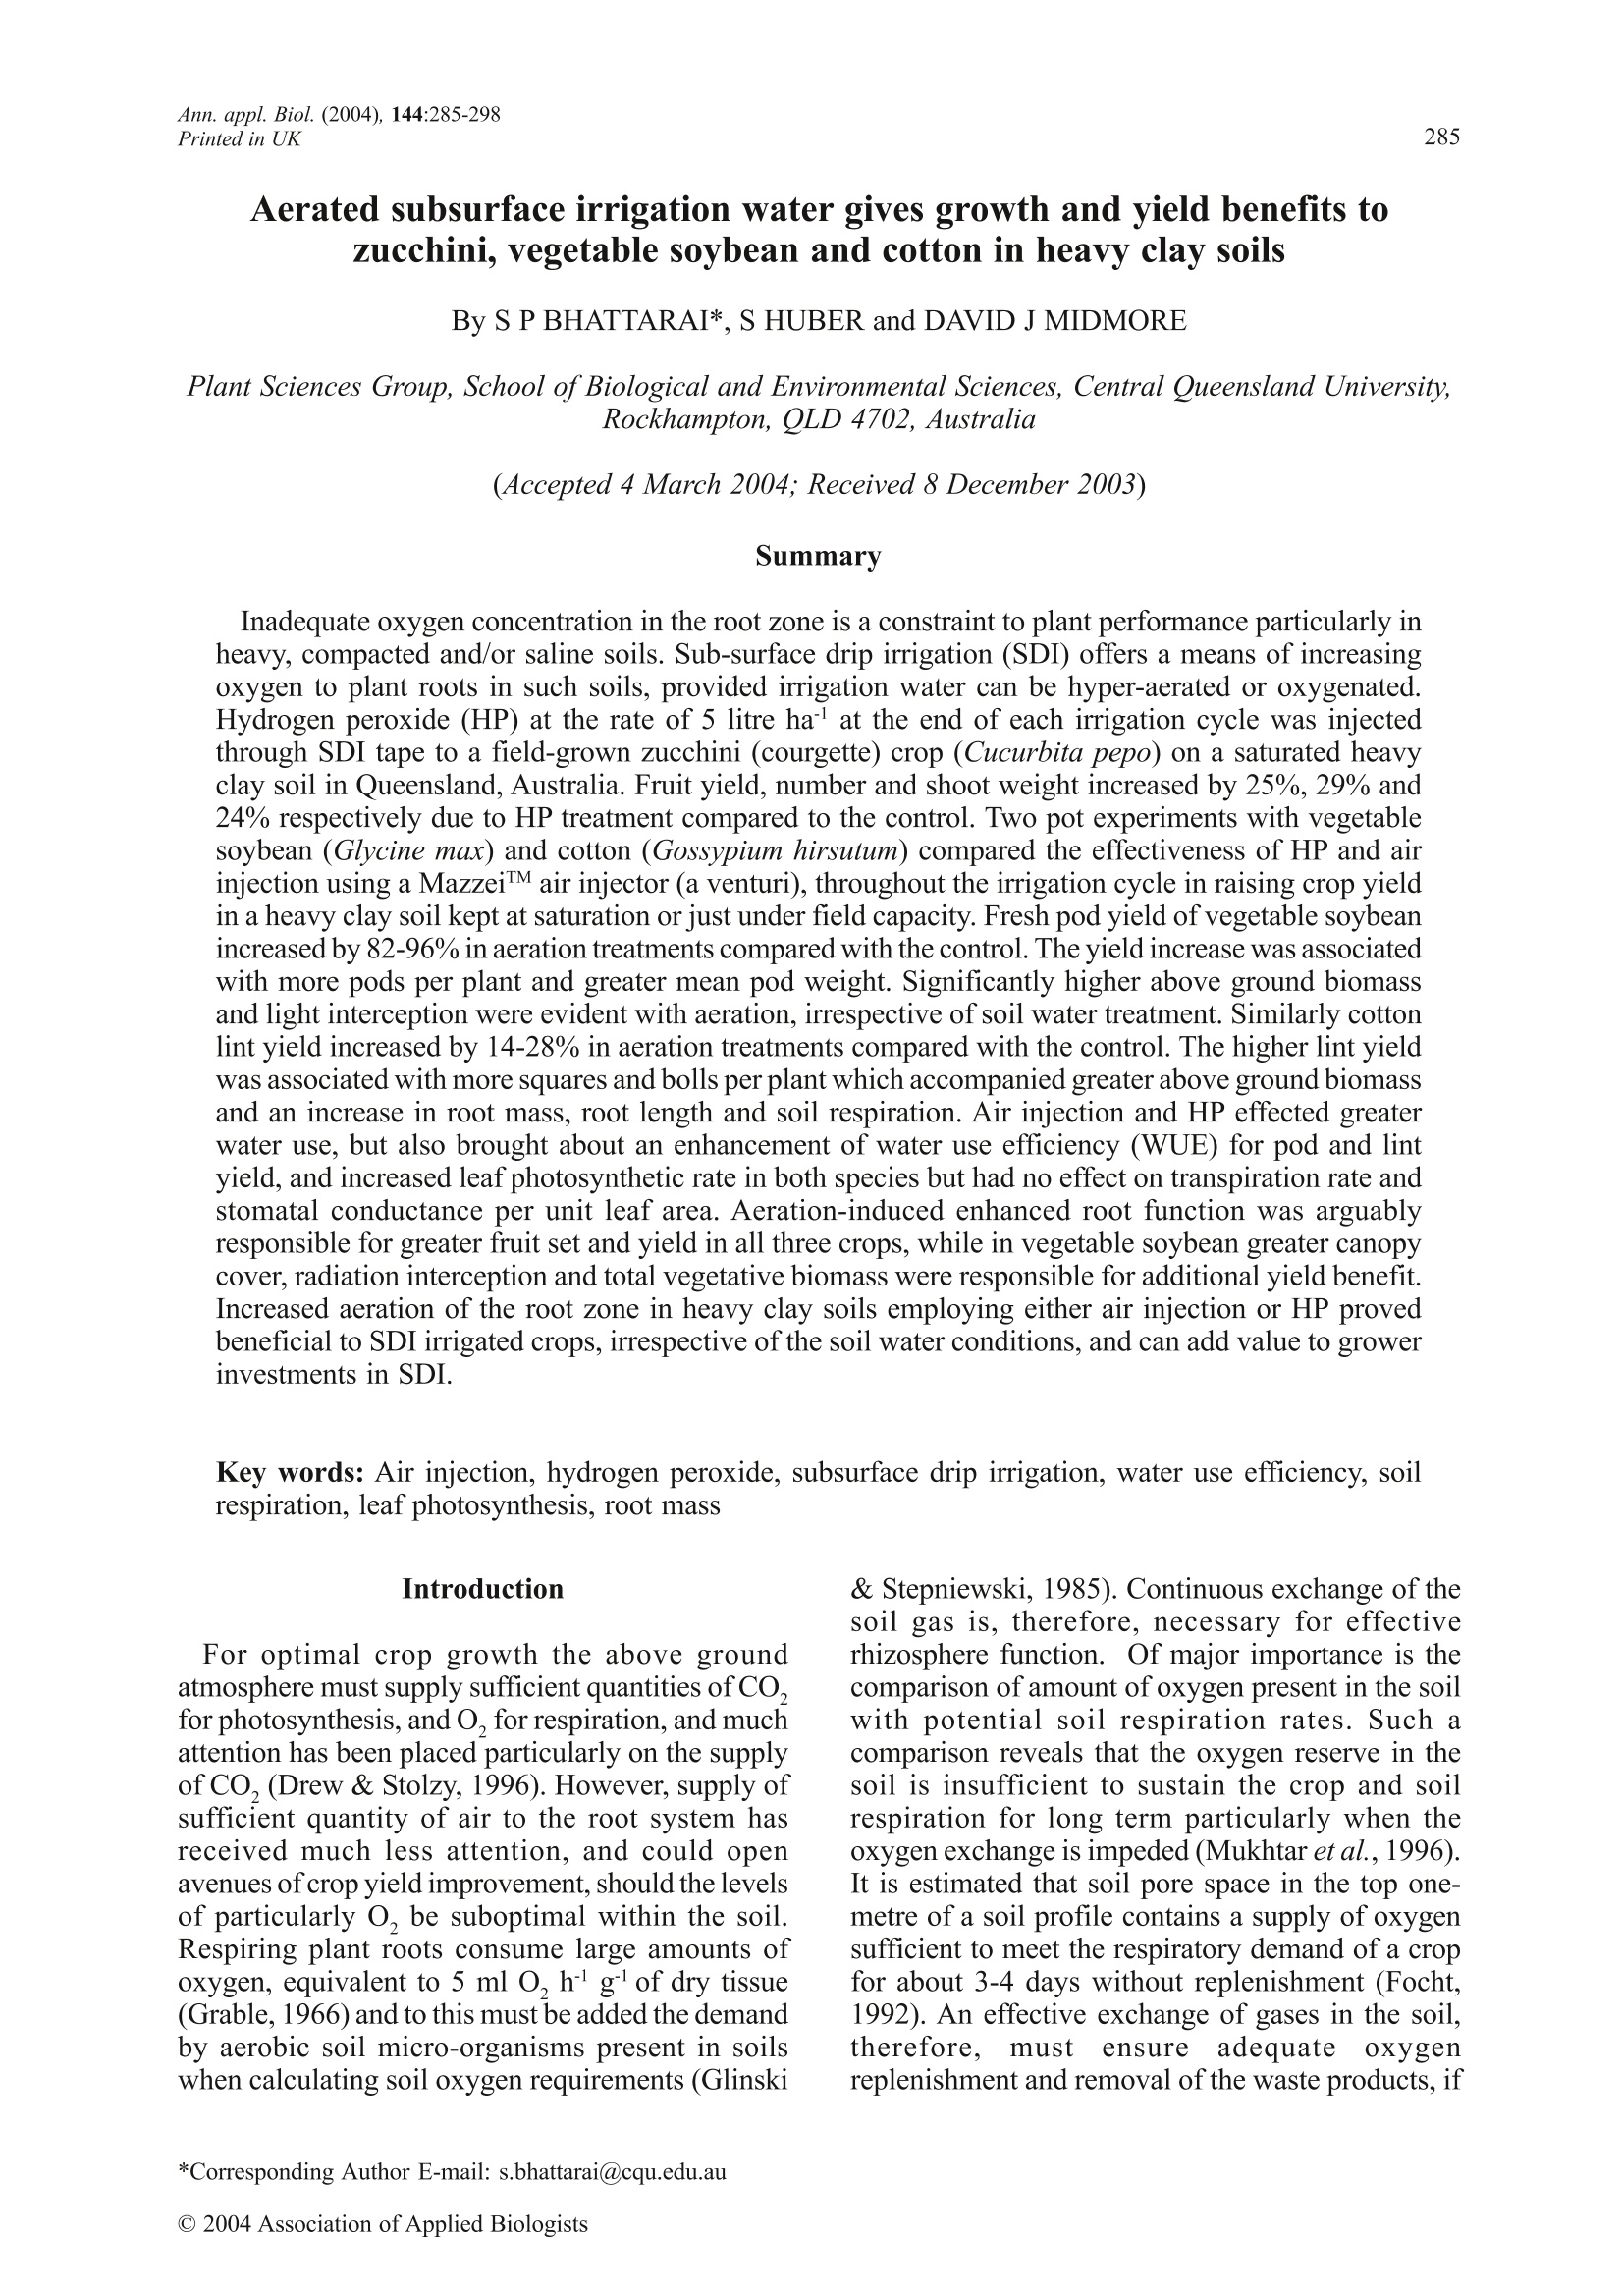
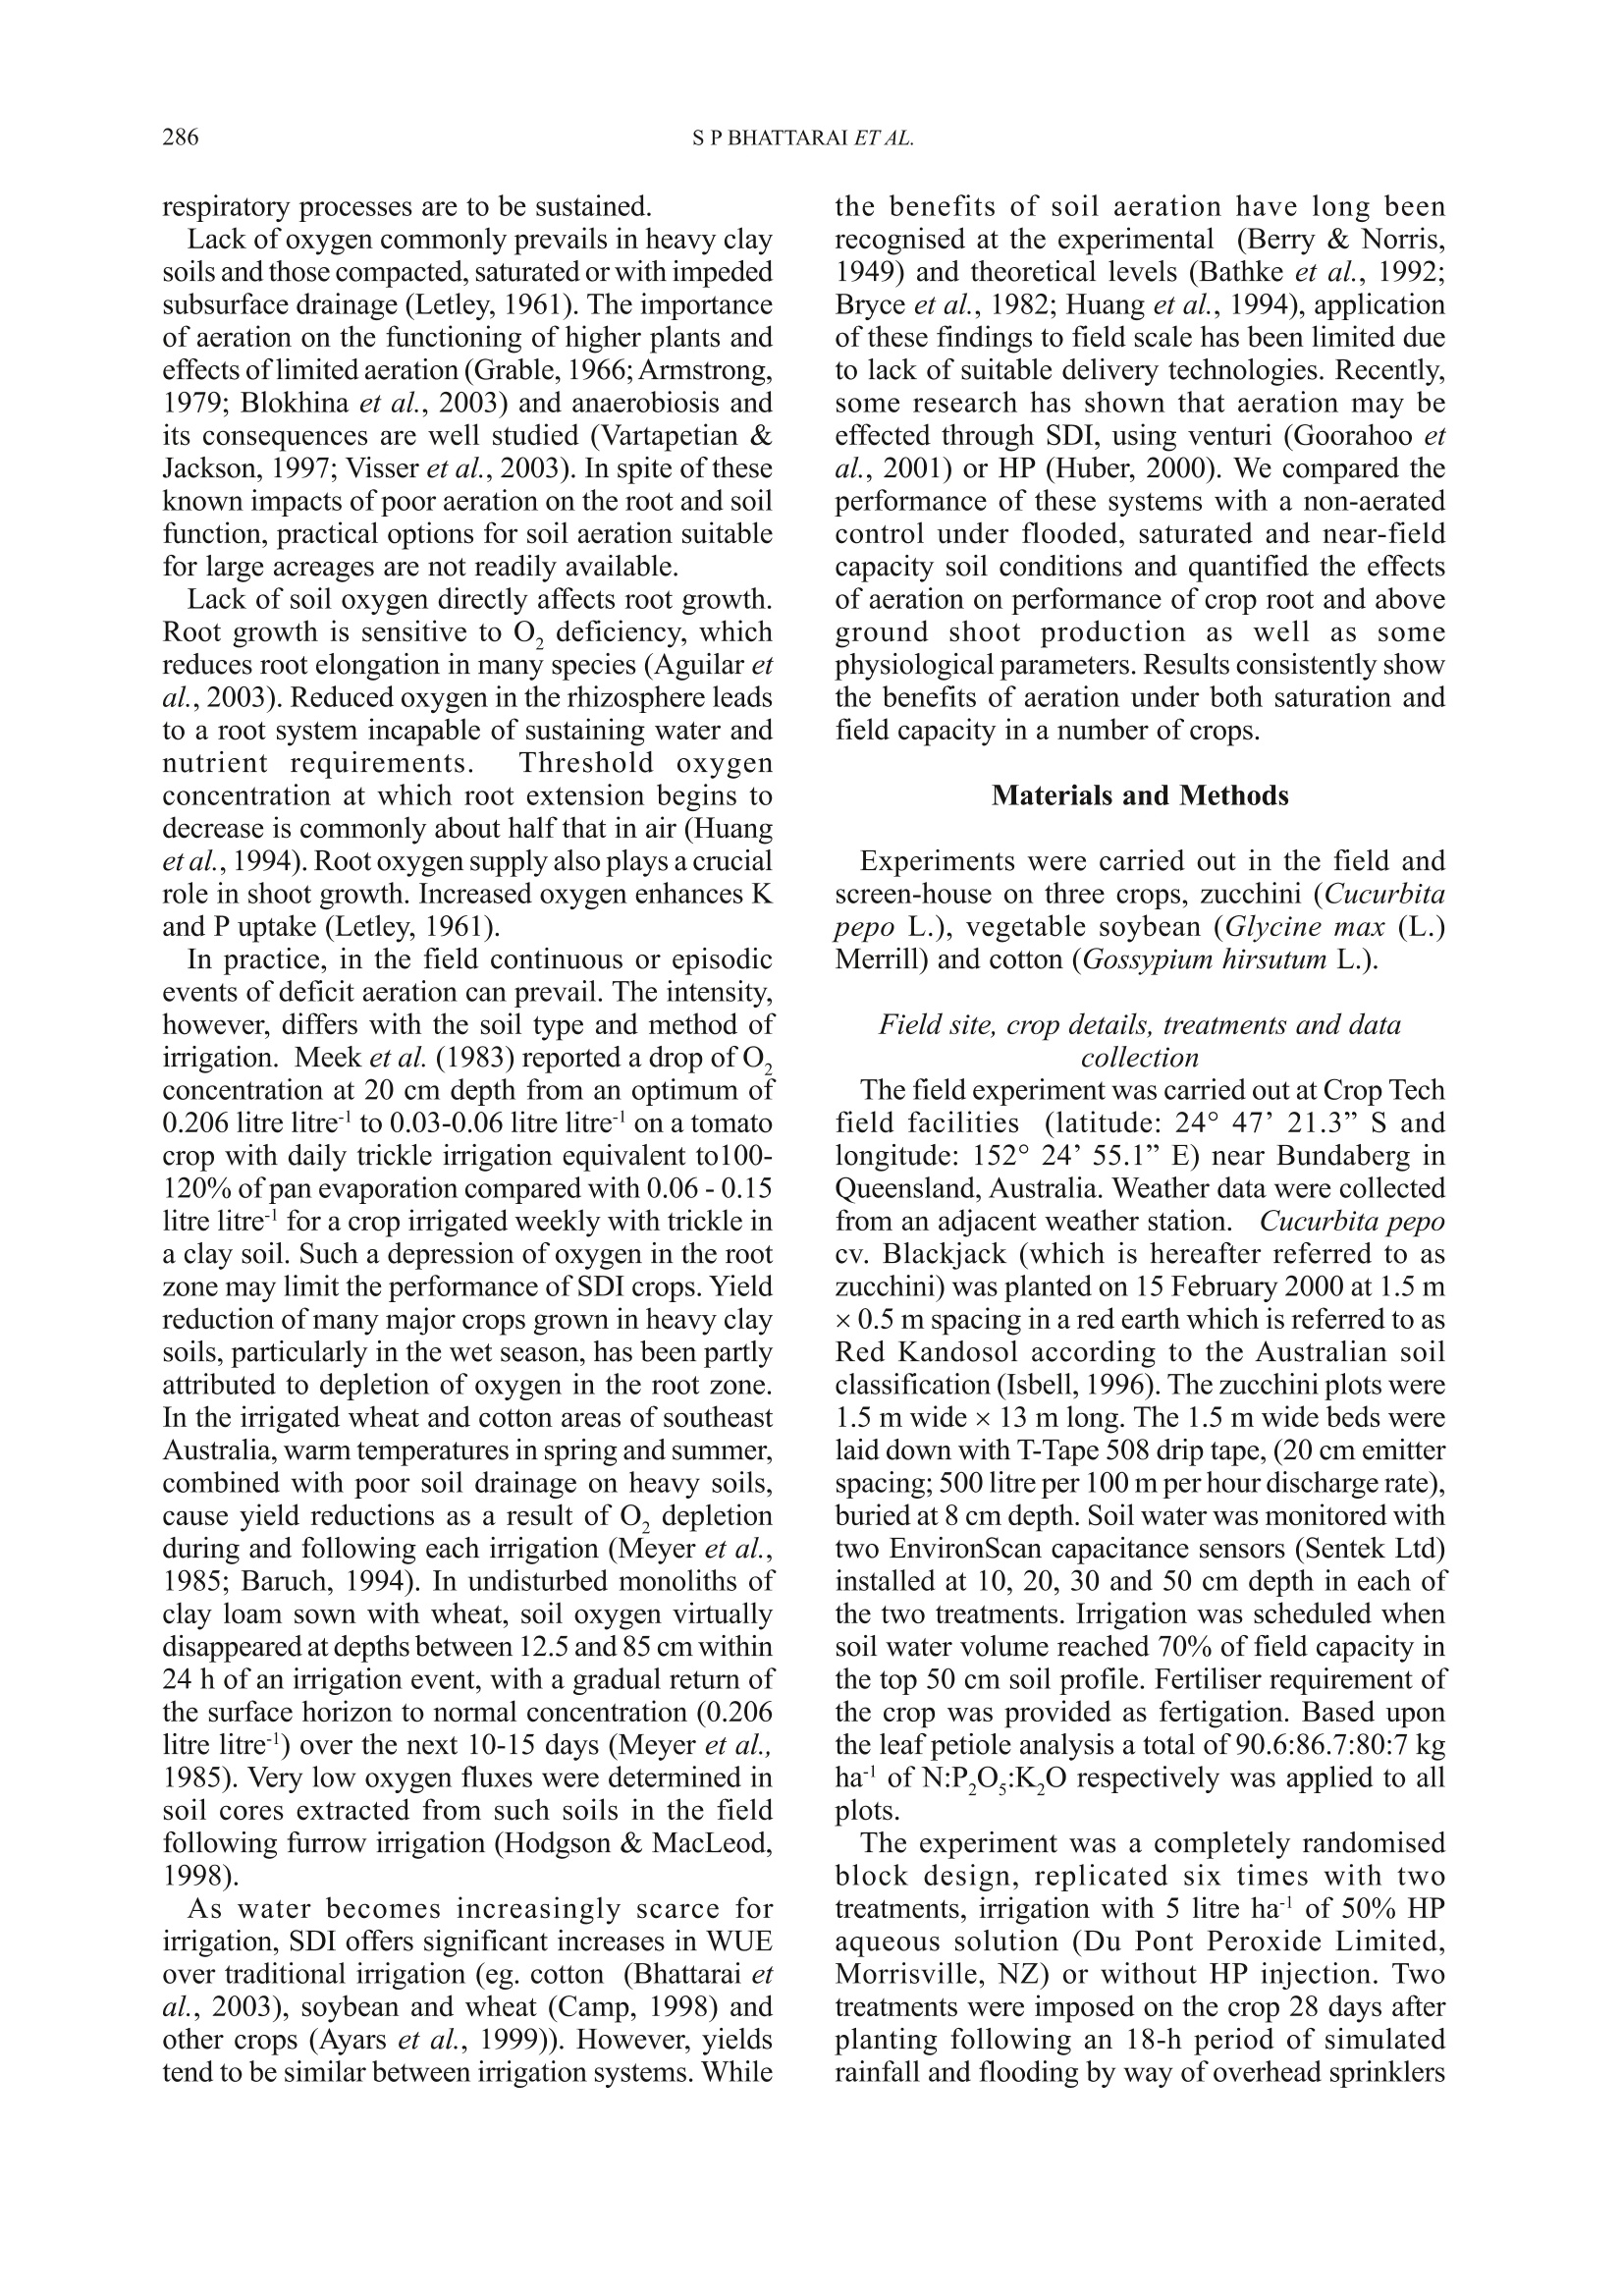
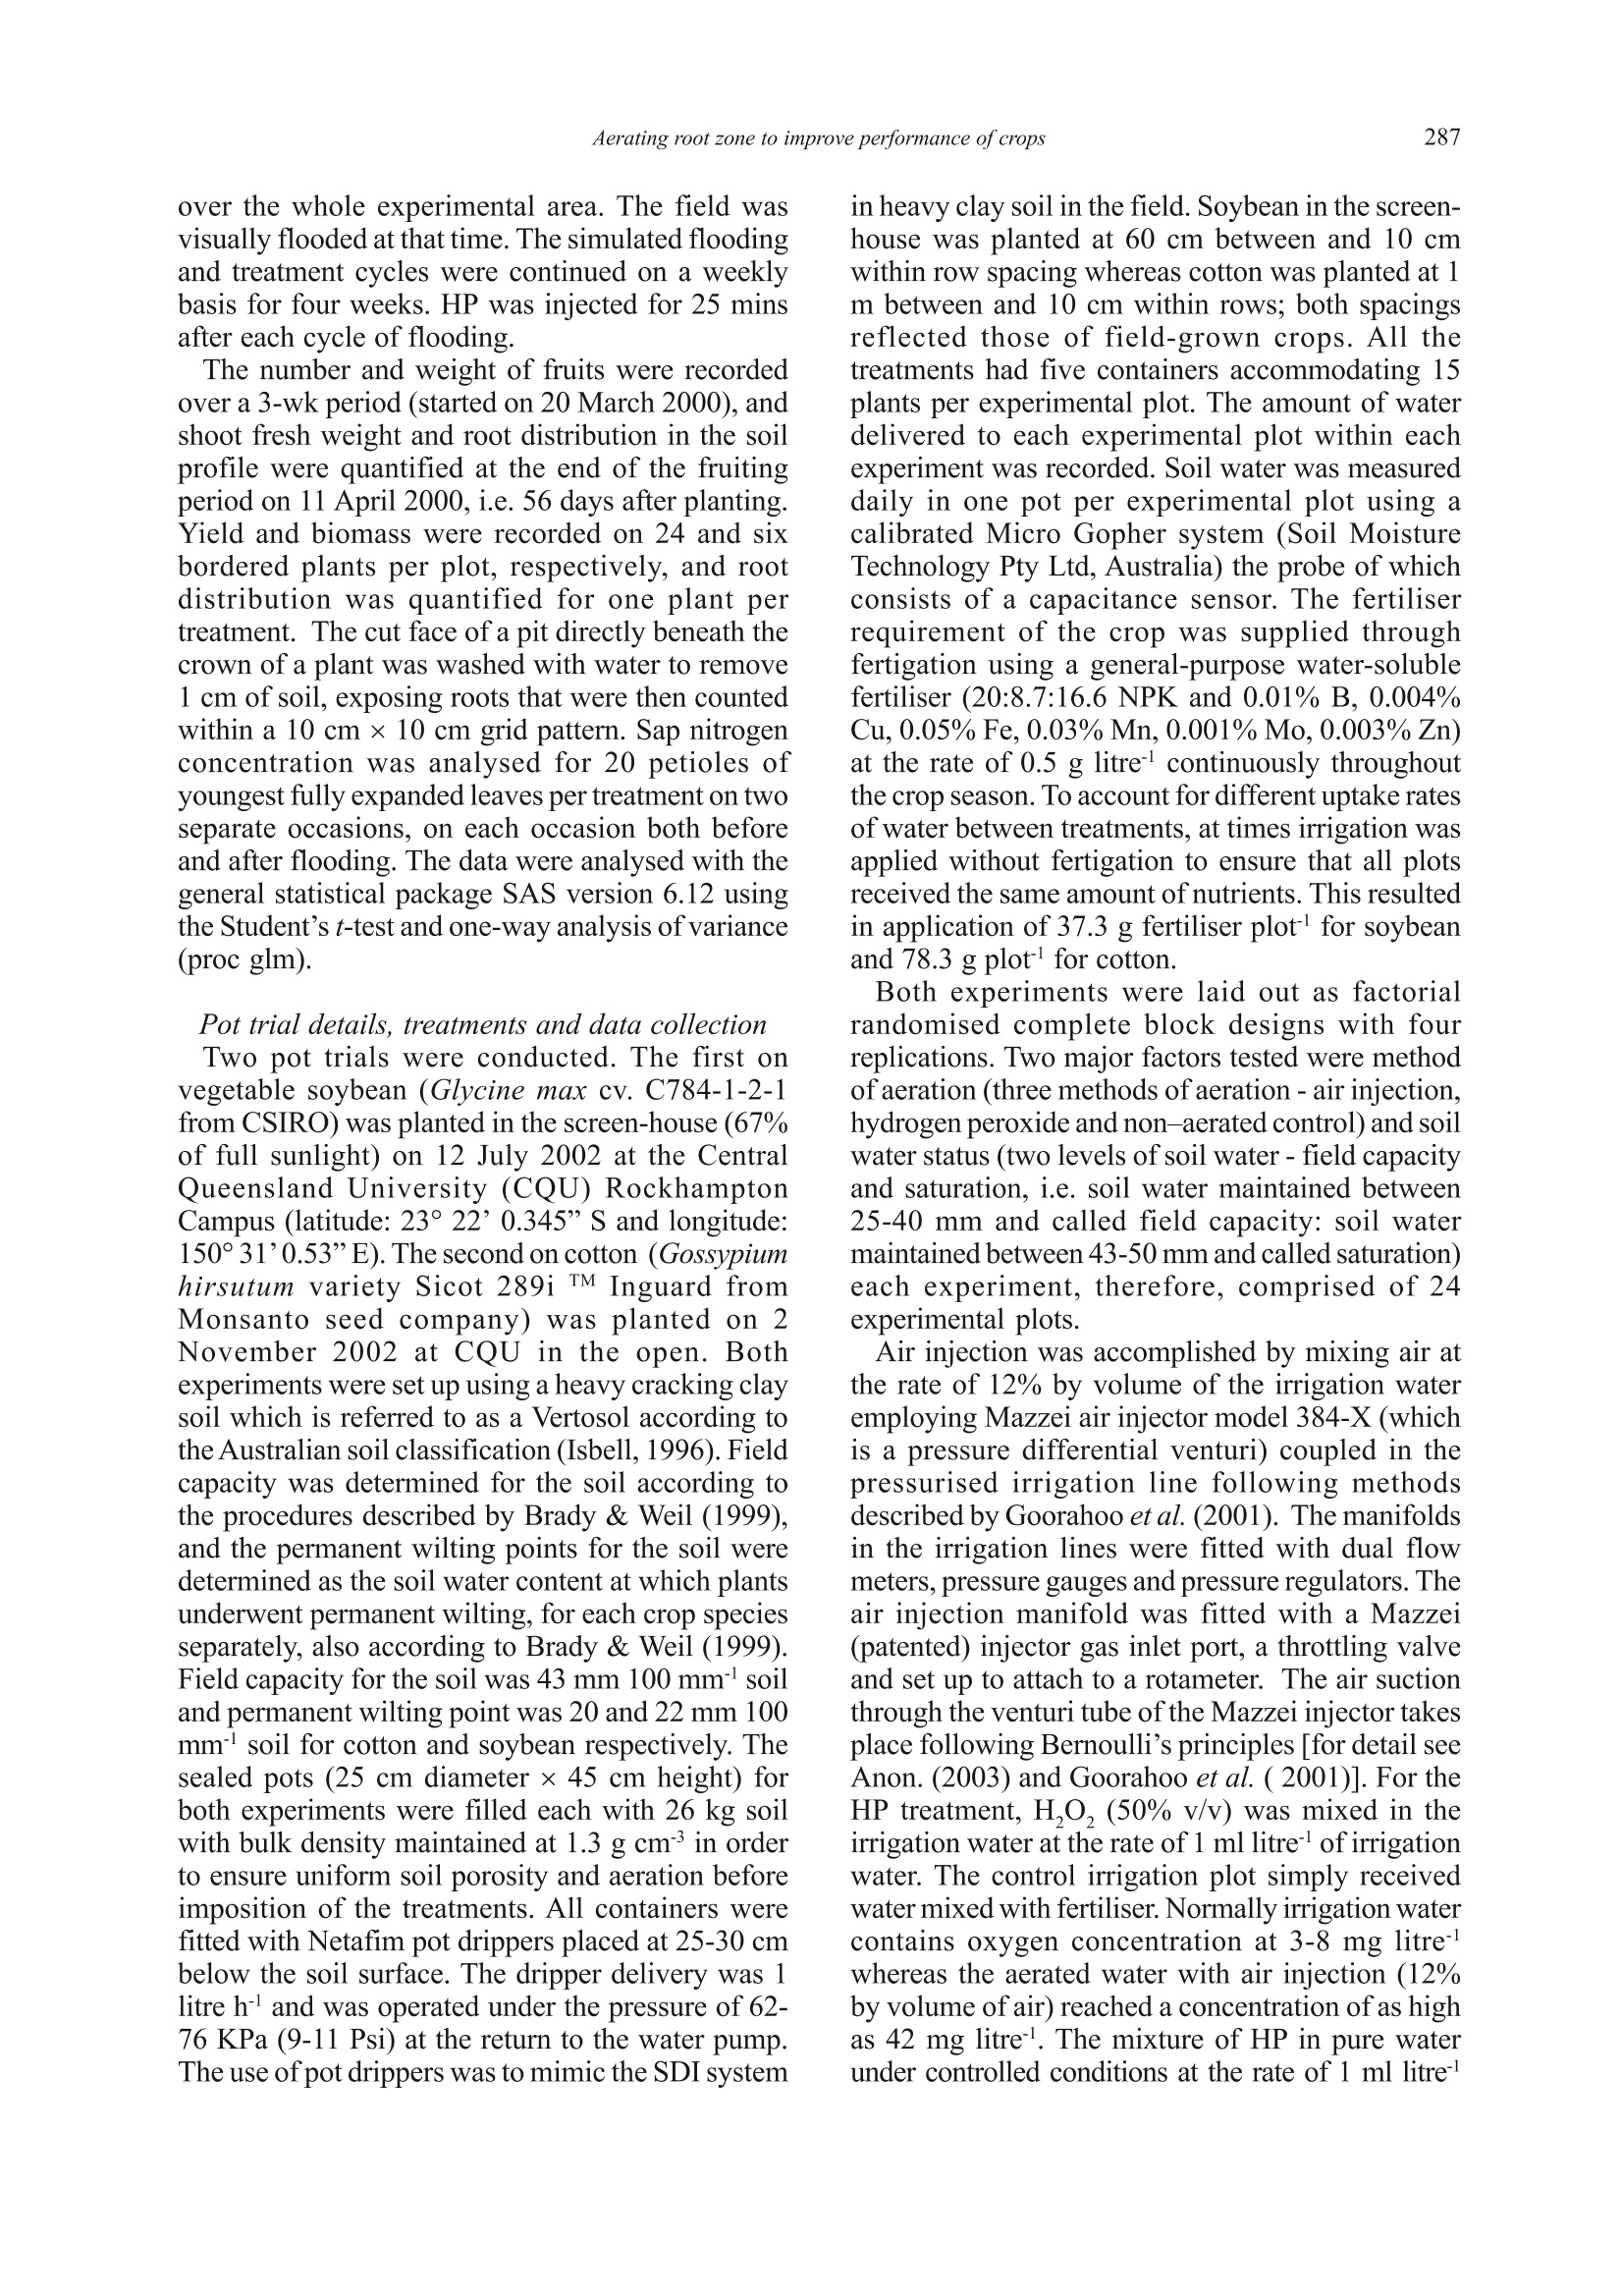
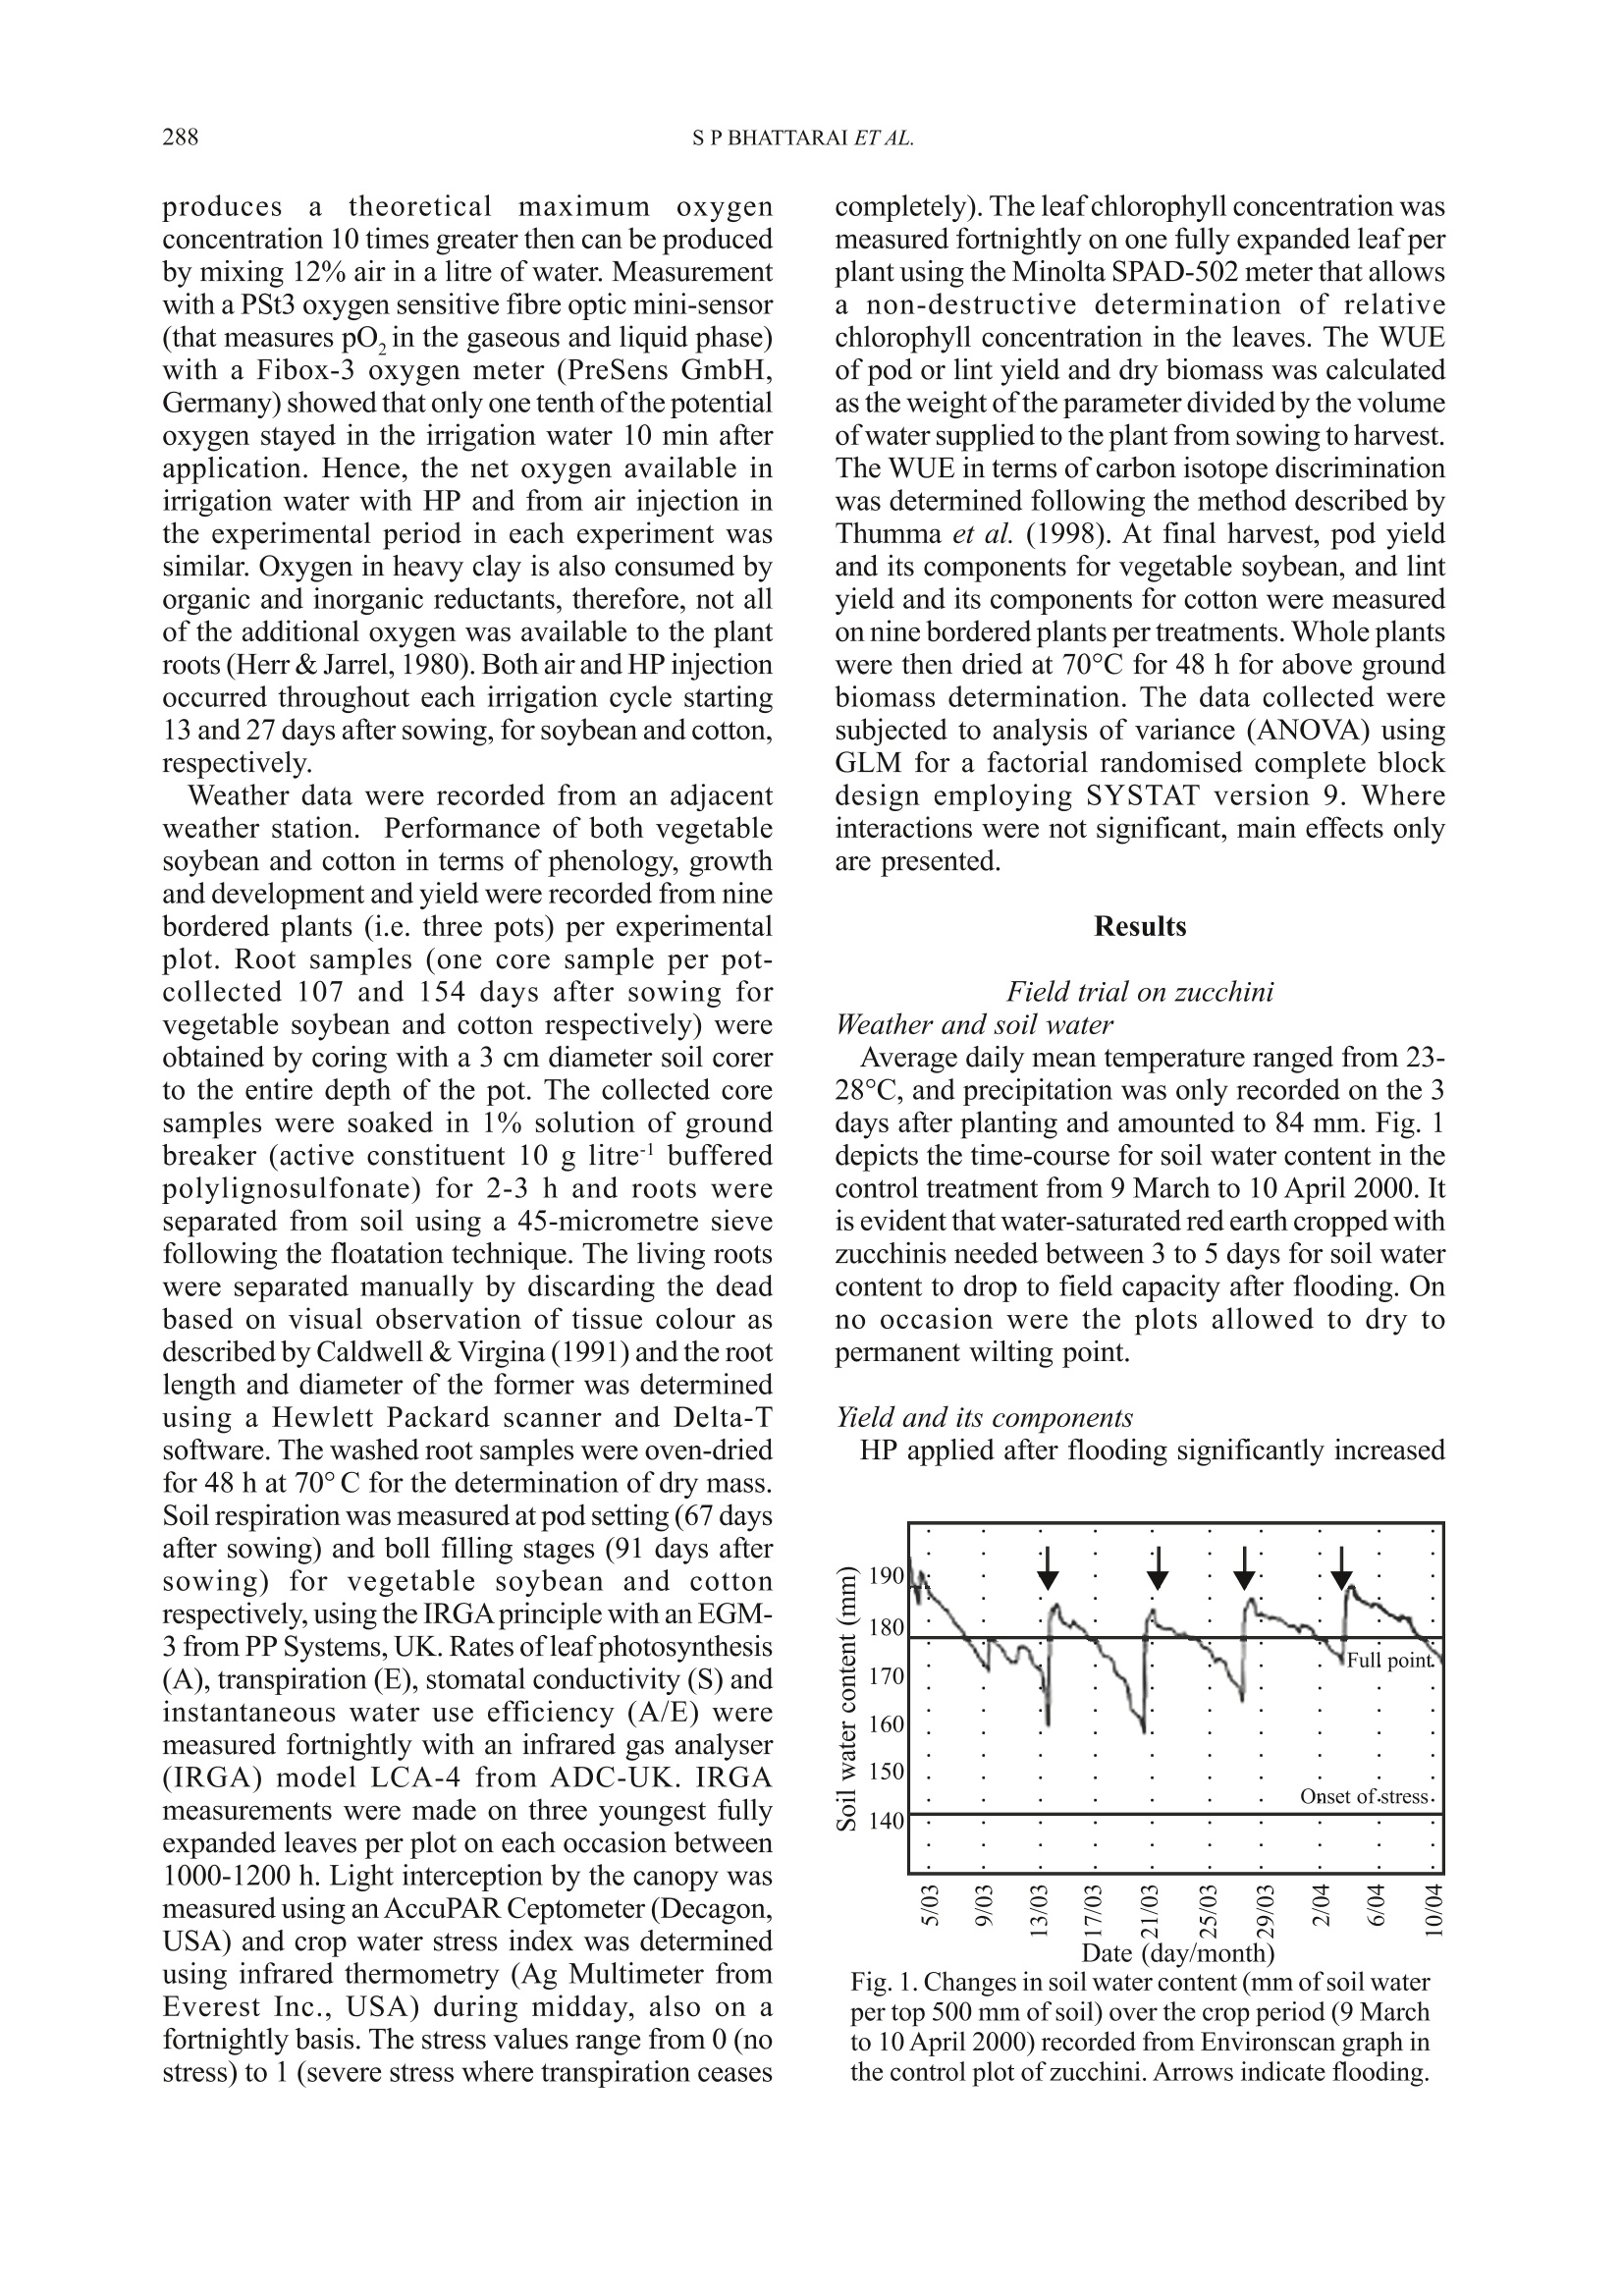
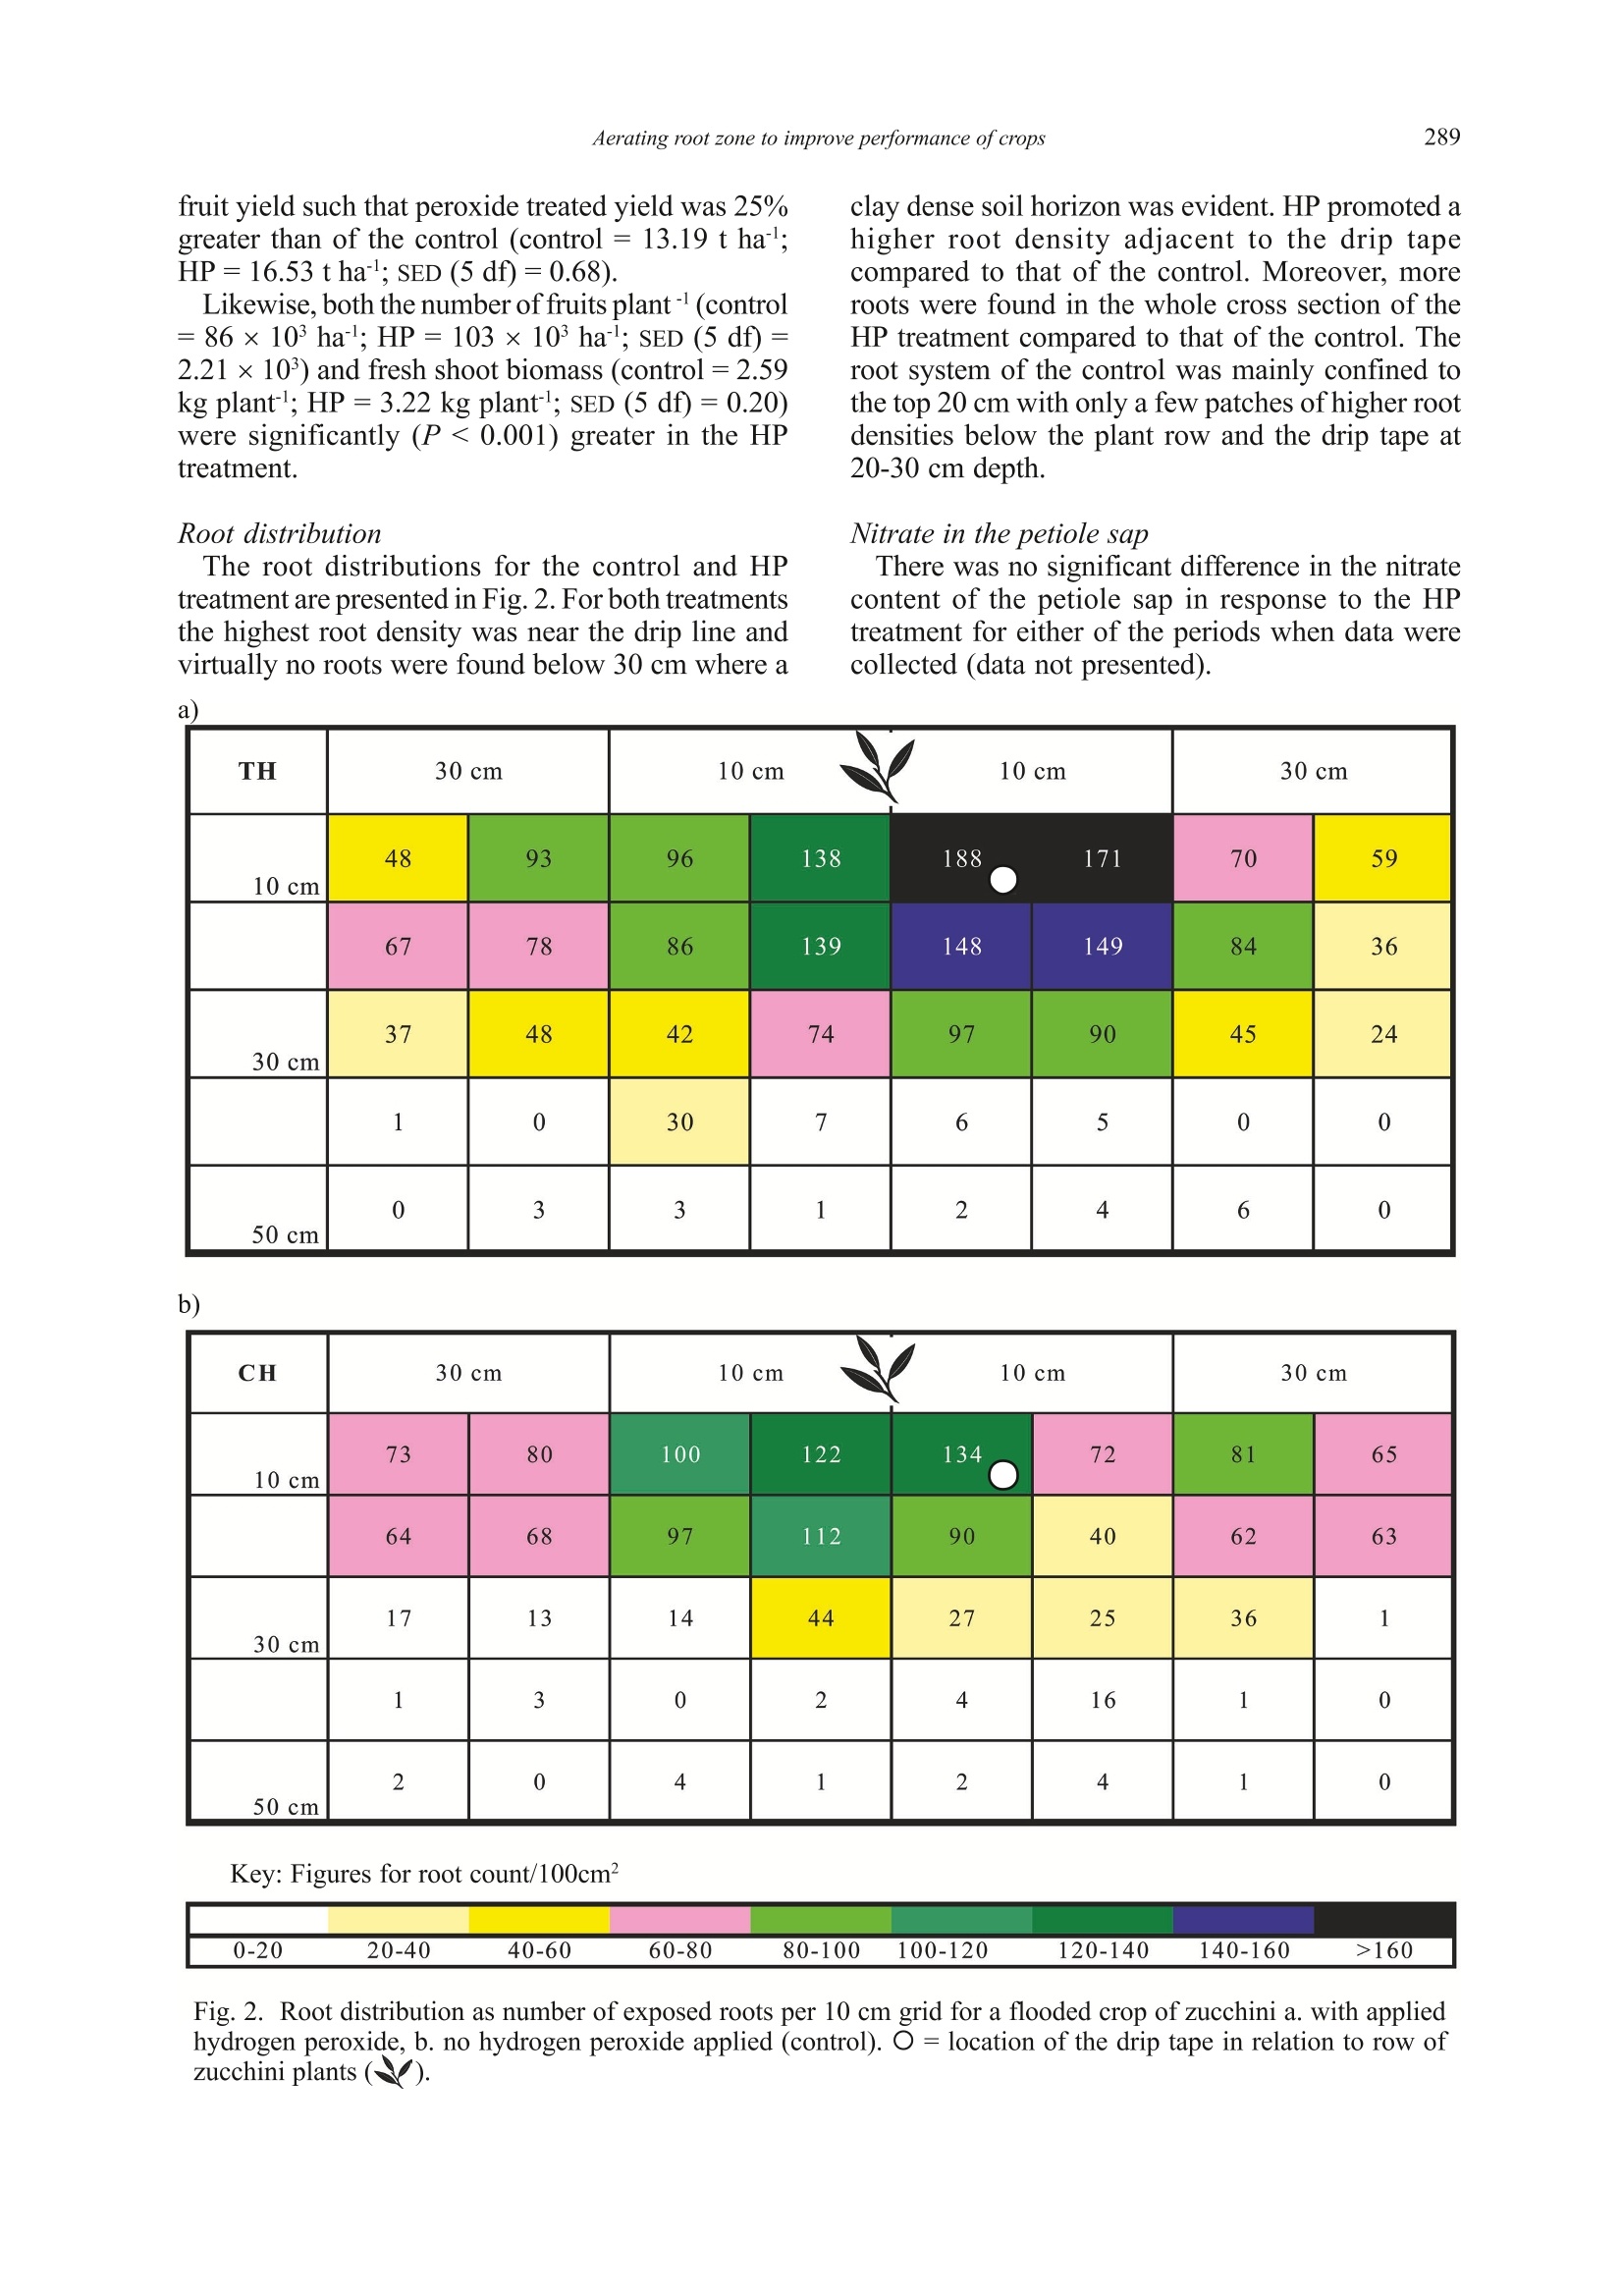
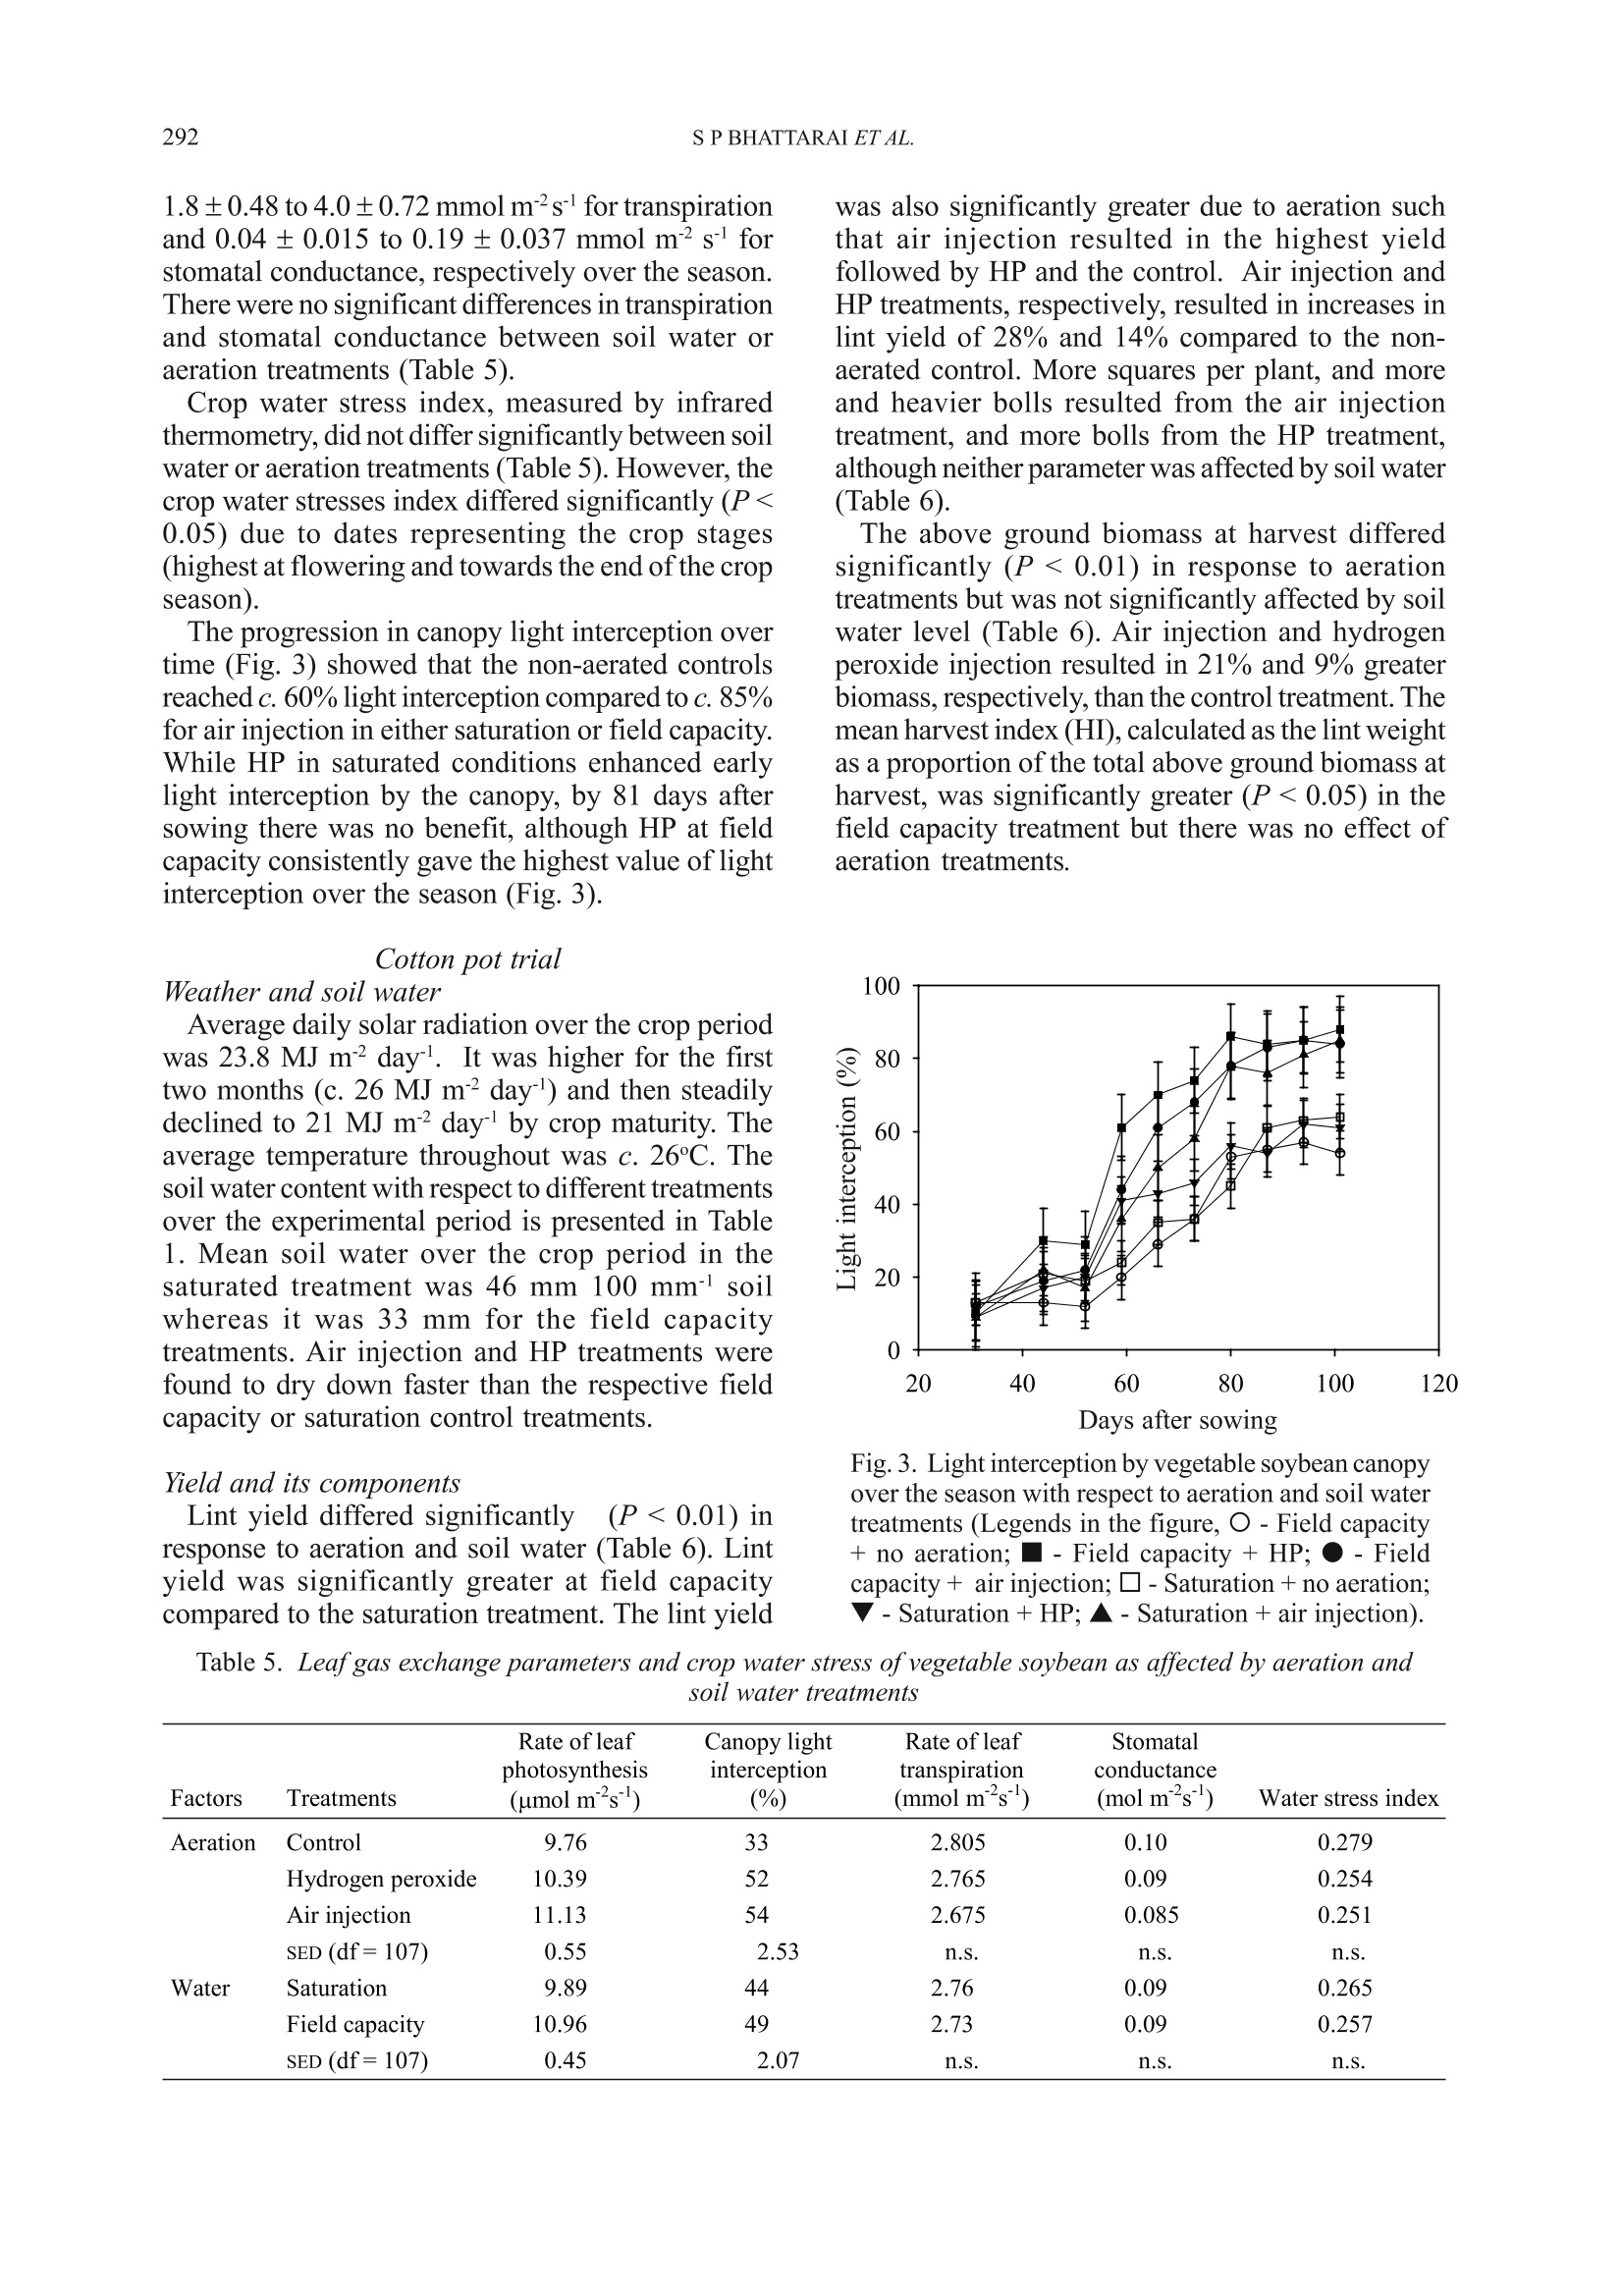
Ann. appl. Biol. (2004), 144:285-298285Printed in UK 286S P BHATTARAI ET AL. *Corresponding Author E-mail: s.bhattarai@cqu.edu.auO 2004 Association of Applied Biologists Aerated subsurface irrigation water gives growth and yield benefits tozucchini, vegetable soybean and cotton in heavy clay soils By S P BHATTARAI*, S HUBER and DAVID J MIDMORE Plant Sciences Group, School of Biological and Environmental Sciences, Central Queensland University,Rockhampton, QLD 4702, Australia (Accepted 4 March 2004; Received 8 December 2003) Summary Inadequate oxygen concentration in the root zone is a constraint to plant performance particularly inheavy, compacted and/or saline soils. Sub-surface drip irrigation (SDI) offers a means of increasingoxygen to plant roots in such soils, provided irrigation water can be hyper-aerated or oxygenated.Hydrogen peroxide (HP) at the rate of 5 litre ha at the end of each irrigation cycle was injectedthrough SDI tape to a field-grown zucchini (courgette) crop (Cucurbita pepo) on a saturated heavyclay soil in Queensland, Australia. Fruit yield, number and shoot weight increased by 25%,29% and24% respecPetCively due to HP treatment compared to the control. Two pot experiments with vegetablesoybean (Glycine max) and cotton (Gossypium hirsutum) compared the effectiveness of HP and airinjection using a MazzeiTM air injector (a venturi), throughout the irrigation cycle in raising crop yieldin a heavy clay soil kept at saturation or just under field capacity. Fresh pod yield of vegetable soybeanincreased by 82-96% in aeration treatments compared with the control. The yield increase was associatedwith more pods per plant and greater mean pod weight. Significantly higher above ground biomassand light interception were evident with aeration, irrespective of soil water treatment. Similarly cottonlint yield increased by 14-28% in aeration treatments compared with the control. The higher lint yieldwas associated with more squares and bolls per plant which accompanied greater above ground biomassand an increase in root mass, root length and soil respiration. Air injection and HP effected greaterwater use, but also brought about an enhancement of water use efficiency (WUE) for pod and lintyield, and increased leaf photosynthetic rate in both species but had no effect on transpiration rate andstomatal conductance per unit leaf area. Aeration-induced enhanced root function was arguablyresponsible for greater fruit set and yield in all three crops, while in vegetable soybean greater canopycover, radiation interception and total vegetative biomass were responsible for additional yield benefit.Increased aeration of the root zone in heavy clay soils employing either air injection or HP provedbeneficial to SDI irrigated crops, irrespective of the soil water conditions, and can add value to growerinvestments in SDI. Key words: Air injection, hydrogen peroxide, subsurface drip irrigation, water use efficiency, soilrespiration, leaf photosynthesis, root mass Introduction For optimal crop growth the above groundatmosphere must supply sufficient quantities of CO,for photosynthesis, and O, for respiration, and muchattention has been placed particularly on the supplyof CO, (Drew & Stolzy, 1996). However, supply ofsufficient quantity of air to the root system hasreceived much less attention, and could openavenues of crop yield improvement, should the levelsof particularly O, be suboptimal within the soil.Respiring plant roots consume large amounts ofoxygen, equivalent to 5 ml O, hgof dry tissue(Grable, 1966) and to this must be added the demandby aerobic soil micro-organisms present in soilswhen calculating soil oxygen requirements (Glinski & Stepniewski, 1985). Continuous exchange of thesoil gas is, therefore, necessary for effectiverhizosphere function. Of major importance is thecomparison of amount of oxygen present in the soilwith potential soil respiration rates. Such acomparison reveals that the oxygen reserve in thesoil is insufficient to sustain the crop and soilrespiration for long term particularly when theoxygen exchange is impeded (Mukhtar et al., 1996).It is estimated that soil pore space in the top one-metre of a soil profile contains a supply of oxygensufficient to meet the respiratory demand of a cropfor about 3-4 days without replenishment (Focht,1992). An effective exchange of gases in the soil,therefore, mustensure adequate oxygenreplenishment and removal of the waste products, if respiratory processes are to be sustained. Lack of oxygen commonly prevails in heavy claysoils and thosecompacted, saturated or with impededsubsurface drainage (Letley, 1961). The importanceof aeration on the functioning of higher plants andeffects of limited aeration (Grable, 1966;Armstrong,1979; Blokhina et al., 2003) and anaerobiosis andits consequences are well studied (Vartapetian &Jackson, 1997; Visser et al., 2003). In spite of theseknown impacts of poor aeration on the root and soilfunction, practical options for soil aeration suitablefor large acreages are not readily available. Lack of soil oxygen directly affects root growth.Root growth is sensitive to O, deficiency, whichreduces root elongation in many species (Aguilar etal., 2003). Reduced oxygen in the rhizosphere leadsto a root system incapable of sustaining water andnutrient requirements. Threshold oxygenconcentration at which root extension begins todecrease is commonly about half that in air (Huanget al., 1994). Root oxygen supply also plays a crucialrole in shoot growth. Increased oxygen enhances Kand P uptake (Letley, 1961). In practice, in the field continuous or episodicevents of deficit aeration can prevail. The intensity,however, differs with the soil type and method ofirrigation. Meek et al. (1983) reported a drop ofO,concentration at 20 cm depth from an optimum of0.206 litre litre-to 0.03-0.06 litre litreon a tomatocrop with daily trickle irrigation equivalent to100-120% of pan evaporation compared with 0.06-0.15litre litre for a crop irrigated weekly with trickle ina clay soil. Such a depression of oxygen in the rootzone may limit the performance of SDI crops. Yieldreduction of many major crops grown in heavy claysoils, particularly in the wet season, has been partlyattributed to depletion of oxygen in the root zone.In the irrigated wheat and cotton areas of southeastAustralia, warm temperatures in spring and summer,combined with poor soil drainage on heavy soils,cause yield reductions as a result of O, depletionduring and following each irrigation (Meyer et al.,1985; Baruch, 1994). In undisturbed monoliths ofclay loam sown with wheat, soil oxygen virtuallydisappeared at depths between 12.5 and 85 cm within24 h of an irrigation event, with a gradual return ofthe surface horizon to normal concentration (0.206litre litre-) over the next 10-15 days (Meyer et al.,1985). Very low oxygen fluxes were determined insoil cores extracted from such soils in the fieldfollowing furrow irrigation (Hodgson & MacLeod,1998). As water becomes increasingly scarce forirrigation, SDI offers significant increases in WUEover traditional irrigation (eg. cotton (Bhattarai etal., 2003), soybean and wheat (Camp, 1998) andother crops (Ayars et al., 1999)). However, yieldstend to be similar between irrigation systems. While the benefits of soil aeration have long beenrecognised at the experimental (Berry & Norris,1949) and theoretical levels (Bathke et al., 1992;Bryce et al., 1982;Huang et al., 1994), applicationof these findings to field scale has been limited dueto lack of suitable delivery technologies. Recently,some research has shown that aeration may beeffected through SDI, using venturi (Goorahoo etal.,2001) or HP (Huber,2000). We compared theperformance of these systems with a non-aeratedcontrol under flooded. saturated and near-fieldcapacity soil conditions and quantified the effectsof aeration on performance of crop root and aboveground shoot production as well as somephysiological parameters. Results consistently showthe benefits of aeration under both saturation andfield capacity in a number of crops. Materials and Methods Experiments were carried out in the field andscreen-house on three crops, zucchini (Cucurbitapepo L.), vegetable soybean (Glycine max (L.)Merrill) and cotton (Gossypium hirsutum L.). Field site, crop details, treatments and datacollection The field experiment was carried out at Crop Techfield facilities; ((llatatitude: 24° 47’21.3”S andlongitude: 152°24'55.1”E) near Bundaberg inQueensland, Australia. Weather data were collectedfrom an adjacent weather station. Cucurbita pepocv. Blackjack (which is hereafter referred to aszucchini) was planted on 15 February 2000 at 1.5 m×0.5 m spacing in a red earth which is referred to asRed Kandosol according to the Australian soilclassification (Isbell, 1996). The zucchini plots were1.5 m wide ×13 m long. The 1.5 m wide beds werelaid down with T-Tape 508 drip tape, (20 cm emitterspacing,500 litre per 100 m per hour discharge rate),buried at 8 cm depth. Soil water was monitored withtwo EnvironScan capacitance sensors (Sentek Ltd)installed at 10, 20, 30 and 50 cm depth in each ofthe two treatments. Irrigation was scheduled whensoil water volume reached 70% of field capacity inthe top 50 cm soil profile. Fertiliser requirement ofthe crop was provided as fertigation. Based uponthe leaf petiole analysis a total of 90.6:86.7:80:7kgha’ofN:P,O,:K,O respectively was applied to allplots. The experiment was a completely randomisedblock design, replicated six times with twotreatments, irrigation with 5 litre haof 50% HPaqueous solution (Du Pont Peroxide Limited,Morrisville, NZ) or without HP injection. Twotreatments were imposed on the crop 28 days afterplanting following an 18-h period of simulatedrainfall and flooding by way of overhead sprinklers over the whole experimental area. The field wasvisually flooded at that time. The simulated floodingand treatment cycles were continued on a weeklybasis for four weeks. HP was injected for 25 minsafter each cycle of flooding. The number and weight of fruits were recordedover a 3-wk period (started on 20 March 2000), andshoot fresh weight and root distribution in the soilprofile were quantified at the end of the fruitingperiod on 11 April 2000,i.e. 56 days after planting.Yield and biomass were recorded on 24 and sixbordered plants per plot, respectively, and rootdistribution was quantified for one plant pertreatment. The cut face of a pit directly beneath thecrown of a plant was washed with water to remove1 cm of soil, exposing roots that were then countedwithin a 10 cm ×10 cm grid pattern. Sap nitrogenconcentration was analysed for 20 petioles ofyoungest fully expanded leaves per treatment on twoseparate occasions, on each occasion both beforeand after flooding. The data were analysed with thegeneral statistical package SAS version 6.12 usingthe Student’s t-test and one-way analysis of variance(proc glm). Pot trial details, treatments and data collectionTwo pot trials were conducted. The first onvegetable soybean (Glycine max cv. C784-1-2-1from CSIRO) was planted in the screen-house (67%of full sunlight) on 12 July 2002 at the CentralQueensland University (CQU) RockhamptonCampus (latitude: 23°22’0.345”S and longitude:150°31'0.53”E). The second on cotton (Gossypiumhirsutum variety Sicot 289i TM Inguard fromMonsanto seed company) was planted on 2November 2002 at CQU in the open. Bothexperiments were set up using a heavy cracking claysoil which is referred to as a Vertosol according tothe Australian soil classification (Isbell, 1996). Fieldcapacity was determined for the soil according tothe procedures described by Brady & Weil (1999),and the permanent wilting points for the soil weredetermined as the soil water content at which plantsunderwent permanent wilting, for each crop speciesseparately, also according to Brady & Weil (1999).Field capacity for the soil was 43 mm 100 mm soiland permanent wilting point was 20 and 22 mm 100mmsoil for cotton and soybean respectively. Thesealed pots (25 cm diameter x 45 cm height) forboth experiments were filled each with 26 kg soilwith bulk density maintained at 1.3 g cm’in orderto ensure uniform soil porosity and aeration beforeimposition of the treatments. All containers werefitted with Netafim pot drippers placed at 25-30 cmbelow the soil surface. The dripper delivery was 1litre hand was operated under the pressure of 62-76 KPa (9-11 Psi) at the return to the water pump.The use of pot drippers was to mimic the SDI system in heavy clay soil in the field. Soybean in the screen-house was planted at 60 cm between and 10 cmwithin row spacing whereas cotton was planted at 1m between and 10 cm within rows; both spacingsreflected those of field-grown crops. All thetreatments had five containers accommodating 15plants per experimental plot. The amount of waterdelivered to each experimental plot within eachexperiment was recorded. Soil water was measureddaily in one pot per experimental plot using acalibrated Micro Gopher system (Soil MoistureTechnology Pty Ltd, Australia) the probe of whichconsists of a capacitance sensor. The fertiliserrequirement of the crop was supplied throughfertigation using a general-purpose water-solublefertiliser (20:8.7:16.6 NPK and 0.01% B, 0.004%Cu, 0.05% Fe, 0.03% Mn, 0.001% Mo, 0.003% Zn)at the rate of 0.5 g litrecontinuously throughoutthe crop season. To account for different uptake ratesof water between treatments, at times irrigation wasapplied without fertigation to ensure that all plotsreceived the same amount of nutrients. This resultedin application of 37.3 g fertiliser plot for soybeanand 78.3 g plot for cotton. Both experiments were laid out as factorialrandomised complete block designs with fourreplications. Two major factors tested were methodof aeration (three methods of aeration - air injection,hydrogen peroxide and non-aerated control) and soilwater status (two levels of soil water - field capacityand saturation, i.e. soil water maintained between25-40 mm and called field capacity: soil watermaintained between 43-50 mm and called saturation)each experiment, therefore, comprised of 24experimental plots. Air injection was accomplished by mixing air atthe rate of 12% by volume of the irrigation wateremploying Mazzei air injector model 384-X (whichis a pressure differential venturi) coupled in thepressurised irrigation line following methodsdescribed by Goorahoo et al.(2001). The manifoldsin the irrigation lines were fitted with dual flowmeters, pressure gauges and pressure regulators. Theair injection manifold was fitted with a Mazzei(patented) injector gas inlet port, a throttling valveand set up to attach to a rotameter. The air suctionthrough the venturi tube of the Mazzei injector takesplace following Bernoulli's principles [for detail seeAnon.(2003) and Goorahoo et al. (2001)]. For theHP treatment, H,O, (50% v/v) was mixed in theirrigation water at the rate of 1 ml litre ofirrigationwater. The control irrigation plot simply receivedwater mixed with fertiliser. Normally irrigation watercontains oxygen concentration at 3-8 mg litrewhereas the aerated water with air injection (12%by volume of air) reached a concentration of as highas 42 mg litre. The mixture of HP in pure waterunder controlled conditions at the rate of 1 ml litre produces atheoreticalnmaximumoxygenconcentration 10 times greater then can be producedby mixing 12% air in a litre of water. Measurementwith a PSt3 oxygen sensitive fibre optic mini-sensor(that measures pO, in the gaseous and liquid phase)with a Fibox-3 oxygen meter (PreSens GmbH,Germany) showed that only one tenth of the potentialoxygen stayed in the irrigation water 10 min afterapplication. Hence, the net oxygen available inirrigation water with HP and from air injection inthe experimental period in each experiment wassimilar. Oxygen in heavy clay is also consumed byorganic and inorganic reductants, therefore, not allof the additional oxygen was available to the plantroots (Herr & Jarrel, 1980). Both air and HP injectionoccurred throughout each irrigation cycle starting13 and 27 days after sowing, for soybean and cotton,respectively. Weather data were recorded from an adjacentweather station. Performance of both vegetablesoybean and cotton in terms of phenology, growthand development and yield were recorded from ninebordered plants (i.e. three pots) per experimentalplot. Root samples (one core sample per pot-collected 107 and 154 days after sowing forvegetable soybean and cotton respectively) wereobtained by coring with a3 cm diameter soil corerto the entire depth of the pot. The collected coresamples were soaked in 1% solution of groundbreaker (active constituent 10 g litrel bufferedpolylignosulfonate) for 2-3 h and roots wereseparated from soil using a 45-micrometre sievefollowing the floatation technique. The living rootswere separated manually by discarding the deadbased on visual observation of tissue colour asdescribed by Caldwell & Virgina (1991) and the rootlength and diameter of the former was determinedusing a Hewlett Packard scanner and Delta-Tsoftware. The washed root samples were oven-driedfor 48 h at 70°C for the determination of dry mass.Soil respiration was measured at pod setting (67 daysafter sowing) and boll filling stages (91 days aftersowing) for vegetable soybean and cottonrespectively, using the IRGA principle with an EGM-3 from PP Systems, UK. Rates of leaf photosynthesis(A), transpiration (E), stomatal conductivity (S) andinstantaneous water use efficiency (A/E) weremeasured fortnightly with an infrared gas analyser(IRGA) model LCA-4 from ADC-UK. IRGAmeasurements were made on three youngest fullyexpanded leaves per plot on each occasion between1000-1200 h. Light interception by the canopy wasmeasured using an AccuPAR Ceptometer (Decagon,USA) and crop water stress index was determinedusing infrared thermometry (Ag Multimeter fromEverest Inc., USA) during midday, also on afortnightly basis. The stress values range from 0 (nostress) to 1 (severe stress where transpiration ceases completely). The leaf chlorophyll concentration wasmeasured fortnightly on one fully expanded leaf perplant using the Minolta SPAD-502 meter that allowsa non-destructive determination of relativechlorophyll concentration in the leaves. The WUEof pod or lint yield and dry biomass was calculatedas the weight ofthe parameter divided by the volumeof water supplied to the plant from sowing to harvest.The WUE in terms of carbon isotope discriminationwas determined following the method described byThumma et al. (1998). At final harvest, pod yieldand its components for vegetable soybean, and lintyield and its components for cotton were measuredon nine bordered plants per treatments. Whole plantswere then dried at 70C for 48 h for above groundbiomass determination. The data collected weresubjected to analysis of variance (ANOVA) usingGLM for a factorial randomised complete blockdesign employing SYSTAT version 9. Whereinteractions were not significant, main effects onlyare presented. Results Field trial on zucchini Weather and soil water Average daily mean temperature ranged from 23-28℃, and precipitation was only recorded on the 3days after planting and amounted to 84 mm. Fig. 1depicts the time-course for soil water content in thecontrol treatment from 9 March to 10 April 2000. Itis evident that water-saturated red earth cropped withzucchinis needed between 3 to 5 days for soil watercontent to drop to field capacity after flooding. Onno occasion were the plots allowed to dry to.permanent wilting point. Yield and its components HP applied after flooding significantly increased Fig. 1. Changes in soil water content (mm of soil waterper top 500 mm of soil) over the crop period (9 Marchto 10 April 2000) recorded from Environscan graph inthe control plot of zucchini. Arrows indicate flooding fruit yield such that peroxide treated yield was 25%greater than of the control (control=13.19 t ha; HP= 16.53 tha; SED (5 df)=0.68).Likewise,both the number of fruits plant(control=86×10ha; HP=103×10ha ; SED (5 df)=2.21×10)and fresh shoot biomass (control=2.59kg plant; HP=3.22 kg plant; SED (5 df)=0.20)were significantly (P <0.001) greater in the HPtreatment. Root distribution The root distributions for the control and HPtreatment are presented in Fig. 2. For both treatmentsthe highest root density was near the drip line andvirtually no roots were found below 30 cm where a clay dense soil horizon was evident. HP promoted ahigher root density adjacent to the drip tapecompared to that of the control. Moreover, moreroots were found in the whole cross section of theHP treatment compared to that of the control. Theroot system of the control was mainly confined tothe top 20 cm with only a few patches of higher rootdensities below the plant row and the drip tape at20-30 cm depth. Nitrate in the petiole sap There was no significant difference in the nitratecontent of the petiole sap in response to the HPtreatment for either of the periods when data werecollected (data not presented). a) TH 30 cm 10 cm 10 cm 30 cm 10 cm 48 93 96 138 188 171 70 59 67 78 86 139 148 149 84 36 30 cm 37 48 42 74 97 90 45 24 1 0 30 7 6 5 0 0 50cm 0 3 3 1 2 4 6 0 b) CH 30 cm 10 cm 10cm 30cm 10cm 73 80 100 122 134 72 81 65 64 68 97 112 90 40 62 63 30 cm 17 13 14 44 27 25 36 1 1 3 0 2 4 16 1 0 50cm 2 0 4 1 2 4 1 0 Key: Figures for root count/100cm² 0-20 20-40 40-60 60-80 80-100 100-120 120-140 140-160 >160 Fig. 2. Root distribution as number of exposed roots per 10 cm grid for a flooded crop of zucchini a. with appliedhydrogen peroxide, b. no hydrogen peroxide applied (control). O=location of the drip tape in relation to row ofzucchini plants(). Vegetable soybean pot trial Weather and soil water The daily mean ambient temperature ranged from13-27°C representing a gradual increase intemperature over the crop period. Likewise, therewas also a gradual increase in incident solar radiationwithin the screen-house from 9 to 18 MJ m²dayover the crop period with the daily average of 12.3MJ m² day and there were a few occasions wheredaily average incident light level fell to 3 MJ m²day.Soil water content for the different treatmentsin the experiment is presented in Table 1. The soilwater in the field capacity plots was well above therefill point (23 mm) throughout the experimentalperiod whereas the water level in the saturatedtreatment was well above 42 mm for the crop period(Table 1). The soil water content was consistentlylower, due to greater removal of water by plants, inthe HP and air injection plots compared to therespective control in each irrigation treatment. Yield and its components There were no significant interactions betweentreatments for pod yield and its components, hence,main effects only are presented. The fresh pod yieldwas significantly (P<0.05) depressed by thesaturation treatment compared to the field capacitytreatment (Table 2). The pod yield with air injectionand HP injection was significantly (P<0.05) greaterthan that of the control. However, the difference inpod yield between the two aeration methods wasnot significant. The greater yield under aeration, and the loweryield under saturation, was matched by similartreatment effects on the number of pods per plantand above ground biomass. Data on number of pods per kg of pod weight, ameasure of pod quality given that larger and,therefore, fewer pods per kg represent higher qualityproduct, showed that aeration enhanced andsaturation reduced quality. In contrast, the fresh 100-shelled seed weight did not differ significantlybetween aeration treatments and their control.However, saturation significantly (P <0.001)reduced 100 seed weight (Table 2). Differences inharvest index were not significant betweentreatments (Table 2). Root properties and soil respiration Root dry mass (g plant) and lateral root length(m plant) were least in the control (Table 3), andfavoured more by HP at field capacityT a+nd by airinjection under saturated conditions. Lateral rootdiameter varied from 0.26 to 0.29 mm and did notdiffer between treatments (data not presented).Likewise, the root: shoot ratio did not significantlydiffer between treatments and overall averaged 0.174±0.051. Soil respiration, which included soil microbial androot respiration, differed significantly (P <0.05)between aeration, but not between soil watertreatments (Table 4). The rate of soil respiration inthe air injection treatment (1.01 g CO,mh) wassignificantly greater compared to that of the HPtreatment (0.68 g CO,m²hl) and the control (0.45g CO, m²h, SED (15 df)=0.140). The differencebetween HP and the control was close to beingsignificant. Soil respiration did not differ betweensoil water treatments. Plant water use and water use efficiency(WUE)parameters Aeration treatments led to an increase in wateruse over that of the control (Table 3). While HPresulted in greater water use at field capacity than atsaturation, the reverse was so for air injection. Fresh pod yield WUE differed significantly dueto aeration (P <0.05) and soil water (P <0.05)treatments (Table 4). The WUE for air injection andHP treatments surpassed the control by 70% and54%, respectively. A higher WUE was evident atfield capacity compared to the saturation treatment. The dry biomass WUE was significantly (P<0.05)greater by 31% at field capacity than saturation, butthe response to aeration was not significant althoughit was in line with that of pod WUE (data notpresented). Ameasure of instantaneous WUE was gained byuse of the instantaneous measures of rates of netphotosynthesis and transpiration. The instantaneousWUE differed significantly (P <0.05) only inresponse to aeration (Table 4). The instantaneousWUE was significantly higher for air injection andHP, by 20% and 12% respectively, compared to thecontrol. The WUE was also quantified employingthe technique of carbon isotope discrimination butno significant difference between the treatments wasevident. Leaf gas exchange parameters, leaf chlorophyll,crop water stress index and canopy light interception Leaf photosynthesis differed significantly due todates (P<0.001), aeration (P<0.05) and soil water(P<0.05). Air injection led to a significantly highermean rate of photosynthesis compared to the controlbut the HP did not (Table 5). Leaf photosynthesiswas greater by 10% at field capacity compared tothe saturation treatment (Table 5). Likewise leafchlorophyll concentration was significantly greaterat field capacity than saturated conditions (38 vs 35,SED (18 df)=0.78) in the non-aerated control,whereas it was equally high in the HP and airinjection treatments (38), in either field capacity orsaturated conditions (Table 3). The transpiration rate and stomatal conductancediffered only due to stage of growth, increasing from Table 1. Soil water content (mm 100 mm soil) in different treatments for vegetable soybean (July-October; 2002)and cotton (November 2002-March 2003) at Rockhampton, Australia (mean, standard error and range calculatedfrom regular observations over the crop season) Vegetable soybean Cotton Soil water Aeration Mean Range Mean Range Field capacity Air injection 32±2.6 26-37 32±3.1 25-37 Control 33±2.8 27-39 33±3.5 27-39 Hydrogen peroxide 30±2.3 26-36 30±3.2 25-36 Air injection 46±1.9 41-49 45±1.9 40-49 Saturation Control 47±1.4 42-49 47±1.5 43-49 Hydrogen peroxide 45±0.8 43-47 45±1.2 42-47 Table 2. Pod yield and its components and above ground dry biomass of vegetable soybean as affected byaeration and soil water treatments Pod yield Pods No. of pods Fresh weight of Aerial biomass Factors Treatments (gm) plant kg 100 seeds (g) (g m ) Harvest Index Aeration Control 429.2 19.2 500 50 301.1 0.60 Hydrogen peroxide 779.3 25.1 452 52 549.2 0.63 Air injection 842.5 27.3 436 54 568.4 0.66 Water SED (df=15) 150.8 3.1 19.9 n.s. 96.1 n.s. Saturation 523.2 20.7 497 47 378.1 0.59 Field capacity 844.4 27.3 428 57 567.7 0.66 "SED (df=15) 123.1 n.s. 16.2 2.7 78.4 n.s. SED =Standard error of the difference between two means Table 3. Root properties, water use and chlorophyll concentration ofvegetable soybean as affected by aerationand soil water treatments Chlorophyll Root weight Root length Water use plant concentration Soil water Aeration (gm)* (km m)* (litre) (SPAD unit) Field capacity Control 33.0 4.42 9.36 39 Hydrogen peroxide 139.7 19.18 15.78 37 Air injection 73.3 7.09 13.28 38 Saturation Control 45.0 3.74 10.56 31 Hydrogen peroxide 70.3 6.29 11.89 38 Air injection 133.7 13.39 14.89 35 SED between any two means (15 df) 27.8 4.67 0.12 0.87 *Based upon within and between pot spacing Table 4. Soil respiration, water use efficiency and radiation use efficiency for vegetable soybean as affected byaeration and soil water treatments Soil respira2tion1 (g CO2 mh) WUE of pod Instantaneous Carbon Radiation use Factors Treatments yield (g litre) WUE (A/E)' discrimination (△ %o) efficiency (g MJ) Aeration Control 0.45 2.15 4.03 19.53 1.03 Hydrogen peroxide 0.68 3.32 4.50 19.49 1.39 Air injection 1.01 3.65 4.85 19.63 1.41 Water SED (df=15) 0.14 0.61 0.24 n.s. 0.12 Saturation 0.79 2.51 4.35 19.74 1.06 Field capacity 0.69 3.52 4.58 19.35 1.49 SED (df=15) n.s. 0.49 n.s. n.s. 0.17 A/E= umol CO, m²s/mmol H,0 m’s ’g above ground biomass / MJ intercepted radiation 1.8±0.48 to 4.0±0.72 mmol m²s for transpirationand 0.04±0.015 to 0.19±0.037 mmol ms forstomatal conductance, respectively over the season.There were no significant differences in transpirationand stomatal conductance between soil water oraeration treatments (Table 5). Crop water stress index, measured by infraredthermometry, did not differ significantly between soilwater or aeration treatments (Table 5). However, thecrop water stresses index differed significantly (P<0.05) due to dates representing the crop stages(highest at flowering and towards the end of the cropseason). The progression in canopy light interception overtime (Fig. 3) showed that the non-aerated controlsreached c. 60%light interception compared to c. 85%for air injection in either saturation or field capacity.While HP in saturated conditions enhanced earlylight interception by the canopy, by 81 days aftersowing there was no benefit, although HP at fieldcapacity consistently gave the highest value of lightinterception over the season (Fig.3). Cotton pot trial Weather and soil water Average daily solar radiation over the crop periodwas 23.8 MJ m² day. It was higher for the firsttwo months (c. 26 MJ m² day) and then steadilydeclined to 21 MJ m²day- by crop maturity. Theaverage temperature throughout was c.26℃. Thesoil water content with respect to different treatmentsover the experimental period is presented in Table1. Mean soil water over the crop period in thesaturated treatment was 46 mm 100 mm soilwhereas it was 33 mm for the field capacitytreatments. Air injection and HP treatments werefound to dry down faster than the respective fieldcapacity or saturation control treatments. Yield and its components Lint yield differed significantlyy(P<0.01) inresponse to aeration and soil water (Table 6). Lintyield was significantly greater at field capacitycompared to the saturation treatment. The lint yield was also significantly greater due to aeration suchthat air injection resulted in the highest yieldfollowed by HP and the control. Air injection andHP treatments, respectively, resulted in increases inlint yield of 28% and 14% compared to the non-aerated control. More squares per plant, and moreand heavier bolls resulted from the air injectiontreatment, and more bolls from the HP treatment,although neither parameter was affected by soil water(Table 6). The above ground biomass at harvest differedsignificantly (P <0.01) in response to aerationtreatments but was not significantly affected by soilwater level (Table 6). Air injection and hydrogenperoxide injection resulted in 21% and 9% greaterbiomass, respectively, than the control treatment. Themean harvest index (HI), calculated as the lint weightas a proportion of the total above ground biomass atharvest, was significantly greater (P<0.05) in thefield capacity treatment but there was no effect ofaeration treatments Fig. 3. Light interception by vegetable soybean canopyover the season with respect to aeration and soil watertreatments (Legends in the figure, O-Field capacity+ no aeration; ■-Field capacity + HP;●-Fieldcapacity+ air injection; -Saturation+no aeration;V-Saturation+HP; ▲-Saturation + air injection). Table 5. Leaf gas exchange parameters and crop water stress of vegetable soybean as affected by aeration andsoil water treatments Rate of leaf Canopy light Rate of leaf Stomatal photosynthesis interception transpiration conductance Factors Treatments (umol ms ) (%) (mmolms) (molm"s) Water stress index Aeration Control 9.76 2.805 0.10 0.279 Hydrogen peroxide 10.39 2.765 0.09 0.254 Air injection 11.13 54 2.675 0.085 0.251 SED (df=107) 0.55 2.53 n.s. n.s. n.s. Water Saturation 9.89 44 2.76 0.09 0.265 Field capacity 10.96 49 2.73 0.09 0.257 SED (df=107) 0.45 2.07 n.s. n.s. n.s. Table 6. Cotton lint yield and some attributes as affected by aeration and soil water treatments Lint yield Squares Bolls Weight Aerial biomass Factors Treatments (g m) plant plant boll((g) (gm) Harvest Index Aeration Control 136.8 20.7 9.1 4.70 661.4 0.21 Hydrogen peroxide 155.4 26.2 9.5 4.95 723.8 0.21 Air injection 175.0 27.5 10.9 5.05 802.8 0.21 Water SED (df=15) 9.68 1.03 0.66 0.66 41.3 n.s. Saturation 144.2 24.4 9.5 4.83 699.3 0.21 Field capacity 167.3 25.1 10.2 4.97 759.3 0.22 SED (df=15) 7.90 n.s. n.s. n.s. n.s. 0.01 Table 7. Root properties and total soil respiration ofcotton as affected by aeration and soil water treatments Root weight Root length Root diameter Soil respiration Factors Treatments (gm)* (km m) (mm) [g CO2](mh) Aeration Control 77.3 8.04 0.153 0.54 Hydrogen peroxide 83.4 9.88 0.148 1.14 Air injection 87.3 10.32 0.149 1.53 SED (df=15) n.S. n.s. n.s. 0.31 Water Saturation 76.2 10.23 0.132 1.14 Field capacity 89.1 8.60 0.168 0.99 sED (df=15) n.s. n.s. 0.012 n.s. * Dry weight including both tap root and laterals root combined together. Root sampled at 100 percent boll opening Table 8. Water use, water use efficiency and radiation use efficiency in cotton as affected by aeration and soilwater treatments Water use WUE for Instantaneous Carbon Radiation use plant WUE for lint biomass WUE discrimination efficiencv Factors Treatments (litre) (g litre) (g litre) (A/E) (A%o) (g MJ) Aeration Control 37.66 0.38 1.725 3.02 20.38 1.35 Hydrogen peroxide 38.24 0.41 1.894 3.42 20.45 1.35 Air injection 38.11 0.45 2.408 3.95 20.25 1.38 SED (df=15) 0.07 0.027 0.13 n.s. n.s n.s. Water Saturation 37.80 0.38 1.85 3.03 20.33 1.41 Field capacity 38.20 0.44 1.99 3.78 20.38 1.31 SED (df=15) 0.07 0.022 n.s. 0.33 n.s n.s. 'A/E= umol CO, m²s/mmol H,0 m²s ’g aboveground biomass/ MJ intercepted radiation Table 9. Leaf gas exchange parameters, seasonal average canopy light interception, leaf chlorophyllconcentration and crop water stress of cotton as affected by aeration and soil water treatments Rate of leaf Rate of leaf Stomatal Canopy light Chlorophyll photosynthesis transpiration conductance interception concentration Water stress Factors Treatments (umol m"s ) (mmol m²s) (mol ms-l) (%) (SPAD unit) index Aeration Control 10.61 3.91 0.12 74 41 0.37 Hydrogen peroxide 11.20 3.74 0.11 79 40 0.31 Air injection 12.49 3.73 0.11 78 41 0.33 Water SED (df=69) 0.68 n.s. n.s. n.s. 0.42 n.s. Saturation 10.82 3.84 0.11 77 40 0.33 Field capacity 11.97 3.74 0.11 77 41 0.35 SED (df=69) 0.55 n.s. n.s. n.s. 0.34 n.s. Root properties and soil respiration Root dry weight and lateral root length per plantdid not differ significantly due to aeration or soilwater (Table 7). However, the lateral root diameterwas greater for the field capacity compared to thesaturation treatment. An analysis of the root: shootratio indicated no significant effects of aeration orsoil water; the overall mean and sE was 0.113 ±0.047. Soil respiration was markedly higher in the aerationtreatments than in the control but did not differbetween soil water treatments. The rate of soilrespiration was in the order of 183% and 111%higher for air injection and HP, respectively,compared to the control (Table 7). Plant water use and water use efficiency parametersWhile plants at field capacity used significantlymore water than did those in the saturation treatment(Table 8), as did the aerated compared to the control,the interaction was also statistically significant, butin absolute terms the difference between treatmentswas very small. The lint yield WUE differed significantly betweenthe soil water levels; WUE was greater in the fieldcapacity compared to the saturation treatment (Table8). Likewise, the difference between aerationtreatments was also significant; air injectionachieved greatest WUE followed by hydrogenperoxide and the control. Above ground biomass WUE varied significantlybetween aeration treatments, in the same manner asfor WUE of lint yield, but the difference betweensoil water treatments was not significant. Theinstantaneous WUE, the ratio of photosynthesis totranspiration, was also greater (although notsignificantly so) for the aeration treatments andsignificantly so for the field capacity treatment(Table 8). No differences between treatments wereevident based upon the indirect measurement ofWUE using carbon isotope discrimination. Leaf gas exchange parameters, leaf chlorophyll,crop water stress index and canopy light interception Combined1 over datesthe rate of leafphotosynthesis differed significantly due to aerationand soil water (Table 9). The air injection led tosignificantly higher rates of photosynthesis than inthe control. and the latter did not differ from that forHP. The leaf photosynthetic rate was significantlyhigher at field capacity compared to the saturationtreatment. The rate of photosynthesis declined overthe season as follows: pre-flowering (14.33 ±3.82pmol msl), peak flowering (13.27±1.74 umolm²s), boll filling (11.31±4.45 umol m’s-l) andboll open (6.57±1.65 pmol m²s) stages. Whiledifferences between treatments for chlorophyllconcentration were apparently significant,the absolute differences between values were less thanthe precision of the apparatus (±2 SPAD units) andhence are not discussed further. Neither the transpiration rate nor stomatalconductance differed due to aeration or soil watertreatments (Table 9), and differed only marginallyas the crop developed (data not presented). Cropwater stressindex, measured by infraredthermometry, differed significantly with respect togrowth stage (data not presented) but not due toaeration or soil water (Table 9). Canopy light interception increased as the cropgrew until the boll filling stage when it reached 83%although on no occasion did it differ significantlybetween treatments (data not presented). Discussion In all three experiments, aeration through SDI withHP or air injection led to greater yields than non-aerated controls, whether under flooded, saturatedor near-normal soil water conditions. In the field trialwater-saturated Red Earth soil cropped with zucchinineeded about 3 to 5 days to drain and reach fieldcapacity after flooding. This is in accordance withother studies investigating soil water relations indrying soil profiles (Brady & Weil, 1999;Mukhtaretal., 1996; Willson et al., 1985). Soil water contentis the main parameter influencing soil aeration status(Boone et al., 1986), and several studies have shownthat soil water content above or even below fieldcapacity impairs the gas exchange between soil andatmosphere (Meek & Stolzy, 1978). This results inoxygen diffusion rates (ODR) and gas diffusioncoefficients (D/D ) that are detrimental for rootgrowth, such as was shown by Mukhtar et al. (1996)and Stepniewski (1981). An ODR value of 20×10gCO, cm²min’ is generally considered as the lowerthreshold for optimal root growth (Glinski &Stepniewski, 1985). It is likely that the ODR valuecould have dropped below this threshold level inthe zucchini trial particularly in the control plots.The assumption that soil conditions in the currentfield trials were adverse for root growth is supportedby the observation that the more often the plots wereflooded, the more extended became the drainagetime. This suggests that fewer roots were viable inthe last 2 wk of growth to permit adequate wateruptake. Measurements of the root distributionshowed virtually no roots below the A-horizon ineither treatment, and hence no water uptake waspossible from the heavier B-horizon. After thesecond and third flooding events the soil was fullysaturated, even five days after flooding (Fig. 1). It ispossible that reduced root activity due to oxygendeficiency and reduced capillary movement in thesubsurface were also responsible for the successivelylonger drainage period following each flooding events. The application of HP after short-term floodingledto a 25% increase in fruit and shoot fresh weight,and increased fruit number by 19% compared to thenon-aerated control. Many more roots were visiblein the HP treatment than in the control, leading tothe assumption that the supplied oxygen enhancedroot growth (or delayed death of roots) under short-term flooding conditions. Root growth was notbenefitted by the HP treatment below the A-horizon.It is possible that the applied HP was consumed closeto the emitter where roots were concentrated. Withthe application rate of 5 litre ha of HP after theirrigation cycle, each emitter discharged 0.15 ml of50% HP, that potentially releases 48.5 ml of oxygenin the saturated soil over and above that that diffusedto the rhizosphere through the soil or through radialoxygen diffusion from the stem through to the roots.Neither is likely to diffuse down to the A-horizon. Since flowering and fruiting in zucchini wereimproved by HP application, and flowering andfruiting in many cucurbits is regulated by cytokininproduction (Wien, 1997), it may be that HPapplication promoted cytokinin production andtransport. Both are known to be sensitive to oxygendeficiency in the root zone (Jackson, 1992). The option of using HP is, therefore, promisingfrom a yield perspective for aeration of the root zoneunder flooded and therefore oxygen-limitedconditions. Similarly, Bryce et al. (1982) reportedthat growth of tomato flooded was significantlybetter when peroxide was included in the floodingsolution, or the watering solution after flooding, andMelsted et al.(1949) found that even for a soil ofexcellent structure, forced soil aeration (direct airinjection into the rhizosphere) or peroxide treatmentcould improve the growth of corn plants. The samebenefit is evident, based upon our data, when HP isintroduced to the root system via SDI. The costassociated with the required quantity of HP to effectyield benefit in the field was A$ 63 ha. An absenceof information on the effects of HP on soil biologywill likely delay commercial adoption of thispractice. Our data have, however, led to some farmeradoption of HP as a post-flooding treatment toprevent complete crop loss. An alternative, air injection using the venturiprinciple, was compared with HP using SDI in ourtrials with vegetable soybean and cotton. Equivalentamounts of oxygen were introduced into the rootzone by the air injection and HP treatments on ourpot trials. Such uniformity for oxygen wasmaintained by either continuous air injection at therate of 12% by volume of water or continuous HP(50% w/w) at the rate of 1 ml litreof irrigationwater, during irrigation events. Air injection led to yield increases for the two cropspecies in saturated soil and at field capacity, of the same order of magnitude as for HP (Tables 2 and 6).Enhanced performance of the crops in the aeratedtreatments compared to non-aerated controls waslinked to increased root activity as reflected bysignificantly higher rates of soil respiration. Greater root length and root dry matter wereevident for both species (significant only forsoybean) in aerated treatments, and were likelyresponsible for this additional soil respiration. Anincrease in soil respiration in response to increasein aeration of the root system was also reported byStobovoi (2001). In soybean, combined over soilwater treatments, there was a 66 g increase in rootdry weight in aerated treatments at harvest comparedto that of the control. Based upon the value forrespiration of5 mlO,h'g ofdry root (Grable, 1966)and an average seasonal root weight increase overthe non-aerated control of 33 g m, such additionalroot dry weight due to aeration would have requiredan additional 1.625 litre m²of oxygen, assumingthat roots respire at their maximum rate for 10 h perday. With an effective 60-day crop period, a total of97.5 litre of extra O, per square meter would berequired. The supply from HP based upon actualavailability provided 4.8 litre O, and air injectionwith 22.73 litre of air provided 4.77 L O,, over thatperiod. Quite clearly the additional O, was notsufficient to support the complete respiratoryrequirements of the additional roots. This is notsurprising since the additional roots would also availof O, through the normal channels of diffusionthrough the soil following water uptake and/ordrainage, and radial O, diffusion through roots, astakes place even under O, limited conditions (Visseret al.,2000). Hence, HP and air injection would havecontributed to the oxygen requirements of the croprhizosphere in the aerated treatments, but furtherinvestigation is required on the critical quantity, andperhaps timing, of the additional O, supply.Asimilartrend for O, balance was observed in the cottonexperiment with HP and air injection treatments. Oxygen-limited root respiration, leading toreduced adenosine triphosphate (ATP) productionand decreased energy dependent nutrient uptake andtransport of nutrients to the shoot, may lead to areduction ofleaf growth and optimal leaf functioning(Barrett-Lennard, 2003). Above ground growth ofboth vegetable soybean and cotton benefitted fromaeration in our experiments. The repeatedly higherrates of photosynthesis in the aerated treatmentscompared to the non-aerated controls contributed tohigher biomass yield when aerated. A reduction inthe rate of photosynthesis in response to low oxygenlevel in the rhizosphere has been reported previously(Sojka, 1992). For vegetable soybean this may havebeen related to a lower chlorophyll concentration inthe non-aerated control treatments, even though thespecific leaf area (SLA) was greater in the aeration treatment (air injection-285, HP-256 and control-231 cmg, SED (15 df)= 21.2). However,differences in chlorophyll concentration betweenaerated and non-aerated treatments were very smallfor cotton (Table 9), as were differences for SLA(air injection- 162, HP-152 and control -156cm’g, SED (15 df)=17.9). Yield enhancement byaeration was due to increased numbers of flowersand pods for soybean and squares and bolls forcotton. Pods and seeds were also heavier for theaeration treatments in soybean, as were bolls incotton. Possibly cytokinin production as a result ofaeration may have been responsible for this enhancedflowering and fruiting. The greater effect ofaerationon yield of soybean than for cotton probably wasdue to the additional effect that aeration had on lightinterception (Fig. 3) in soybean, however, lightinterception in cotton (Table 9) was not significantlyimproved by aeration. For soybean radiation use efficiency (RUE),expressed as the slope of the relationship betweenabove ground biomass (g) and intercepted solarradiation (MJ), and light interception, were greatestin the air injection treatment followed by HP andleast in the control in either soil water treatment(Tables 4 and 5). The RUE averaged over soil watertreatments was greater by 35% and 37% in HP andair injection treatments respectively compared to thecontrol. For cotton, the RUE did not improveappreciably in response to aeration treatments (Table8). The analysis of cotton leaf samples collected atthe 50% boll filling stage revealed that theconcentration ofnitrogen, phosphorus, potassiumand boron in the dry leaf samples were greater inaerated treatments compared to the control (totalnitrogen %=1.80, 1.79 and 0.81; phosphorus %=0.27, 0.26, 0.35; potassium %=1.11, 0.99 and 0.81;and boron mg litre=152,159 and 134 for airinjection, HP and control respectively). Maintenanceof such a high level of nitrogen, potassium and boronis reported to increase the reproductive performancein terms of greater flowering and fruit set as well asboll filling to produce heavier bolls in cotton (Joham,1986). Analysis of soybean leaf samples collectedat the pod filling stage in general did not show aneffect of aeration (total nitrogen %=3.58, 4.93 and4.34; phosphorus %=0.26, 1.13, 0.56; potassium%=1.74, 1.85 and 1.77; and boron mg litre=53,57 and 54 for air injection, HP and control,respectively). Reference to Table 1 suggests that the saturationtreatment at times led to a drying of the soil to lessthan field capacity (42 mm 100 mmsoil) and thatthe field capacity treatment generally remainedbelow field capacity. The pots in the experimentswere without drainage, therefore, water applied didequate with water used in evapotranspiration. Awater balance calculated for each treatment showed consistency between water consumption based uponwater balance and water usage based upon meteredrates of application (r²= 1.0 (n = 6) for soybean;and for cotton the average water consumption was38.0 litre compared to 38.01 litre applied per plant(Table 8)). Prolonged waterlogging is known to result instomatal closure and cessation of transpiration(Barrett-Lennard,2003) but in neither crop did theunit rate of transpiration nor total water use varybetween saturated soil and field capacity. Likewise,there was no significant effect of aeration ontranspiration nor stomatal conductance. This wasfurther supported by the lack of difference betweenany treatments for the crop water stress index. It. was also surprising that the rate of soil respirationdid not differ between field capacity and saturationin either crop..Total water use in the aerationtreatments for vegetable soybean was greater thanthat by the control due to their greater canopy size(Table 2 and Fig.3), but not for cotton where canopysize did not differ between treatments. Late plantingof cotton in the year (in early November comparedto the normal mid-September) may have beenresponsible for the lack of a significant positive effectof aeration on canopy size (on average a 5% increasein light interception) as high temperature was evidentin the early establishment phase, and may haveconstrained a positive response to aeration. Various indices of water use efficiency werecalculated. From the growers’perspective, yield perunit of water applied is of paramount importance.The greater WUE for the aeration treatments wasdue to higher yields of fresh pods and lint in soybeanand cotton, respectively, and not to reduced wateruse by those treatments (indeed, aeration increasedwater usage), although data on instantaneous WUE(Tables 4 and 8) did suggest that aeration treatmentswere more conservative in water use throughtranspiration of H,O per unit of fixed CO,. It is interesting to note that there were very fewinteractions between soil water conditions andaeration treatments for the variables measuredsuggesting that even under field capacity rootsystems of irrigated plants on heavy clay soils aretemporarily anoxic and respond favourably toaeration. To summarise, aerating the rhizosphere of cotton,soybean and zucchini in a heavy clay soilsignificantly increased yield compared to non-aerated controls, irrespective of soil water contentThe increase in yield was due to greater rates ofphotosynthesis, and more and heavier fruits, podsand bolls in zucchini, vegetable soybean and cottonrespectively. Aeration increased root weight andlength whenever measured and promoted greatertotal soil respiration. Water use efficiency, expressedas the ratio of photosynthesis to transpiration, and of yield to total water use, was greater in aerationtreatments, perhaps as a response to greater rootfunction (higher root biomass, root length and totalrespiration). The research suggests that, provided thesupply ofaerated water can be maintained along longstretches of SDI tape, aeration of root zones in heavyclay soils will significantly improve yield and WUEof vegetable soybean, cotton and zucchini. Acknowledgement This study was funded by Central QueenslandUniversity. The authors are most grateful to A/Professor Kerry Walsh, CQU, for assistance withratio isotope analysis and soil respiration, to JackMcHugh and Gavin Lotz of DNRM, Emerald forcotton seed, to Dr Andrew James, CSIRO,Indooroopilly, for vegetable soybean seed, to JohnHall of Crop Tech (Bundaberg) for field facilitiesfor the zucchini experiment, and to Peter Andersonof Netafim Australia for irrigation accessories. Theauthors are grateful to Ben Kele and to Barry Hoodof PSG, CQU for their support and cooperation atvarious stages of the research. References ( Aguilar E A, Turner D W, Gibb D J, Armstrong W,Sivasithamparam K . 2 0 03. O x ygen distribution a nd movement, respiration and nutrients loading in banana (Musa spp. L.) subjected to aerated and oxygen-depleted environments. Plant and Soil 253:91-102. ) Anon.2003. Bernoulli's Equation, NASA. http://www.brc.nasa.gov/WWW/K-12/airplane/bern.html. Armstrong W. 1979. Aeration in higher plants. Advances inBotanical Research 7:225-332. ( Ayars J E, Phene C J, Hutmacher R B, Davis K R,Schoneman R A, Vali S S , Mead R M. 1999. Su b surface drip irrigation of row crops: a review of 15 years of researchat the water management re s earch la b oratory. AgriculturaWater Management 42:1-27. ) Barrett-Lennard E G. 2003. The interaction betweenwaterlogging and salinity in higher plants: causes,consequences and implications. Plant and Soil 253:35-54. Baruch Z. 1994. Responses to drought and flooding in tropicalforage grasses. 2. Leaf water potential, photosynthesis rateand alcohol dehydrogenase activity. Plant and Soil 164:97-105. ( Bathke G R, Cassel D K, Hargrove W L,Porter P M. 1992. M odification of s oil p hysical properties and r oot growth responses. Soil Science 154:316-329. ) ( Berry LJ,Norris W E. 1949. Studies on onion root respiration. I . Velocity of oxygen consumption in different segments of root,at different temperatures as a f u nction of partial pressure of oxygen. B iochimica Biophysica Acta 3:593-606. ) Bhattarai S, McHugh J, Lotz G, Midmore D J. 2003.Physiological responses of cotton to subsurface drip irrigationon heavy clay soil. Proceedings ofthe 11th AustralianAgronomy Conference, 2-6 February, 2003, Geelong,Victoria, Australia: Australian Society of Agronomy. pp.1-2.htpp://www.regional.org.au/au/asa/2003/p/4/bhattarai.html. ( Blokhina O, Virolainen E, Fagerstedt K V.2003.Antioxidants, oxidative damage and oxygen deprivation s t ress: a review.Annals of Botany 91:179-194. ) Boone F R, Van Der Werf H M G, Kroesbergen B, Ten HagB A, Boers A. 1986. The effect of compaction of the arablelayer in sandy soils on the growth of maize for silage. 1.Critical matric water potentials in relation to soil aerationand mechanical impedance. Netherlands Journal ofAgricultural Science 34:155-171. Brady N C, Weil R R. 1999. The Nature and Properties ofSoils. Upper Saddle River, NJ: Prentice Hall. 880 pp. Bryce J H, Focht D D, Stolzy L H. 1982. Soil aeration andplant growth response to urea peroxide fertilization. SoilScience 134:111-116. Caldwell M M, Virginia R A. 1991. Root systems. In PlantPhysiological Ecology: Field Methods and Instrumentation,pp. 367-392. Eds R W Pearcy,JR Ehleringer, H A Mooneyand P W Rundel.London: Chapman and Hall. Camp C R. 1998. Subsurface drip irrigation: a review.Transactions of the American Society ofAgriculturalEngineers 41:1353-1367. ( Drew M C, Stolzy L H. 1996. Growth un d er oxygen stress. I n P lant Roots: T he Hidden H a lf, pp.397-414. Eds Y Waisel, AEshel and U Kafkafi. New York: Marcel De k ker, Inc. ) Focht D D. 1992. Diffusional constraints on microbial processesin soil. Soil Science 154:301-307. Glinski J, Stepniewski W. 1985. Soil Aeration and its Role forPlants. Boca Raton, Florida: CRC Press Inc. 229 pp. Goorahoo D, Carstensen G, Zoldoske DF,Norum E, MazzeiA. 2001. Using air in subsurface drip irrigation (SDI) toincrease yields in bell pepper. In Proceedings of The IrrigationAssociation Technical Conference, San Antonio, Texas, pp.95-102. Grable A R. 1966. Soil aeration and plant growth. Advances inAgronomy 18:57-106. Herr E M, Jarrel W M. 1980. Response of chrysanthemum(Chrysanthemum hortorum cv. Bright Golden Ann) to ureaperoxide. HortScience 15:501-502. ( Hodgson A S , MacLeod D A. 199 8 . Oxygen flu x , ai r filledporosity, and bulk density as indices of vertisol structure. Soil Science Society America Journal 5 3:540-543. ) ( Huang B R, Johnson J W, Nesmith D S , Bridges D C. 1994. R oot and shoot growth o f wheat genotypes in response tohypoxia and subsequent resumption of aeration. Crop Science 34:1538-1544. ) Huber S. 2000. New uses for drip irrigation:partial root zonedrying and forced aeration. M.Sc. Thesis, TechnischeUniversitat Munchen, Germany 90 pp. Isbell R F. 1996. The Australian Soil Classification. Australia:CSIRO. 296 pp. Jackson M B. 1992. Hormone action and plant adaptations topoor aeration: a review. In Adaptation ofFood Crops toTemperature and Water Stress, pp. 231-243. Eds G C Kuo,AVRDC,Taiwan.Proceedings ofan international symposium. Joham H E. 1986. Effects of nutrient elements on fruitingefficiency. In Cotton Physiology pp. 79-89. Eds J R Mauneyand J M Stewart. Memphis, Tennessee, USA: The CottonFoundation. Letley J. 1961. Aeration, compaction and drainage. CaliforniaTurfgrass Culture 11:17-21. Meek B D, Stolzy L H. 1978. Short term flooding. In PlantLife in Anaerobic Conditions, pp. 351-373. Eds. D D Hookand R M Crawford. Michigan, USA: Ann Arbor SciencePublishers Inc. Meek B D, Ehlig C F, Stolzy L H, Graham L E. 1983. Furrowand trickle irrigation: effects on soil oxygen and ethyleneand tomato yield. Soil Science Society of America Journal47:631-635. Melsted S W, Kurtz T, Brady R. 1949. Hydrogen peroxide asan oxygen fertilizer.Agronomy Journal 41:79. ( Meyer W S, B a rrs H D, Smith R C G, White N S, Heritage A D , S hort D L , B l ackwell J, Trickett E S. 1 9 85. E f fect of irrigation on soil oxygen status and root a nd shoot growth of ) ( wheat i n a clay s o il. Australian J o urnal of Agricultural Research 36:171-185. ) Mukhtar S, Baker J L, Kanwar R S. 1996. Effect of short-term flooding and drainage on soil oxygenation. Transactionsof the American Society of Agricultural Engineers 39:915-920. Sojka R E. 1992. Stomatal closure in oxygen stressed plants.Soil Science 154:269-279. Stepniewski W. 1981. Oxygen diffusion and strength as relatedto soil compaction. 2. Oxygen diffusion coefficient. PolishJournal of Soil Science 14:3-13. Stobovoi V. 2001. Soil respiration in the full carbon accountfor Russia. In Proceedings of the Sixth International CarbonDioxide Conferences, Sendai, Japan, pp. 434-437. Thumma B R, Naidu B P, Cameron D F, Bahnisch L M.1998. Carbon isotope discrimination and specific leaf weightestimate transpiration efficiency indirectly in Stylosanthesunder well-watered conditions. Proceedings of the 9thAustralian Agronomy Conference, Wagga Wagga, pp 1-4.http://www.regional.org.au/au/asa/1998/1/102thumma.html Vartapetian B B, Jackson M B. 1997. Plant adaptations toanaerobic stress. Annals of Botany 79:3-20, (SupplementA). Visser E J W, Colmer T D, Blom C W PM, Voesenek LA CJ. 2000. Changes in growth, porosity, and radial oxygen lossfrom adventitious roots of selected mono-and dicotyledonouswetland species with contrasting types of aerenchyma. Plant,Cell and Environment 23:1237-1245. Visser E J W, Voesenek L A C J, Vartapetian B B, JacksonM B. 2003. Flooding and plant growth. Annals of Botany91:107-109. Wien H C. 1997. The cucurbits: cucumber, melon, squash andpumpkin. In The Physiology of Vegetable Crops, pp. 345-386. Ed. H C Wien. Oxford, New York: CAB International. Willson GV, Thiesse B R, Scott H D. 1985. Relationshipamong oxygen flux, soil water tension, and aeration porosityin a drying soil profile. Soil Science 139:30-36.
确定

还剩12页未读,是否继续阅读?

产品配置单

科艺仪器有限公司为您提供《菜用大豆栽种粘土中曝气地下灌溉用水的影响检测方案(氧分析仪)》,该方案主要用于其他中理化分析检测,参考标准--,《菜用大豆栽种粘土中曝气地下灌溉用水的影响检测方案(氧分析仪)》用到的仪器有光学O2、pH 和 CO2测量仪
推荐专场
相关方案
更多