


方案详情
文
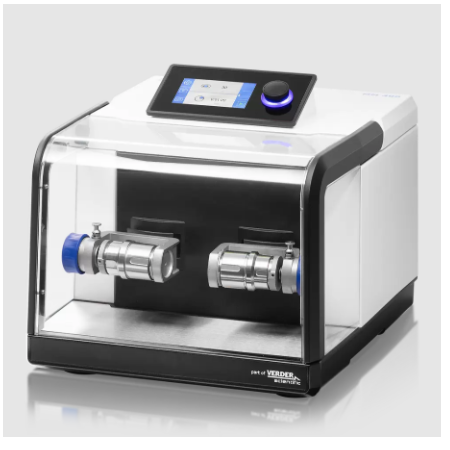
本文利用ATR-FTIR实时监测技术研究了相等摩尔质量的b-磷酸三钙和磷酸钙一水化合物在不同浓度的柠檬酸缓冲溶液中的反映过程。其中b-TCP粉末都由b-TCP熔融块使用德国RETSCH PM400行星式球磨仪进行研磨。
方案详情

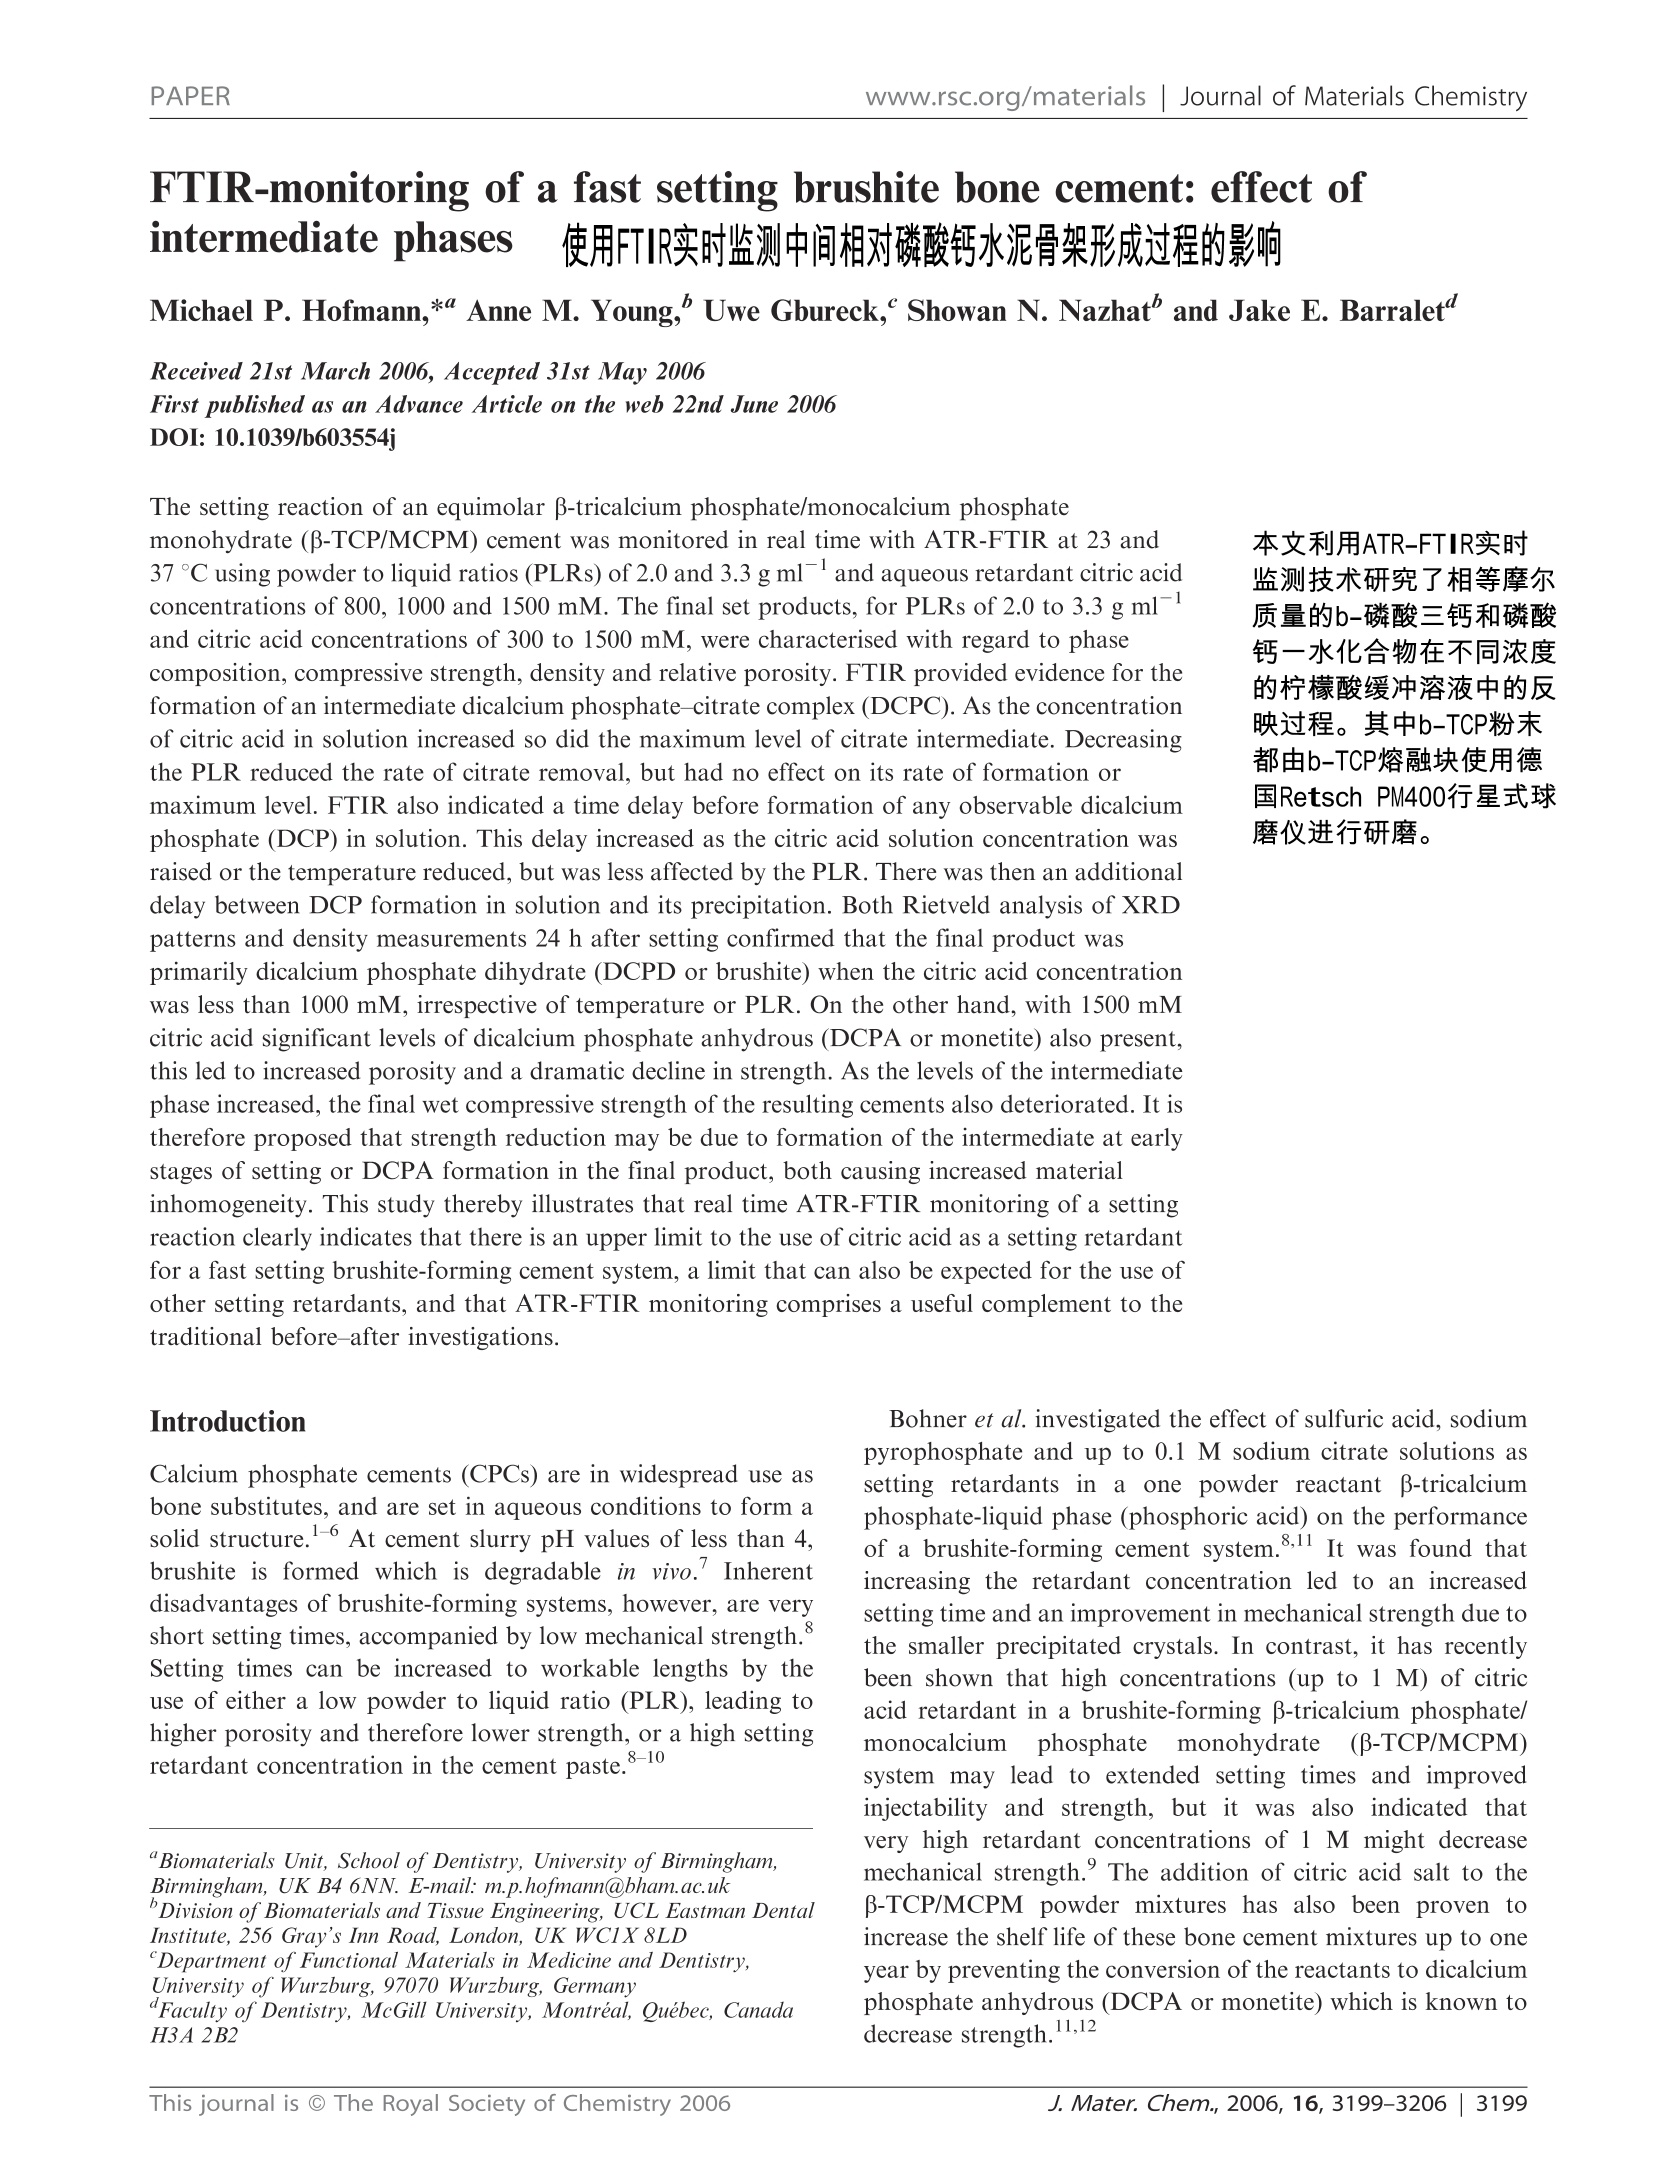
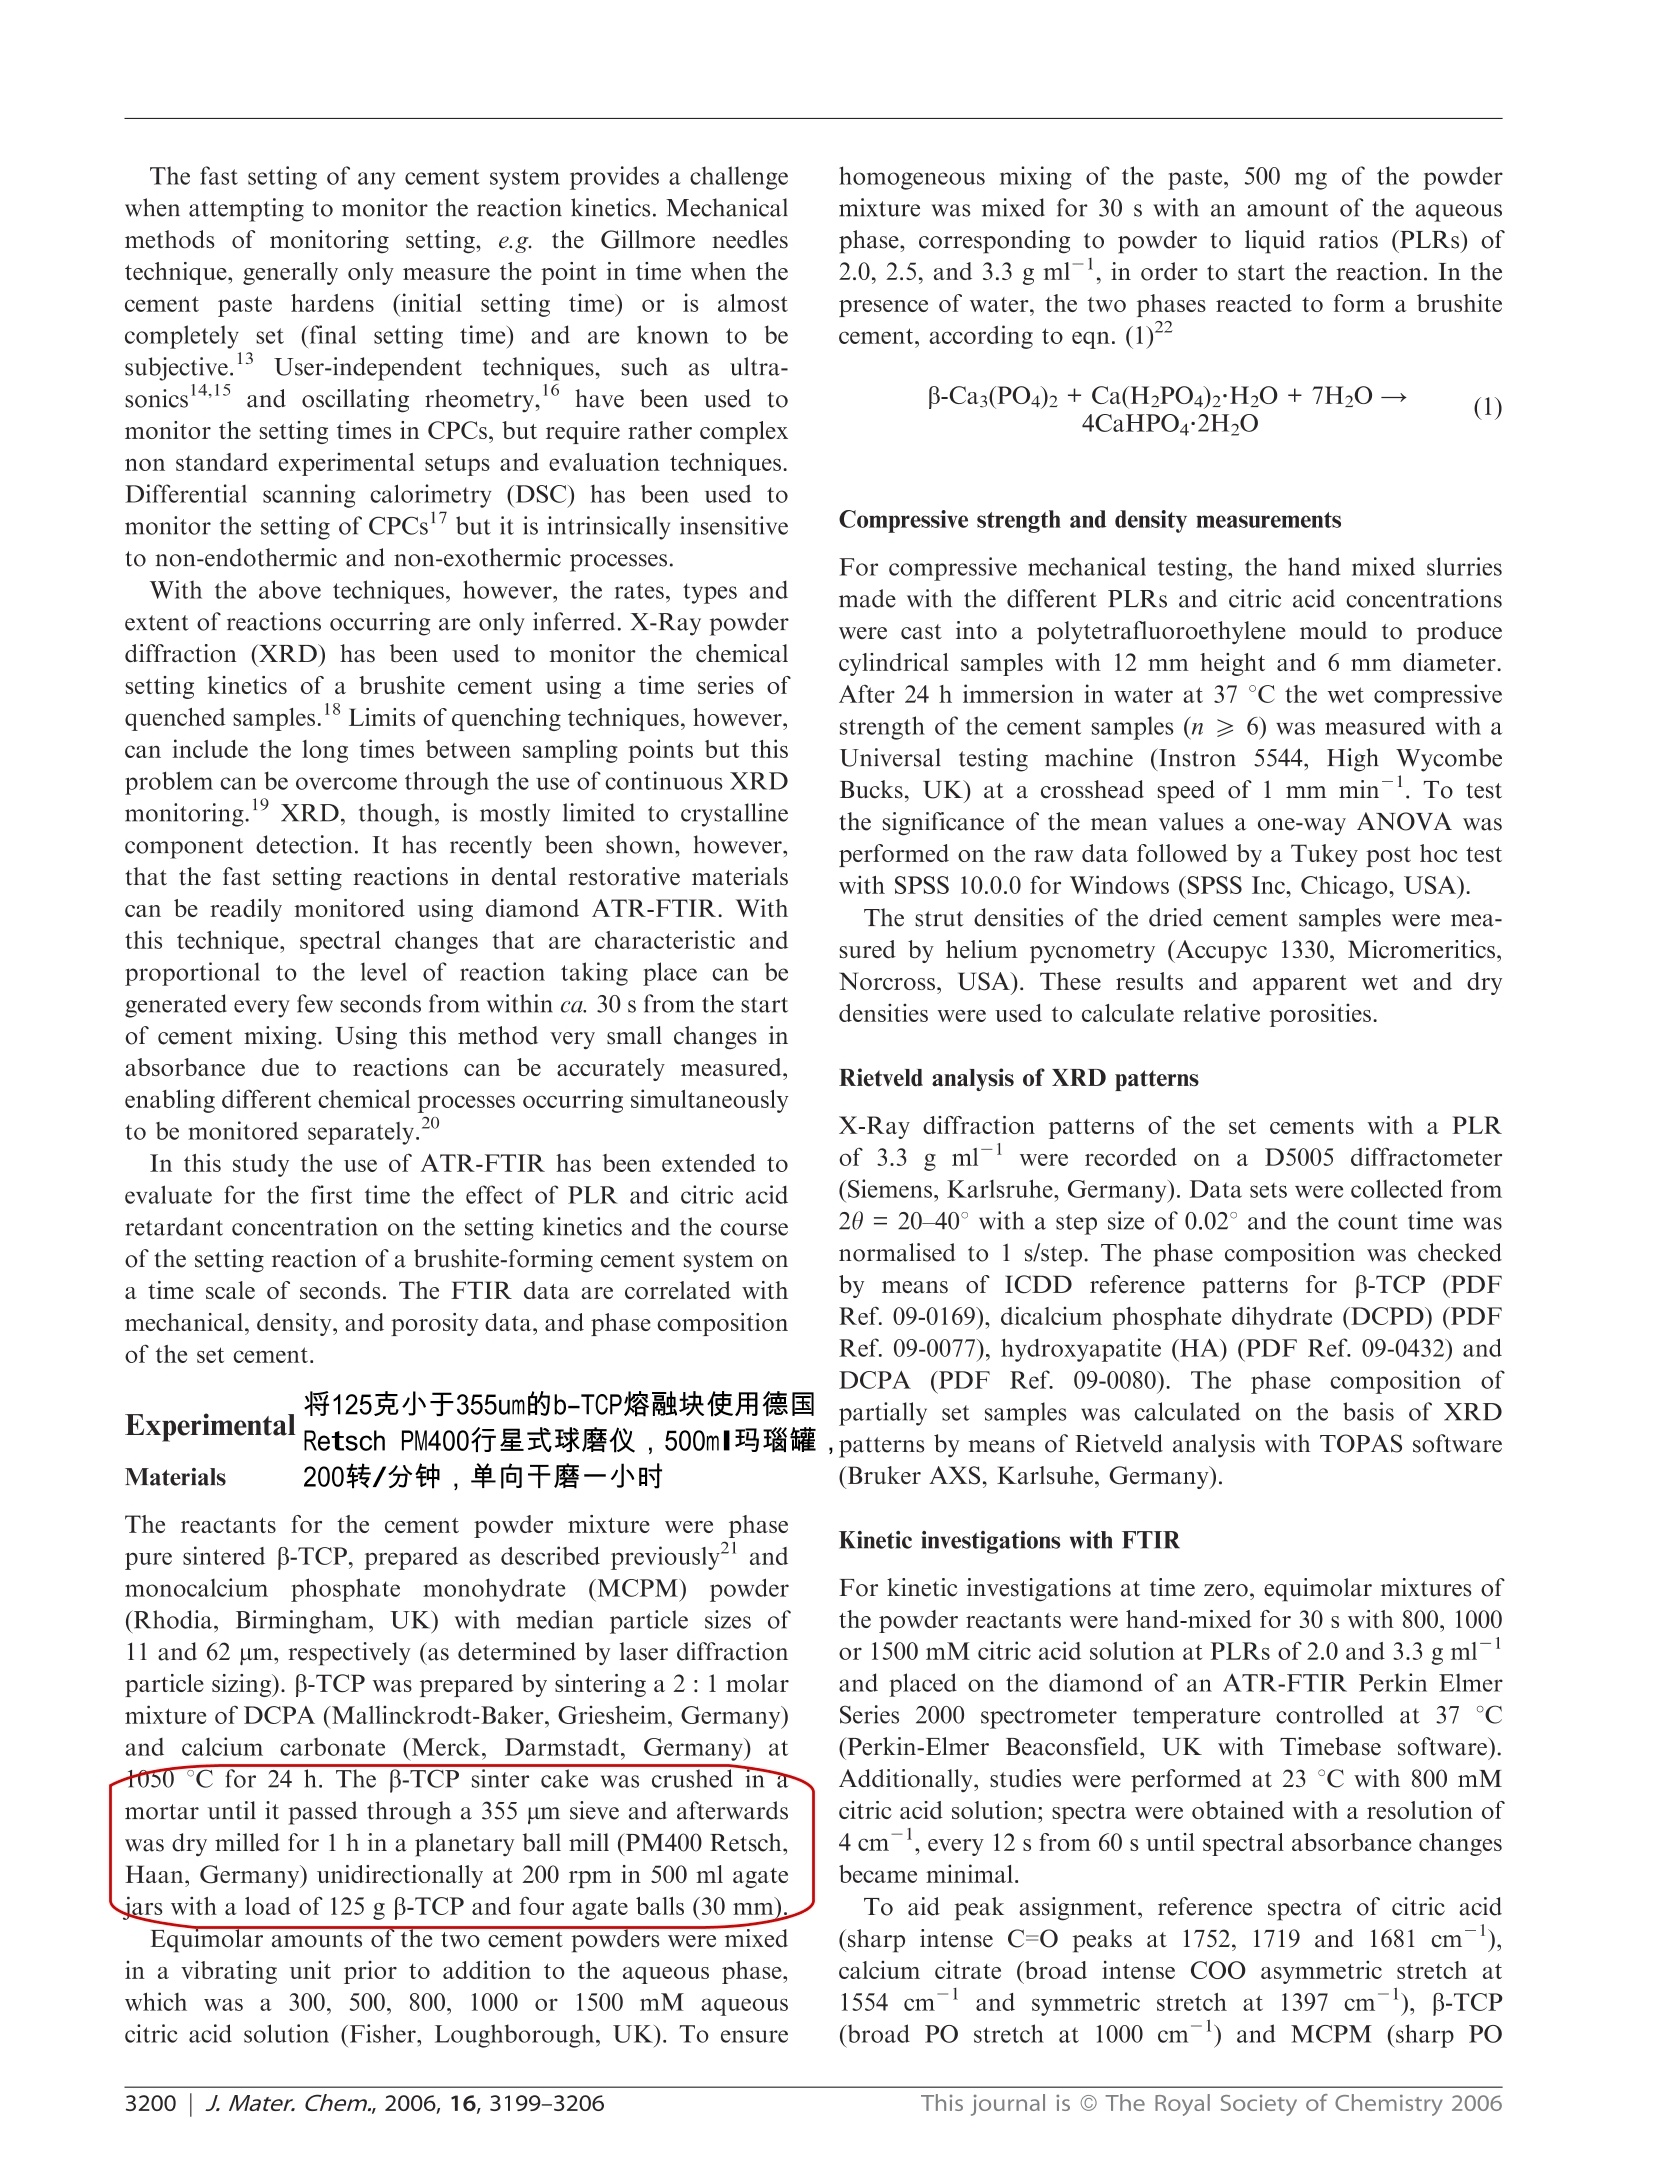
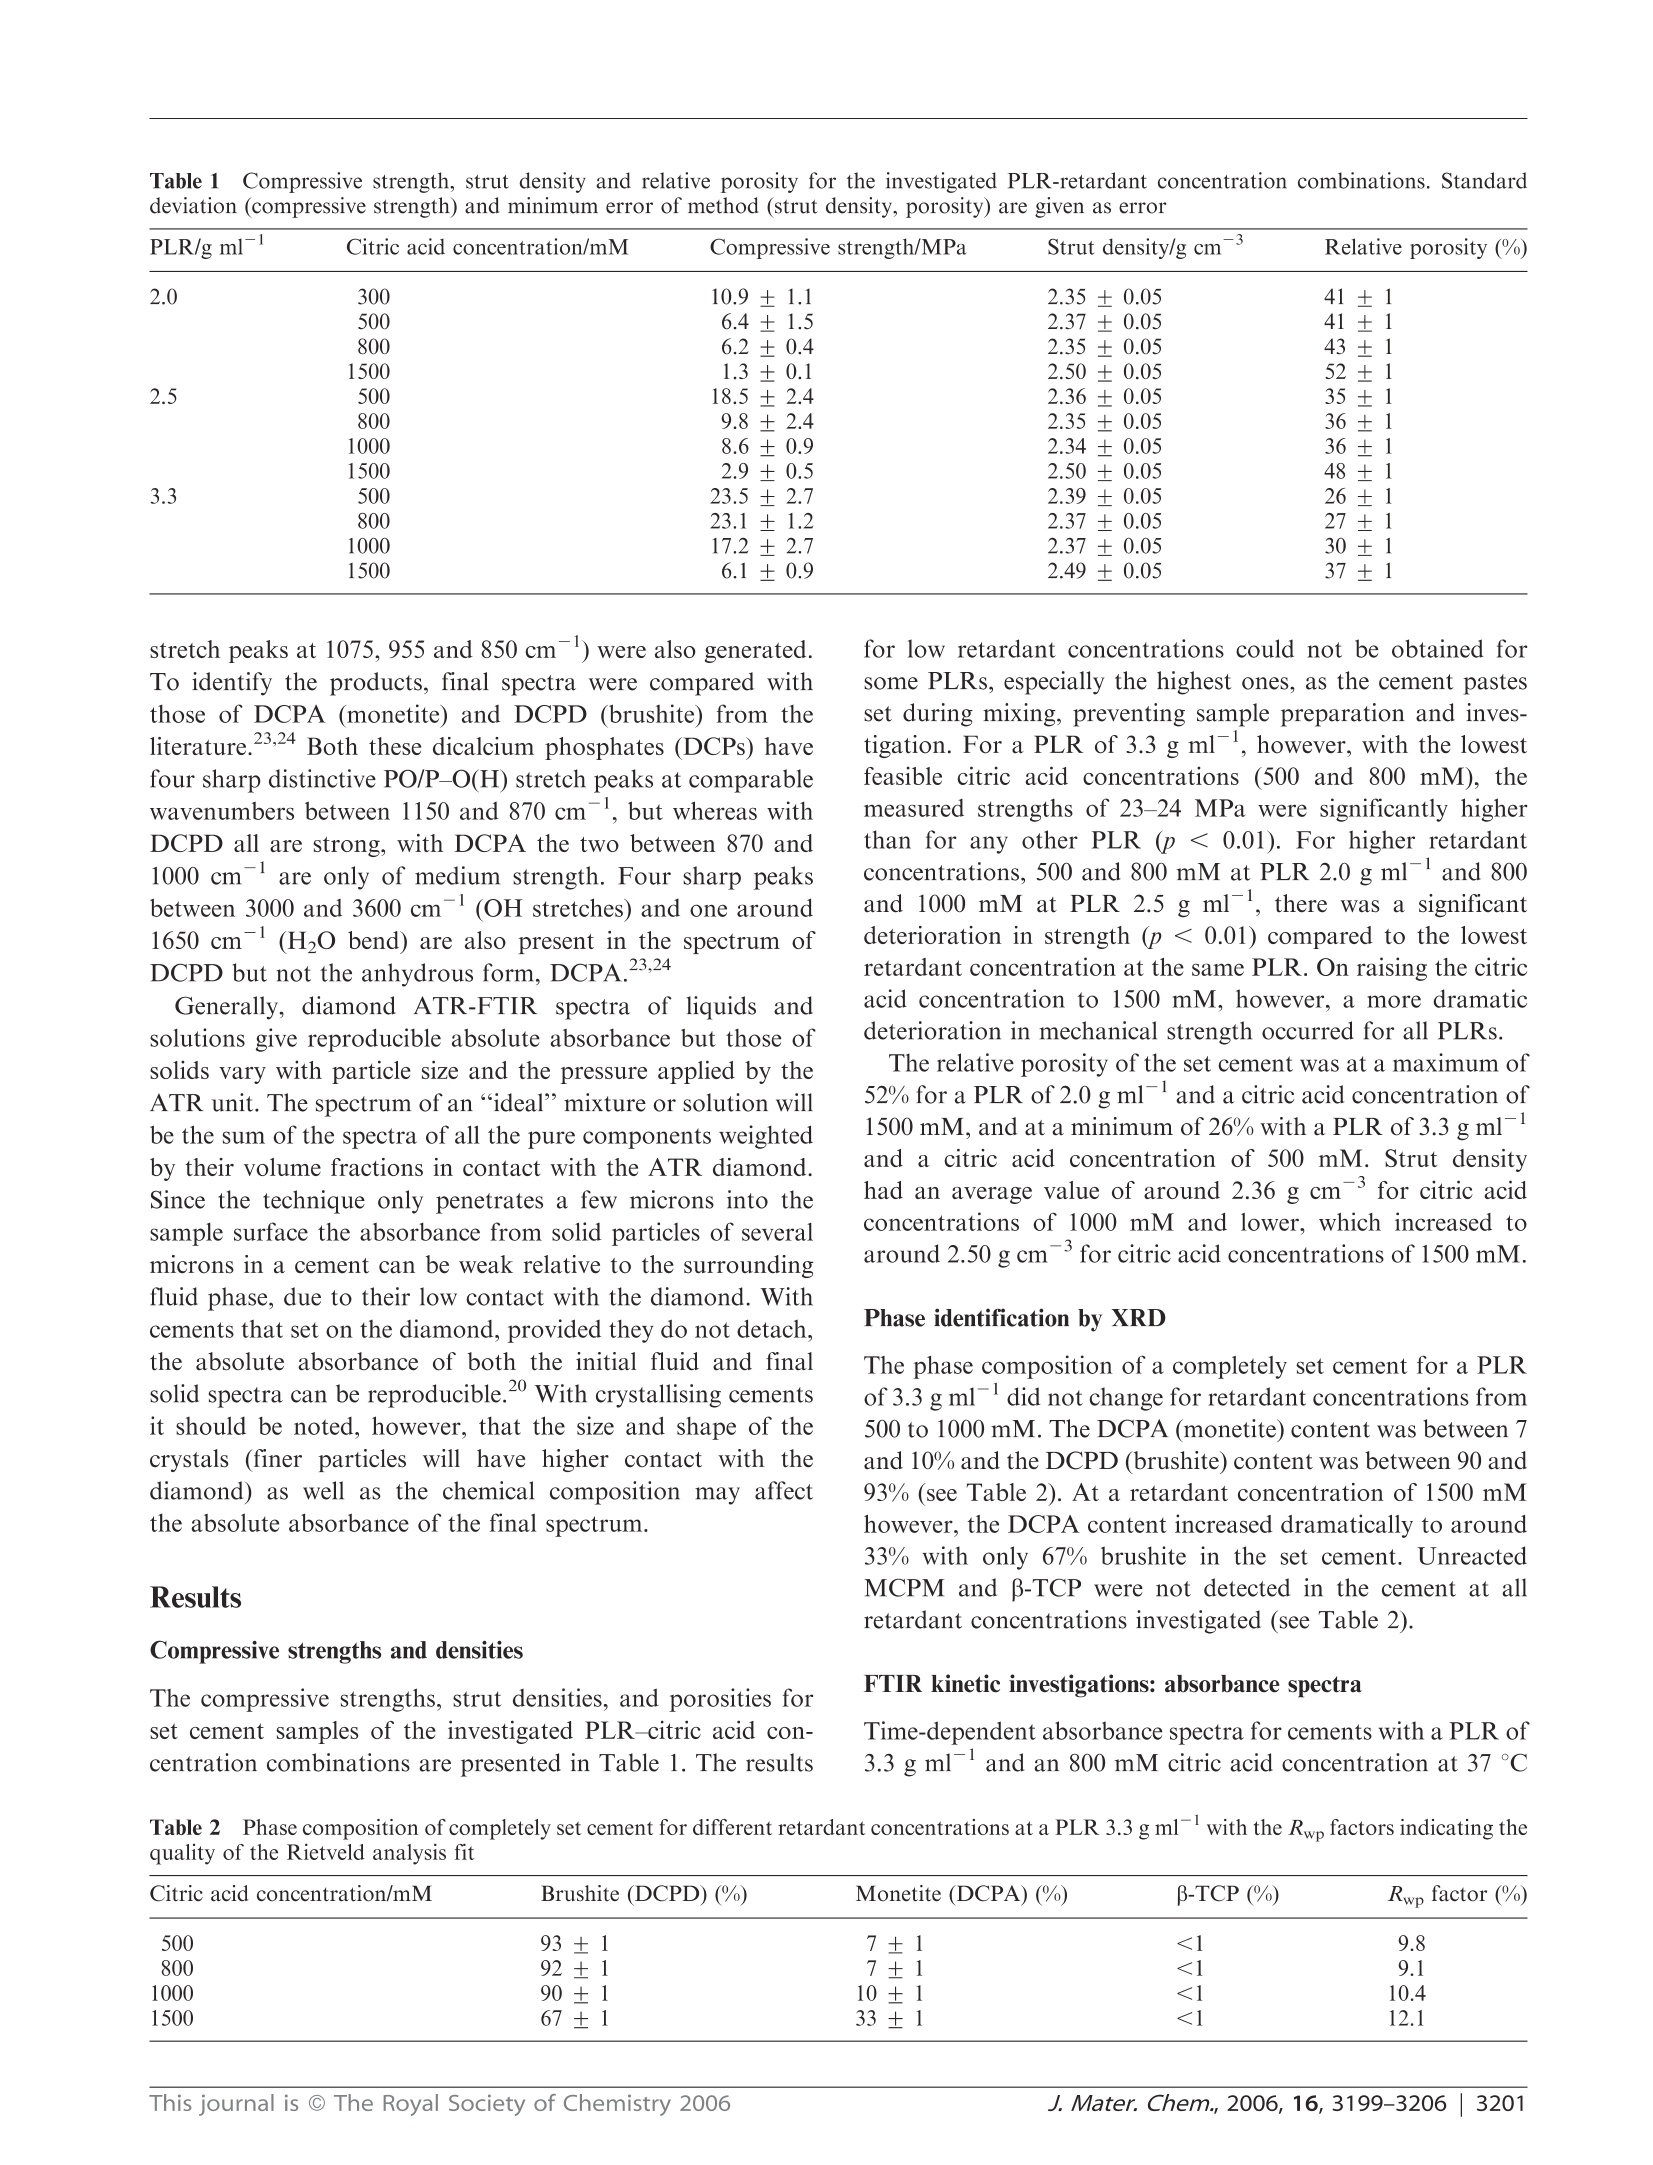
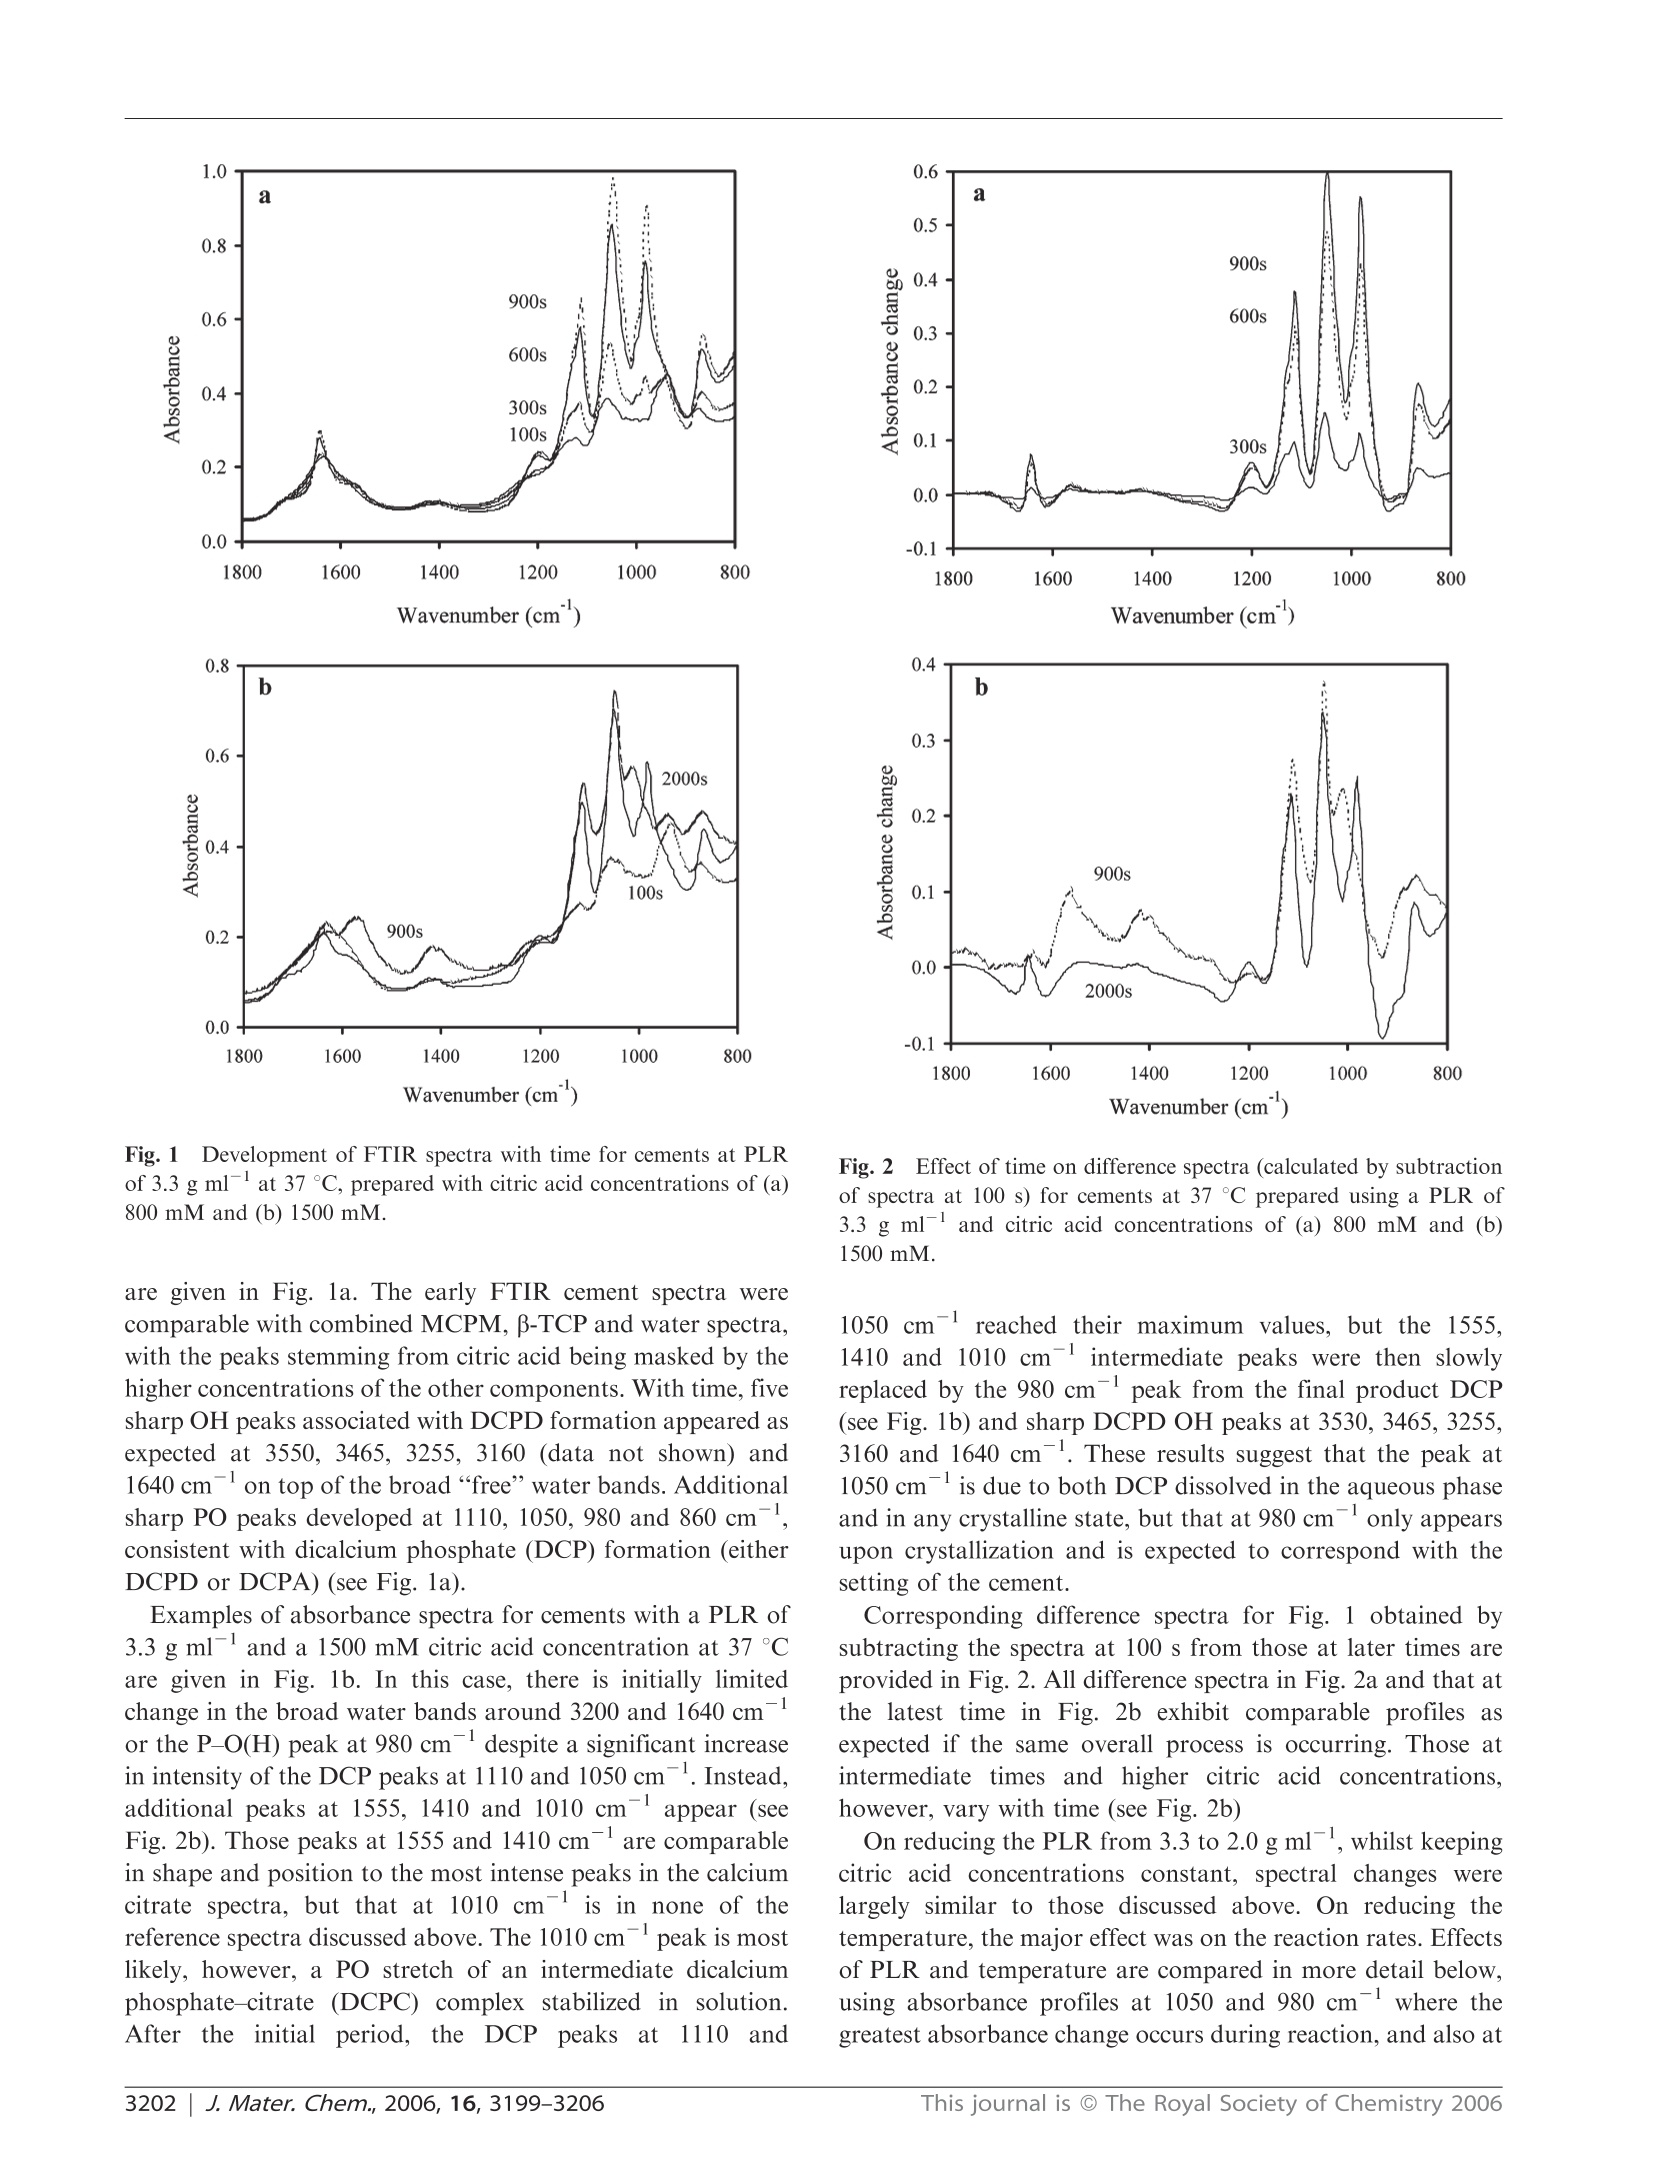
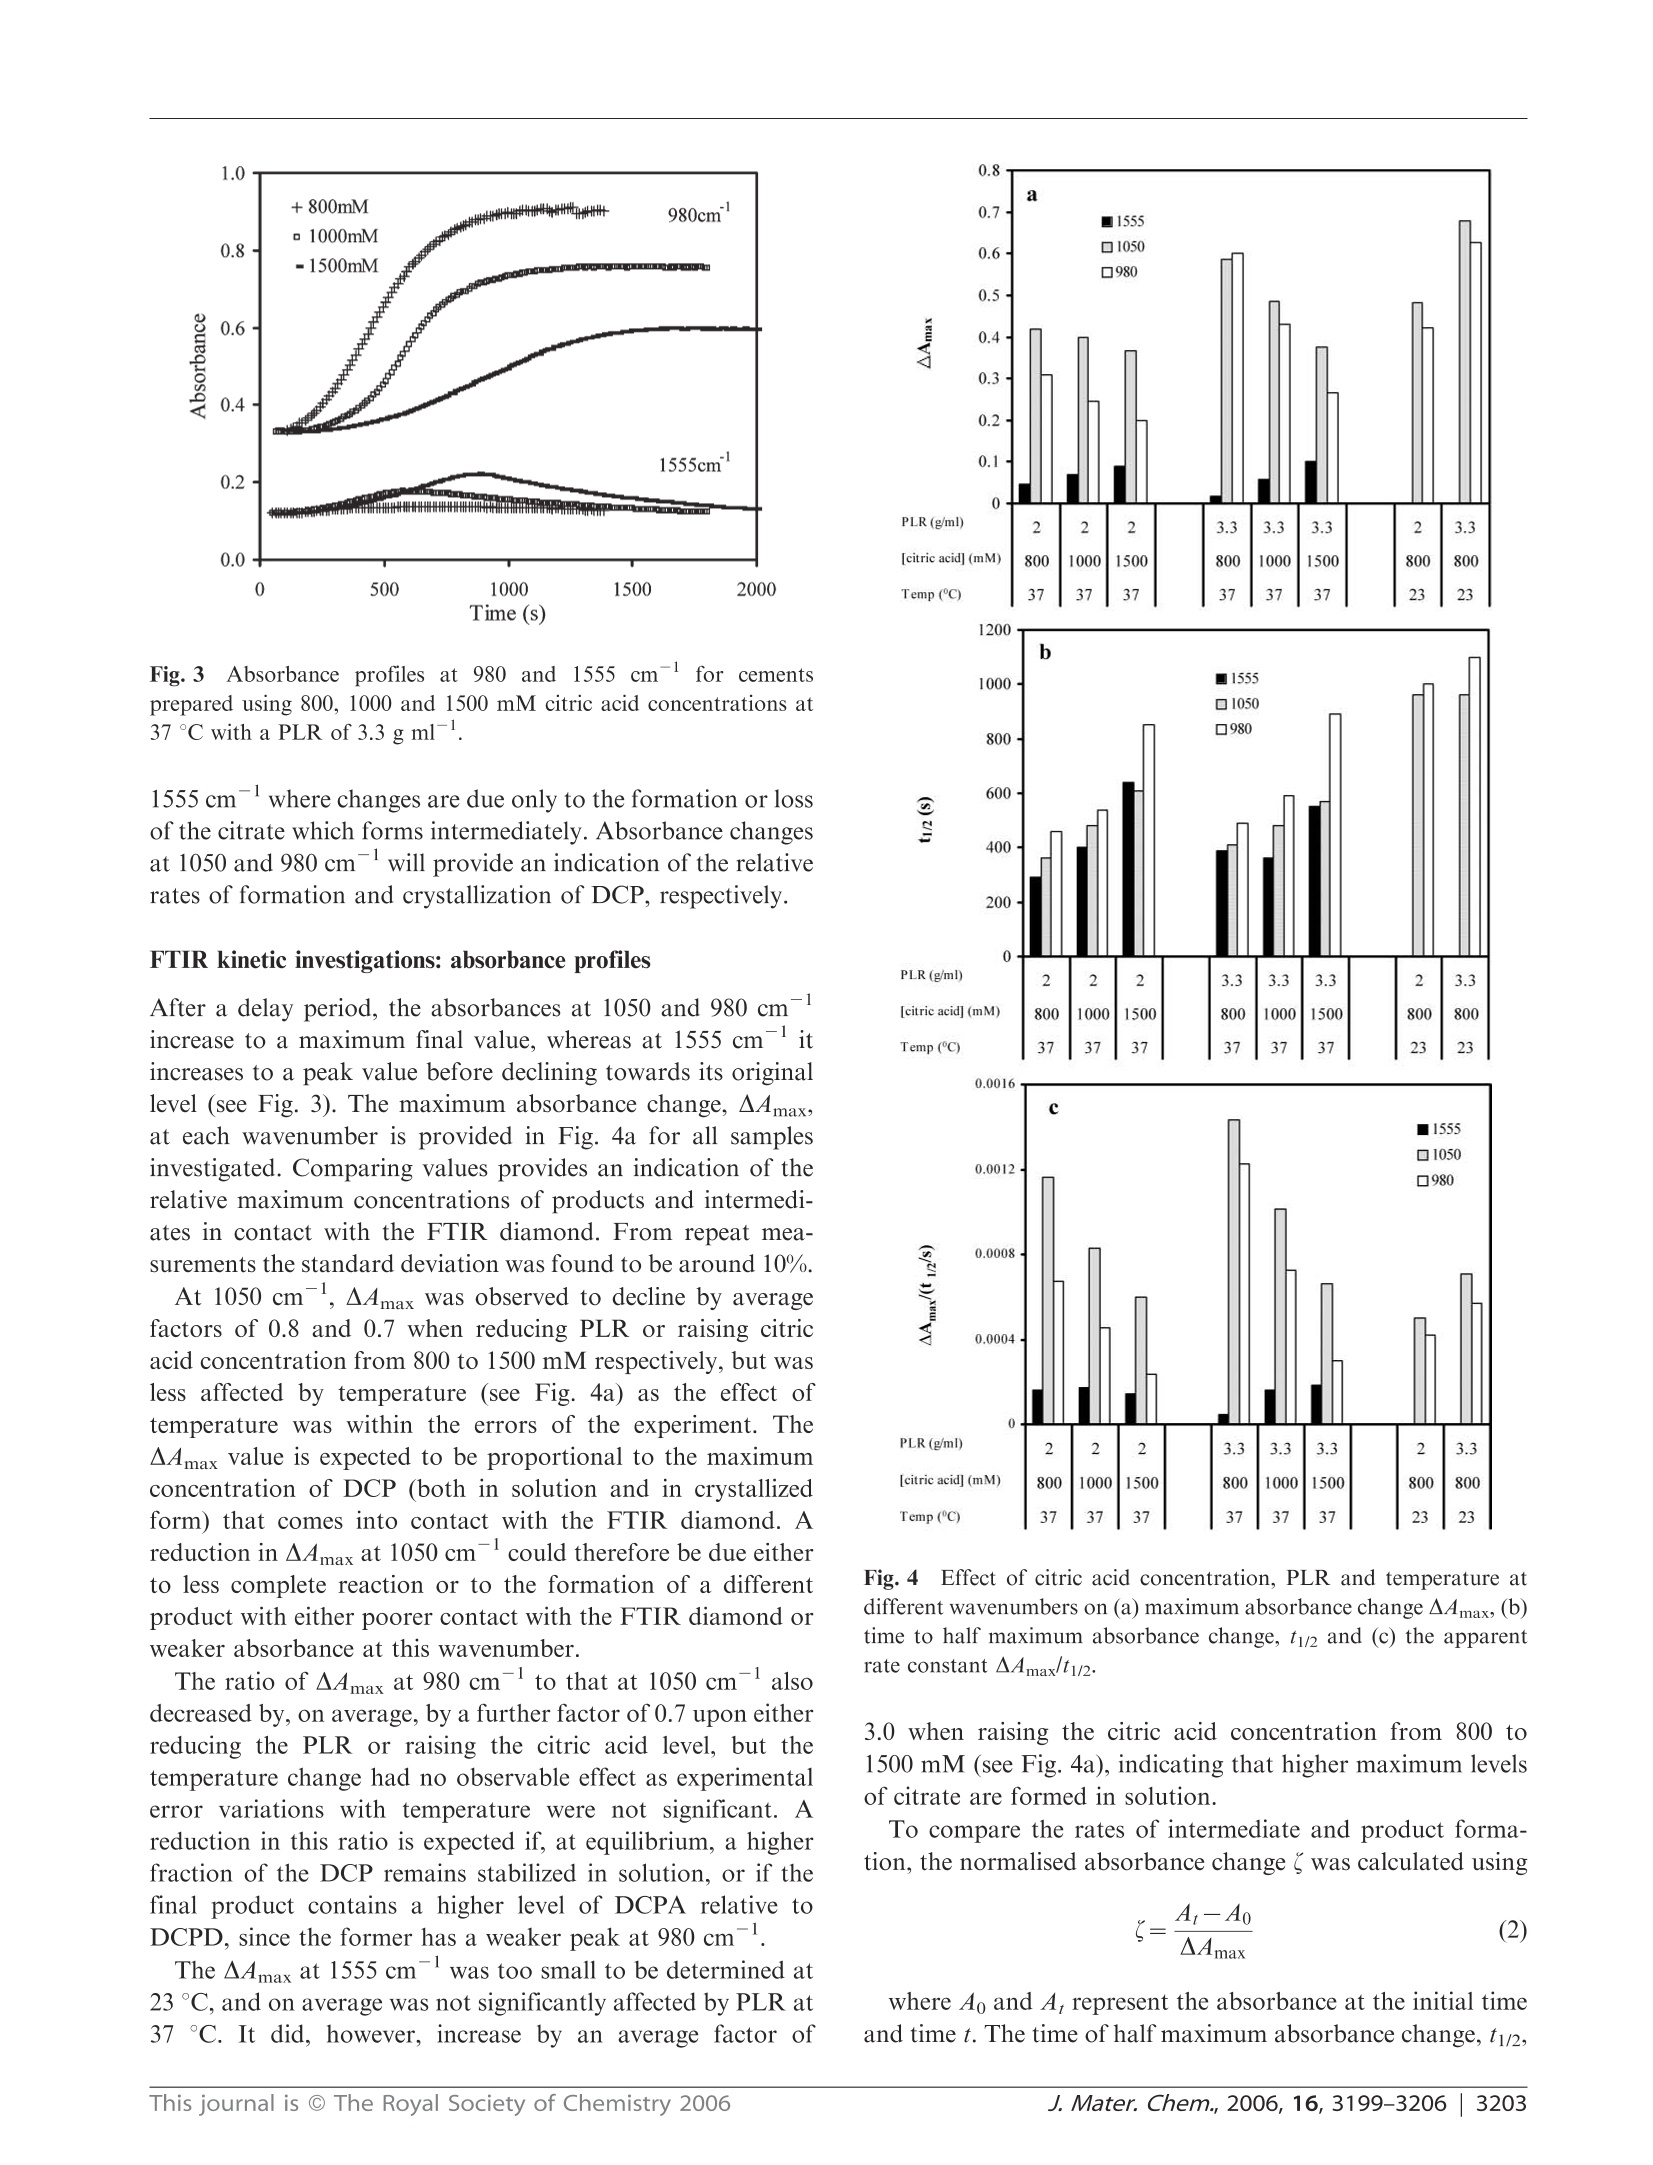
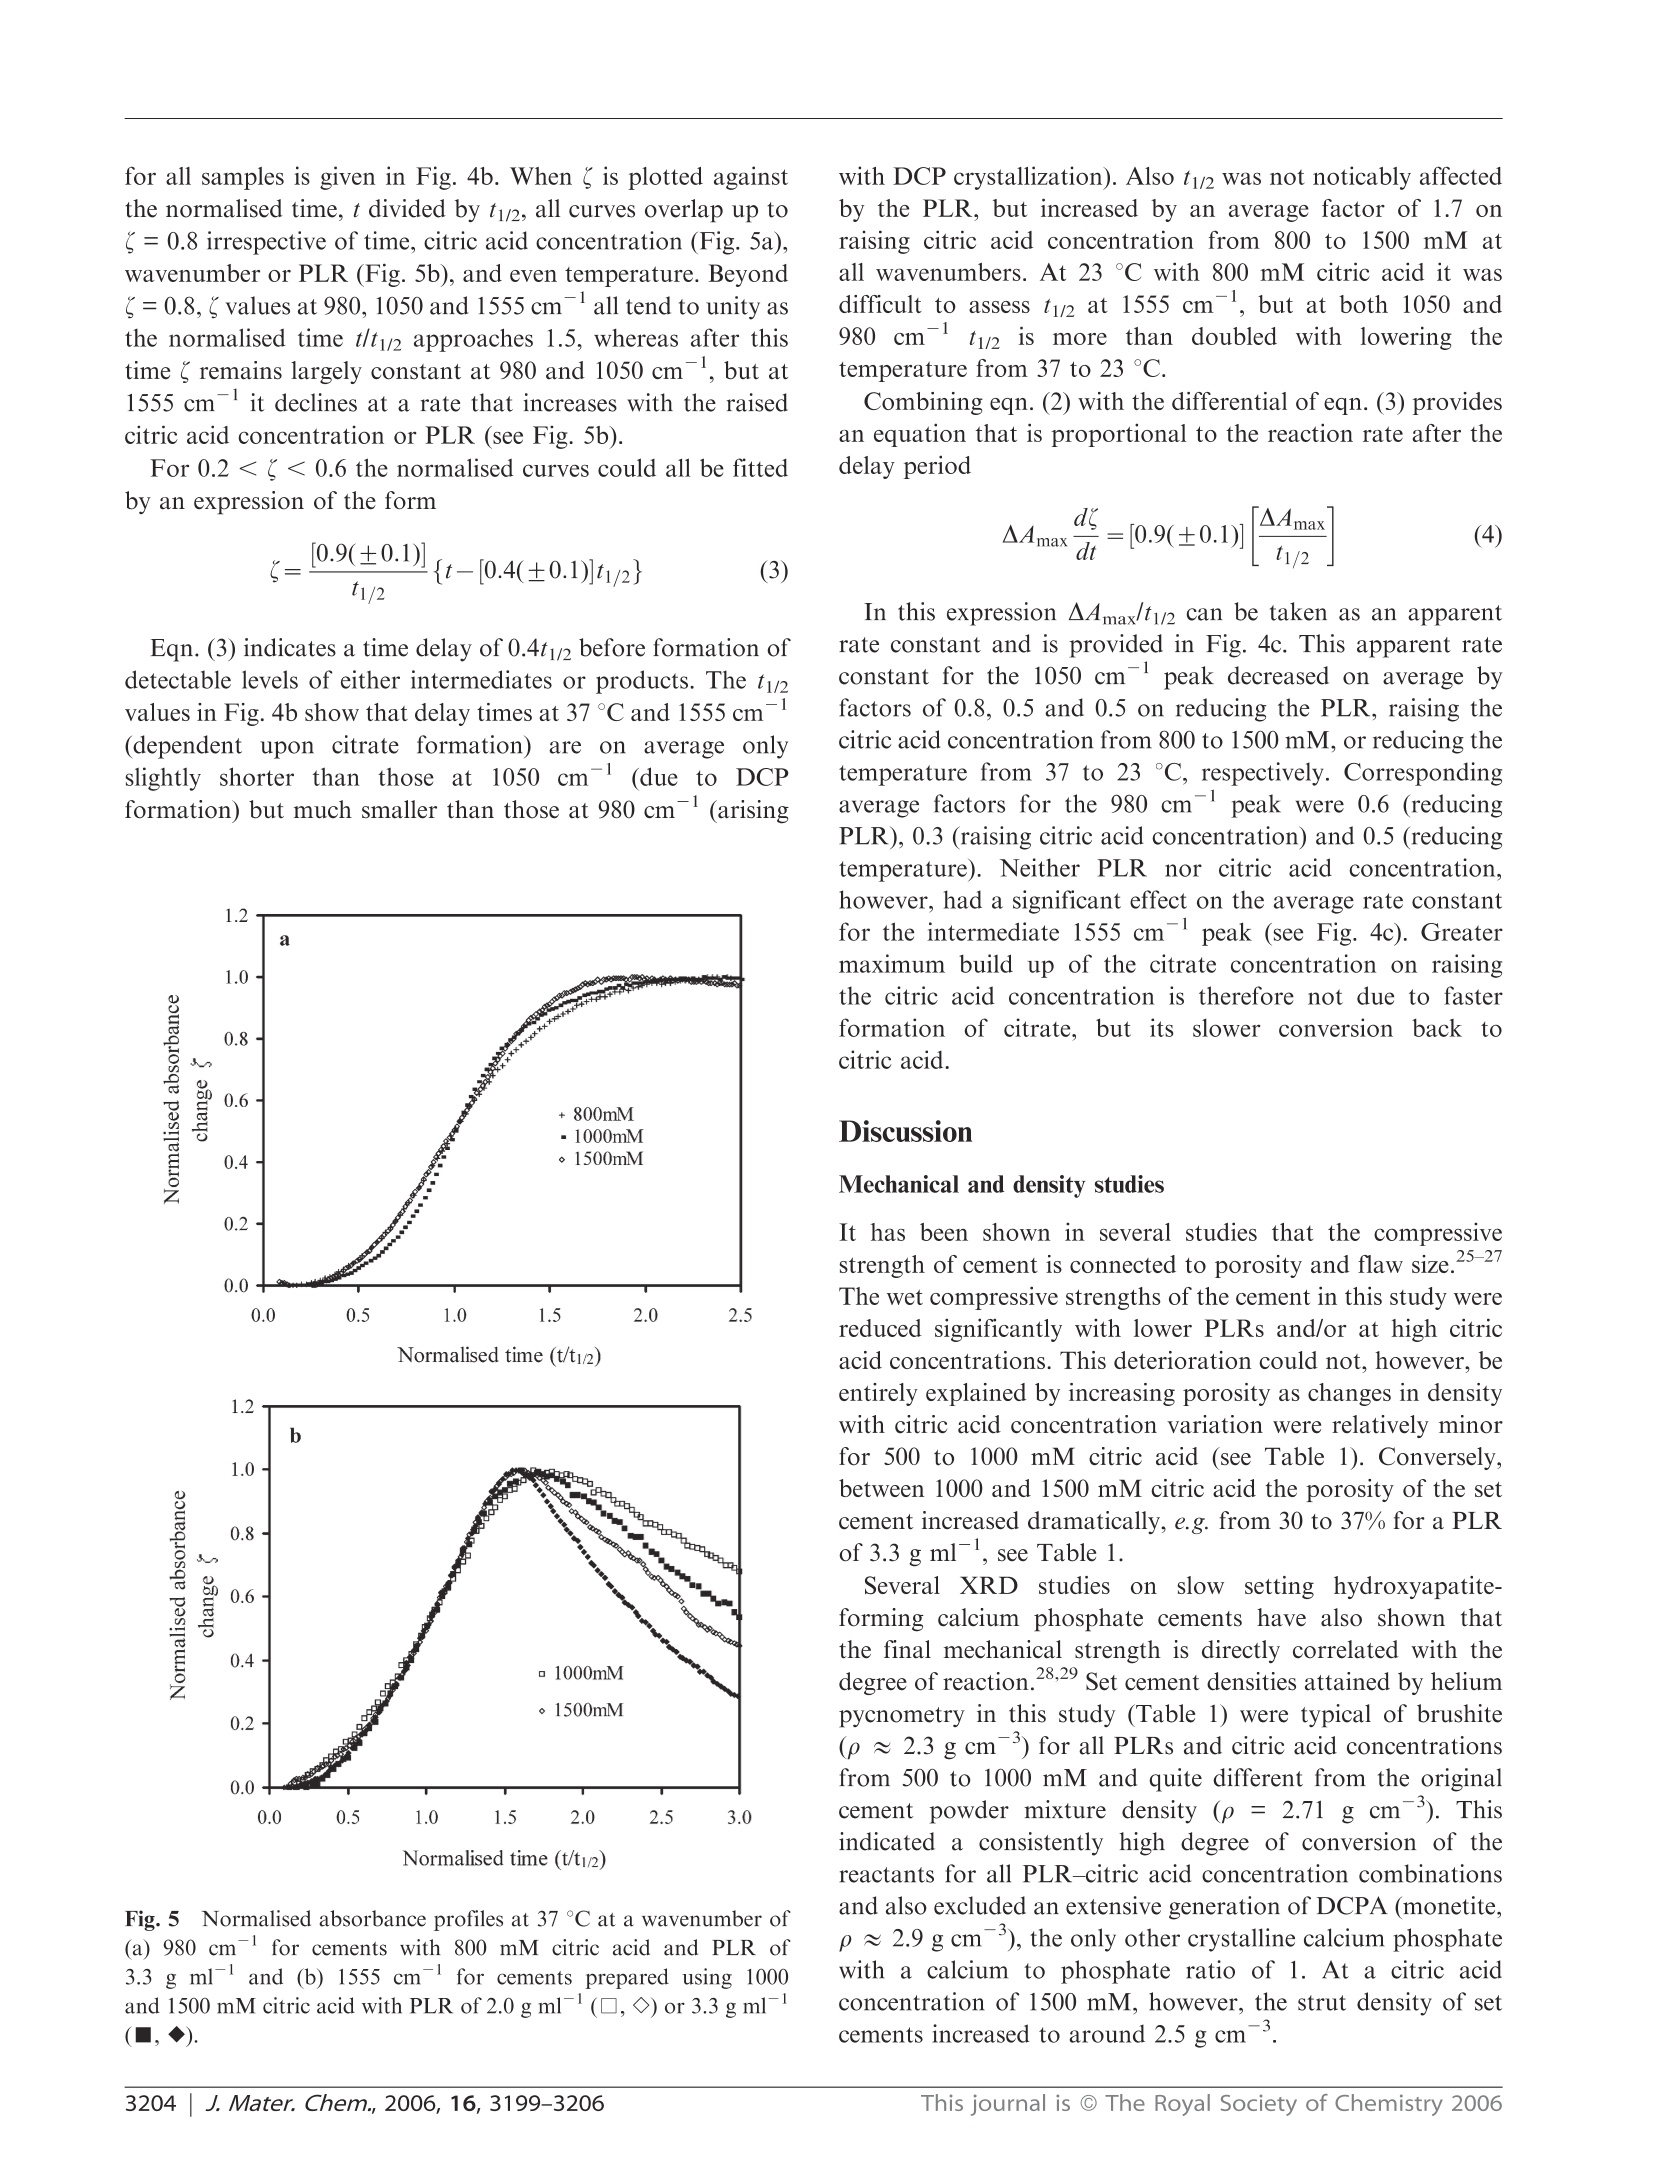
www.rsc.org/materialsJJournal of Materials ChemistryPAPER FTIR-monitoring of a fast setting brushite bone cement: effect ofintermediate phases 使用FTIR实时监测中间相对磷酸钙水泥骨架形成过程的影响 Michael P. Hofmann,*4 Anne M. Young, Uwe Gbureck, Showan N. Nazhat and Jake E. Barralet Received 21st March 2006, Accepted 31st May 2006 First published as an Advance Article on the web 22nd June 2006 DOI: 10.1039/b603554i The setting reaction of an equimolar B-tricalcium phosphate/monocalcium phosphate monohydrate (B-TCP/MCPM) cement was monitored in real time with ATR-FTIR at 23 and37℃ using powder to liquid ratios (PLRs) of 2.0 and 3.3 g ml-and aqueous retardant citric acidconcentrations of 800, 1000 and 1500 mM. The final set products, for PLRs of 2.0 to 3.3 g mland citric acid concentrations of 300 to 1500 mM, were characterised with regard to phasecomposition, compressive strength, density and relative porosity. FTIR provided evidence for theformation of an intermediate dicalcium phosphate-citrate complex (DCPC). As the concentrationof citric acid in solution increased so did the maximum level of citrate intermediate. Decreasingthe PLR reduced the rate of citrate removal, but had no effect on its rate of formation ormaximum level. FTIR also indicated a time delay before formation of any observable dicalciumphosphate (DCP) in solution. This delay increased as the citric acid solution concentration wasraised or the temperature reduced, but was less affected by the PLR. There was then an additionaldelay between DCP formation in solution and its precipitation. Both Rietveld analysis of XRDpatterns and density measurements 24 h after setting confirmed that the final product wasprimarily dicalcium phosphate dihydrate (DCPD or brushite) when the citric acid concentrationwas less than 1000 mM, irrespective of temperature or PLR. On the other hand, with 1500 mMcitric acid significant levels of dicalcium phosphate anhydrous (DCPA or monetite) also present,this led to increased porosity and a dramatic decline in strength. As the levels of the intermediatephase increased, the final wet compressive strength of the resulting cements also deteriorated. It istherefore proposed that strength reduction may be due to formation of the intermediate at earlystages of setting or DCPA formation in the final product, both causing increased materialinhomogeneity.This study thereby illustrates that real time ATR-FTIR monitoring of a settingreaction clearly indicates that there is an upper limit to the use of citric acid as a setting retardantfor a fast setting brushite-forming cement system, a limit that can also be expected for the use of other setting retardants, and that ATR-FTIR monitoring comprises a useful complement to the traditional before-after investigations. 本文利用ATR-FTIR实时监测技术研究了相等摩尔质量的b-磷酸三钙和磷酸钙一水化合物在不同浓度的柠檬酸缓冲溶液中的反映过程。其中b-TCP粉末都由b-TCP熔融块使用德国Retsch PM400行星式球磨仪进行研磨。 Calcium phosphate cements (CPCs) are in widespread use asbone substitutes, and are set in aqueous conditions to form asolid structure.1-6 At cement slurry pH values of less than 4,brushite is formed which is degradable in vivo. Inherentdisadvantages of brushite-forming systems, however, are veryshort setting times, accompanied by low mechanical strength.Setting times can be increased to workable lengths by theuse of either a low powder to liquid ratio (PLR), leading tohigher porosity and therefore lower strength, or a high settingretardant concentration in the cement paste.8-10 ( “Biomaterials U n i t, S chool of Dentistry, U n iversity of Birmingham,Birmingham, UK B4 6NN. E -mail: m.p.hofmann@bham.ac.uk"Division of Biomaterials and Tissue Engineering, UCL Eastman Dental Institute, 256 Gray's Inn Road, London, UK WC1X 8L D ‘ D epartment of Functional Materials in M edici n e and Dentistry, Universit y o f Wurzburg , 9707 0 Wurzburg , Germany "Faculty of Dentistry, McGill U niversity , M ontreal,Q u ebec, Ca na da ) Bohner et al. investigated the effect of sulfuric acid, sodiumpyrophosphate and up to 0.1 M sodium citrate solutions assetting retardants in a one powder reactant B-tricalciumphosphate-liquid phase (phosphoric acid) on the performanceof a brushite-forming cement system.8.11 It was found thatincreasing the retardant concentration led to an increasedsetting time and an improvement in mechanical strength due tothe smaller precipitated crystals. In contrast, it has recentlybeen shown that high concentrations (up to 1 M) of citricacid retardant in a brushite-forming β-tricalcium phosphate/monocalciumphosphatemonohydrate (β-TCP/MCPM)system may lead to extended setting times and improvedinjectability and strength, but it was also indicated thatvery high retardant concentrations of 1 M might decreasemechanical strength. The addition of citric acid salt to theB-TCP/MCPM powder mixtures has also been proven toincrease the shelf life of these bone cement mixtures up to oneyear by preventing the conversion of the reactants to dicalciumphosphate anhydrous (DCPA or monetite) which is known todecrease strength.11,12 The fast setting of any cement system provides a challengewhen attempting to monitor the reaction kinetics. Mechanicalmethods of monitoring setting, e.g. the Gillmore needlestechnique, generally only measure the point in time when thecement paste hardens (initial setting time) or is almostcompletely set (final setting time) and are known to besubjective.13iUser-independent techniques, such asultra-sonics14,15and oscillating rheometry, have been used tomonitor the setting times in CPCs, but require rather complexnon standard experimental setups and evaluation techniques.Differential scanning calorimetry (DSC) has been used tomonitor the setting of CPCs but it is intrinsically insensitiveto non-endothermic and non-exothermic processes. With the above techniques, however, the rates, types andextent of reactions occurring are only inferred. X-Ray powderdiffraction (XRD) has been used to monitor the chemicalsetting kinetics of a brushite cement using a time series ofquenched samples. 8 Limits of quenching techniques,however,can include the long times between sampling points but thisproblem can be overcome through the use of continuous XRDmonitoring.XRD, though, is mostly limited to crystallinecomponent detection. It has recently been shown, however,that the fast setting reactions in dental restorative materialscan be readily monitored using diamond ATR-FTIR. Withthis technique, spectral changes that are characteristic andproportional to the level of reaction taking place can begenerated every few seconds from within ca. 30 s from the startof cement mixing. Using this method very small changes inabsorbance due to reactions can be accurately measured,enabling different chemical processes occurring simultaneouslyto be monitored separately.20 In this study the use of ATR-FTIR has been extended toevaluate for the first time the effect of PLR and citric acidretardant concentration on the setting kinetics and the courseof the setting reaction of a brushite-forming cement system ona time scale of seconds. The FTIR data are correlated withmechanical, density, and porosity data, and phase compositionof the set cement. homogeneous mixing of the paste, 500 mg of the powdermixture was mixed for 30 s with an amount of the aqueousphase, corresponding to powder to liquid ratios (PLRs) of2.0, 2.5, and 3.3 g ml, in order to start the reaction. In thepresence of water, the two phases reacted to form a brushitecement, according to eqn. (1)" Compressive strength and density measurements For compressive mechanical testing, the hand mixed slurriesmade with the different PLRs and citric acid concentrationswere cast into a polytetrafluoroethylene mould to producecylindrical samples with 12 mm height and 6 mm diameter.After 24 h immersion in water at 37 °C the wet compressivestrength of the cement samples (n ≥6) was measured with aUniversal testing machine (Instron 5544, High WycombeBucks, UK) at a crosshead speed of 1 mm min-. To testthe significance of the mean values a one-way ANOVA wasperformed on the raw data followed by a Tukey post hoc testwith SPSS 10.0.0 for Windows (SPSS Inc, Chicago, USA). The strut densities of the dried cement samples were mea-sured by helium pycnometry (Accupyc 1330, Micromeritics,Norcross, USA). These results and apparent wet and drydensities were used to calculate relative porosities. Rietveld analysis of XRD patterns X-Ray diffraction patterns of the set cements with a PLRof 3.3g m1- were recorded on a D5005 diffractometer(Siemens, Karlsruhe, Germany). Data sets were collected from20 =20-40°with a step size of 0.02° and the count time wasnormalised to 1 s/step. The phase composition was checkedby means of ICDD reference patterns for β-TCP (PDFRef. 09-0169), dicalcium phosphate dihydrate (DCPD) (PDFRef. 09-0077), hydroxyapatite (HA) (PDF Ref. 09-0432) andDCPA((PDF Ref. 09-0080). The phase composition ofpartially set samples was calculated on the basis of XRDRetsch PM400行星式球磨仪,500ml玛瑙罐, patterns by means of Rietveld analysis with TOPAS software(Bruker AXS, Karlsuhe, Germany). Equimolar amounts of the two cement powders were mixedin a vibrating unit prior to addition to the aqueous phase,whichi was a300,500,800,1000 or1500 mM aqueouscitric acid solution (Fisher, Loughborough,UK). To ensure Kinetic investigations with FTIR For kinetic investigations at time zero, equimolar mixtures ofthe powder reactants were hand-mixed for 30 s with 800, 1000or 1500 mM citric acid solution at PLRs of 2.0 and 3.3 g mland placed on the diamond of an ATR-FTIR Perkin ElmerSeries 2000 spectrometer temperature controlled at 37 °C(Perkin-Elmer Beaconsfield, UK with Timebase software).Additionally, studies were performed at 23℃ with 800 mMcitric acid solution; spectra were obtained with a resolution of4 cm-, every 12 s from 60 s until spectral absorbance changesbecame minimal. To aid peak assignment, reference spectra of citric acid(sharp intense C=O peaks at 1752, 1719 and 1681 cm),calcium citrate (broad intense COO asymmetric stretch at1554 cm and symmetric stretch at 1397 cm-), B-TCP(broad PO stretch at 1000 cm) and MCPM (sharp PO Table 1 Compressive strength, strut density and relative porosity for the investigated PLR-retardant concentration combinations. Standarddeviation (compressive strength) and minimum error of method (strut density, porosity) are given as error PLR/g ml Citric acid concentration/mM Compressive strength/MPa Strut density/g cm -3 Relative porosity (%) 2.0 300 10.9±1.1 2.35±0.05 41±1 500 6.4±1.5 2.37±0.05 41±1 800 6.2±0.4 2.35±0.05 43±1 1500 1.33±50.1 2.50±0.05 52±1 2.5 500 18.5 2.36±0.05 35±1 800 9.88+±2 2.35±0.05 36±1 1000 8.6±0.9 2.34±0.05 36± 3.3 1500 2.9±±0.2 2.50±0.05 48±1 500 23.5+ 2.39±0.05 26±1 800 23.1 2.37±0.05 27±1 1000 17.2±2.7 2.37±0.05 30±1 1500 6.1±0.9 2.49±0.05 37±1 stretch peaks at 1075, 955 and 850 cm) were also generated.To identify the products, final spectra were compared withthose of DCPA (monetite) and DCPD (brushite) from theliterature.23.24 Both these dicalcium phosphates (DCPs) havefour sharp distinctive PO/P-O(H) stretch peaks at comparablewavenumbers between 1150 and 870 cm, but whereas withDCPD all are strong, with DCPA the two between 870 and1000 cm are only of medium strength. Four sharp peaksbetween 3000 and 3600 cm(OH stretches) and one around1650 cm(H2O bend) are also present in the spectrum of3,24DCPD but not the anhydrous form, DCPA.,+ Generally, diamond ATR-FTIR spectra of liquids andsolutions give reproducible absolute absorbance but those ofsolids vary with particle size and the pressure applied by theATR unit. The spectrum of an“ideal”mixture or solution willbe the sum of the spectra of all the pure components weightedby their volume fractions in contact with the ATR diamond.Since the technique only penetrates a few microns into thesample surface the absorbance from solid particles of severalmicrons in a cement can be weak relative to the surroundingfluid phase, due to their low contact with the diamond. Withcements that set on the diamond, provided they do not detach,the absolute absorbance of both the initial fluid and finalsolid spectra can be reproducible. With crystallising cementsit should be noted, however, that the size and shape of thecrystals (finer particles will have higher contact with thediamond) as well as the chemical composition may affectthe absolute absorbance of the final spectrum. Results Compressive strengths and densities The compressive strengths, strut densities, and porosities forset cement samples of the investigated PLR-citric acid con-centration combinations are presented in Table 1. The results for low retardant concentrations could not be obtained forsome PLRs, especially the highest ones, as the cement pastesset during mixing, preventing sample preparation and inves-tigation. For a PLR of 3.3 g ml, however, with the lowestfeasible citric acid concentrations (500 and 800 mM), themeasured strengths of 23-24 MPa were significantly higherthan for any other PLR (p<0.01). For higher retardantconcentrations, 500 and 800 mM at PLR 2.0 g mland 800and 1000 mM at PLR 2.5 g ml, there was a significantdeterioration in strength (p<0.01) compared to the lowestretardant concentration at the same PLR. On raising the citricacid concentration to 1500 mM, however, a more dramaticdeterioration in mechanical strength occurred for all PLRs. The relative porosity of the set cement was at a maximum of52% for a PLR of 2.0 gmland a citric acid concentration of1500 mM, and at a minimum of 26% with a PLR of 3.3g mland a citric acid concentration of 500 mM. Strut densityhad an average value of around 2.36 g cmfor citric acidconcentrations of 1000 mM and lower, which increased toaround 2.50 g cmfor citric acid concentrations of 1500 mM. Phase identification by XRD The phase composition of a completely set cement for a PLRof 3.3 g mldid not change for retardant concentrations from500 to 1000 mM. The DCPA (monetite) content was between 7and 10%and the DCPD (brushite) content was between 90 and93% (see Table 2). At a retardant concentration of 1500 mMhowever, the DCPA content increased dramatically to around33% with only 67% brushite in the set cement. UnreactedMCPM and -TCP were not detected in the cement at allretardant concentrations investigated (see Table2). FTIR kinetic investigations: absorbance spectra Time-dependent absorbance spectra for cements with a PLR of3.3 g ml and an 800 mM citric acid concentration at 37C Table 2 Phase composition of completely set cement for different retardant concentrations at a PLR 3.3 g mlwith the Rwp factors indicating thequality of the Rietveld analysis fit Citric acid concentration/mM Brushite (DCPD) (%) Monetite (DCPA)(%) B-TCP(%) Rwp factor(%) 500 93 ±1 7±1 <1 9.8 800 92±1 7±1 <1 9.1 1000 90± 10±1 <1 10.4 1500 67±1 33±1 <1 12.1 Fig. 1 Development of FTIR spectra with time for cements at PLRof 3.3 g ml- at 37℃, prepared with citric acid concentrations of (a)800 mM and (b) 1500 mM. are given in Fig. la. The early FTIR cement spectra werecomparable with combined MCPM, β-TCP and water spectra,with the peaks stemming from citric acid being masked by thehigher concentrations of the other components. With time, fivesharp OH peaks associated with DCPD formation appeared asexpected at 3550, 3465,3255,3160 (data not shown) and1640 cm-on top of the broad “free"water bands. Additionalsharp PO peaks developed at 1110,1050,980 and 860 cm,consistent with dicalcium phosphate (DCP) formation (eitherDCPD or DCPA) (see Fig. 1a). Examples of absorbance spectra for cements with a PLR of3.3 g mland a 1500 mM citric acid concentration at 37Care given in Fig. 1b. In this case, there is initially limitedchange in the broad water bands around 3200 and 1640 cmor the P-O(H) peak at 980 cmdespite a significant increasein intensity of the DCP peaks at 1110 and 1050 cm. Instead,additional peaks at 1555, 1410 and 1010 cmappear (seeFig.2b). Those peaks at 1555 and 1410 cmare comparablein shape and position to the most intense peaks in the calciumcitrate spectra, but that at 1010 cm is in none of thereference spectra discussed above.The 1010 cmpeak is mostlikely, however, a PO stretch of an intermediate dicalciumphosphate-citrate (DCPC) complex stabilized in solution.After the initialperiod, theleDCP peaks at1110and Wavenumber (cm) Fig. 2Effect of time on difference spectra (calculated by subtractionof spectra at 100 s) for cements at 37°℃ prepared using a PLR of3.3 g ml-and citric acid concentrations of (a) 800 mM and (b)1500 mM. 1050 cmreached their maximum values, but the 1555,1410 and 1010 cmintermediate peaks were then slowlyreplaced by the 980 cmpeak from the final product DCP(see Fig. 1b) and sharp DCPD OH peaks at 3530, 3465,3255,3160 and 1640 cm. These results suggest that the peak at1050 cmis due to both DCP dissolved in the aqueous phaseand in any crystalline state, but that at 980 cmonly appearsupon crystallization and is expected to correspond with thesetting of the cement. Corresponding difference spectra for Fig. 1 obtained bysubtracting the spectra at 100 s from those at later times areprovided in Fig.2. All difference spectra in Fig. 2a and that atthe latest time in Fig. 2b exhibit comparable profiles asexpected if the same overall process is occurring. Those atintermediate times and higher citric acid concentrations,however, vary with time (see Fig. 2b) On reducing the PLR from 3.3 to 2.0 g ml, whilst keepingcitric acid concentrations constant, spectral changes werelargely similar to those discussed above. On reducing thetemperature,the major effect was on the reaction rates. Effectsof PLR and temperature are compared in more detail below,using absorbance profiles at 1050 and 980 cm where thegreatest absorbance change occurs during reaction, and also at Fig. 3Absorbance profiles at 980 and 1555 cm for cementsprepared using 800, 1000 and 1500 mM citric acid concentrations at37C with a PLR of 3.3 g ml. 1555 cmwhere changes are due only to the formation or lossof the citrate which forms intermediately. Absorbance changesat 1050 and 980 cmwill provide an indication of the relativerates of formation and crystallization of DCP, respectively. FTIR kinetic investigations: absorbance profiles After a delay period, the absorbances at 1050 and 980 cm一1increase to a maximum final value, whereas at 1555 cmitincreases to a peak value before declining towards its originallevel (see Fig. 3). The maximum absorbance change, A4max,at each wavenumber is provided in Fig. 4a for all samplesinvestigated. Comparing values provides an indication of therelative maximum concentrations of products and intermedi-ates in contact with the FTIR diamond. From repeat mea-surements the standard deviation was found to be around 10%. At 1050 cm , AAmax was observed to decline by averagefactors of 0.8 and 0.7 when reducing PLR or raising citricacid concentration from 800 to 1500 mM respectively, but wasless affected by temperature (see Fig. 4a) as the effect oftemperature was within the errors of the experiment. TheA4max value is expected to be proportional to the maximumconcentration of DCP (both in solution and in crystallizedform) that comes into contact with the FTIR diamond. Areduction in A4max at 1050 cmcould therefore be due eitherto less complete reaction or to the formation of a differentproduct with either poorer contact with the FTIR diamond orweaker absorbance at this wavenumber. The ratio of A4max at 980 cm- to that at 1050 cm-alsodecreased by,on average, by a further factor of 0.7 upon eitherreducing the PLR or raising the citric acid level, but thetemperature change had no observable effect as experimentalerror variations with temperature were not significant. Areduction in this ratio is expected if, at equilibrium, a higherfraction of the DCP remains stabilized in solution, or if thefinal product contains a higher level of DCPA relative toDCPD, since the former has a weaker peak at 980 cm. The A4max at 1555 cm- was too small to be determined at23℃, and on average was not significantly affected by PLR at37 C. It did, however, increase by an average factor of Fig. 4 Effect of citric acid concentration, PLR and temperature atdifferent wavenumbers on (a) maximum absorbance change AAmax, (b)time to half maximum absorbance change, t1/2 and (c) the apparentrate constant A4max/t1/2. 3.0 when raising the citric acid concentration from 800 to1500 mM (see Fig. 4a), indicating that higher maximum levelsof citrate are formed in solution. To compare the rates of intermediate and product forma-tion, the normalised absorbance change ( was calculated using where Ao and Ar represent the absorbance at the initial timeand time t. The time of half maximum absorbance change, t1/2, for all samples is given in Fig. 4b. When’is plotted againstthe normalised time, t divided by t1/2, all curves overlap up to"=0.8 irrespective of time,citric acid concentration (Fig. 5a),wavenumber or PLR (Fig. 5b), and even temperature. Beyond=0.8, values at 980, 1050 and 1555 cm-all tend to unity asthe normalised time t/ty/ approaches 1.5, whereas after thistime"remains largely constant at 980 and 1050 cm,but at1555 cm- it declines at a rate that increases with the raisedcitric acid concentration or PLR (see Fig. 5b). For 0.2 <(<0.6 the normalised curves could all be fittedby an expression of the form Eqn. (3) indicates a time delay of 0.4t1/2 before formation ofdetectable levels of either intermediates or products. The ti/values in Fig. 4b show that delay times at 37 °℃ and 1555 cmn-(dependent upon citrate formation) are on average onlyslightly shorter than those at 1050 cm(due to DCPformation) but much smaller than those at 980 cm-(arising Normalised time (t/t1/2) Fig.5 Normalised absorbance profiles at 37 °C at a wavenumber of(a) 980 cm for cements with 800 mM citric acid and PLR of3.3 g ml and (b) 1555 cm for cements prepared using 1000and 1500 mM citric acid with PLR of 2.0 g ml(,◇) or 3.3 g ml-(■,◆). with DCP crystallization). Also t1/2 was not noticably affectedby the PLR, but increased by an average factor of 1.7 onraising citric acid concentration from 800 to 1500 mM atall wavenumbers. At 23°C with 800 mM citric acid it wasdifficult to assess t1/2 at 1555 cm, but at both 1050 and980 cm-1t1/2 isS1more than doubled with lowering thetemperature from 37 to 23 °C. Combining eqn. (2) with the differential of eqn. (3) providesan equation that is proportional to the reaction rate after thedelay period In this expression A4max/t1/2 can be taken as an apparentrate constant and is provided in Fig. 4c. This apparent rateconstant for the 1050 cmpeak decreased on average byfactors of 0.8, 0.5 and 0.5 on reducing the PLR, raising thecitric acid concentration from 800 to 1500 mM, or reducing thetemperature from 37 to 23 °C, respectively. Correspondingaverage factors for the 980 cm peak were 0.6 (reducingPLR), 0.3 (raising citric acid concentration) and 0.5 (reducingtemperature). Neither PLR nor citric acid concentration,however, had a significant effect on the average rate constantfor the intermediate 1555 cmpeak (see Fig. 4c). Greatermaximum build up of the citrate concentration on raisingthe citric acid concentration is therefore not due to fasterformation of citrate, but its slower conversion backtocitric acid. DiscussionMechanical and density studies It has been shown in several studies that the compressivestrength of cement is connected to porosity and flaw size.25-27The wet compressive strengths of the cement in this study werereduced significantly with lower PLRs and/or at high citricacid concentrations. This deterioration could not, however, beentirely explained by increasing porosity as changes in densitywith citric acid concentration variation were relatively minorfor 500 to 1000 mM citric acid (see Table 1). Conversely,between 1000 and 1500 mM citric acid the porosity of the setcement increased dramatically,e.g. from 30 to 37% for a PLRof 3.3 g ml, see Table 1. Several XRD studies on slow setting hydroxyapatite-forming calcium phosphate cements have also shown thatthe final mechanical strength is directly correlated with thedegree of reaction.28,29 Set cement densities attained by heliumpycnometry in this study (Table 1) were typical of brushite(p~2.3 g cm3) for all PLRs and citric acid concentrationsfrom 500 to 1000 mM and quite different from the originalcement powder mixture density (p = 2.71 g cm3). Thisindicated a consistently high degree of conversion of thereactants for all PLR-citric acid concentration combinationsand also excluded an extensive generation of DCPA (monetite,p ≈ 2.9 g cm), the only other crystalline calcium phosphatewith a calcium to phosphate ratio of 1. At a citric acidconcentration of 1500 mM, however, the strut density of setcements increased to around 2.5 g cm. The quantitative Rietveld analysis of XRD patterns for a PLRof 3.3 gcmconfirmed that, for 500 to 1000 mM, the DCPAcontent was around 7-10%, with the rest being brushite whichis consistent with earlier findings of our group where thebrushite content of this cement system using citric acid as aretardant was found to be over 95%.For 1500 mM citric acidand a PLR of 3.3 g cmthe DCPA content in the set cementjumped to 33%. The latter finding is in accordance with thefindings of Bohner et al. where the deterioration in strength ofa brushite cement was explained by the presence of DCPA inthe final product.The high DCPA content in the set cementcan also explain the significant increase in relative porosity at1500 mM citric acid, see Table 1. As more DCPA was formed.less water was consumed in the settingreaction to formbrushite, see eqn. (1), and therefore more residual water waspresent, generating porosity and thus leading to the dramaticdeterioration in strength at 1500 mM for all PLRs. Thedeterioration in strength at 800 and 1000 mM, most noticeablyat PLRs of 2.0 and 2.5 g ml, where DCPA content andresulting relative porosity in the set samples were similar,could not, however, be explained by radically increased DCPAcontent in the final product. FTIR studies The observation of various isosbestic points (no absorbancechange with time) and identical FTIR difference spectra forthe 800 mM citric acid cements at PLRs of 3.3 g ml-irrespective of time suggests that any reactive intermediatesthat may be formed are quickly converted to the final pro-ducts. The peak positions are consistent in both position andrelative intensity with that of pure brushite (DCPD),23,24,30and therefore in agreement with XRD and density studies after24 h. The low absorbance of the PO peaks of the reactantparticles relative to those of the products could be, in part, dueto their initially larger size that limits contact with the flatATR-FTIR diamond. It is known that the presence of evensmall citric acid concentrations during brushite precipitationmakes brushite crystals smaller and rounder, i.e. less blade-like. Due to the limited range of citric acid concentrations inthis study it is considered unlikely that changes in crystallitesize or orientation with cement paste composition are causingthe variations in maximum absorbance levels. On raising the citric acid concentration, the differencespectra changed due to the formation of increasing levelsof reactive intermediates. The observation of peaks at 1555and 1410 cm- are consistent with the formation of COsymmetric and asymmetric stretching peaks of calcium citrateintermediates. The appearance of these at the same time asother sharp peaks at 1110, 1050 and 1010 cm, but noneinitially at 980, 1640 or 3300 cm, suggests a DCPC. Thehigh level of absorbance change with intermediate formationsuggests that the DCPC is likely to be well dispersedthroughout the aqueous phase, rather than on the originalparticles (which can make only limited contact with the ATRdiamond due to their size of 10-60 um). On raising the citric acid concentration, both AAmax at1050 cm- and the ratio of AAmax values at 980 cm- divided by those at 1050 cm-decline (Fig. 4a). Comparison with theXRD and porosity data indicate this to be due to greaterformation of DCPA compared with DCPD. The reduction inA4max at 1050 cm-upon lowering the PLR, however, is morelikely to be due to changes in cement porosity. From thecement porosities (see Table 1), the ratio of the final volumeoccupied by the solid at PLR 2.0 g ml divided by that at3.3 g ml-for a given citric acid concentration was onaverage 0.8. This was equal to the average level of reductionin A4max at 1050 cmobserved upon lowering the PLR.Since greater DCPA formation is not expected from XRDand density investigations, the decline in the AAmax value at980 cm- divided by that at 1050 cmwith reduction in PLRmay be due to higher levels of DCPC being stabilised insolution at equilibrium. From AAmax at 1555 cm(Fig. 4a) it can be seen thatthe maximum level of citrate formed increased with citricacid concentration, but not significantly with the PLR. Thiscitrate was converted back to citric acid more slowly ifthe PLR was lower (see Fig. 5b). It is therefore thoughtpossible that on storing the cement samples in water for 24 h(after whichcompressivestrengthhmeasurements wereperformed and the fragments dried) the citric acid mighthave slowly diffused out of the cement, thereby allowinggreater conversion of previously solution stabilised DCPto precipitate into DCPD and thus leading to a moreinhomogeneous and therefore weaker structure. This wouldthen explain the strength deterioration at 800 and 1000 mMcitric acid concentrations, despite the 24 h DCPA contentbeing as low as in samples made with 500 mM citric acid(see Table 2). It is thought possible that citric acid may be interactingwith the surface of the β-TCP particles, thereby delaying theirdissolution and DCP formation in solution. This could thenexplain the rise in the delay time and t2 at 1050 cm-withincreasing citric acid concentration. The value of t1/2 at980 cm- is expected to be related to the delay time beforethe cement begins to crystallize and set. Smaller values of t1/2at 1050 compared with 980 cm, particularly at high citricacid concentrations, suggest a further delay between formationof DCP in solution and its precipitation. This might beexplained if the citrate is additionally complexed with, and isstabilizing, the DCP in solution. The levels of reduction in the apparent rate constant at 1050and 980 cm with both increase in citric acid concentration(by a factor of 1.9) and reduction in the PLR suggest thatformation of DCPC and DCPD are approximately inverselyproportional to the citric acid concentration and to the squareof the citric acid concentration, respectively. This providesfurther evidence that the initial formation of DCP is inhibitedby citric acid, but then precipitation is further inhibited byDCP association with the citrate in solution. The apparentrate constants for the 1555 cm peak further demonstratethat raised levels of citrate in the cements with increased citricacid concentration or reduced PLRs are due to slower removalof the citrate in solution rather than faster initial formation.Finally, a reduction in temperature largely affects only the rateof reaction, not the final product or maximum levels of citrateintermediate. Conclusions The study presented shows that in a brushite-forming B-TCP/MCPM system withcitric acidasa setting retardant,mechanical strength deteriorated on raising the citric acidconcentration. ATR-FTIR spectroscopy indicated that, as thecitric acid concentration was raised, increasing levels of anintermediate DCP complex are formed, which increased a timedelay before any DCP precipitation. Kinetic analysis of theFTIR data also suggested that citric acid may additionallyinteract with theβ-TCP particles, thereby slowing theformation of the DCP complex in solution. These resultsprovidee evidence for alternative mechanisms of settingretardation in addition to the suggestion that retardation bycitric acid is due to its ability to chelate calcium ions.Reducing the temperature from 37 to 23℃ led to a slightlylarger increase in the time delay before DCP precipitationthan raising citric acid concentration from 800 to 1500mM,but altering PLR had little effect. Increasing the citric acidconcentration was the only factor found to noticeably raise themaximum level of citrate intermediate but reducing the PLRdid decrease its rate of removal.FTIR also provided evidencethat with raised citric acid concentrations some DCPA couldprecipitate instead of DCPD. From XRD and densitymeasurements after 24 h, only samples with high citric acidconcentrations (1500 mM) had significant levels of DCPA. Thestudy suggests that the presence of DCPA in the final setcement reduces the material strength by raising porosity.Significant citrate formation as an intermediate is also thoughtto reduce strength by increasing cement inhomogeneity. This study thereby clarified two things: (a) there is an upperlimit to the use of citric acid as a setting retardant for a fastsetting cement, a limit that can also be expected for the useof other setting retardants, and (b) real time ATR-FTIRmonitoring of a setting reaction comprises a useful comple-ment to the traditional before-after investigationsS.. Acknowledgements We acknowledge the financial support of the EU by the FP 6Mobility 5 Marie Curie Fellowship 500694 (M. P. H.). References ( 1 M . Bohner, I n jury, 2 000, 3 1,37-4 7 . ) ( 2 M . B o hner, F . T h eiss, D . A p elt,W. Hir s iger, R. Hou r iet, G. R izzoli, E. Gnos, C. Frei , J . A . Auer andB.vor R eichenberg, B iomaterials, 2003, 24 , 3463 - 34 7 4. ) 3 C. D. Friedman, P. D. Constantino, S. Takagi and L. C. Chow,J. Biomed. Mater. Res., 1998, 43, 428-432. 4 D. Knaack, M. E. P. Goad, M. Aiolova, C. Rey, A. Tofighi,P. Chakravarthy and D. D. Lee, J. Biomed. Mater. Res., 1998, 43,399-409. i U. Gbureck, J. E. Barralet, K. Spatz, L. M. Grover and R. Thull,Biomaterials, 2004, 25,2187-2195. 6 D. Apelt, F. Theiss, A. O. El-Warrak,K. Zlinszky, R. Bettschart-Wolfisberger, M. Bohner, S. Matter, J. A. Auer and B. vonRechenberg, Biomaterials, 2004, 25, 1439-1451. 7 A. A. Mirtchi, J. Lemaitre and N. Terao, Biomaterials, 1989,10,475-480. 8 M. Bohner, J. Lemaitre and T. A. Ring, J. Am. Ceram. Soc., 1996,79,1427-1434. 9J.. E. Barralet, L. M. Grover and U. Gbureck, Biomaterials, 2004,25, 2197-2203. 10 C. Pittet and J. Lemaitre, J. Biomed. Mater. Res. A, 2000, 53,769-780. 11 M. Bohner, H. P. Merkle, P. van Landuyt, G. Trophardy andJ. Lemaitre, J. Mater. Sci.,2000,11,111-116. 12 U. Gbureck, S. Dembski,R. Thull and J. E. Barralet, Biomaterials,2005,26,3691-3697. 13 ASTM C 266-99,ASTM International, 2002. 14 A. M. Viano, J. A. Auwarter, J. Y. Rho and B. K. Hoffmeister,J.Biomed. Mater. Res.,2001,56,593-599. 15 J. Carlson, M. Nilson, E. Fernandez and J. A. Planell,Biomaterials, 2003, 24,71-77. 16 G. J. P. Fleming, A. A. Farooq and J. E. Barralet, Biomaterials,2003,24,4173-4179. 17 M. P. Hofmann, S. N. Nazhat, U. Gbureck and J. E. Barralet,J. Biomed.Mater. Res., Part B, 2006, DOI: 10.1002/jbm.b.30550. 18 M. P. Ginebra, F. C. M. Driessens and J. A. Planell, Biomaterials,2004,25,3453-3462. 19 L. M. Grover, U. Gbureck, A. M. Young, A. J. Wright andJ. E. Barralet, J. Mater. Chem., 2005,15,4955-4962. 20 A. M. Young,S. A. Rafeeka and J. A. Howlett, Biomaterials, 2004,25, 823-833. 21U. Gbureck, O. Grolms, J. E. Barralet, L. M. Grover and R. Thull,Biomaterials, 2003, 24,4123-4131. 22 J. Lemaitre, A. Mirtchi and A. Mortier, Silic. Ind., 1987, 9-10,141-146. 23 J. Xu, I. S. Butler and D. F. R. Gilson, Spectrochim. Acta, Part A,1999,55,2801-2809. 24 L1. Tortet, J. R. Gavarri, G. Nihoul and A. J.Dianoux, J. SolidState Chem., 1997, 132, 6-16. 25 K. Ishikawa and K. Asaoka, J. Biomed. Mater. Res., 1995, 29,1537-1543. 26 J. E. Barralet, M. Hofmann, L. M. Grover and U. Gbureck, Adv.Mater., 2003,15,2091-2094. 27 T. Takahashi, M. Yamamoto, K. Ioku and S. Goto, Adv. Cem.Res., 1997,9, 25-30. 28 S. Sarda, E. Fernandez, M. Nilsson, M. Balcells and J. A. Planell,J. Biomed. Mater. Res., 2002, 61,653-659. 29 E. Fernandez, M. P. Ginebra, M. G. Boltong,F. C. M. Driessens,JJ. Ginebra, E. A. P. de Maeyer, R. M. H. Verbeeck andJT. A. Planell, J. Biomed.Mater. Res., 1996, 32, 367-374. 30 S. M. Arifuzzaman and S. Rohani,J. Cryst. Growth, 2004, 267,624-634. ( 31 K . S . T enhuisen and P. W. B r own, J. Mater. Sci.: M a ter. M e d., 1994,5,291- 2 98. ) HA B. Mater. Chem., his journal is C The Royal Society of Chemistry
确定
还剩6页未读,是否继续阅读?

产品配置单

弗尔德(上海)仪器设备有限公司为您提供《磷酸钙水泥骨架中形成过程检测方案(研磨机)》,该方案主要用于水泥/混凝土中形成过程检测,参考标准--,《磷酸钙水泥骨架中形成过程检测方案(研磨机)》用到的仪器有德国莱驰行星式球磨仪/机Retsch PM400
推荐专场


相关方案
更多