


方案详情
文
To develop an efficient high-performance liquidchromatography (HPLC)method for simple and sensitive determination of retinol (vitamin A),cholecalciferol (vitamin D3), and tocopherol (vitamin E) in milk-basednutritionals such as infant formula, adult formula, milk,yogurt, and cheese.
方案详情

Sample Preparation Table 2. Gradient program and valve switching. Thermo Fisher Scientific.Sunnyvale, CA USA isISO 9001 Certified.A Thermo Fisher Scientific Brand Zhang Yanhai,1 Jin Yan, Xu Qun, and Jeffrey Rohrer1Thermo Fisher Scientific, Shanghai, People’s Republic of China; 2Thermo Fisher Scientific, Sunnyvale, CA, USA Introduction Vitamins are a well-known group of compounds that areessential for human health. These compounds can beclassified into two main groups,water- and fat-soluble.Retinol (vitamin A), radiostol (vitamin D) and tocopherol(vitamin E) belong to the fat-soluble group, and playspecific and vital functions in metabolism. Health problemscan be present when these vitamins are either lacking orin excess. Our intake of vitamins depends on our diet.However, even foods that contain the necessary vitaminscan have reduced vitamin content after storage, processing,or cooking. Therefore, people take vitamin tablets and/orconsume milk-based products such as infant formula,adult formula, milk, yogurt, and cheese to supplement orincorporate these nutrients into their diet. For example,vitamin D is the name given to a series of compoundswith antirachitic activity. The most common compoundshaving vitamin D activity in foods are ergocalciferol(vitamin Dz) and cholecalciferol (vitamin D;).1 Vitamin D2is primarily found in wild mushrooms, while vitamin D isprimarily present in foodstuffs of animal origin (e.g., cow’smilk and breast milk); therefore, vitamin D, is usuallyfound in milk-based formulas such as infant formula andadult nutritionals.2 However, the amount of vitamin Dthat is derived from milk in milk-based formulas is usuallynot adequate for the needs of infants, and thus vitamin D,is added to infant formulas. The clean-up procedure is performed using a semi-prepar-ative normal phase HPLC method that is laborious as wellas time and organic solvent (n-hexane and 2-propanol)consuming. Therefore, an on-line two-dimensional HPLC(2D-HPLC) method, that is similar to the reported designfor the separation of vitamin D2 and D, in feedstuff, wasdeveloped to measure vitamin D as well as vitamins Aand E in milk-based samples. Figure 1. Structures of vitamins A, E, D2, and D. Equipment ·Thermo Scientific"Dionex"UltiMate" 3000 Rapid Separation Dual HPLC system, including: -DGP 3600RS Dual Ternary Pump System(P/N 5040.0066) with SRD-3600 Integrated Solventand Degasser Rack (P/N 5035.9230) - WPS 3000TRS Wellplate Sampler, ThermostattedP6820.2415amtsasampleoo822.0001) -TCC 3000RS Thermostatted Column Compartment(P/N 5730.0000) equipped with one 2-6 p and one2-10 p valve -A 500 pL stainless steel sample loop (P/N 6820.2454),for storage of the portion of the separation of the firstdimension -DAD-3000RS Diode Array Detector (P/N 5082.0020)with 13 pL flow cell (P/N 6082.0100) · Thermo Scientific""Dionex"ChromeleonChromatog-raphy Data System (CDS) software, version 7.2 · Thermo Scientific RT Stirring Hotplate(P/N SP136320-33Q) Reagents and Standards ·Deionized(DI) water, 18.2 MQ-cm resistivity,generatedby the Thermo ScientificBarnsteadGenPure" Pro Ultrapure water system withUV-photo-oxidation andTOC (total organic carbon) monitor (P/N 50131948) Acetonitrile (CH,CN), HPLC Grade (Fisher Scientific"P/N AC610010040) ·Methanol (CH,OH), 99.8%,HPLC Grade(Fisher Scientific P/N AC610090040) Ethanol, anhydrous (Fisher Scientific P/N A405P-4) ·Petroleum ether (Fisher Scientific P/N E139-1) ·Potassium hydroxide solution (KOH), 45%, w/w(Fisher Scientific P/N SP236-500) · Sodium sulfate (NazSO4),anhydrous (Fisher ScientificP/N S415500) · Sodium chloride (NaCl),299% (Fisher ScientificP/N S271-1) · Ascorbic acid (vitamin C), Tocopherol (vitamin E),retinol (vitamin A), ergocalciferol (vitamin D2), andcholecalciferol (vitamin D3),≥97%, (National Institutefor the Control of Pharmaceutical and BiologicalProducts [NICPBP], China) Consumables ·Thermo Scientific"Target2"Polypropylene SyringeFilters (0.45 um, 30 mm, P/N F2502-9) · Thermo Scientific Sun-SRi Luer-Lock Syringe(Fisher Scientific P/N 14-823-261) Preparation of Standard Solutions In the EU regulatory method, to calibrate the loss ofvitamin D in sample preparation, an internal standard(I.S.) calibration method is used for the quantitativedetermination of vitamins A, D, and E. If vitamin D is tobe determined, vitamin D2 is used as an I.S.’ Vitamin Dz isthus used as an I.S. in this work. Stock Standards 1 Three individual stock standards of vitamin A, E and D,are prepared. Dissolve ~0.025 g of vitamins A and D,and ~0.05 g of vitamin E in 25 mL methanol, respectively.The concentration of Stock Standard 1 of vitamin D, is1000 mg/L; that of vitamin A is 1250 mg/L, and that ofvitamin E is 2050 mg/L. Stock Standards 2 Dilute 200 pL of each Stock Standard 1 to 10 mL withmethanol, respectively. The concentration of StockStandard 2 of vitamin D, is 20 mg/L, that of vitamin A is25 mg/L, and that of vitamin E is 41 mg/L. Stock Internal Standard (I.S.) Solution Vitamin D, is used as an internal standard.Dissolve0.025 g of vitamin Dz in 25 mL of methanol. Theconcentration of the Stock I.S. Solution is 1000 mg/L. Mixed Standards for Calibration For calibration, prepare eight mixed working standardsolutions with different concentrations by diluting theproper amount of the Stock Standards with methanol.Vitamin D, is used as I.S. for the quantitative determinationof vitamin D. The volumes of each solution needed tomake the mixed standards are shown in Table 1. Table 1. Preparation of Mixed Standards for Calibration. Note: Vitamin D, is used as an internal standard (l.S.) for the quantitative determination of vitamin D. Twenty five milk-based samples including milk, infantformulas, adult formulas, cheeses, and yogurt were providedby one of the largest dairy manufacturers in China. Milk-Based Samples Sample preparation is based on the preparation specifiedin the China regulation (GB 5413.9-2010).8 For milk andyogurt samples, add 50 g of a sample and 1.0 mL of10 mg/L vitamin D2 (dilute 0.1 mL of vitamin Dz StockStandard 1 to 10 mL with methanol) to a 250 mL conicalflask. For infant/adult formula and cheese samples, add10 g of a sample and 1.0 mL of 10 mg/L vitamin D, to a250 mL conical flask, and then dissolve it in 30 mL of70°C DI water; allow it to cool to room temperature(~25°C), and then move the sample solution to a 250 mLconical flask. Add 100 mL of 15 g/L vitamin C-ethanolsolution (dissolve 3 g of vitamin C in 200 mL of ethanol),and 25 mL of 1.25 g/mL KOH (dissolve 125 g of KOH in100 mL DI water). After stirring at 1200 rpm and 60°Cfor 45 min, and then allowing the conical flask to standand cool to room temperature (~25°C), move thesolution to a 250 mL separatory funnel and extract threetimes with petroleum ether (100 mL each time). If there isemulsification (i.e., a foam forms) when extracting add 15mL of saturated NaCl solution (dissolve 40 g of NaCl in100 mL of DI water). Combine the three petroleum etherextracts and move to a 500 mL separatory funnel. Extractthe collected petroleum ether extracts four times with DIwater (25 mL each time), and then add 1 g of NazSO4(anhydrous) to remove the residual water. Let the mixture(petroleum ether and Na,SO4) stand in the 500 mLseparatory funnel until fully layered, and release thesubnatant to remove Na,SO from the petroleum ether.Use rotary evaporation at temperature not exceeding40C according to BS EN 12821:2009 or GB5413.9 tocondense the volume of petroleum ether extract to ~2 mL.Transfer the condensed petroleum ether extract to a 10 mLbrown volumetric flask, dry with nitrogen, and dilute tothe mark with methanol. The sample is stored at 4C.Before analysis, pass the prepared sample through a 0.45 pm filter. Spiked Milk-Based Formula Samples For milk and yogurt samples, add 50 g of a sample, 1.0 mLof 10 mg/L vitamin D2,and proper amounts of vitaminsA, E, and D, to a 250 mL conical flask. For infant/adultformula and cheese samples, add 10 g of a sample, 1.0 mLof 10 mg/L vitamin D2,and proper amounts of vitaminsA, E, and Dto a 250 mL conical flask, and then dissolveit in 30 mL of 70 °℃ DI water. After allowing the samplesolution to cool to room temperature (~25°C), move it toa 250 mL conical flask. Sample preparation is completedusing the procedures specified above. The spikedconcentrations of vitamins A, E and D in the milk-basedsamples are shown in the section titled Analysis ofMilk-Based Samples. Chromatographic Conditions First Dimension Column: Thermo Scientific Acclaim"" 120 C8, 3 um, 2.1 ×100 mm (P/N 059123) Column Temperature: 30°℃ Mobile Phase: A: CH,CN B: CH,0H C:H,O In gradient (Table2) Flow Rate: 0.4mL/min Injection Volume: 5pL UV Detection: Absorbance at 263 nm for vitamin D. 296 nm for vitamin E, and 325 nm for vitamin A Second Dimension Column: Thermo Scientific Accucore"Polar Premium, 2.6 um, 3.0×150 mm (P/N 28026-153030) Column Temperature: 30 C Mobile Phase: A: CH,CN B: CH,OH C:H20 In gradient (See Table 2) Flow Rate: 0.5 mL/min UV Detection: Absorbance at 263 nm for vitamin D Valve Switching: See Table 2 Results and Discussion Configuration of the On-Line Two-Dimensional HPLC Figure 2 shows the configuration of the 2-D HPLCsystem, which has two valves, one 6-port and one10-port, and two HPLC columns. The treated sample isinjected by the autosampler onto the first dimension andseparated with pump 1 using column 1, while column 2 issimultaneously equilibrated with pump 2 in the seconddimension (1_6 position on the 6-port valve and 1_2position on the 10-port valve). The portion of the firstdimension that elutes between 15.75 and 16.20 min isstored in a 500 pL loop (1_6 position on the 6-port valve,and 1_10 position on the 10-port valve)(Table 2).10 Thisloop connects positions 1 and 8 on the 10-port valve. Thecontents of the loop will be eluted with pump 2 onto thesecond dimension,where the analytes are separated usingcolumn 2 (1_2 position on both the 10-port and 6-portvalves). Compared to reported 2-D HPLC methods thatuse a SPE column to trap the analytes,l2 the contents ofthe 500 pL loop are diluted by the aqueous mobile phaseof the second dimension so that the solvent from thefirst-dimension mobile phase does not induce the vitaminpeaks from being bound on the second-dimension column. Time(min) First Dimension Valve Switching Second Dimension %A(CH,CN) %B(CH,0H) %C(H,0) 6-PortValvePosition 10-PortValvePosition Description %A(CH,CN) %B(CH,0H) %C(H,0) 0.00 50 0 50 1_6 1_2 Connect UV detector and the column on thefirst dimension, for thedetermination of vitaminsA and E, and clean-upof vitamin D 10 0 90 15.00 100 0 0 15.75 1_10 Store the elution from15.75 to 16.2 min in the500 pL sample Loop 16.20 1_2 Elute the contents ofthe loop onto thesecond dimension 17.00 1_2 1_10 Connect UV detector andthe column on thesecond dimension.for the determination of vitamin D 100 0 0 19.00 20.00 0 100 0 60 40 0 25.00 27.00 50 50 28.00 50 0 50 29.00 16 1_2 Complete the analysis,the valves return to theiroriginal positions 0 100 0 30.00 UV Detector Figure 2. Configuration of the on-line 2-D HPLC system. Optimization of the On-Line Two-DimensionalHPLC Method Having different retention mechanisms in the first andsecond dimensions is important to the construction of asuccessful on-line two-dimensional HPLC method. Normalphase (NP) as the first dimension and reversed-phase (RP)as the second dimension is ideal. However, for the on-linetwo-dimensional HPLC system, solvent incompatibility ofthe two dimensions can result in the analytes not beingretained in the second dimension. Using a micro column(e.g.,1×10 mm) in the first dimension and a solventevaporation interface were reported to eliminate theproblem of solvent incompatibility.11-13 However, the useof the micro column for first dimension and a typicalformat column for the second dimension decreasesdetection sensitivity;11,12 and analytes may be lost due toevaporation in the vacuum assisted dynamic solventevaporation interface.13 Therefore, in this work, reversed-phase is used for bothdimensions to decrease the effects of solvent incompat-ibility. Compared to the C18 stationary phase, the C8stationary had weak retention for the fat-soluble vitamins when using acetonitrile and methanol, the commonly usedHPLC mobile phase solvents. Moreover, use of a smallcolumn in the first dimension is beneficial to reducingelution volume, as well as decreasing any solvent incom-patibility. Therefore, the Acclaim 120 C8 (3 pm, 2.1×100 mm) and Accucore Polar Premium (C18, 2.6 um,3.0×150 mm) columns are used for the first and seconddimensions, respectively. Figures 3 and 4 show chromato-grams of a mixed standard of vitamins A, D2,D and Eand an infant formula sample (vitamin D2 already addedas an I.S.), respectively, using the specified two-dimensionalHPLC method. On the first dimension (retention time0-20 min), vitamins A and E are separated (Figures 3Aand 4A), while vitamin D peak in the infant formulasample cannot be discriminated, although it is observed inthe mixed vitamin standard. In the second dimension(retention time 20-30 min), chromatograms of the infantformula sample (Figure 4B) show efficient elimination ofinterferences, and baseline resolution between vitamins D2and D with a peak resolution of 2.2. Therefore, vitaminsA and E can be determined in the first dimension, andvitamin D can be determined in the second dimension. Figure 3. Chromatograms of (A) a mixedstandard vitamins A, D, D, and E resolvedusing the on-line two-dimensional HPLCmethod, and detected at (a) 263 nm,(b) 296 nm, and (c) 325 nm in the firstdimension (0-20 min) and the seconddimension (20-30 min), and (B) enlargedchromatograms of the second dimension(20-30 min). Peaks: 1-V,2-VD2, 3-Vp3,4-V. Figure 4. Chromatograms of (A) an infantformula with vitamin D, added as an l.S.resolved using the on-line two-dimensionalHPLC method, and detected at (a) 263 nm,(b) 296 nm, and (c) 325 nm in the firstdimension (0-20 min) and the seconddimension (20-30 min), and (B) enlargedchromatograms of the second dimension(20-30 min). Peaks:, 1-V,2-Vp2,3-VD3,4-Ve. In this on-linetwo-dimensional HPLC method, vitaminsD, and D co-elute in the first dimension, and are sent tothe 500 pL loop. This may remove interferences (Figure 5). Method Reproducibility, Linearity,and Detection Limits Method precision was estimated by making six consecutive5 pL injections of a Mixed Standard for Calibration (No. 6,Table 1) with concentrations of 0.625 mg/L for vitamin A,2.05 mg/L for vitamin E, 0.10 mg/L for vitamin D, and0.10 mg/L for vitamin D. Retention time RSDs all are lessthan 0.1%, and peak area RSDs all are less than 1.0%,demonstrating good short-term precision for this method. Calibration linearity of vitamins A, E, and D wasinvestigated by making three consecutive 5 pL injectionsof the Mixed Standards for Calibration prepared at eightdifferent concentrations (i.e., 24 total injections). Theinternal standard method using vitamin D2 as the I.S. isused to establish the calibration curves and to quantifyvitamins A, E, and D in samples. Different linearityranges for three compounds were observed when plottingconcentration versus peak area. Detailed calibration datacalculated by Chromeleon CDS software are shown inTable 3. Figure 5. Chromatogram of a mixed standard solution of vitamin Dz (1.0 mg/L) and vitamin D,(0.5mg/L) in the first dimension (15-20 min) and the second dimension (20-30 min). Peaks: 1-Vp22-Vp3 Table 3. Calibration data. Six consecutive 5 pL injections of a mixed standard forcalibration (No. 6, Table 1) with concentrations of 0.25 mg/Lfor vitamin A, 0.41 mg/L for vitamin E, 0.02 mg/L forvitamin D3, and 0.10 mg/L for vitamin D2 were used forestimating method detection limit (MDL) using a signal-to-noise ratio (S/N) = 3. The calculated S/Ns and MDLsare summarized in Table 4. Vitamin Regression Equation r2 Range (mg/L) A A= 1.291c+0.124 0.9991 0.25-60 E A=0.487c+1.491 0.9998 0.41-1025 D: A=960.3c-22.91 0.9993 0.02-5.0 Table 4. S/Ns of vitamins A, E and D, and calculated MDLs for each compound. Vitamin DetectionWavelength (nm) Concentration(mg/L) S/N MDL(mg/L) A 325 0.25 65 0.012 E 296 0.41 12 0.103 D 264 0.02 6.3 0.01 Analysis of Milk-Based Formulas Twenty five milk-based samples were determined using thison-line two-dimensional HPLC method. The results aresummarized in Table 5. Vitamin D was found in all thesamples, while vitamin D2 was not found in any sample.Vitamin A was found in some formula and cheese samples;and vitamin E was detected only in some formula samples.:S.The results obtained by using the GB method are alsolisted in Table 5. Comparison of the results obtained by thetwo methods shows equivalent results. Figure 6 showschromatograms of infant formula No. 10 and the samesample containing I.S. vitamin D. To judge methodaccuracy, recoveries of the milk-based samples spiked withvitamin A, E, and D, standards (spiked concentrationsshown in Table 6) were investigated. The recovery rangesare 91.2-103.7% for vitamin A, 89-95% vitamin E, and75.5-85.0% (absolute recovery), for vitamin D, demon-strating that this method is suitable for the determinationof fat-soluble vitamins in milk-based nutritionals. Two-dimensional HPLC simplified the determination ofvitamins A, E, and D in milk-based nutritional samples.This analysis using a dual UltiMate 3000 system andChromeleon chromatography data system software is anefficient means to determine Vitamin D, which is notcompletely resolved in the first dimension of the milk-basednutritional samples analyzed. min Figure 6. Chromatograms of (a) a mixed vitamin D, and D, standard,(b) an infant formula sample (No. 10) with vitamin D added as anI.S., and (c) the same infant formula sample using the on-line two-dimensional HPLC method, and detected at 263 nm on the seconddimension (20-30 min). Peaks:, 1-Vp2,2-Vp3. Table 5. Detected amounts of vitamins A, E, and D, in milk-based nutritional samples. SampleNo. Sample 2-D HPLC Method GB Method 2-D HPLC Method GB Method 2-D HPLC Method GB Method 1 Adult Formula 2.85 2.53 90.0 78.9 2.91 2.99 2 2.70 2.65 86.8 76.9 2.70 2.91 3 2.66 2.58 88.5 79.1 2.80 2.92 4 10.9 11.1 5 9.92 9.87 - 一 - 6 9.55 9.02 7 8.86 7.98 - 8 InfantFormula 7.20 7.41 543 506 9.67 8.07 9 8.24 7.78 556 504 8.80 8.09 10 11.13 10.5 11 Cheese 6.46 6.62 411 422 12 6.90 6.15 358 392 13 6.75 5.73 401 414 - 14 9.88 9.24 401 414 15 8.26 8.04 411 451 - - 16 8.53 7.70 17 16.4 17.0 - 18 Milk 1.18 1.57 - 一 19 1.13 1.07 - 20 0.92 1.14 - - 21 2.58 2.58 22 Yogurt 0.73 0.78 一 - 23 0.69 0.60 24 0.73 0.65 - - 25 0.77 0.67 Note: “-"represents "not detected". Table 6. Recoveries of vitamins A, E, and D, in the spiked milk-based nutritional samples. Sample Vitamin D:(ug/100g) Vitamin A (ug/100g) Vitamin E (mg/100g) Added Recovery(%) Added Recovery Added Recovery Adult Formula 20.0 82 24.4 76 Infant Formula 37.4 77 Cheese 11.9 85 一 Milk 9.54 81 62 94 1.03 92 2.34 82 124 91 2.06 89 7.56 80 186 104 3.09 96 Note:“-"represents "not detected". ( 1. Perales, S.; Alegria, A.; Barbera , R.; Farre , R . Review:Determination of Vitamin D in Dairy Products by HighPerformance Liquid Chromatography. Food Science and T echnology International. 2005, 11: 451-462. ) ( 2. BS EN 12821: Foodstuffs -Determination of vitamin D by high performance liquid Chromatography -Measurement of cholecalciferol (D3) or ergocalciferol (D2). European Union, April, 2009. ) ( 3. Dionex (now part of Thermo Fisher Scientific) Applica- tion Note 216: Determination of Water- a nd Fat-Soluble Vitamins in Functional Waters by HPL C with UV-PDADetection, Sunnyvale, CA, 2009.[Online] h t tp : //www. th ermoscie n tific . com / cont e n t / d am/t f s/ A T G/CMD/ CMD % 20Documents/ A pplicat i o n %20&%20 T echni - cal% 20 No t es/Chro m a t o g raphy/ L i qu id % 20C h ro m atogra p h y/ L iq ui d%20 Ch r omatogr a phy % 2 0 Mo d ules/Detectors/71938 - A N 216-HP LC- V i tami n s- F unct i on a l W at e rs -30April09-L P N2 14 5. pd f ( a ccessedNovember 27,2014) ) ( 4 . Dionex (now part of Thermo Fisher Scientific) Applica- tion Note 251: Determination of Water-a n d Fat-SolubleVitamins in Nutritional Supplements by HPLC with UV Detection, Sunnyvale, CA, 2010.[Online] htt p:/ / w ww. t hermos c ie n t i fic . com/c o nt e nt/dam/t f s / A TG / C MD/ C M D% 2 0D o c u ment s/ Applicat i o n % 20& % 2 0 T e c h ni -c a l%20Not e s/Chromatogr a phy%20 Co l u m ns%20and %2 0Su p p li e s/S o l i d %20Phase%20Extraction % 2 0 P roducts/S ol i d%2 0 Pha s e% 2 0 E x t r ac tion% 2 0 Co l umns/87 1 81- A N251-H P L C -vitamin-su p plements-2 5 J u n e 20 1 0-LP N 253 3 .pdf (a ccessedNovember 27, 2014) ) ( 5. Dionex (now p a rt of Thermo Fi s her Scientific) Technique Note 89: D etermination of Water- a nd Fat-Soluble Vitamins b y HPLC, Sunnyvale, CA, 2010.[Online] h ttp: // www.th e r m o sc ient i f i c. com / cont e n t /dam/ tf s/ A TG / CMD / CMD%20 Do cument s/A ppli ca t ion%20&%2 0 Technical%2 0 Not e s /C h romato gr a phy %20 Co l - u mns%20a n d % 20Supplies/HPLC % 2 0 Columns / HP L C %20 C olum n s%20 ( 3um)/887 8 4- T N89 - H PL C - WaterFatS o lubleVitam i ns-27Oct201 0 -LPN25 9 8 . pdf (accessed November 27, 2014) ) ( 6. Thermo Scientific Application Note 1069: Two-Dimen- sional HPLC Determination of Water-Soluble Vitamins in a Nutritional Drink, Sunnyvale, CA, 2013.[ O nline] h t t p : / /www.the r mos c ie nt ific. co m/ c on t e n t/dam / tfs /A T G / C M D/ CM D %2 0 D ocu m ents / AN- 1 0 6 9 -Determi n at i o n - W at e r-Soluble - Vita m ins - Nutritional-Dr i nk-A N 70755-E. p df (accessed November 27, 2014) ) 7. Sert, D.C.; Molitor, B.E. Liquid ChromatographicDetermination of Vitamin D in Milk and InfantFormula.J. AOAC Int. 1985, 68: 177-182. 8. GB 5413.9-2010: Determination of Vitamins A, D, E inFoods for Infants and Young Children. National Healthand Family Planning Commission of the People’sRepublic of China: Beijing, 2010. ( 9. Thermo Scientific Application Brief 174: Two-Dimen- sional HPLC Separation of Vitamin D in Feedstuff.[Online] h ttp:/ / www.t h ermosc ie ntific .c om / con t e n t / da m /tfs / ATG/CMD/ c md-d oc u m en t s/sc i -r e s/app / ch r o m /lc/ sy s/ AB - 1 7 4 - L C -2D -HP LC- V i tam i n-D- F e e d stu ff-A B 71368- EN.pdf (accessed November 27,2014) ) ( 10. Thermo Scientific Application Brief 165: Determinationof p-Toluenesulfonic Acid in Water-Insoluble Drugs,Sunnyvale, CA, 2013.[Online] h t t p : //www.t h e r m o s c i - e n t ifi c. co m/c ontent /d a m/ tfs/AT G /C M D /c md-docu m ents / s ci - res / a pp /c h ro m / i c/sys/A B -1 6 5- I C -p-Tolu e n e s ul- f o n i c- A ci d - W ate r- I nso l u bl e - D r ugs-A N71 1 5 3 -E N . p df (accessed November 27, 2014) ) ( 11. Dugo, P ; Favoino,O.;Luppino,Rosario; Dugo, G.; Mondello, L . Comprehensive Two-DimensionalNormal-Phase (Adsorption)-Reversed-Phase Liquid Chromatography. Anal. C hem. 2004, 7 6 :2 5 25-2530. ) ( 12. Fischer,J; Lahovska, H.; Novotna, K. ; Cesla, P.; Kolarova, L. Two-Dimensional Liquid Chromatography Normal-Phase and Re v ersed-Phase Separation of (co)Oligomers. J. Chromatogr. A, 2006, 1119: 3-10. ) 13. Ding, K.; Xu, Y.; Wang, H.; Duan, C.F; Guan, Y.F. AVacuum Assisted Dynamic Evaporation Interface forTwo-Dimensional Normal Phase/Reverse Phase LiquidChromatography. J. Chromatogr. A, 2010, 1217:5477-5483. Recommended conditions of HPLC Chromatographic Conditions First Dimension Column: Thermo Scientific MAcclaimM 120 C8, 3 pm, 3.0×150 mm(P/N 068970) Mobile Phase: A: CH3CN B: CH30H C: H20 In gradient (Table 7) Column Temperature 35°C Flow Rate 0.5mL/min Injection Volume: 10pL UV Detection: Absorbance at 264 nm for vitamin D, 296 nm for vitamin E, and 325 nm for vitamin A Second Dimension Column: AccucoreTM Polar Premium. 2.6pm,3.0×150 mm (P/N 28026-153030) Mobile Phase: A: CH3CN B: CH30H C: H20 In gradient (See Table 7) Flow Rate 0.6 mL/min UV Detection: Absorbance at 264 nm for vitamin D Valve switching See Table 8 Table 7. Gradient programs of one-dimensional and two-dimensionalseparation One-dimension analytical pump Two-dimension analytical pump Time (min) A% B% C% Time (min) A% B% C% 0 50 0 50 0 10 0 90 2 50 0 50 21 10 0 90 15 100 0 0 23 100 0 0 20 0 100 0 31 60 40 0 27 50 50 0 33 60 40 0 30 50 50 0 34 0 100 0 31 50 0 50 35 0 100 0 40 50 0 50 35.2 10 0 90 www.thermoscientific.com/chromatography C2015 Thermo Fisher Scientific Inc. All rights reserved. ISO is a trademark of the International Standards Organization.All other trademarks are the property of Thermo Fisher Scientific and its subsidiaries. This information is presented as an example of thecapabilities of Thermo Fisher Scientific products. It is not intended to encourage use of these products in any manners that might infringethe intellectual property rights of others. Specifications, terms and pricing are subject to change. Not all products are available in all countries.Please consult your local sales representative for details. Africa +431 333 50 340 Denmark +45 70 23 62 60 Japan +81 6 6885 1213 Australia +61 3 97574300 Europe-Other +43 1 333 50 340Korea +82 2 3420 8600 Austria +43 810 282 206 Finland +358 9 3291 0200 Latin America +1 561 688 8700 Belgium +32 53 73 42 41 France +33 1 60 92 48 00 Middle East +43 1 333 50 34 0 Brazil +55 11 3731 5140 Germany +49 6103408 1014 Netherlands +31 76 579 55 55 Canada +1 800 530 8447 India +91 22 6742 9494 New Zealand +64 9 980 6700 ( Russia/CIS + 43 1 333 50 340 Singapore +65 6289 1190Sweden +468 55646800 Switzerland +41 6 1 7167700 Taiwan + 8862 8751 6655 UK/Ireland +44 1442233555 USA + 1 8 00 532 4752 ) Table 8.Valve-switching time and process Time-min Left valve Right valve 0 6_1 2_1 18.9 6_1 10_1 19.2 6_1 2_1 23 1 2 10_1 35 6_1 2_1 Typical chromatogram 18.0- 60.07 266.46 213.26 40.0- 15.0 20.0 目10.0- -20.0- 300 Wavelength [nm] 70.0 265.75 5.0- 0.0 0.0-J 200 300 25.0 30.0 35.0 Wavelength [nm] Time [min] Figure 7. Chromatogram of infant formula spiked with VD2 Vitamins are a well-known group of compounds that areessential for human health. These compounds can beclassified into two main groups, water- and fat-soluble.Retinol (vitamin A), radiostol (vitamin D) and tocopherol(vitamin E) belong to the fat-soluble group, and playspecific and vital functions in metabolism. Health problemscan be present when these vitamins are either lacking orin excess. Our intake of vitamins depends on our dietHowever, even foods that contain the necessary vitaminscan have reduced vitamin content after storage, processing,or cooking. Therefore, people take vitamin tablets and/orconsume milk-based products such as infant formula,adult formula, milk, yogurt, and cheese to supplement orincorporate these nutrients into their diet. For example,vitamin D is the name given to a series of compoundswith antirachitic activity. The most common compoundshaving vitamin D activity in foods are ergocalciferol(vitamin D2) and cholecalciferol (vitamin D3).1
确定


还剩9页未读,是否继续阅读?

产品配置单
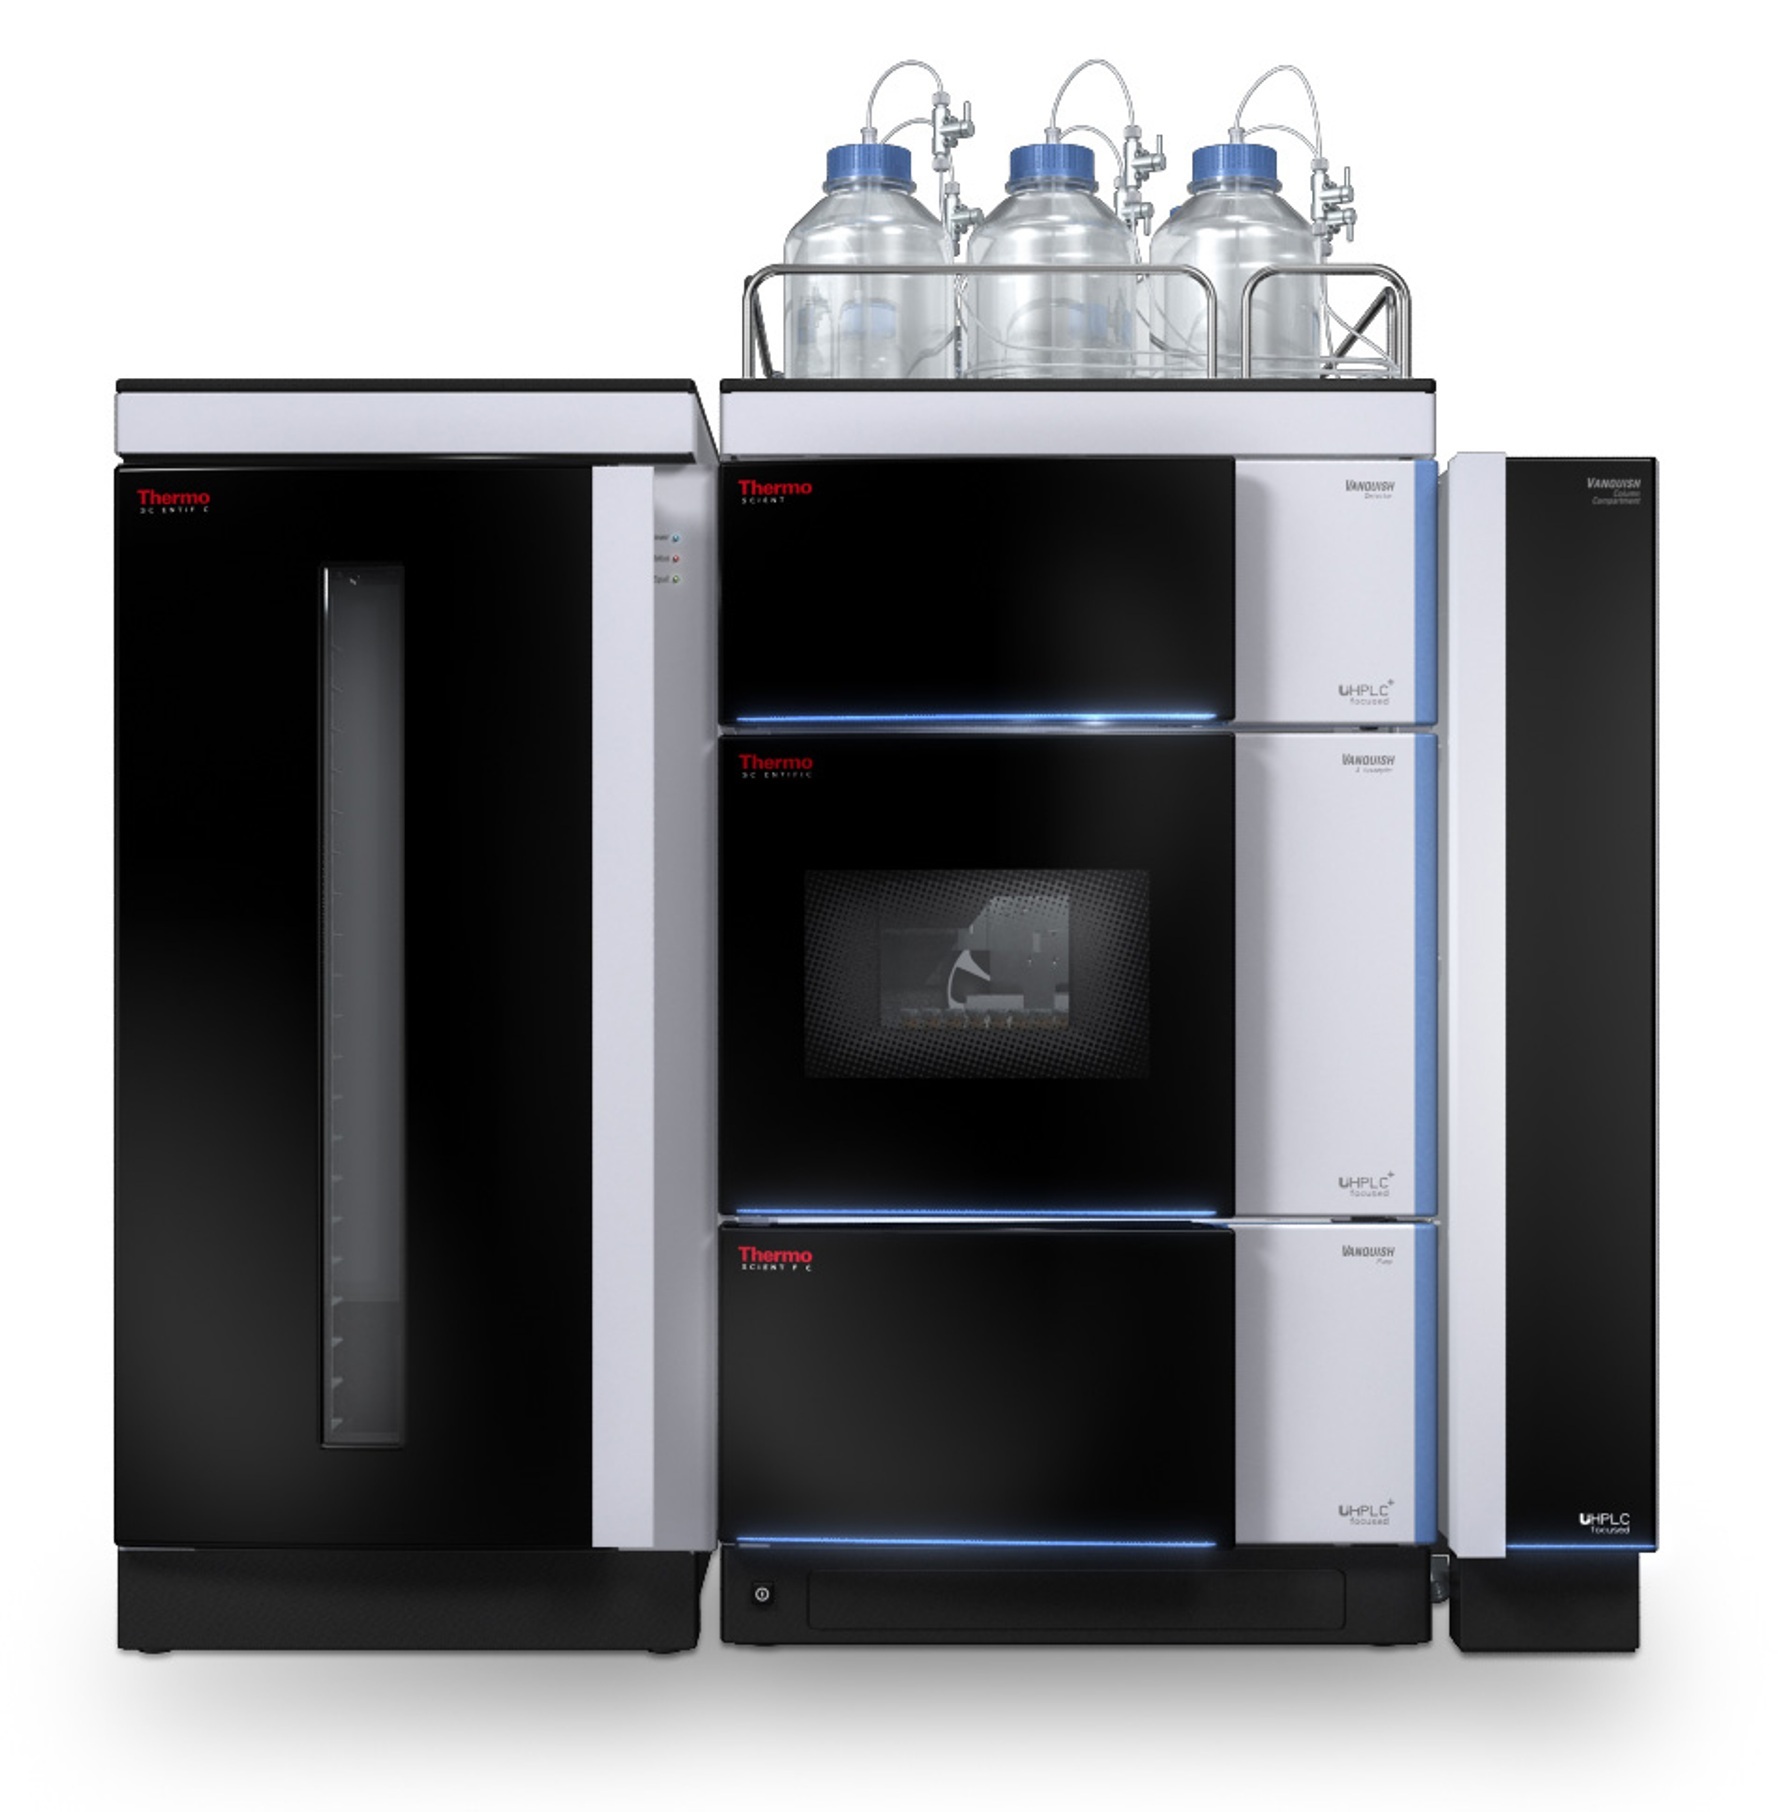
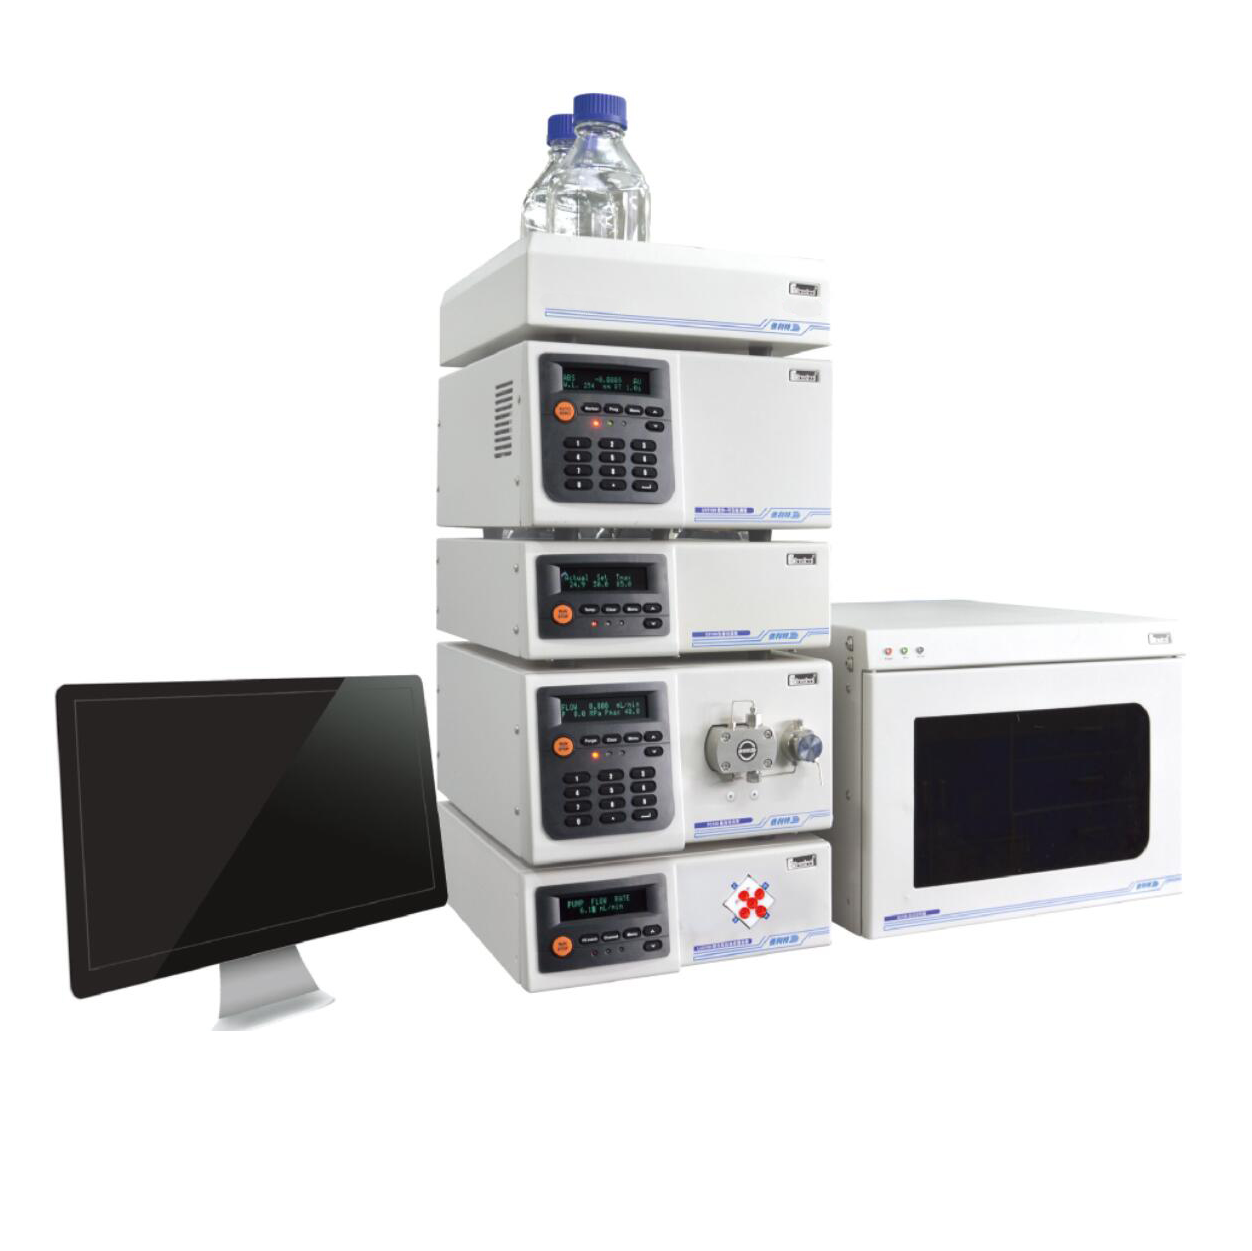
赛默飞色谱与质谱为您提供《营养品中维生素A、E和D3含量检测方案(液相色谱仪)》,该方案主要用于液体乳中营养成分检测,参考标准--,《营养品中维生素A、E和D3含量检测方案(液相色谱仪)》用到的仪器有赛默飞 Vanquish™ UHPLC超高效液相色谱系统、赛默飞UltiMate3000制备液相色谱
推荐专场
相关方案
更多
该厂商其他方案
更多