


本文展示了通过纳米傅立叶红外光谱技术(nano-FTIR)进行的对蛋白质结构以30nm横向空间分辨率的进行光学成像的结果,以及nano-FTIR对单根蛋白质复合物的敏感度。本文展示了对病毒,铁蛋白(Ferritn)复合物,紫膜(purple membranes),胰岛素聚合物的局部光谱,并通过它们的a-螺旋 和/或者 b-页状结构进行解释。研究者同样通过nano-FTIR对胰岛素纤丝进行了研究。胰岛素纤丝是一种广泛应用于神经组织退化疾病研究的模型系统,实验结果表明3nm直径的淀粉样纤丝含有大量的a-螺旋结构。此结果揭示了在纤丝周围的蛋白质具有的令人惊讶的高度有序性,这个结果也许可以作为解释纤丝结合的原因。作者预见nano-FTIR将在如细胞受体的离体成像,和蛋白质四机构的分析等众多领域中有着广泛的应用潜力。
方案详情

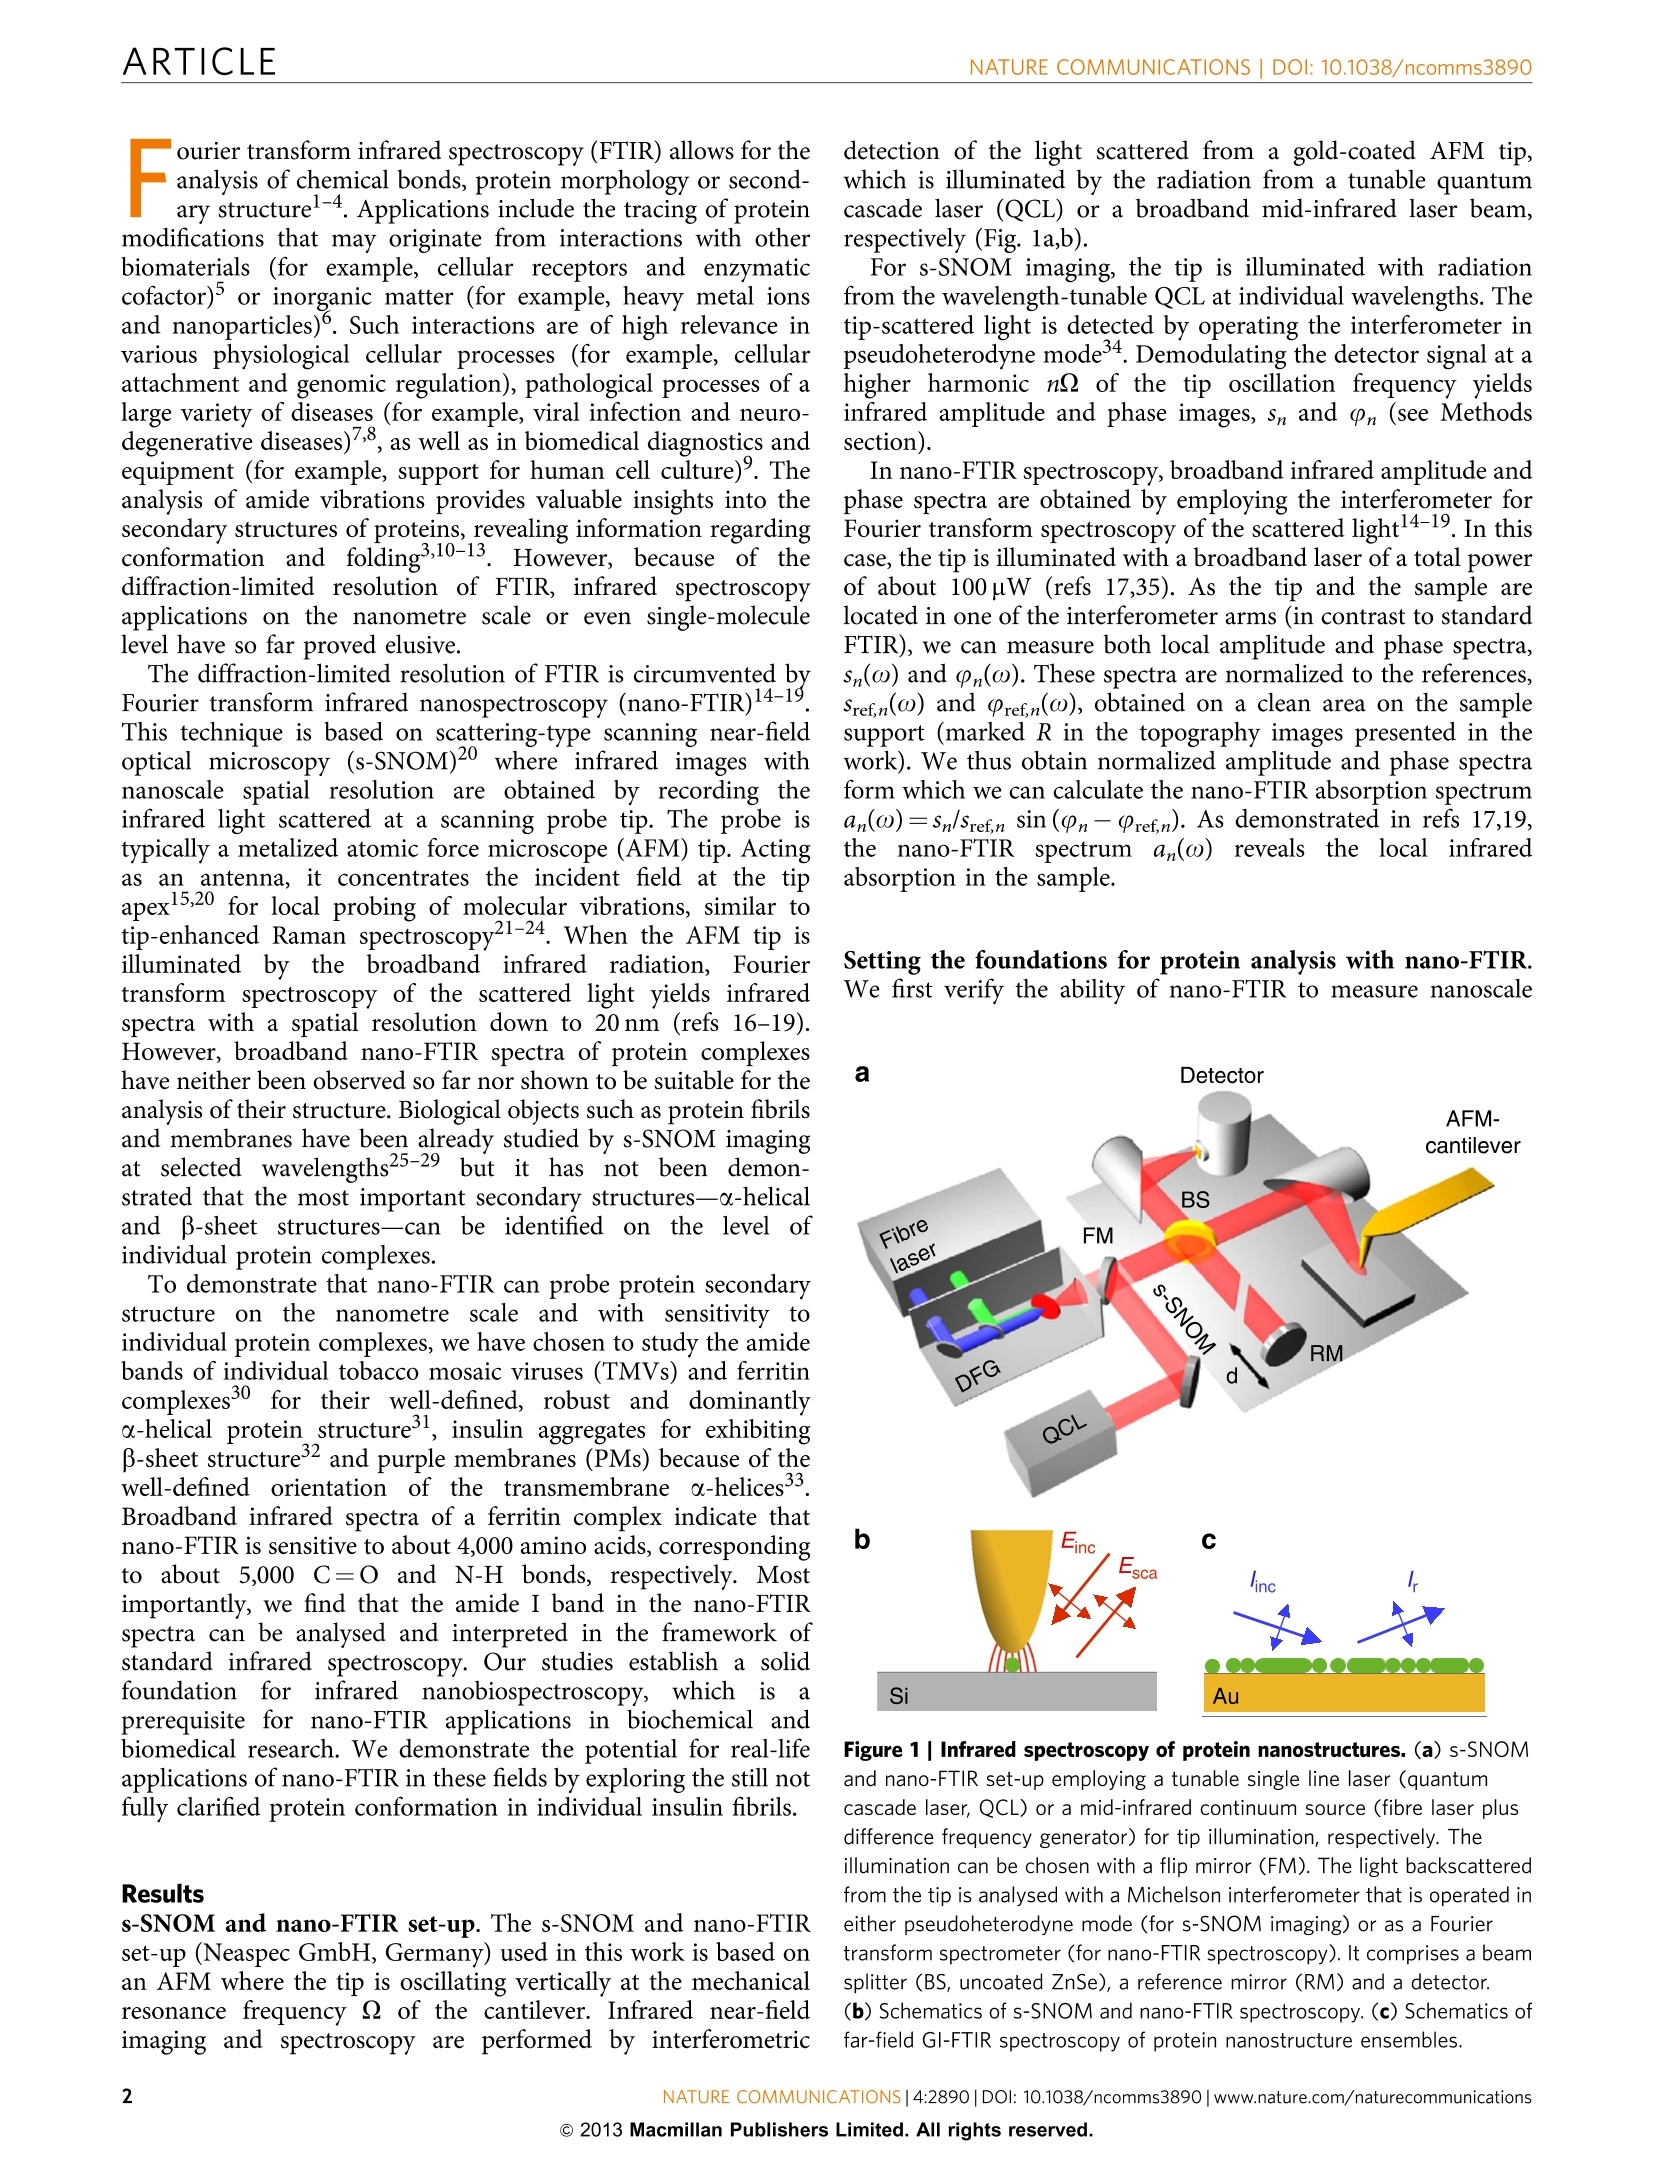
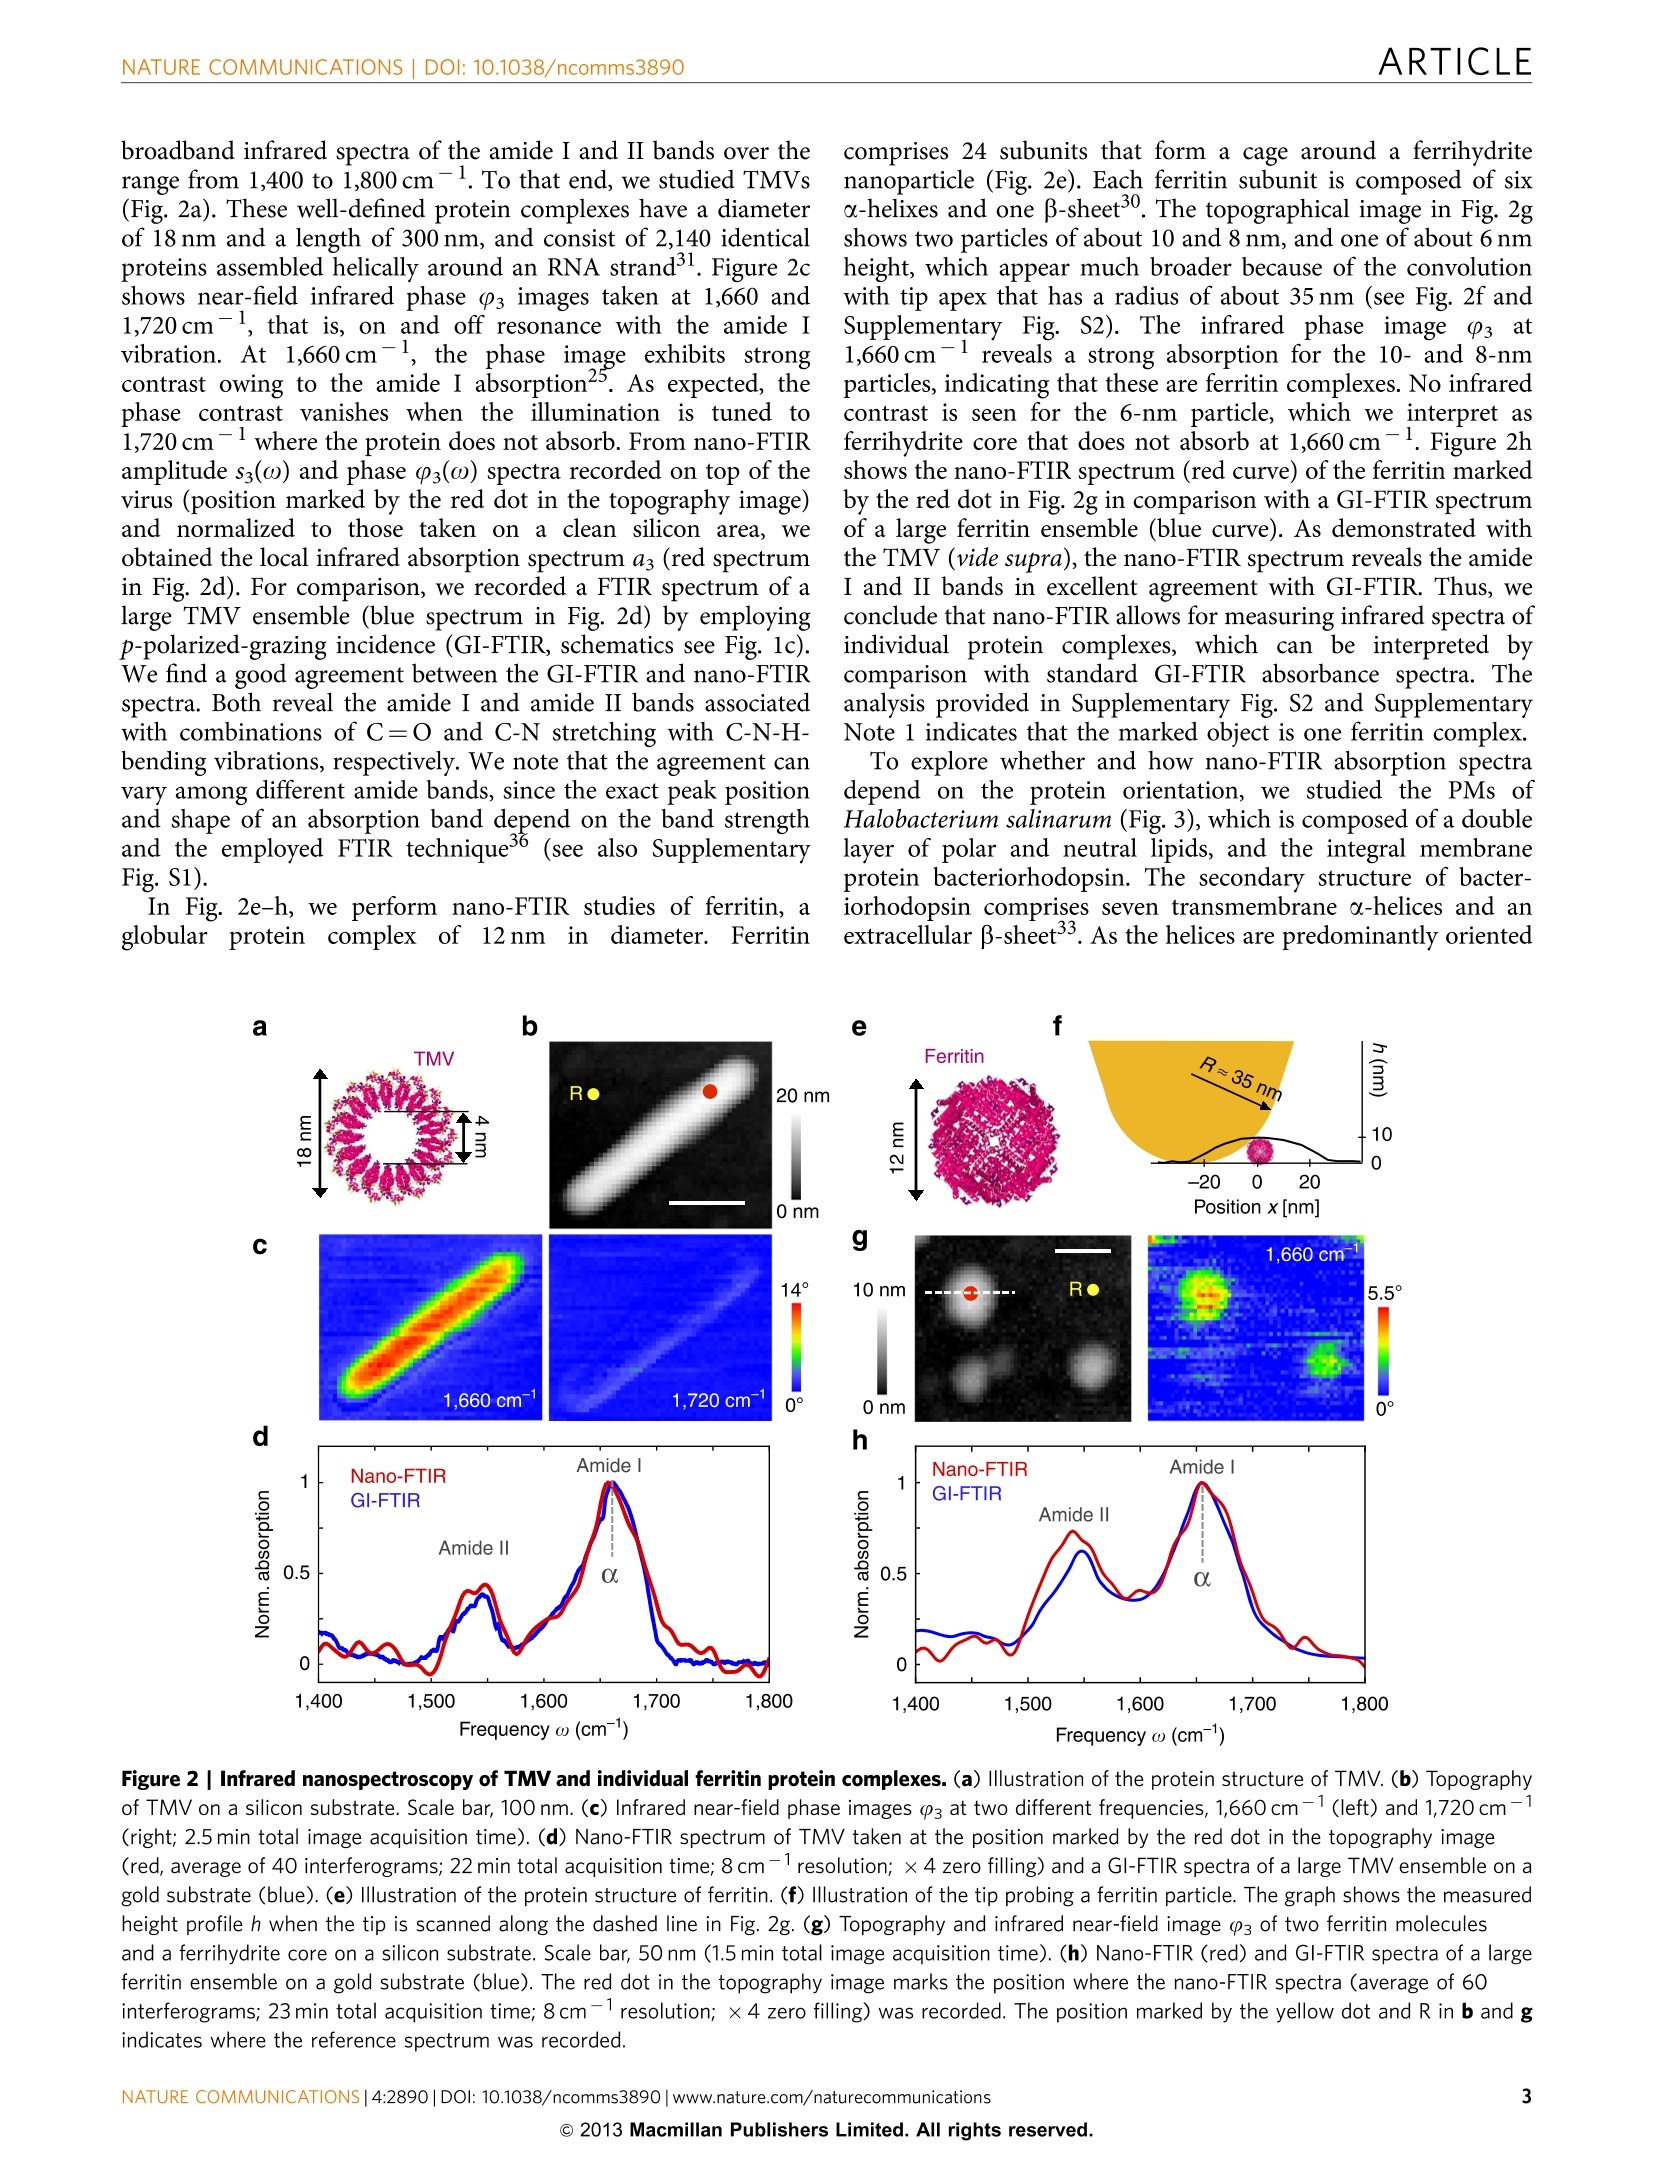
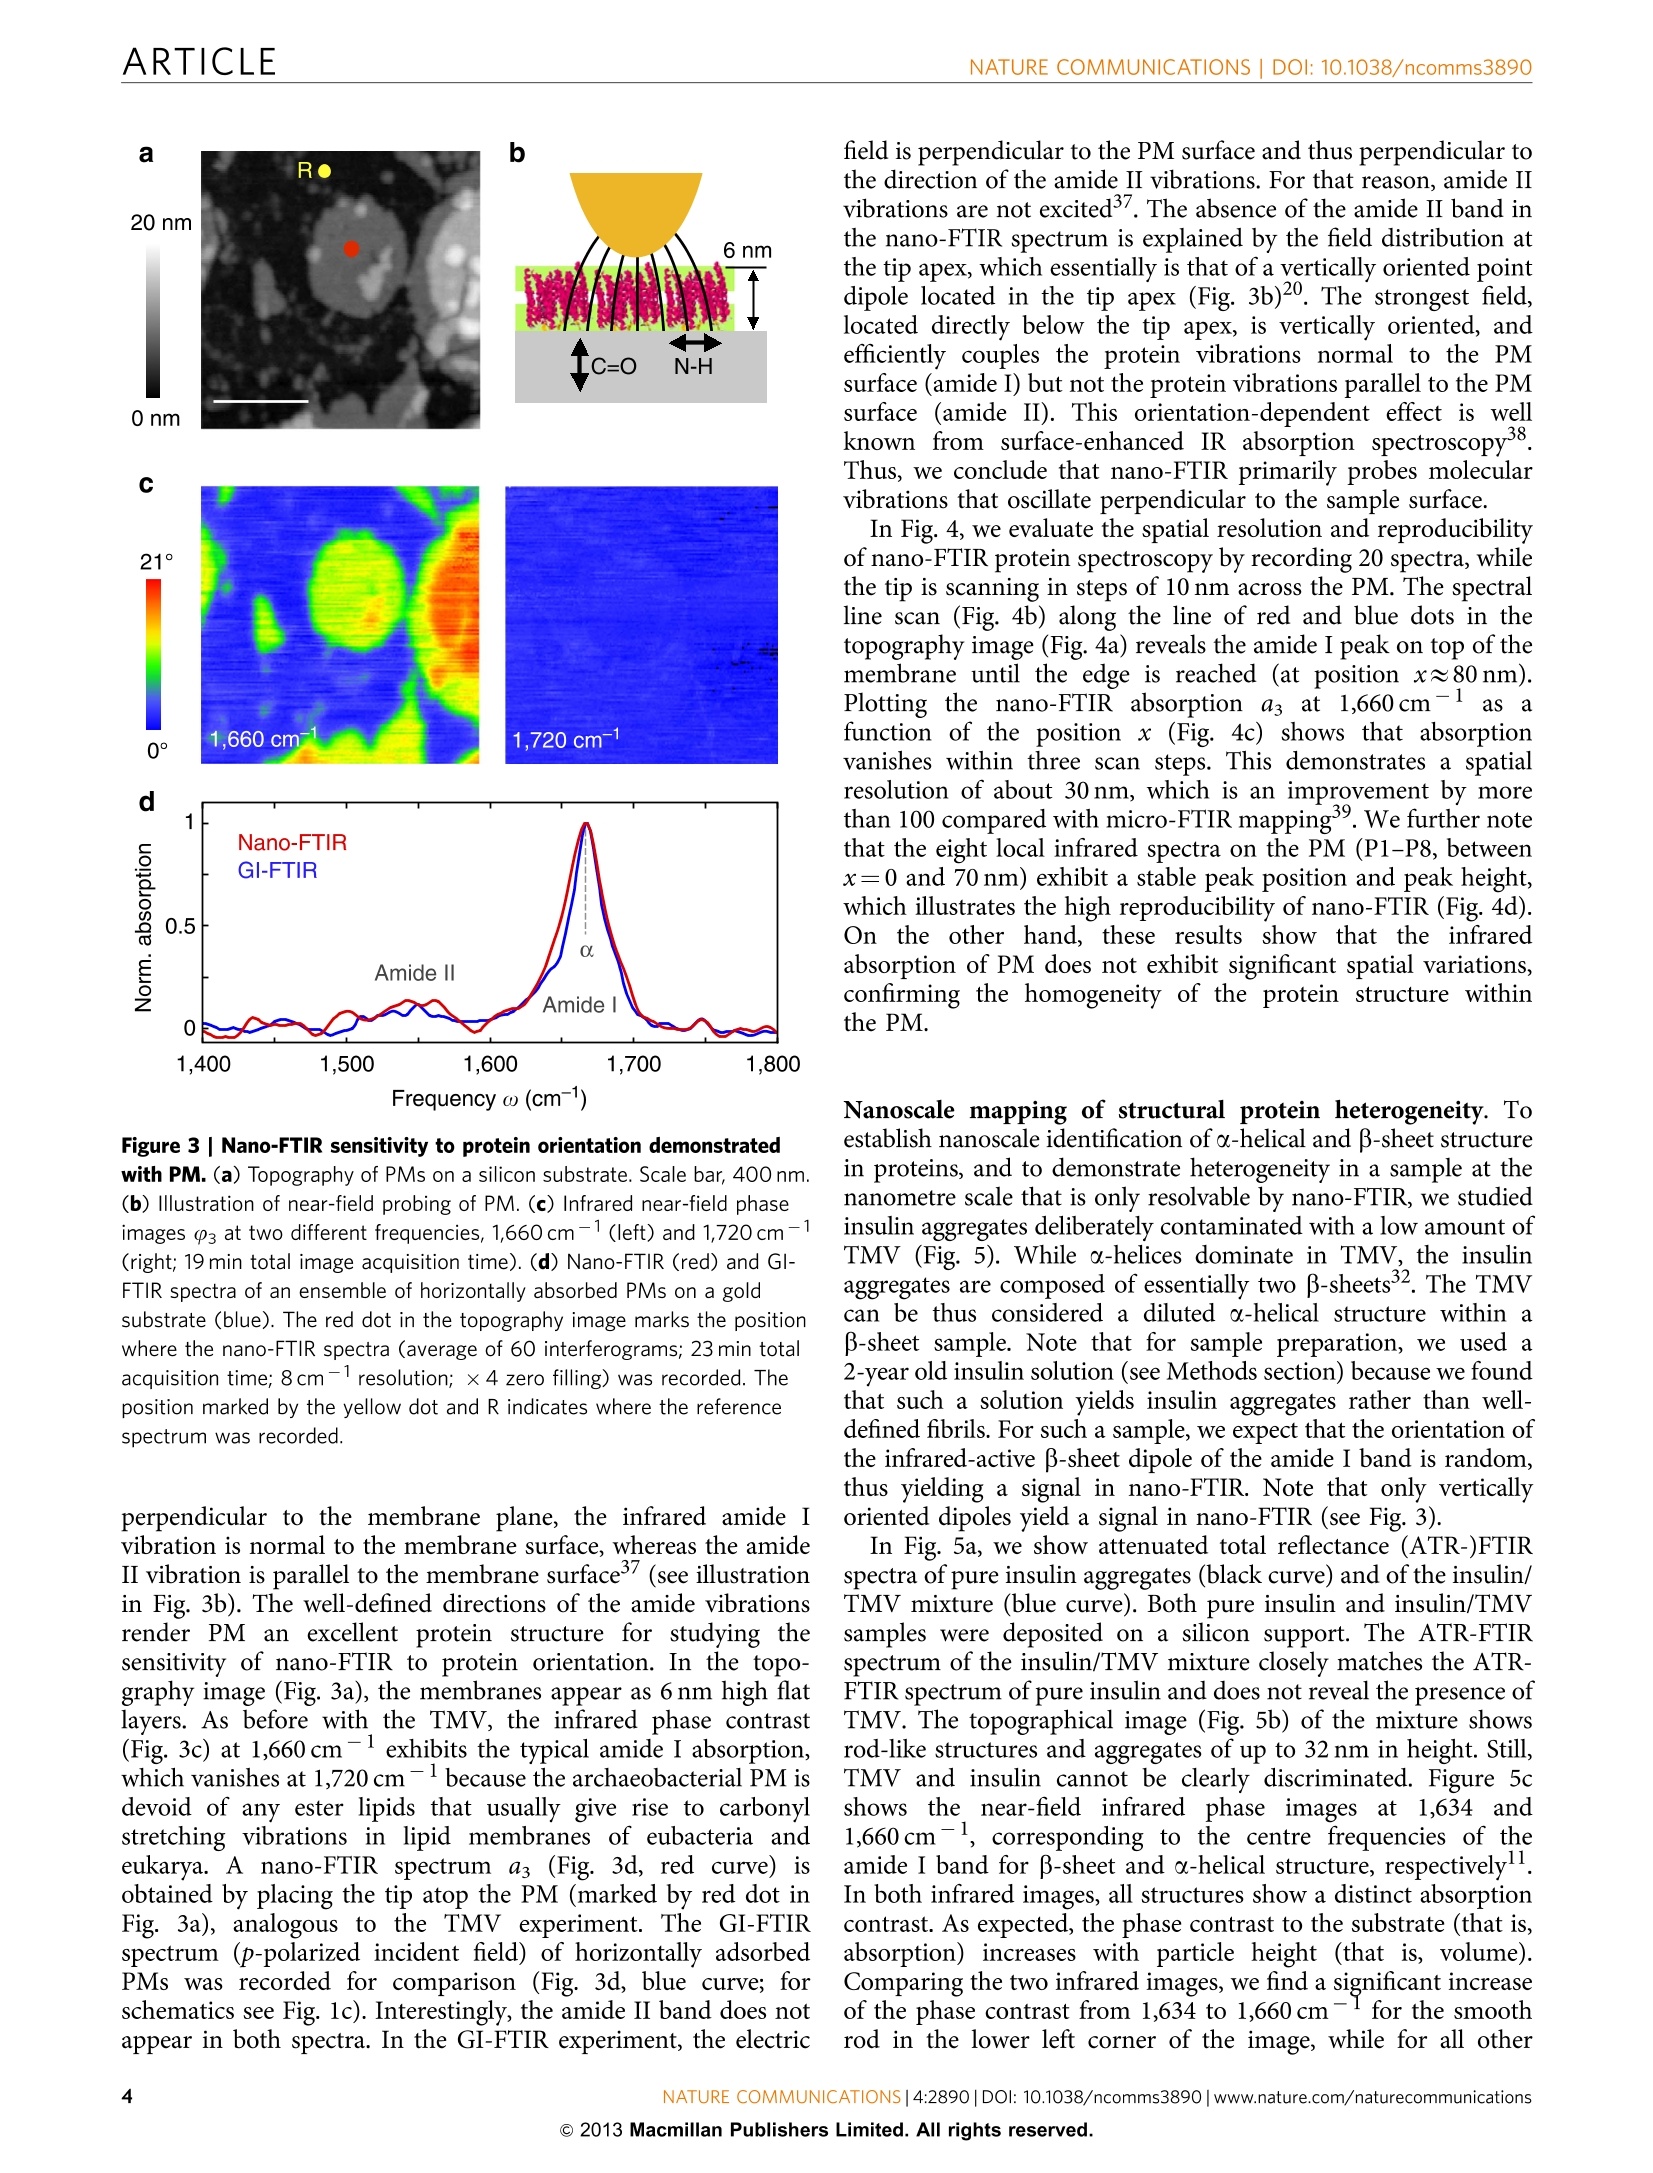
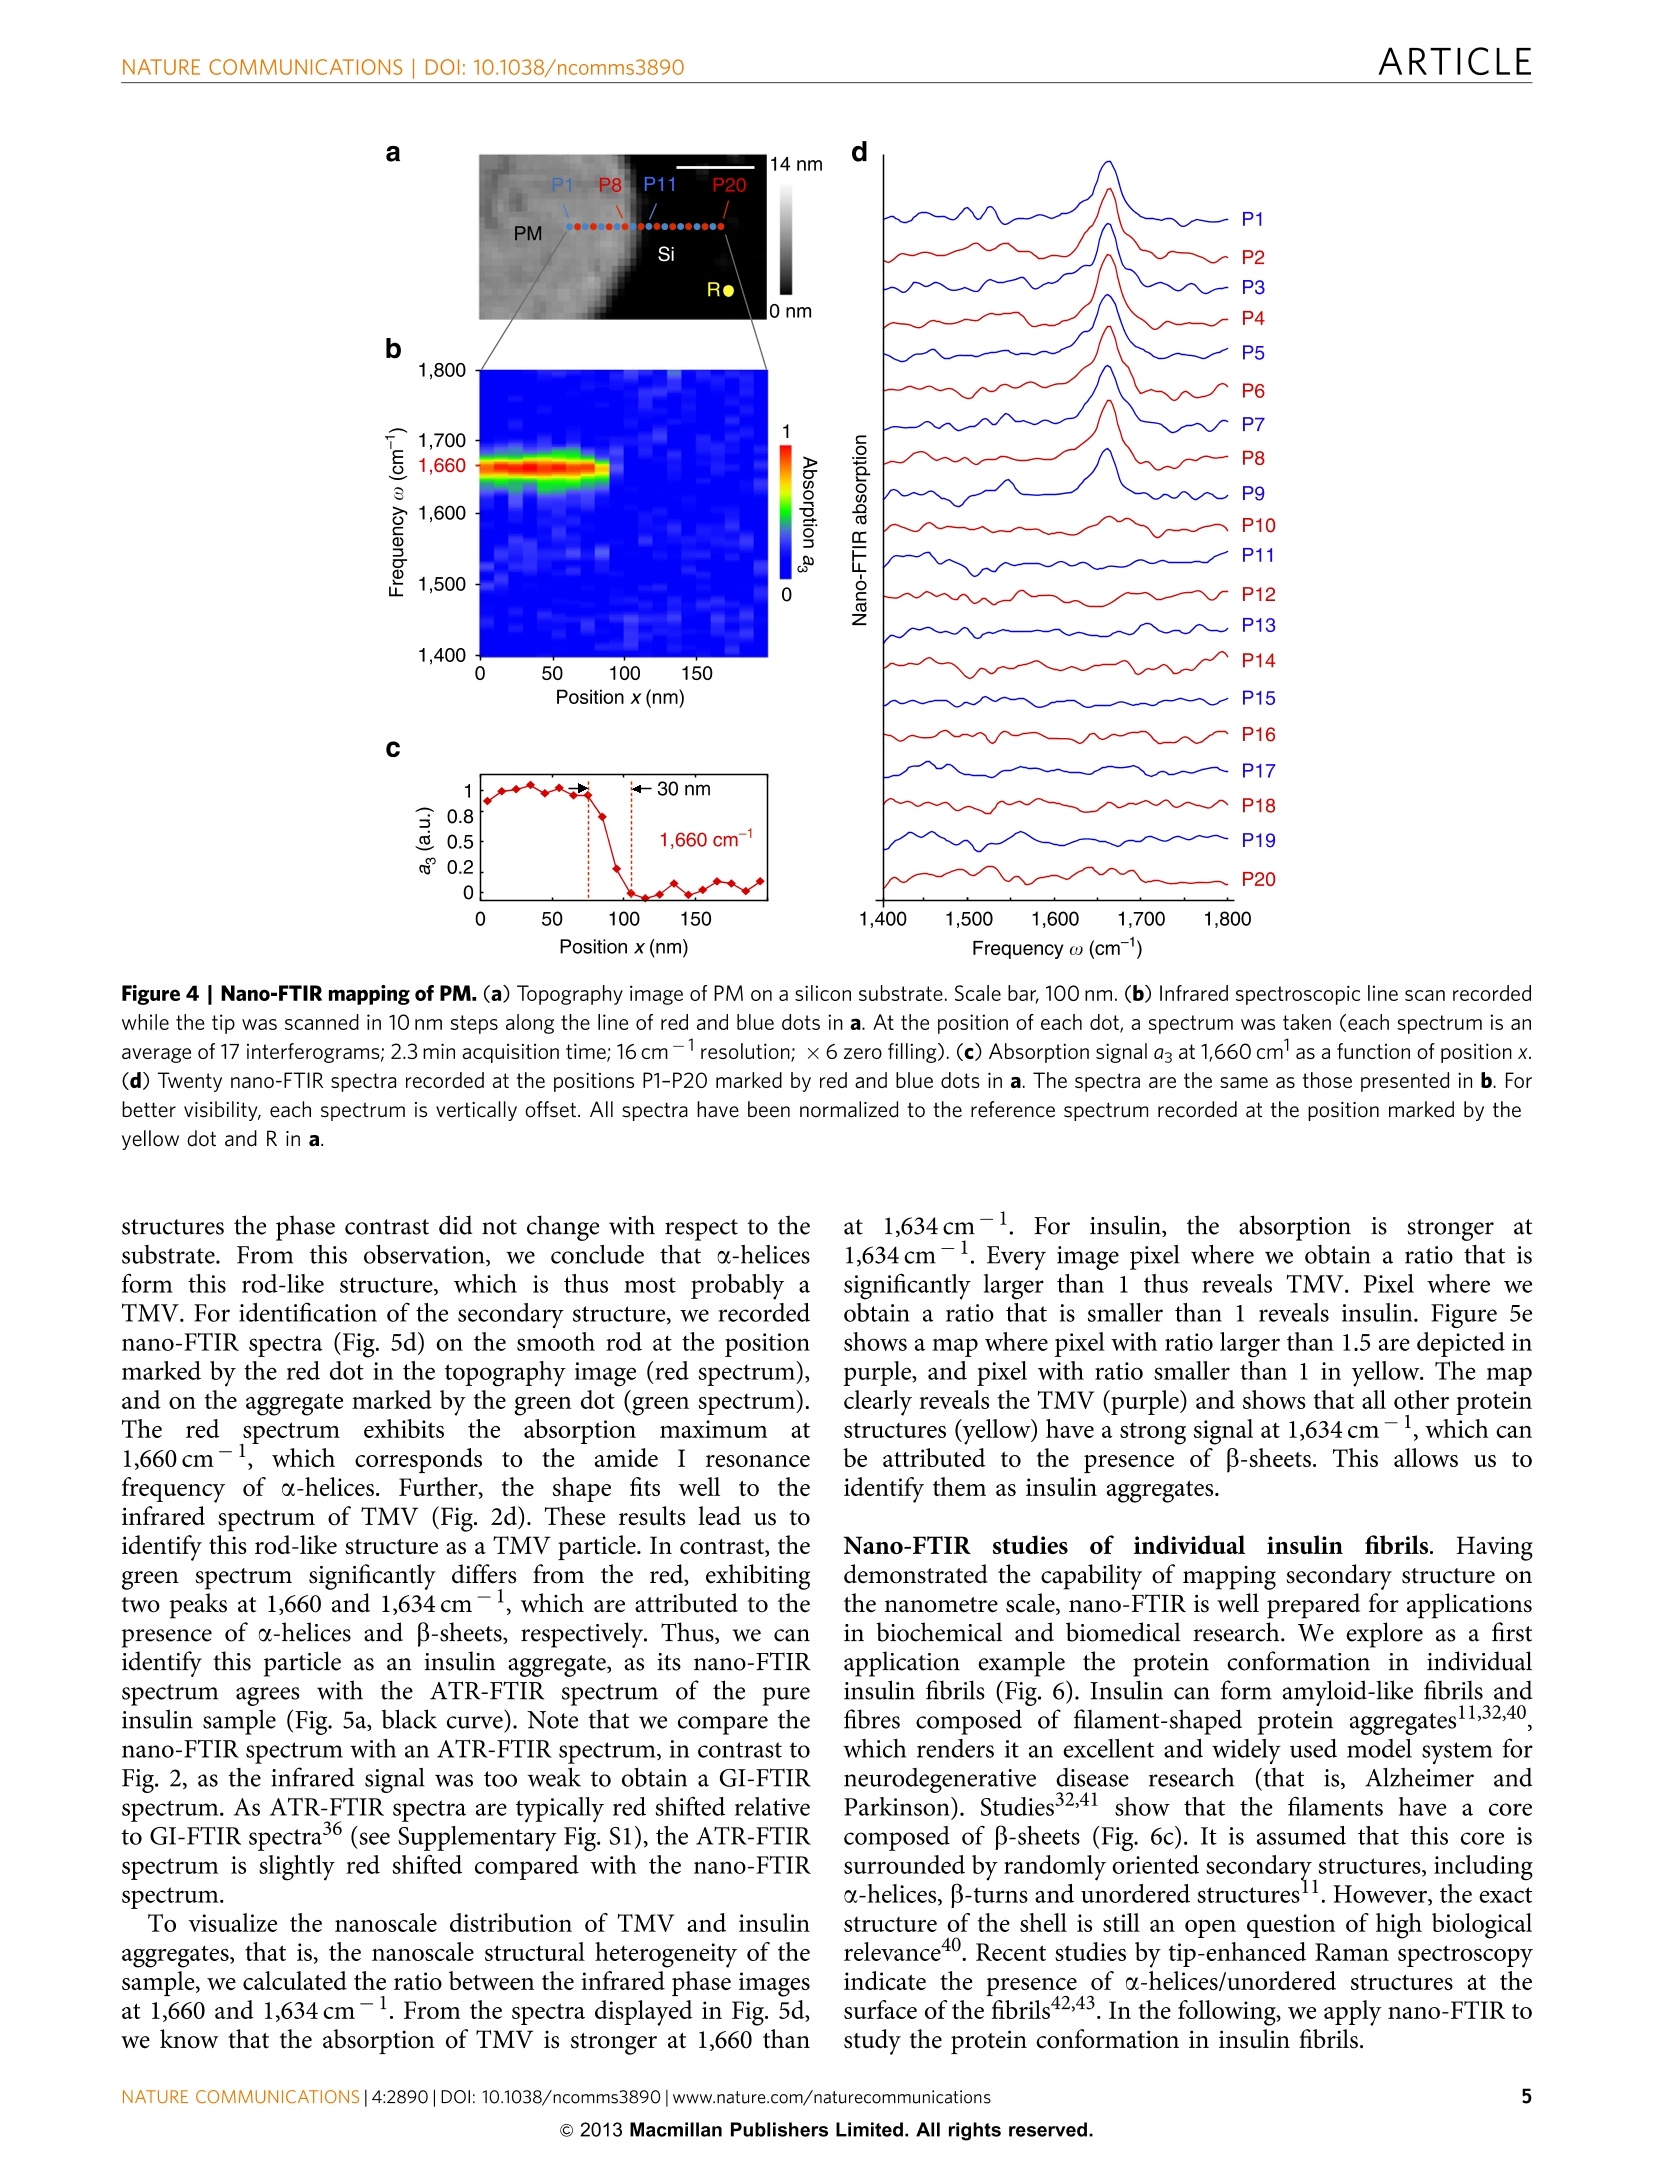
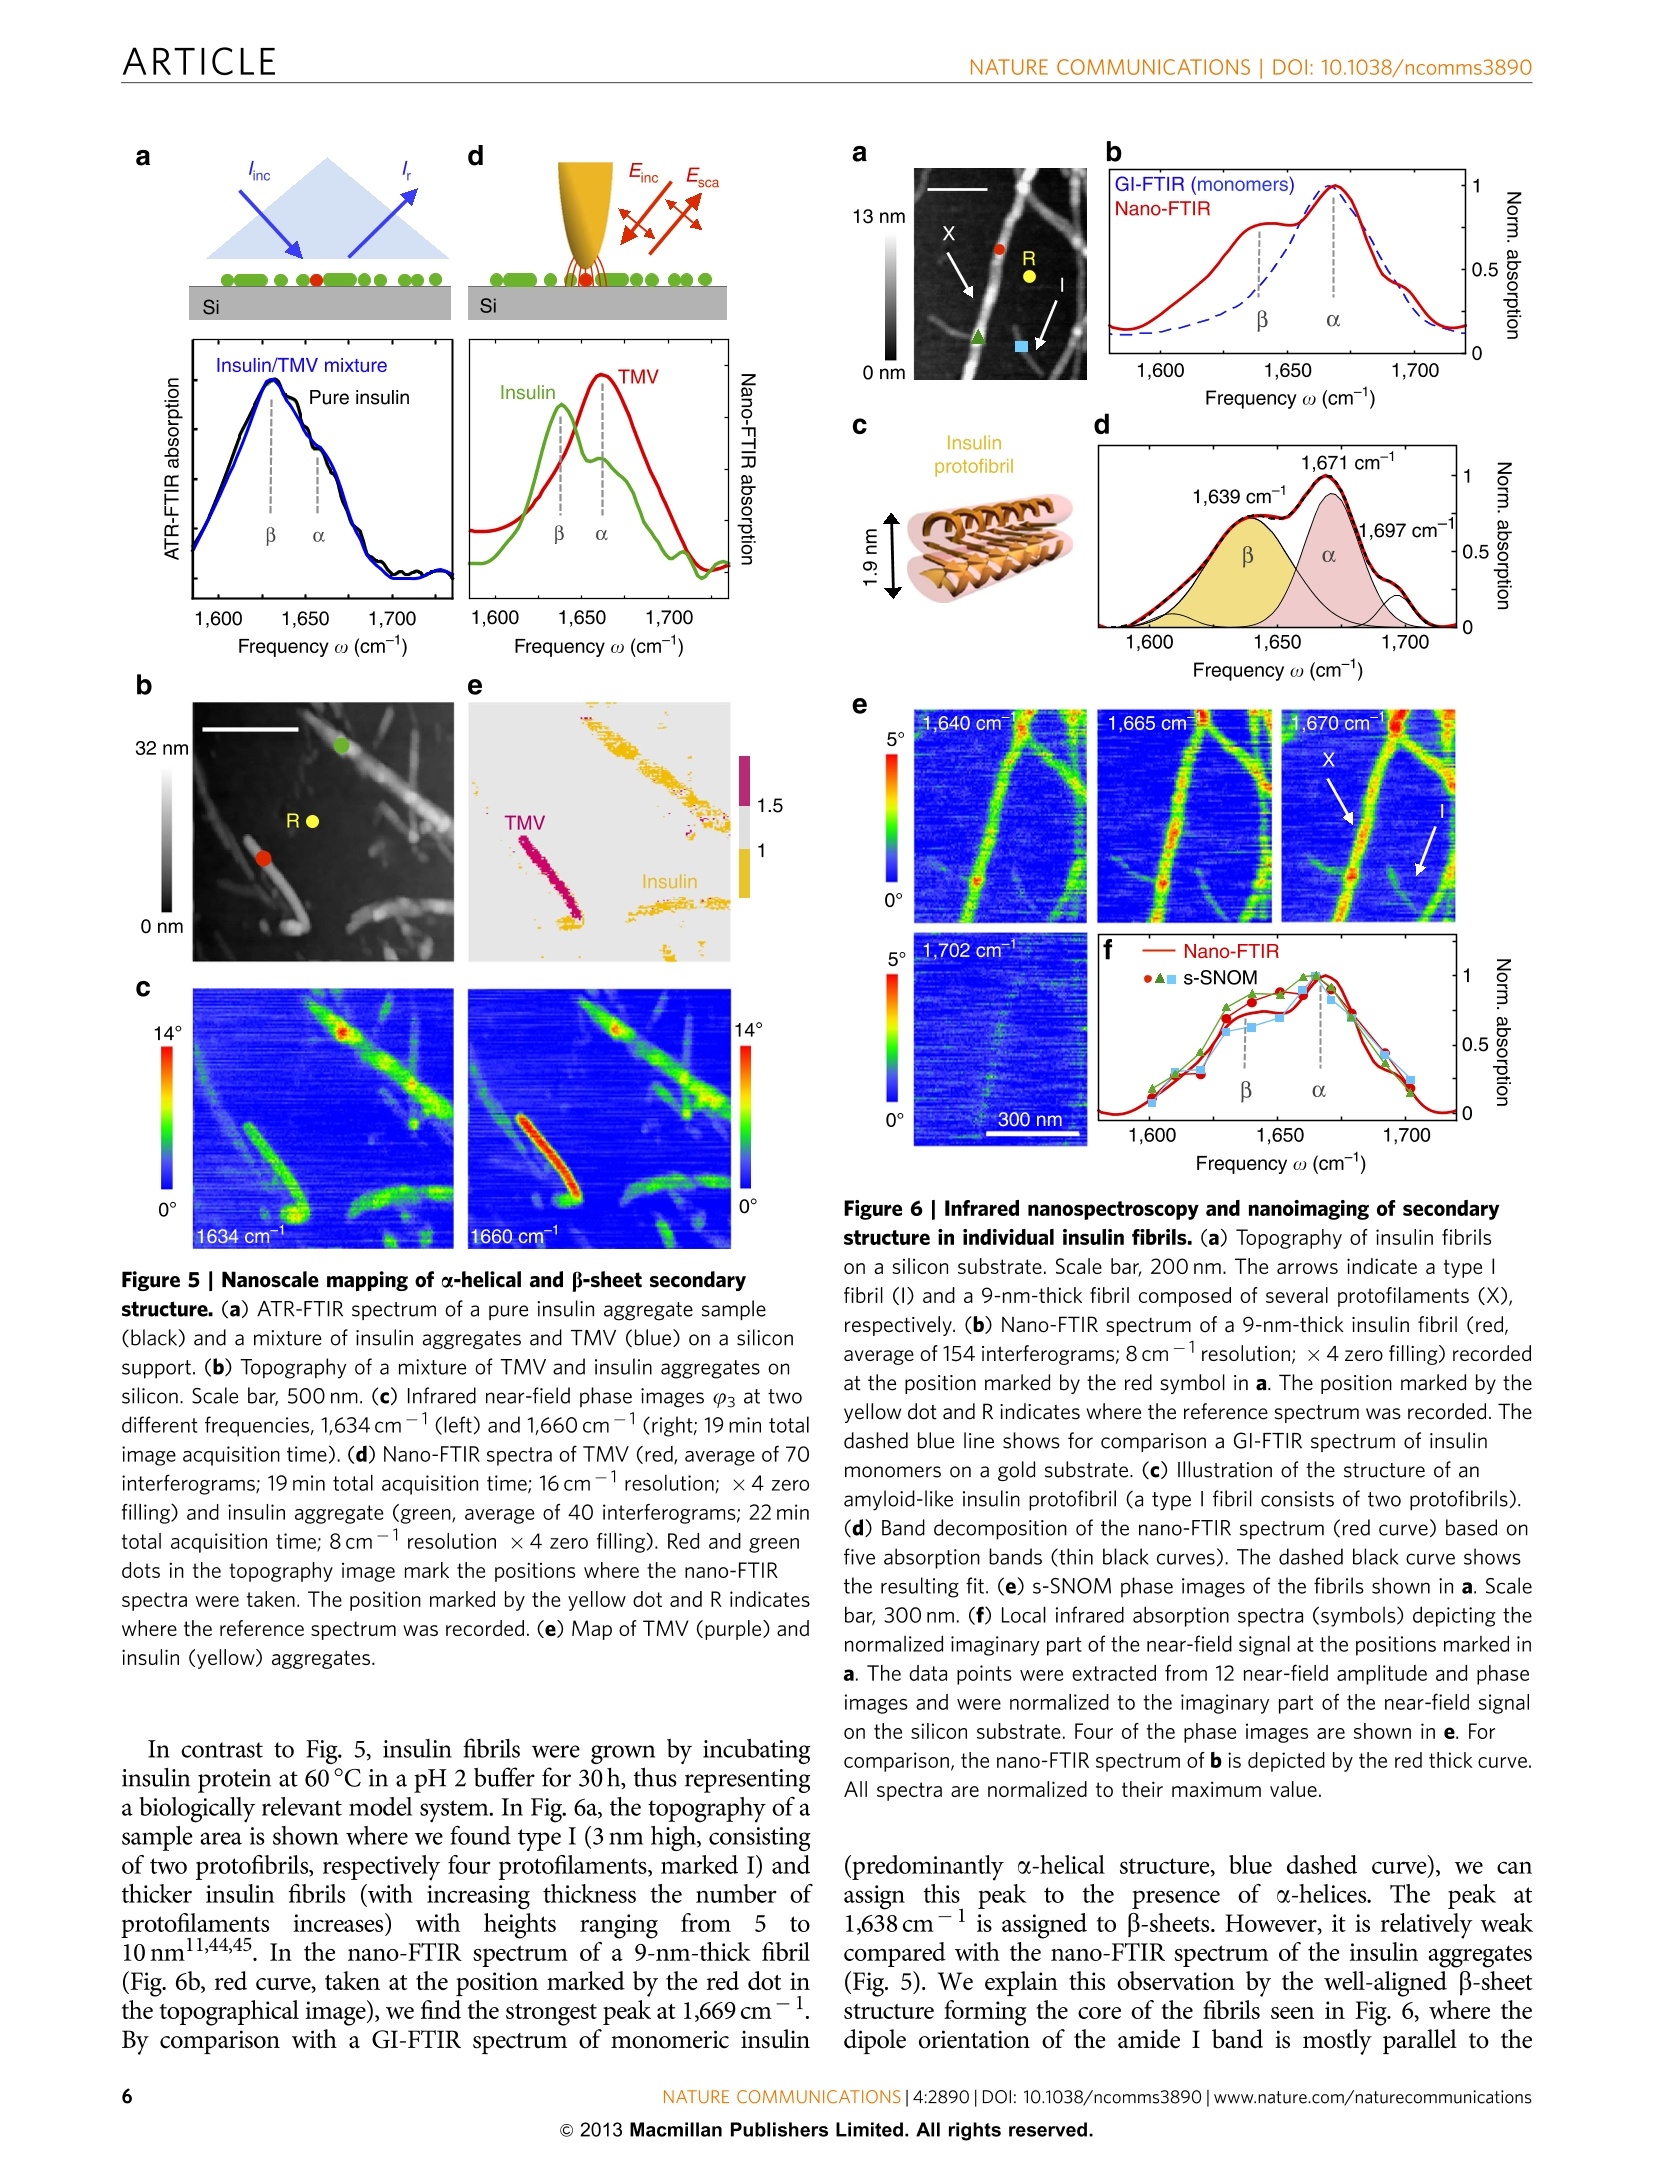
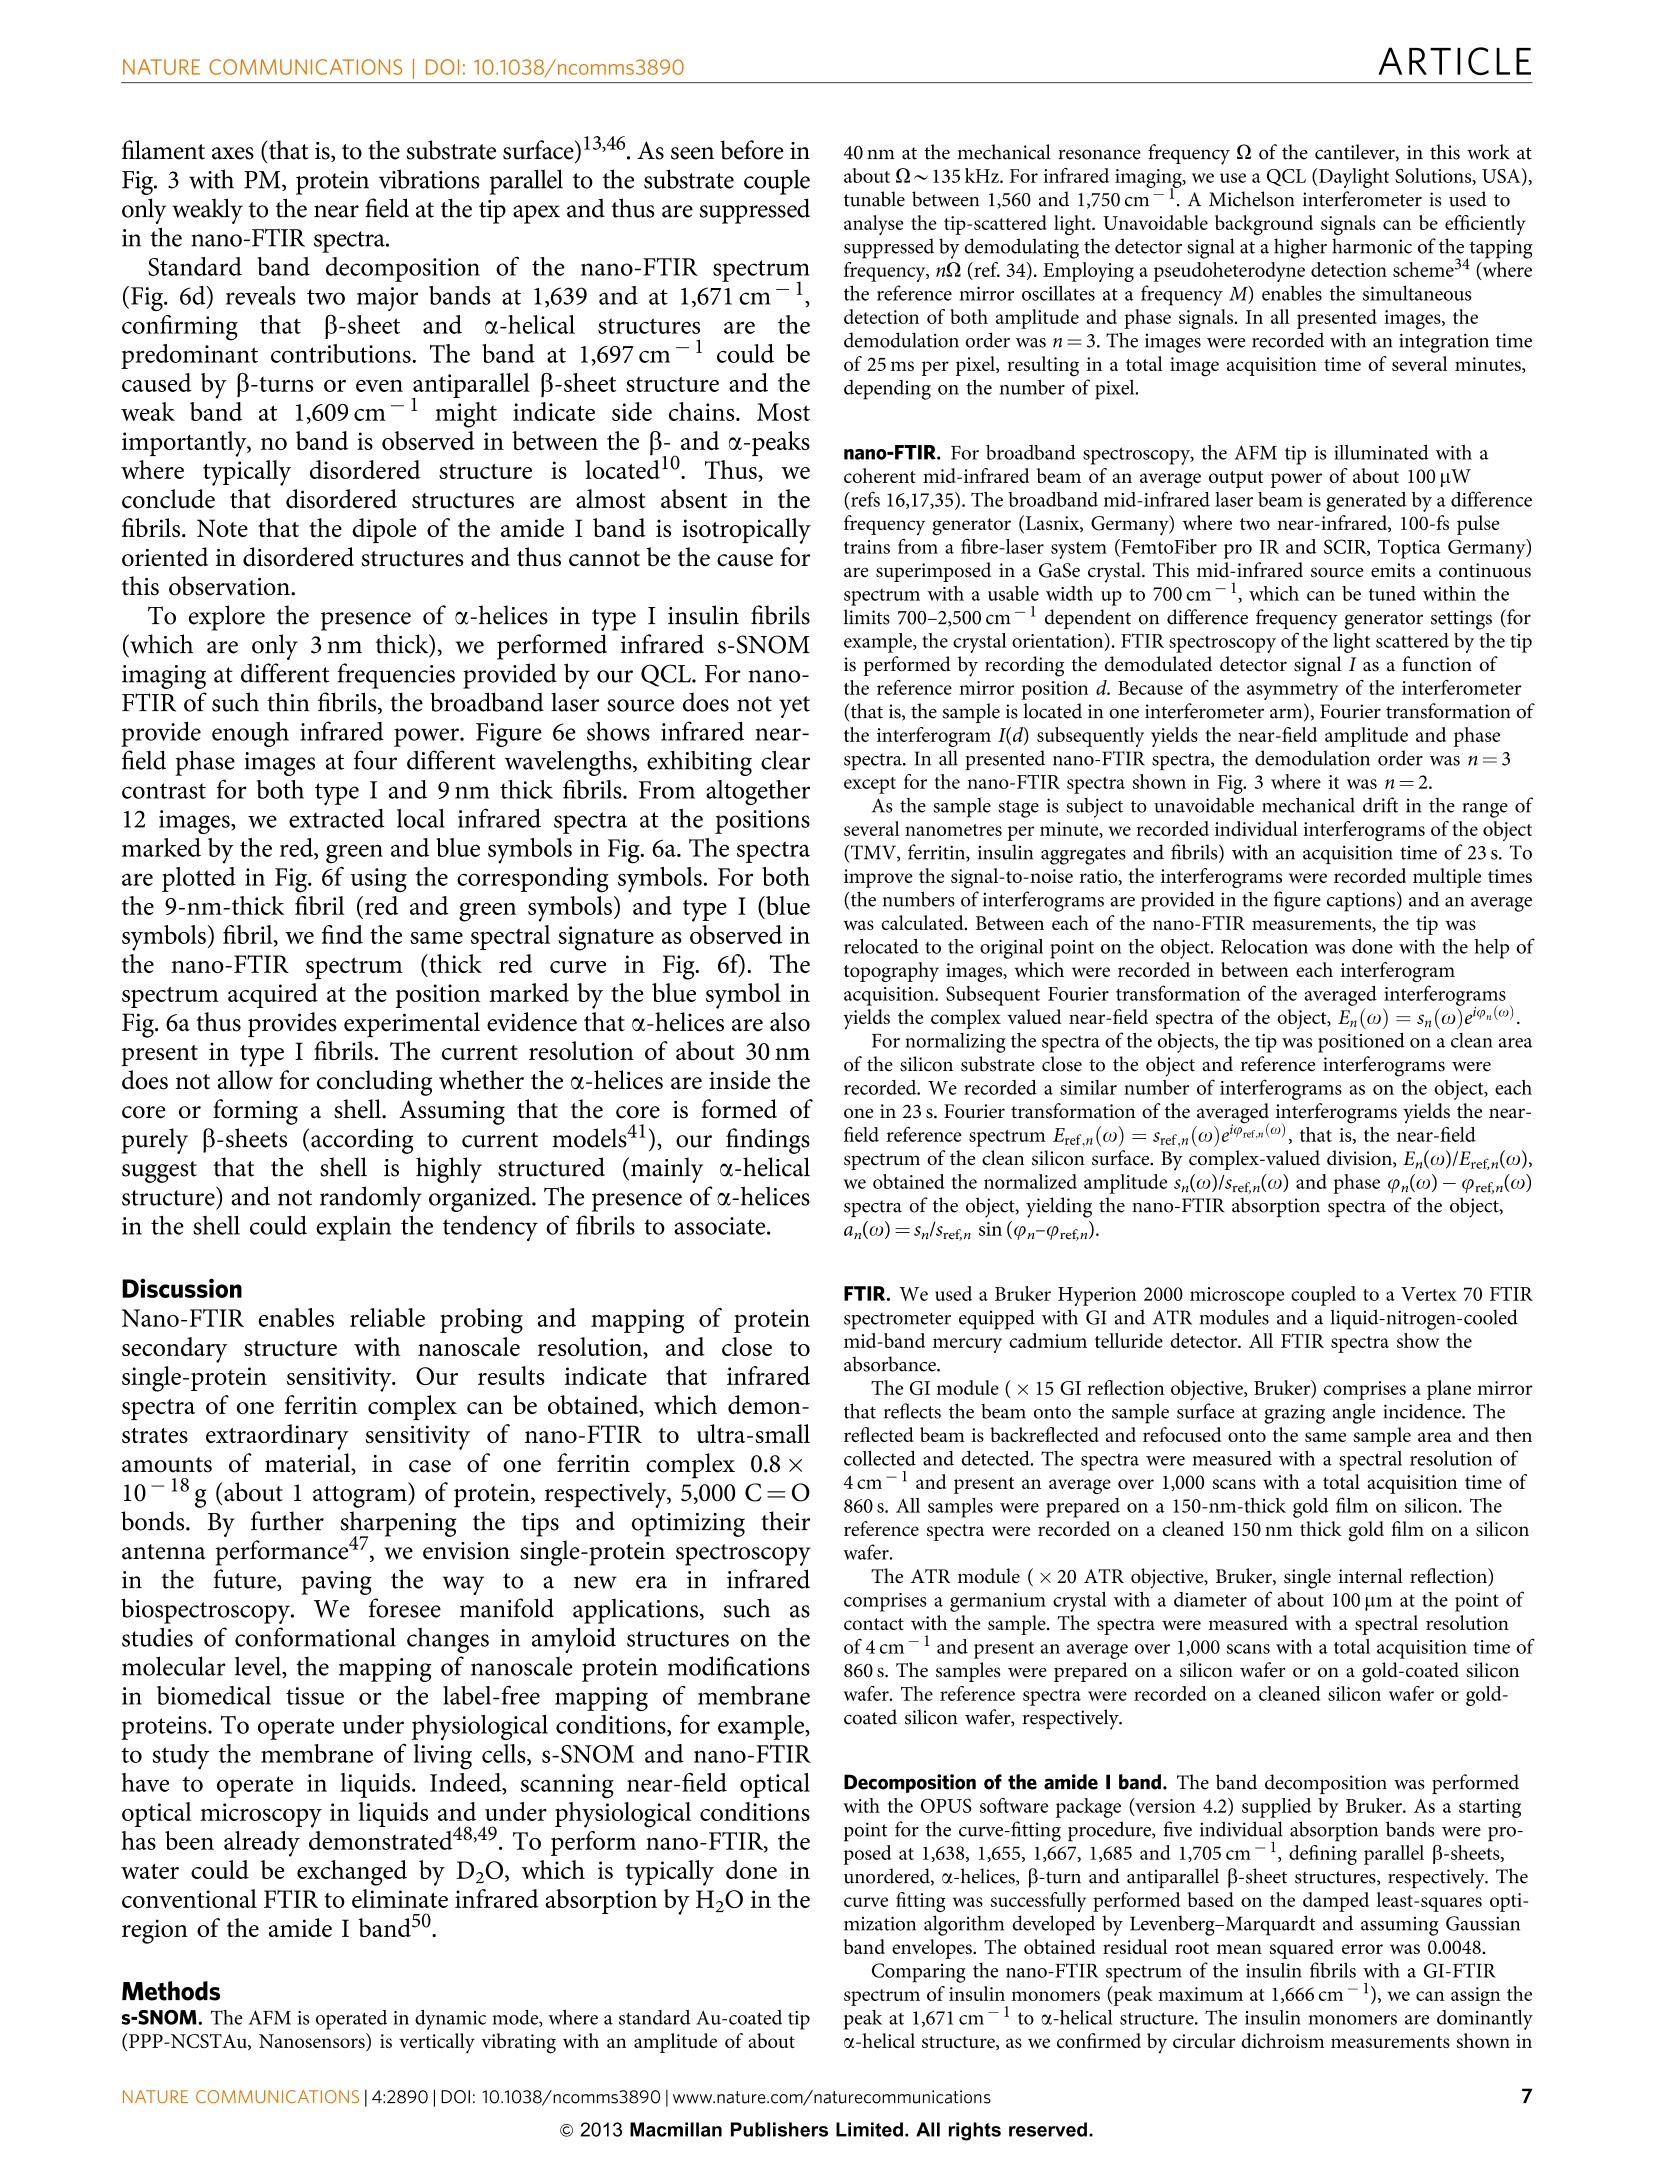
ARTICLEAccepted 7 Nov 2013Published 4 Dec 2013 DOI: 10.1038/ncomms3890 ARTICLENATURE COMMUNICATIONS|DOI: 10.1038/ncomms3890 Received 12 Jul 2013| OPEN Structural analysis and mapping of individualprotein complexes by infrared nanospectroscopy Iban Amenabar, Simon Polyl, Wiwat Nuansing, Elmar H. Hubrich2, Alexander A. Govyadinov,Florian Huth13, Roman Krutokhvostovl, Lianbing Zhang, Mato Knez14, Joachim Heberle2, Alexander M. Bittner14 & Rainer Hillenbrand14 Mid-infrared spectroscopy is a widely used tool for material identification and secondarystructure analysis in chemistry, biology and biochemistry. However, the diffraction limitprevents nanoscale protein studies. Here we introduce mapping of protein structure with30 nm lateral resolution and sensitivity to individual protein complexes by Fourier transforminfrared nanospectroscopy(nano-FTIR). We present local broadband spectra of one virus,ferritin complexes, purple membranes and insulin aggregates, which can be interpreted interms of their a-helical and/or B-sheet structure. Applying nano-FTIR for studying insulinfibrils-a model system widely used in neurodegenerative disease research-we find clearevidence that 3-nm-thin amyloid-like fibrils contain a large amount of o-helical structure. Thisreveals the surprisingly high level of protein organization in the fibril's periphery, which mightexplain why fibrils associate. We envision a wide application potential of nano-FTIR, includingcellular receptor in vitro mapping and analysis of proteins within quaternary structures. ( CIC nanoGUNE Consolider, 200 1 8 Dono s tia-San Sebast i an, Sp a in. Exper i menta l Molecu l ar Biophys i cs, Depart m ent of Physics , Freie Universitat Be r li n ,14195 Berlin, Germany. N easpec GmbH, 82152 Martinsried, Germany. 4IKERBASQUE, Basque Foundati o n for Science, 48011 Bilbao, Spain. Correspondence and r equests for m aterials s hould be addressed to R.H. (email: r.hi l lenbrand@nanogune.eu). ) ourier transform infrared spectroscopy (FTIR) allows for theanalysis of chemical bonds, protein morphology or second-ary structurel-4. Applications include the tracing of proteinmodifications that may originate from interactions with otherbiomaterials (for example, cellular receptors and enzymaticcofactor)5 or inorganic matter (for example, heavy metal ionsand nanoparticles). Such interactions are of high relevance invarious physiological cellular processes (for example, cellularattachment and genomic regulation), pathological processes of alarge variety of diseases (for example, viral infection and neuro-degenerative diseases)78, as well as in biomedical diagnostics andequipment (for example, support for human cell culture). Theanalysis of amide vibrations provides valuable insights into thesecondary structures of proteins, revealing information regardingconformation and folding3,10-13. However, because of thediffraction-limited resolution of FTIR, infrared spectroscopyapplications on the nanometre scale or even single-moleculelevel have so far proved elusive. Thee diffraction-liimited resolutiorFouer trarsrorm iniare resahnospectroscopvianonnyentea This technique is based on scattering-type scanning near-fieldoptical microscopy (s-SNOM)20 where infrared images withnanoscale spatial resolution are obtained by recording theinfrared light scattered at a scanning probe tip. The probe istypically a metalized atomic force microscope (AFM) tip. Actingas an antenna, it concentrates the incident field at the tipapex15,20 for local probing of molecular vibrations, similar totip-enhanced Raman spectroscopy21-24. When the AFM tip isilluminated by the broadband infrared radiation, Fouriertransform spectroscopy of the scattered light yields infraredspectra with a spatial resolution down to 20nm (refs 16-19).However, broadband nano-FTIR spectra of protein complexeshave neither been observed so far nor shown to be suitable for theanalysis of their structure. Biological objects such as protein fibrilsand membranes have been a5_l2ready studied by s-SNOM imagingatselected wavelengths25-2991. but ithasis not been demon-strated that the most important secondary structures-o-helicaland B-sheet structures—canbe identified on the level ofindividual protein complexes. To demonstrate that nano-FTIR can probe protein secondarystructure on the nanometre scale and with sensitivity toindividual protein complexes, we have chosen to study the amidebands of individual tobacco mosaic viruses (TMVs) and ferritincomplexes30 for their well-defined, robust and dominantly-helical protein structure, insulin aggregates for exhibitingp-sheet structure and purple membranes (PMs) because of thewell-defined orientation of the transmembrane a-helicesBroadband infrared spectra of a ferritin complex indicate thatnano-FTIR is sensitive to about 4,000 amino acids, correspondingto about 5,000 C=O and N-H bonds, respectively. Mostimportantly, we find that the amide I band in the nano-FTIRspectra can be analysed and interpreted in the framework ofstandard infrared spectroscopy. Our studies establish a solidfoundation for infrared nanobiospectroscopy, whichhis aprerequisite for nano-FTIR applications in biochemical andbiomedical research. We demonstrate the potential for real-lifeapplications of nano-FTIR in these fields by exploring the still notfully clarified protein conformation in individual insulin fibrils. Results S-SNOM and nano-FTIR set-up. The s-SNOM and nano-FTIRset-up (Neaspec GmbH, Germany) used in this work is based onan AFM where the tip is oscillating vertically at the mechanicalresonance frequency of the cantilever. Infrared near-fieldimaging and spectroscopy are performed by interferometric detection of the light scattered from a gold-coated AFM tip,which is illuminated by the radiation from a tunable quantumcascade laser (QCL) or a broadband mid-infrared laser beam,respectively (Fig. 1a,b). For s-SNOM imaging, the tip is illuminated with radiationfrom the wavelength-tunable QCL at individual wavelengths. Thetip-scattered light is detected by operating the interferometer inpseudoheterodyne mode34. Demodulating the detector signal at ahigher harmonic n of the tip oscillation frequency yieldsinfrared amplitude and phase images, sn and (n (see Methodssection). In nano-FTIR spectroscopy, broadband infrared amplitude andphase spectra are obtained by employing the interferometer forFourier transform spectroscopy of the scattered light 4-19. In thiscase, the tip is illuminated with a broadband laser of a total powerof about 100 pW (refs 17,35). As the tip and the sample arelocated in one of the interferometer arms (in contrast to standardFTIR), we can measure both local amplitude and phase spectra,sn(ω) and (n(ω). These spectra are normalized to the references,Srefn(ω) and Pref,n(@), obtained on a clean area on the samplesupport (marked R in the topography images presented in thework). We thus obtain normalized amplitude and phase spectraform which we can calculate the nano-FTIR absorption spectruman(@)=sn/Srefn sin (n-Prefn). As demonstrated in refs 17,19,the nano-FTIR spectrum aan(ω) revealsthe localinfraredabsorption in the sample. Setting the foundations for protein analysis with nano-FTIR.We first verify the ability of nano-FTIR to measure nanoscale Figure 1|Infrared spectroscopy of protein nanostructures.(a) s-SNOM and nano-FTIR set-up employing a tunable single line laser (quantumcascade laser,QCL) or a mid-infrared continuum source (fibre laser plusdifference frequency generator) for tip illumination, respectively. Theillumination can be chosen with a flip mirror (FM). The light backscatteredfrom the tip is analysed with a Michelson interferometer that is operated ineither pseudoheterodyne mode (for s-SNOM imaging) or as a Fouriertransform spectrometer (for nano-FTIR spectroscopy). It comprises a beamsplitter (BS, uncoated ZnSe), a reference mirror(RM) and a detector.(b) Schematics of s-SNOM and nano-FTIR spectroscopy. (c) Schematics offar-field GI-FTIR spectroscopy of protein nanostructure ensembles. comprises 24 subunits that form a cage around a ferrihydritenanoparticle (Fig. 2e). Each ferritin subunit is composed of sixo-helixes and one B-sheet30. The topographical image in Fig. 2gshows two particles of about 10 and 8 nm, and one of about 6 nmheight, which appear much broader because of the convolutionwith tip apex that has a radius of about 35 nm (see Fig. 2f andSupplementary Fig. S2). The infrared phase image 3 at1,660 cm- reveals a strong absorption for the 10- and 8-nmparticles, indicating that these are ferritin complexes. No infrarednP.contrast is seen for the 6-nm particle, which we interpret asferrihydrite core that does not absorb at 1,660 cm-. Figure 2hshows the nano-FTIR spectrum (red curve) of the ferritin markedby the red dot in Fig. 2g in comparison with a GI-FTIR spectrumof a large ferritin ensemble (blue curve). As demonstrated withthe TMV (vide supra), the nano-FTIR spectrum reveals the amideI and II bands in excellent agreement with GI-FTIR. Thus, weconclude that nano-FTIR allows for measuring infrared spectra ofindividual protein complexes, which can be interpreted bycomparison with standard GI-FTIR absorbance spectra. Theanalysis provided in Supplementary Fig. S2 and SupplementaryNote 1 indicates that the marked object is one ferritin complex.To explore whether and how nano-FTIR absorption spectra depend on the protein orientation, we studied the PMs ofHalobacterium salinarum (Fig. 3), which is composed of a doublelayer of polar and neutral lipids, and the integral membraneprotein bacteriorhodopsin. The secondary structure of bacter-iorhodopsin comprises seven transmembrane a-helices and anextracellular B-sheet3. As the helices are predominantly oriented Frequency ω (cm-) Figure 2 | Infrared nanospectroscopy of TMV and individual ferritin protein complexes. (a) Illustration of the protein structure of TMV. (b) Topographyof TMV on a silicon substrate. Scale bar, 100 nm. (c) Infrared near-field phase images 3 at two different frequencies, 1,660 cm-1 (left) and 1,720cm-1(right; 2.5 min total image acquisition time). (d) Nano-FTIR spectrum of TMV taken at the position marked by the red dot in the topography image(red, average of 40 interferograms; 22 min total acquisition time; 8cm-1 resolution; ×4 zero filling) and a GI-FTIR spectra of a large TMV ensemble on agold substrate (blue). (e) Illustration of the protein structure of ferritin. (f) Illustration of the tip probing a ferritin particle. The graph shows the measuredheight profile h when the tip is scanned along the dashed line in Fig. 2g.(g) Topography and infrared near-field image 03 of two ferritin moleculesand a ferrihydrite core on a silicon substrate. Scale bar, 50 nm (1.5 min total image acquisition time).(h) Nano-FTIR (red) and GI-FTIR spectra of a largeferritin ensemble on a gold substrate (blue). The red dot in the topography image marks the position where the nano-FTIR spectra (average of 60interferograms; 23 min total acquisition time; 8 cm-1resolution; x 4 zero filling) was recorded. The position marked by the yellow dot and R in b and gindicates where the reference spectrum was recorded. Figure 3|Nano-FTIR sensitivity to protein orientation demonstrated with PM.(a) Topography of PMs on a silicon substrate.Scale bar, 400 nm.(b) Illustration of near-field probing of PM. (c) Infrared near-field phaseimages 03 at two different frequencies, 1,660 cm-1 (left) and 1,720cm-(right; 19 min total image acquisition time).(d) Nano-FTIR (red) and Gl-FTIR spectra of an ensemble of horizontally absorbed PMs on a goldsubstrate (blue). The red dot in the topography image marks the positionwhere the nano-FTIR spectra (average of 60 interferograms; 23 min totalacquisition time; 8cm-1resolution; ×4 zero filling) was recorded. Theposition marked by the yellow dot and R indicates where the referencespectrum was recorded. perpendicular to the membrane plane, the infrared amide Ivibration is normal to the membrane surface, whereas the amideII vibration is parallel to the membrane surface (see illustrationin Fig. 3b). The well-defined directions of the amide vibrationsrender PM an excellent protein structure for studying thesensitivity of nano-FTIR to protein orientation. In the topo-graphy image (Fig. 3a), the membranes appear as 6 nm high flatlayers. As before with the TMV, the infrared phase contrast(Fig. 3c) at 1,660cm-1 exhibits the typical amide I absorption,which vanishes at 1,720 cm-because the archaeobacterial PM isdevoid of any ester lipids that usually give rise to carbonylstretching vibrations in lipid membranes of eubacteria andeukarya. A nano-FTIR spectrum as (Fig. 3d, red curve) isobtained by placing the tip atop the PM (marked by red dot inFig.3a), analogous to the TMV experiment. The GI-FTIRspectrum (p-polarized incident field) of horizontally adsorbedPMs was recorded for comparison (Fig. 3d, blue curve; forschematics see Fig.1c). Interestingly, the amide II band does notappear in both spectra. In the GI-FTIR experiment, the electric field is perpendicular to the PM surface and thus perpendicular tothe direction of the amide II vibrations. For that reason, amide IIvibrations are not excited3. The absence of the amide II band inthe nano-FTIR spectrum is explained by the field distribution atthe tip apex, which essentially is that of a vertically oriented pointdipole located in the tip apex (Fig. 3b)20. The strongest field,located directly below the tip apex, is vertically oriented, andefficiently couples the protein vibrations normal to the PMsurface (amide I) but not the protein vibrations parallel to the PMsurface (amide II). This orientation-dependent effect is wellknown from surface-enhanced IR absorption spectroscopy38.Thus, we conclude that nano-FTIR primarily probes molecularvibrations that oscillate perpendicular to the sample surface. In Fig. 4, we evaluate the spatial resolution and reproducibilityof nano-FTIR protein spectroscopy by recording 20 spectra, whilethe tip is scanning in steps of 10 nm across the PM. The spectralline scan (Fig. 4b) along the line of red and blue dots in thetopography image (Fig. 4a) reveals the amide I peak on top of themembrane until the edge is reached (at position xx80 nm).Plotting the nano-FTIR absorption as at1,660cm-1 asafunction of the position x (Fig. 4c) shows that absorptionvanishes within three scan steps. This demonstrates a spatialresolution of about 30 nm, which is an improvement by morethan 100 compared with micro-FTIR mapping39. We further notethat the eight local infrared spectra on the PM (P1-P8, betweenx=0 and 70 nm) exhibit a stable peak position and peak height,which illustrates the high reproducibility of nano-FTIR (Fig. 4d).On the other hand, these results show that the infraredabsorption of PM does not exhibit significant spatial variations,confirming the homogeneity of the protein structure withinthe PM. Nanoscale mapping of structural protein heterogeneity. Toestablish nanoscale identification of a-helical and B-sheet structurein proteins, and to demonstrate heterogeneity in a sample at thenanometre scale that is only resolvable by nano-FTIR, we studiedinsulin aggregates deliberately contaminated with a low amount ofTMV (Fig. 5). While o-helices dominate in TMV, the insulinaggregates are composed of essentially two B-sheets32. The TMVcan be thus considered a diluted a-helical structure within aB-sheet sample. Note that for sample preparation, we used a2-year old insulin solution (see Methods section) because we foundthat such a solution yields insulin aggregates rather than well-defined fibrils. For such a sample, we expect that the orientation ofthe infrared-active B-sheet dipole of the amide I band is random,thus yielding a signal in nano-FTIR. Note that only verticallyoriented dipoles yield a signal in nano-FTIR (see Fig. 3). In Fig. 5a, we show attenuated total reflectance (ATR-)FTIRspectra of pure insulin aggregates (black curve) and of the insulin/TMV mixture (blue curve). Both pure insulin and insulin/TMVsamples were deposited on a silicon support. The ATR-FTIRspectrum of the insulin/TMV mixture closely matches the ATR-FTIR spectrum of pure insulin and does not reveal the presence ofTMV. The topographical image (Fig. 5b) of the mixture showsrod-like structures and aggregates of up to 32 nm in height. Still,TMV and insulin cannot be clearly discriminated. Figure 5cshows the near-field infrared phase images at1,634 and1,660 cm-, corresponding to the centre frequencies of theamide I band for B-sheet and o-helical structure, respectively11.In both infrared images, all structures show a distinct absorptioncontrast. As expected, the phase contrast to the substrate (that is,absorption) increases with particle height (that is, volume).Comparing the two infrared images, we find a significant increaseof the phase contrast from 1,634 to 1,660 cm-for the smoothrod in the lower left corner of the image, while for all other Figure 4|Nano-FTIR mapping of PM. (a) Topography image of PM on a silicon substrate. Scale bar,100 nm. (b) Infrared spectroscopic line scan recordedwhile the tip was scanned in 10 nm steps along the line of red and blue dots in a. At the position of each dot, a spectrum was taken (each spectrum is anaverage of 17 interferograms; 2.3 min acquisition time; 16 cm-1 resolution;×6 zero filling).(c) Absorption signal a3 at 1,660 cml as a function of position x.(d) Twenty nano-FTIR spectra recorded at the positions P1-P20 marked by red and blue dots in a. The spectra are the same as those presented in b. Forbetter visibility, each spectrum is vertically offset. All spectra have been normalized to the reference spectrum recorded at the position marked by theyellow dot and R in a. structures the phase contrast did not change with respect to thesubstrate. From this observation, we conclude that a-helicesform this rod-like structure, which is thus most probably aTMV. For identification of the secondary structure, we recordednano-FTIR spectra (Fig.5d) on the smooth rod at the positionmarked by the red dot in the topography image (red spectrum),and on the aggregate marked by the green dot (green spectrum).The redspectrumlexhibits the absorption maximum at1,660cm-, which corresponds to the amide I resonancefrequency of o-helices. Further, the shape fits well to theinfrared spectrum of TMV (Fig. 2d). These results lead us toidentify this rod-like structure as a TMV particle. In contrast, thegreen spectrum significantly differs from the red, exhibitingtwo peaks at 1,660 and 1,634cm-, which are attributed to thepresence of a-helices and B-sheets, respectively. Thus, we canidentify this particle as an insulin aggregate, as its nano-FTIRspectrum agrees with the ATR-FTIR spectrum of the pureinsulin sample (Fig. 5a, black curve). Note that we compare thenano-FTIR spectrum with an ATR-FTIR spectrum, in contrast toFig. 2, as the infrared signal was too weak to obtain a GI-FTIRspectrum. As ATR-FTIR spectra are typically red shifted relativeto GI-FTIR spectra3(see Supplementary Fig. S1), the ATR-FTIRspectrum is slightly red shifted compared with the nano-FTIRspectrum. To visualize the nanoscale distribution of TMV and insulinaggregates, that is, the nanoscale structural heterogeneity of thesample, we calculated the ratio between the infrared phase imagesat 1,660 and 1,634 cm-1. From the spectra displayed in Fig. 5d,we know that the absorption of TMV is stronger at 1,660 than at1,634cm-1. For insulin, the absorption is stronger at1,634 cm-1. Every image pixel where we obtain a ratio that issignificantly larger than 1 thus reveals TMV. Pixel where weobtain a ratio that is smaller than 1 reveals insulin. Figure 5eshows a map where pixel with ratio larger than 1.5 are depicted inpurple, and pixel with ratio smaller than 1 in yellow. The mapclearly reveals the TMV (purple) and shows that all other proteinstructures (yellow) have a strong signal at 1,634 cm-, which canbe attributed to the presence of B-sheets. This allows us toidentify them as insulin aggregates. Nano-FTIRRstudies of individual insulin fibrils. Havingdemonstrated the capability of mapping secondary structure onthe nanometre scale,nano-FTIR is well prepared for applicationsin biochemical and biomedical research. We explore as a firstapplication example the protein conformation in individualinsulin fibrils (Fig.6). Insulin can form amyloid-like fibrils andfibres composed of filament-shaped protein aggregates11,32,40,which renders it an excellent and widely used model system forneurodegenerative disease research (that is, Alzheimer andParkinson). Studies32,41show that the filaments have a corecomposed of B-sheets (Fig. 6c). It is assumed that this core issurrounded by randomly oriented secondary structures, includingo-helices, B-turns and unordered structures. However, the exactstructure of the shell is still an open question of high biologicalrelevance40. Recent studies by tip-enhanced Raman spectroscopyindicate the presence of a-helices/unordered structures at thesurface of the fibrils42.43 In the following, we apply nano-FTIR tostudy the protein conformation in insulin fibrils. Figure 5|Nanoscale mapping of a-helical and p-sheet secondary structure.(a) ATR-FTIR spectrum of a pure insulin aggregate sample(black) and a mixture of insulin aggregates and TMV (blue) on a siliconsupport. (b) Topography of a mixture of TMV and insulin aggregates onsilicon. Scale bar, 500 nm. (c) Infrared near-field phase images P3 at twodifferent frequencies, 1,634 cm-1 (left) and 1,660 cm-1 (right; 19 min totalimage acquisition time). (d) Nano-FTIR spectra of TMV (red, average of 70interferograms; 19 min total acquisition time; 16 cm-1resolution; ×4 zerofilling) and insulin aggregate (green, average of 40 interferograms; 22 mintotal acquisition time; 8cm-1 resolution ×4 zero filling). Red and greendots in the topography image mark the positions where the nano-FTIRspectra were taken. The position marked by the yellow dot and R indicateswhere the reference spectrum was recorded. (e) Map of TMV (purple) andinsulin (yellow) aggregates. In contrast to Fig.5, insulin fibrils were grown by incubatinginsulin protein at 60°C in a pH 2 buffer for 30 h, thus representinga biologically relevant model system. In Fig. 6a, the topography of asample area is shown where we found type I (3 nm high, consistingof two protofibrils, respectively four protofilaments, marked I) andthicker insulin fibrils (with increasing thickness the number ofmneprotofilaments increases)withheights ranging from55 to10 nm11,44,45. In the nano-FTIR spectrum of a 9-nm-thick fibril(Fig. 6b, red curve, taken at the position marked by the red dot inthe topographical image), we find the strongest peak at 1,669cm.By comparison with a GI-FTIR spectrum of monomeric insulin a b GI-FTIR (monomers) Frequency ω (cm) Figure 6| Infrared nanospectroscopy and nanoimaging of secondarystructure in individual insulin fibrils. (a) Topography of insulin fibrilson a silicon substrate. Scale bar, 200 nm. The arrows indicate a type Ifibril (I) and a 9-nm-thick fibril composed of several protofilaments (X),respectively. (b) Nano-FTIR spectrum of a 9-nm-thick insulin fibril (red,average of 154 interferograms;8cm-1 resolution; ×4 zero filling) recordedat the position marked by the red symbol in a. The position marked by theyellow dot and R indicates where the reference spectrum was recorded. Thedashed blue line shows for comparison a GI-FTIR spectrum of insulinmonomers on a gold substrate. (c) Illustration of the structure of anamyloid-like insulin protofibril (a type l fibril consists of two protofibrils).(d) Band decomposition of the nano-FTIR spectrum (red curve) based onfive absorption bands (thin black curves). The dashed black curve showsthe resulting fit. (e)s-SNOM phase images of the fibrils shown in a. Scalebar, 300 nm. (f)Local infrared absorption spectra (symbols) depicting thenormalized imaginary part of the near-field signal at the positions marked ina. The data points were extracted from 12 near-field amplitude and phaseimages and were normalized to the imaginary part of the near-field signalon the silicon substrate. Four of the phase images are shown in e. Forcomparison, the nano-FTIR spectrum of b is depicted by the red thick curve.All spectra are normalized to their maximum value. (predominantly a-helical structure, blue dashed curve), we canassign this peak to the presence of a-helices. The peak at1,638 cm-is assigned to B-sheets. However, it is relatively weakcompared with the nano-FTIR spectrum of the insulin aggregates(Fig.5). We explain this observation by the well-aligned B-sheetstructure forming the core of the fibrils seen in Fig. 6, where thedipole orientation of the amide I band is mostly parallel to the filament axes (that is, to the substrate surface)13,46. As seen before inFig.3 with PM, protein vibrations parallel to the substrate coupleonly weakly to the near field at the tip apex and thus are suppressedin the nano-FTIR spectra. Standard band decomposition of the nano-FTIR spectrum(Fig. 6d) reveals two major bands at 1,639 and at 1,671 cm-,confirming that fB-sheet and a-helicall structures are thepredominant contributions. The band at 1,697cm-1 could becaused by B-turns or even antiparallel B-sheet structure and theweak band at1,609 cm-1 might indicate side chains. Mostimportantly, no band is observed in between the B-and a-peakswhere typically disordered structure is located10. Thus,, weconclude that disordered structures are almost absent in thefibrils. Note that the dipole of the amide I band is isotropicallyoriented in disordered structures and thus cannot be the cause forthis observation. To explore the presence of a-helices in type I insulin fibrils(which are only 3 nm thick), we performed infrared s-SNOMimaging at different frequencies provided by our QCL. For nano-FTIR of such thin fibrils, the broadband laser source does not yetprovide enough infrared power. Figure 6e shows infrared near-field phase images at four different wavelengths, exhibiting clearcontrast for both type I and 9nm thick fibrils. From altogether12 images, we extracted local infrared spectra at the positionsmarked by the red, green and blue symbols in Fig. 6a. The spectraare plotted in Fig. 6f using the corresponding symbols. For boththe 9-nm-thick fibril (red and green symbols) and type I (bluesymbols) fibril, we find the same spectral signature as observed inthe nano-FTIR spectrum (thick red curve in Fig. 6f). Thespectrum acquired at the position marked by the blue symbol inFig. 6a thus provides experimental evidence that o-helices are alsopresent in type I fibrils. The current resolution of about 30 nmdoes not allow for concluding whether the a-helices are inside thecore or forming a shell. Assuming that the core is formed ofpurely B-sheets (according to current models41), our findingssuggest that the shell is highly structured (mainly a-helicalstructure) and not randomly organized. The presence of a-helicesin the shell could explain the tendency of fibrils to associate. Discussion Nano-FTIR enables reliable probing and mapping of proteinsecondary structure with nanoscale resolution, and close tosingle-protein sensitivity. Our results indicate that infraredspectra of one ferritin complex can be obtained, which demon-strates extraordinary sensitivity of nano-FTIR to ultra-smallamounts of material, in case of one ferritin complex 0.8×10⁻¹⁸g (about 1 attogram) of protein, respectively, 5,000 C=0bonds. By further sharpening the tips and optimizing theirantenna performance, we envision single-protein spectroscopyin the future, paving the way to a new era in infraredbiospectroscopy. We foresee manifold applications, suchhasstudies of conformational changes in amyloid structures on themolecular level, the mapping of nanoscale protein modificationsin biomedical tissue or the label-free mapping of membraneproteins. To operate under physiological conditions, for example,to study the membrane of living cells, s-SNOM and nano-FTIRhave to operate in liquids. Indeed, scanning near-field opticaloptical microscopy in liquids and under physiological conditionshas been already demonstrated48,49. To perform nano-FTIR, thewater could be exchanged by D2O, which is typically done inconventional FTIR to eliminate infrared absorption by H2O in theregion of the amide I band. Methods s-SNOM. The AFM is operated in dynamic mode, where a standard Au-coated tip(PPP-NCSTAu, Nanosensors) is vertically vibrating with an amplitude of about 40 nm at the mechanical resonance frequency Q of the cantilever, in this work atabout Q~135 kHz. For infrared imaging, we use a QCL (Daylight Solutions, USA),tunable between 1,560 and 1,750 cm. A Michelson interferometer is used toanalyse the tip-scattered light. Unavoidable background signals can be efficientlysuppressed by demodulating the detector signal at a higher harmonic of the tappingfrequency, n (ref. 34). Employing a pseudoheterodyne detection scheme34(wherethe reference mirror oscillates at a frequency M) enables the simultaneousdetection of both amplitude and phase signals. In all presented images, thedemodulation order was n=3. The images were recorded with an integration timeof 25 ms per pixel, resulting in a total image acquisition time of several minutes,depending on the number of pixel. nano-FTIR. For broadband spectroscopy, the AFM tip is illuminated with acoherent mid-infrared beam of an average output power of about 100 pW(refs 16,17,35). The broadband mid-infrared laser beam is generated by a differencefrequency generator (Lasnix, Germany) where two near-infrared, 100-fs pulsetrains from a fibre-laser system (FemtoFiber pro IR and SCIR, Toptica Germany)are superimposed in a GaSe crystal. This mid-infrared source emits a continuousspectrum with a usable width up to 700 cm, which can be tuned within thelimits 700-2,500 cm- dependent on difference frequency generator settings (forexample, the crystal orientation). FTIR spectroscopy of the light scattered by the tipis performed by recording the demodulated detector signal I as a function ofthe reference mirror position d. Because of the asymmetry of the interferometer(that is, the sample is located in one interferometer arm), Fourier transformation ofthe interferogram I(d) subsequently yields the near-field amplitude and phasespectra. In all presented nano-FTIR spectra, the demodulation order was n=3except for the nano-FTIR spectra shown in Fig. 3 where it was n=2. As the sample stage is subject to unavoidable mechanical drift in the range ofseveral nanometres per minute, we recorded individual interferograms of the object(TMV, ferritin, insulin aggregates and fibrils) with an acquisition time of 23 s. Toimprove the signal-to-noise ratio, the interferograms were recorded multiple times(the numbers of interferograms are provided in the figure captions) and an averagewas calculated. Between each of the nano-FTIR measurements, the tip wasrelocated to the original point on the object. Relocation was done with the help oftopography images, which were recorded in between each interferogramacquisition. Subsequent Fourier transformation of the averaged interferogramsyields the complex valued near-field spectra of the object, En(@)=sn(ω)eio() For normalizing the spectra of the objects, the tip was positioned on a clean areaof the silicon substrate close to the object and reference interferograms wererecorded. We recorded a similar number of interferograms as on the object, eachone in 23 s. Fourier transformation of the averaged interferograms yields the near-field reference spectrum Eref.n(ω)= Sref.n(w)eiPrefn(D), that is, the near-fieldspectrum of the clean silicon surface. By complex-valued division,En(@)/Eref,n(ω),we obtained the normalized amplitude sn(@)/sref,n(@) and phase (n()- Pref,n(@)spectra of the object, yielding the nano-FTIR absorption spectra of the object,an(ω)=sn/Sref,n sin (Pn-Pref,n). FTIR. We used a Bruker Hyperion 2000 microscope coupled to a Vertex 70 FTIRspectrometer equipped with GI and ATR modules and a liquid-nitrogen-cooledmid-band mercury cadmium telluride detector. All FTIR spectra show theabsorbance. The GI module (×15 GI reflection objective, Bruker) comprises a plane mirrorthat reflects the beam onto the sample surface at grazing angle incidence. Thereflected beam is backreflected and refocused onto the same sample area and thencollected and detected. The spectra were measured with a spectral resolution of4cmand present an average over 1,000 scans with a total acquisition time of860 s. All samples were prepared on a 150-nm-thick gold film on silicon. Thereference spectra were recorded on a cleaned 150 nm thick gold film on a siliconwafer. The ATR module (×20 ATR objective, Bruker, single internal reflection)comprises a germanium crystal with a diameter of about 100 pm at the point ofcontact with the sample. The spectra were measured with a spectral resolutionof 4cm-and present an average over 1,000 scans with a total acquisition time of860 s. The samples were prepared on a silicon wafer or on a gold-coated siliconwafer. The reference spectra were recorded on a cleaned silicon wafer or gold-coated silicon wafer, respectively. Decomposition of the amide I band. The band decomposition was performedwith the OPUS software package (version 4.2) supplied by Bruker. As a startingpoint for the curve-fitting procedure, five individual absorption bands were pro-posed at 1,638, 1,655, 1,667, 1,685 and 1,705 cm, defining parallel B-sheets,unordered, a-helices, B-turn and antiparallel -sheet structures, respectively. Thecurve fitting was successfully performed based on the damped least-squares opti-mization algorithm developed by Levenberg-Marquardt and assuming Gaussianband envelopes. The obtained residual root mean squared error was 0.0048. Comparing the nano-FTIR spectrum of the insulin fibrils with a GI-FTIRspectrum of insulin monomers (peak maximum at 1,666 cm), we can assign thepeak at 1,671cm-to a-helical structure. The insulin monomers are dominantlya-helical structure, as we confirmed by circular dichroism measurements shown in Supplementary Fig. S3. The frequency difference between 1,666 and 1,671 cm-might be caused by the structural change from monomer to fibril structure orowing to the different sample support, which in nano-FTIR is silicon and inGI-FTIR is gold. We note that a peak frequency of 1,666 cm-for a-helical structure seems tobe unusually high. However, it can be readily explained by the grazing-incidenceFTIR modality. It is well known that GI-FTIR spectra can be significantly blueshifted compared with standard transmission FTIR spectra36. We demonstrate thisphenomenon in the Supplementary Fig. S1 where we compare a standardtransmission FTIR spectrum with the GI-FTIR spectrum of the insulin monomersample. The peak in the transmission FTIR spectrum occurs at the much lowerfrequency 1,656cm, which matches literature data (ranging from 1,654 to1,658cm- (refs 50-52)). Sample preparation. All water was deionized ultrapure (18MQcm). Substratesurfaces were used as provided, but in some cases additionally cleaned by ultra-sonication in acetone, isopropanol and water (each for 10 min), and blow driedwith nitrogen. For all s-SNOM and nano-FTIR measurements, all samples wereprepared on silicon wafers. For GI-FTIR measurements, gold substrates wereused (150 nm of thermally evaporated gold deposited on a silicon wafer), while forATR-FTIR measurements silicon or gold-coated silicon wafers were used. TMV samples. TMV suspension: A suspension of TMV (strain vulgare), purifiedfrom systemically infected tobacco plants (Nicotiana tabacum cv Samsun nn) waskindly provided by Professor C. Wege (University of Stuttgart, Germany). TMVwas dialyzed against water in a 10-kDa Slide-A-Lyzer dialysis unit (Thermo FisherScientific), and diluted with water. TMV for s-SNOM: Ten microlitres of 1 pg ml-1 suspension was spin coated(spin coater SCI-20, Schaefer Technologie) on a cleaned silicon wafer anddried in air. TMV for GI-FTIR: Ten microlitres of 1ug ml- suspension was spin coated ona gold wafer, and dried in air. Ferritin samples. Ferritin solution: Horse spleen ferritin solution (44mg ml,Sigma-Aldrich) was diluted 500-fold with water. Ferritin for s-SNOM: A droplet of Ferritin solution was deposited on a siliconwafer and incubated for 2 min. Excess of solution was removed with filter paper(Sigma) and the sample was dried in air. Ferritin for GI-FTIR: Ferritin solution was first purified with a spin desaltingcolumn (7K MWCO, Thermo Scientific) and followed with the procedure asabove, but on a gold substrate. PM samples. Halobacteria (H. salinarum strain S9) were cultivated in high-saltpepton medium (10gl-一 pepton, 4.3 M NaCl, 80 mM MgSO4, 27 mM KCl, 10 mMsodium citrate, pH 6.5) for 6 days. The collected cells were lysed by osmotic shockwith distilled water. PM fragments were purified by fractionated centrifugation53. PM for s-SNOM: A 30-ul droplet of a buffer pH 7.8, containing 150 mM of KCland 20 mM of Tris, was deposited on a silicon substrate and 0.2 pl of purified PM(6 mg ml-1) was added into the droplet. Fifteen microlitres of imaging buffer wassubsequently added into the droplet to ensure maximum dispersion of previouslyadded PMs. The resulting droplet was incubated on the silicon substrate for 25 minand then rinsed several times with water and dried in air. PM for GI-FTIR: Same sample preparation procedure as for s-SNOM, but agold substrate was used and the PM was incubated for 40 min. Insulin aggregate samples. Insulin aggregate solution: Dispersions were preparedsolubilizing 20 mg dehydrated human insulin (Sigma-Aldrich) in 1 ml 1 mM HClsolution. The solution was then re-diluted in 10 mM HCI/KCl at 2 mg ml-1, andincubated at 60℃ for 24 h in a thermomixer (Eppendorf), followed by 2 yearsstorage at 4℃. Insulin aggregates (+TMV) for s-SNOM: Ten microlitres of insulin aggregatesolution was spin coated (as for TMV) on a silicon substrate, and rinsed with water.Ten microlitres of 1ug ml-1 TMV suspension was then spin coated on the driedinsulin aggregates. Insulin aggregates for ATR-FTIR: Twenty microlitres of insulin aggregatesolution was deposited on a silicon wafer, dried and rinsed with water. Insulin fibril samples. Insulin fibril solution: Dispersions were prepared as above,but incubated at 60°C for 30 h. Insulin fibrils for s-SNOM: Ten microlitres of insulin fibril solution was spincoated on a silicon wafer and rinsed with water. Insulin monomer samples. Insulin monomer solution: Dispersions were preparedas above, but without any incubation. Insulin monomer for GI-FTIR: Twenty microlitres of insulin monomer solutionwas spin coated on a gold substrate and rinsed with water. References 1.Venyaminov, S. Y. & Kalnin, N. N. Quantitative IR spectrophotometry ofpeptide compounds in water (H2O) solutions. I. Spectral parameters ofamino-acid residue absorption-bands. Biopolymers 30, 1243-1257 (1990). 2.Jackson, M. & Mantsch, H. H. The use and misuse of FTIR spectroscopy in thedetermination of protein-structure. Crit. Rev. Biochem. Mol. Biol. 30, 95-120(1995). 3.Garczarek, F. & Gerwert, K. Functional waters in intraprotein proton transfermonitored by FTIR difference spectroscopy. Nature 439, 109-112(2006). 4.Ataka, K., Kottke, T. & Heberle, J. Thinner, smaller, faster: IR techniques toprobe the functionality of biological and biomimetic systems. Angew. Chem Int.Ed. 49,5416-5424 (2010). ( 5. G upta, S . C . et a l. Multitargeting by curcumin a s r e vealed by molecular i nteraction studies. Natural Product Reports 28, 1937-1955 (2011). ) ( 6 . M ahmoudi, M. e t al. Protein-nanoparticle interactions: opportunities and c hallenges. Chem. Rev. 1 11, 5610-5637 (2011). ) 7.Lasch, P., Haensch, W., Naumann, D. & Diem, M. Imaging of colorectaladenocarcinoma using FT-IR microspectroscopy and cluster analysis. Biochim.Biophys. Acta 1688,176-186 (2004). 8.Caine, S., Heraud, P., Tobin M. J.,McNaughton, D. & Bernard, C. C. A. Theapplication of Fourier transform infrared microspectroscopy for the study ofdiseased central nervous system tissue. Neuroimage 59, 3624-3640 (2012). 9Xia, Z., Yu, X. & Wei, M. Biomimetic collagen/apatite coating formation onTi6Al4V substrates. J Biomed. Mater. Res.B Appl. Biomater. 100B, 871-881(2012). 10. Byler, D. M. & Susi, H. Examination of the secondary structure of proteins bydeconvolved FTIR spectra. Biopolymers 25, 469-487 (1986). 11. Bouchard, M., Zurdo, J., Nettleton, E. J., Dobson, C. M. & Robinson, C. V.Formation of insulin amyloid fibrils followed by FTIR simultaneously with CDand electron microscopy. Prot. Sci. 9,1960-1967 (2000). 12. Ritter, C. et al. Correlation of structural elements and infectivity of the HET-sprion. Nature 435,844-848 (2005). 13. Rodriguez-Perez, J. C., Hamley, I. W., Grasb, S. L. & Squires, A. M. Localorientational disorder in peptide fibrils probed by a combination of residue-specific C-13-O-18 labelling, polarised infrared spectroscopy and molecularcombing. Chem. Comm. 48, 11835-11837 (2012). 14. Amarie, S. & Keilmann, F. Broadband-infrared assessment of phononresonance in scattering-type near-field microscopy. Phys. Rev. B 83, 045404(2011). 15. Huth, F., Schnell, M., Wittborn, J.,Ocelic, N. & Hillenbrand, R. Infrared-spectroscopic nanoimaging with a thermal source. Nat. Mater. 10, 352-356(2011). 16. Amarie, S. et al. Nano-FTIR chemical mapping of minerals in biologicalmaterials. Beilstein J. Nanotechnol. 3, 312-323 (2012). 17. Huth, F. et al. Nano-FTIR absorption spectroscopy of molecular fingerprints at20 nm spatial resolution. Nano Lett. 12,3973-3978 (2012). 18. Xu, X. J. G., Rang, M., Craig, I. M. & Raschke, M. B. Pushing the sample-sizelimit of infrared vibrational nanospectroscopy: from monolayer toward singlemolecule sensitivity.J. Phys. Chem. Lett. 3, 1836-1841 (2012). 19. Govyadinov, A. A., Amenabar, I, Huth, F., Carney, P. S. & Hillenbrand, R.Quantitative measurement of local infrared absorption and dielectric functionwith tip-enhanced near-field microscopy. J. Phys. Chem. Lett. 4, 1526-1531(2013). 20. Keilmann, F. & Hillenbrand, R.Nano-Optics and Near-Field Optical Microscopy(Artech House, 2008). 21. Stockle, R. M., Suh, Y. D., Deckert, V. & Zenobi, R. Nanoscale chemicalanalysis by tip-enhanced Raman spectroscopy. Chem. Phys. Lett. 318, 131-136(2000). 22. Hartschuh, A., Sanchez, E. J., Xie, X. S. & Novotny, L. High-resolution near-field Raman microscopy of single-walled carbon nanotubes. Phys. Rev. Lett. 90,095503 (2003). 23. Ichimura, T., Hayazawa, N., Hashimoto, M., Inouye, Y. & Kawata, S. Tip-enhanced coherent anti-Stokes Raman scattering for vibrational nanoimaging.Phys. Rev. Lett. 92, 220801 (2004). 24. Verma, P., Ichimura, T., Yano, T.-a., Saito, Y. & Kawata, S. Nano-imagingthrough tip-enhanced Raman spectroscopy: stepping beyond the classicallimits. Laser Photonics Rev. 4,548-561 (2010). 25. Brehm,M., Taubner, T., Hillenbrand, R. & Keilmann, F. Infrared spectroscopicmapping of single nanoparticles and viruses at nanoscale resolution. Nano Lett.6,1307-1310 (2006). ( 26. Wollny, G., Bruendermann, E., Arsov, Z., Quaroni, L . & Havenith, M Nanoscale depth r e solution i n scanning near-field infrared microscopy. Opt.Express 16, 7453-7459 (2008). ) 27. Ballout, F. et al. Scanning near-field IR microscopy of proteins in lipid bilayers.Phys. Chem. Chem. Phys. 13, 21432-21436 (2011). 28. Paulite, M. et al. Imaging secondary structure of individual amyloid fibrils of aB2-microglobulin fragment using near-field infrared spectroscopy. J. Am.Chem. Soc. 133, 7376-7383 (2011). 29. Li, J. J. & Yip, C. M. Super-resolved FT-IR spectroscopy: strategies, challenges,and opportunities for membrane biophysics. Biochim. Biophys. Acta 1828,2272-2282 (2013). 30. Theil, E. C., Behera, R. K.& Tosha, T. Ferritins for chemistry and for life.Coord. Chem. Rev. 257,579-586(2013). 31. Ge, P. & Zhou, Z. H. Hydrogen-bonding networks and RNA bases revealed bycryo electron microscopy suggest a triggering mechanism for calcium switches.Proc. Natl Acad. Sci. USA 108, 9637-9642 (2011). ( 32. I vanova, M. I., Sievers, S. A ., S awaya, M . R., Wall, J. S. & Eisenberg, D.Molecular basis f or i nsulin fibri l assembly. Proc . Natl Acad. Sci . USA 106, 1 8990- 1 8995 (2009). ) ( 33. Henderson, R . & Unwin, P . N . T. Three-dimensional model of purplemembrane obtained by e l ectron-microscopy. N ature 257, 2 8-32 (1975). ) ( 34. Ocelic, N., Huber, A.& H i llenbrand, R . P s eudoheterodyne detection forbackground-free near-field spectroscopy. Appl. Ph y s. Lett. 89, 10 1 124 (20 0 6). ) 35. Keilmann, F. & Amarie, S. Mid-infrared frequency comb spanning an octavebased on an er fiber laser and difference-frequency generation. J. InfraredMillimeter Terahertz Waves 33, 479-484 (2012). 36. Griffiths, P. R. & de Haseth, J. A. Fourier Transform Infrared Spectrometry(Wiley, 2007). 37. Rothschild, K. J. & Clark, N. A. Polarized infrared spectroscopy of orientedpurple membrane. Biophys.J. 25, 473-487 (1979). 38. Jiang, X. et al. Resolving voltage-dependent structural changes of a membranephotoreceptor by surface-enhanced IR difference spectroscopy. Proc. Natl Acad.Sci. USA 105, 12113-12117(2008). 39. Salzer, R. & Siesler, H.W. Infrared and Raman Spectroscopic Imaging (Wileycom, 2009). 40. Selivanova, O. M. & Galzitskaya, O. V. Structural polymorphism and possiblepathways of amyloid fibril formation on the example of insulin protein.Biochemistry 77, 1237-1247 (2012). 41. Jimenez, J. L. et al. The protofilament structure of insulin amyloid fibrils. Proc.Natl Acad. Sci. USA 99, 9196-9201 (2002). 42. Deckert-Gaudig, T. & Deckert,V. Tip-enhanced Raman scattering (TERS) andhigh-resolution bio nano-analysis - a comparison. Phys. Chem. Chem. Phys. 12,12040-12049(2010). ( 43. Kurouski, D . , Deckert-Gaudig, T. , Deckert, V. & Lednev, I. K . Structure and composition o f insulin f i bril surfaces probed by TERS. J. Am. Chem. Soc. 134, 13323-13329 (2012). ) ( 44. Khurana, R. e t al. A general m o del fo r am y loid fib r il assembly based onmorphological studies u s ing atomic force microscopy. Bi o phys. J. 8 5 , 1 1 35-1144 (2003). ) 45. Guo, S. & Akhremitchev, B. B. Packing density and structural heterogeneity ofinsulin amyloid fibrils measured by AFM nanoindentation. Biomacromolecules7, 1630-1636(2006). ( 46. Cheatum, C. M., Tokmakoff, A. & Knoester, J. Si g n a tures of beta-sheet secondary s t ructures in l inear and two-dimensional infrared spectroscopy. J. Chem. Phys. 120, 8201-8215 (2004). ) ( 47. Huth, F. e t al. Resonant antenna probes for tip-enhanced infrared near-field microscopy. N ano Lett. 1 3, 1 065-1072 ( 2 013). ) 48. Fragola, A., Aigouy, L., Mignotte, P. Y., Formanek, F. & De Wilde, Y.Apertureless scanning near-field fluorescence microscopy in liquids.Ultramicroscopy 101, 47-54(2004). 49. Hoppener, C., Siebrasse, J. P., Peters, R., Kubitscheck, U. & Naber, A. High-resolution near-field optical imaging of single nuclear pore complexes underphysiological conditions. Biophys. J. 88, 3681-3688 (2005). 50. Dzwolak, W., Loksztejn, A. & Smirnovas, V. New insights into the self-assembly of insulin amyloid fibrils: an HD exchange FT-IR study. Biochemistry45, 8143-8151 (2006). 51. Nielsen, L., Frokjaer, S., Carpenter, J. F. & Brange, J. Studies of the structure ofinsulin fibrils by Fourier transform infrared (FTIR) spectroscopy and electronmicroscopy. J. Pharm. Sci. 90, 29-37(2001). 52. Webster, G. T., Dusting, J, Balabani, S. & Blanch, E. W. Detecting the earlyonset of shear-induced fibril formation of insulin in situ. J. Phys. Chem. B 115,2617-2626 (2011). 53. Oesterhelt, D. & Stoeckenius, W.Isolation of the cell membrane ofHalobacterium halobium and its fractionation into red and purple membrane.Methods Enzymol. 31, 667-678 (1974). Acknowledgements We thank Professor Christina Wege (Universitat Stuttgart) for providing the TMV. Thiswork was financially supported by an ERC Starting Grant (TERATOMO), the SpanishMinisterio de Economia y Competitividad (Projects MAT2012-36580 and MAT2010-16184) and the Basque Government (Project number PI2010-7 and nanoIKER Etortek-2011) Author contributions All authors were involved in designing the research, performing the research and writingthe manuscript. Additional information Supplementary Information accompanies this paper at http://www.nature.com/naturecommunications Competing financial interests: R.H. is co-founder of Neaspec GmbH, a companyproducing scattering-type scanning near-field optical microscope systems, such as theone used in this study.The remaining authors declare no competing financial interests. Reprints and permission information is available online at http://npg.nature.com/reprintsandpermissions/ How to cite this article: Amenabar, I. et al. Structural analysis and mapping ofindividual protein complexes by infrared nanospectroscopy. Nat. Commun. 4:2890doi: 10.1038/ncomms3890 (2013). ①③OThis work is licensed under a Creative Commons Attribution-BY NC SA NonCommercial-ShareAlike 3.0 Unported License. To view a copy ofthis license, visit http://creativecommons.org/licenses/by-nc-sa/3.0/ ATURE COMMUNICATIONS|:DOI: ncommswww.nature.com/naturecommunications Macmillan Publishers Limited. All rights reserved.
确定
还剩7页未读,是否继续阅读?

产品配置单

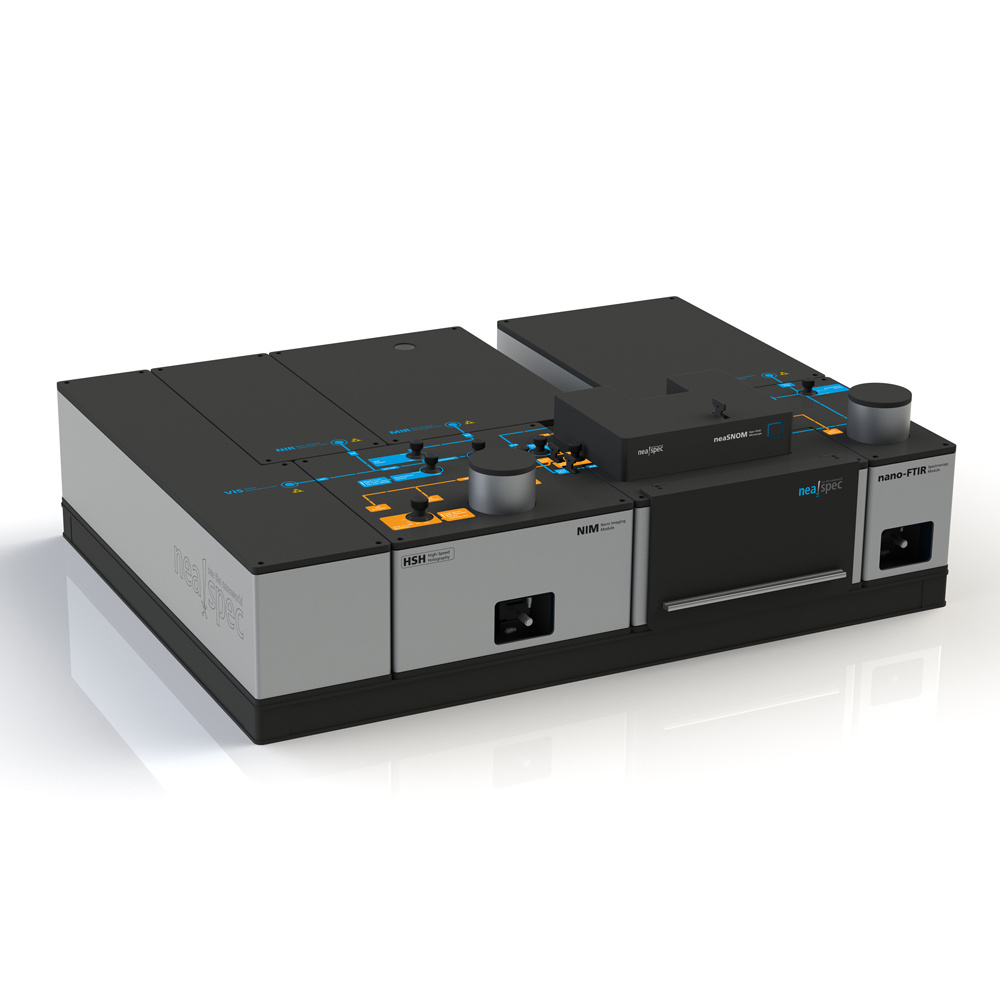
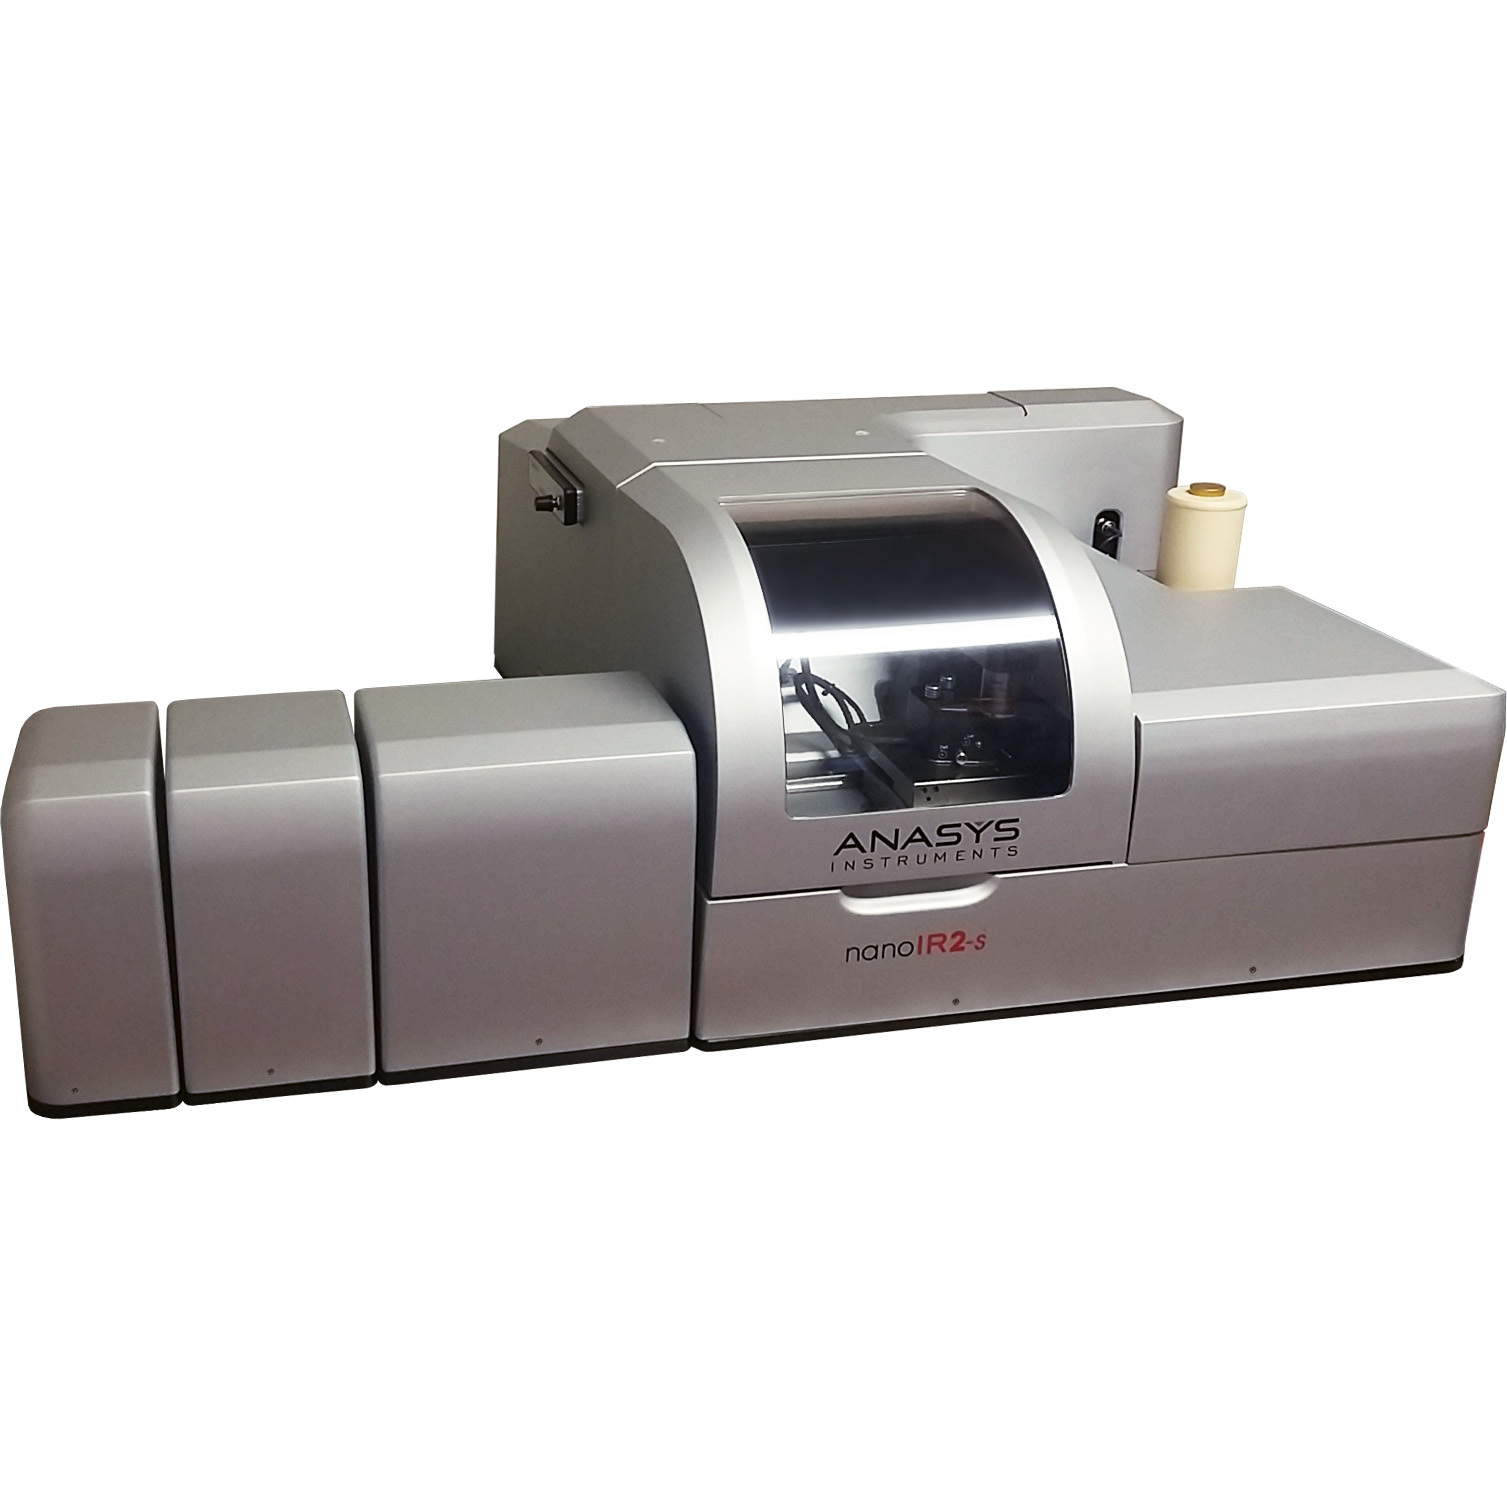
QUANTUM量子科学仪器贸易(北京)有限公司为您提供《蛋白质、胰岛素纤丝中结构分析和成像检测方案(红外光谱仪)》,该方案主要用于其他中结构分析和成像检测,参考标准--,《蛋白质、胰岛素纤丝中结构分析和成像检测方案(红外光谱仪)》用到的仪器有德国Neaspec纳米傅里叶红外光谱仪nano-FTIR
推荐专场

相关方案
更多
该厂商其他方案
更多