


多年来,大气汞一直被视为全球污染物。转移大气中的汞化合物及其在地表的沉降是一个需要对该金属的各种形态在环境要素间循环具有一定知识的重要问题。执行的所有分析中使用的实验室玻璃器皿和所有的玻璃设备都经过Miele美诺清洗消毒机的再处理。
方案详情

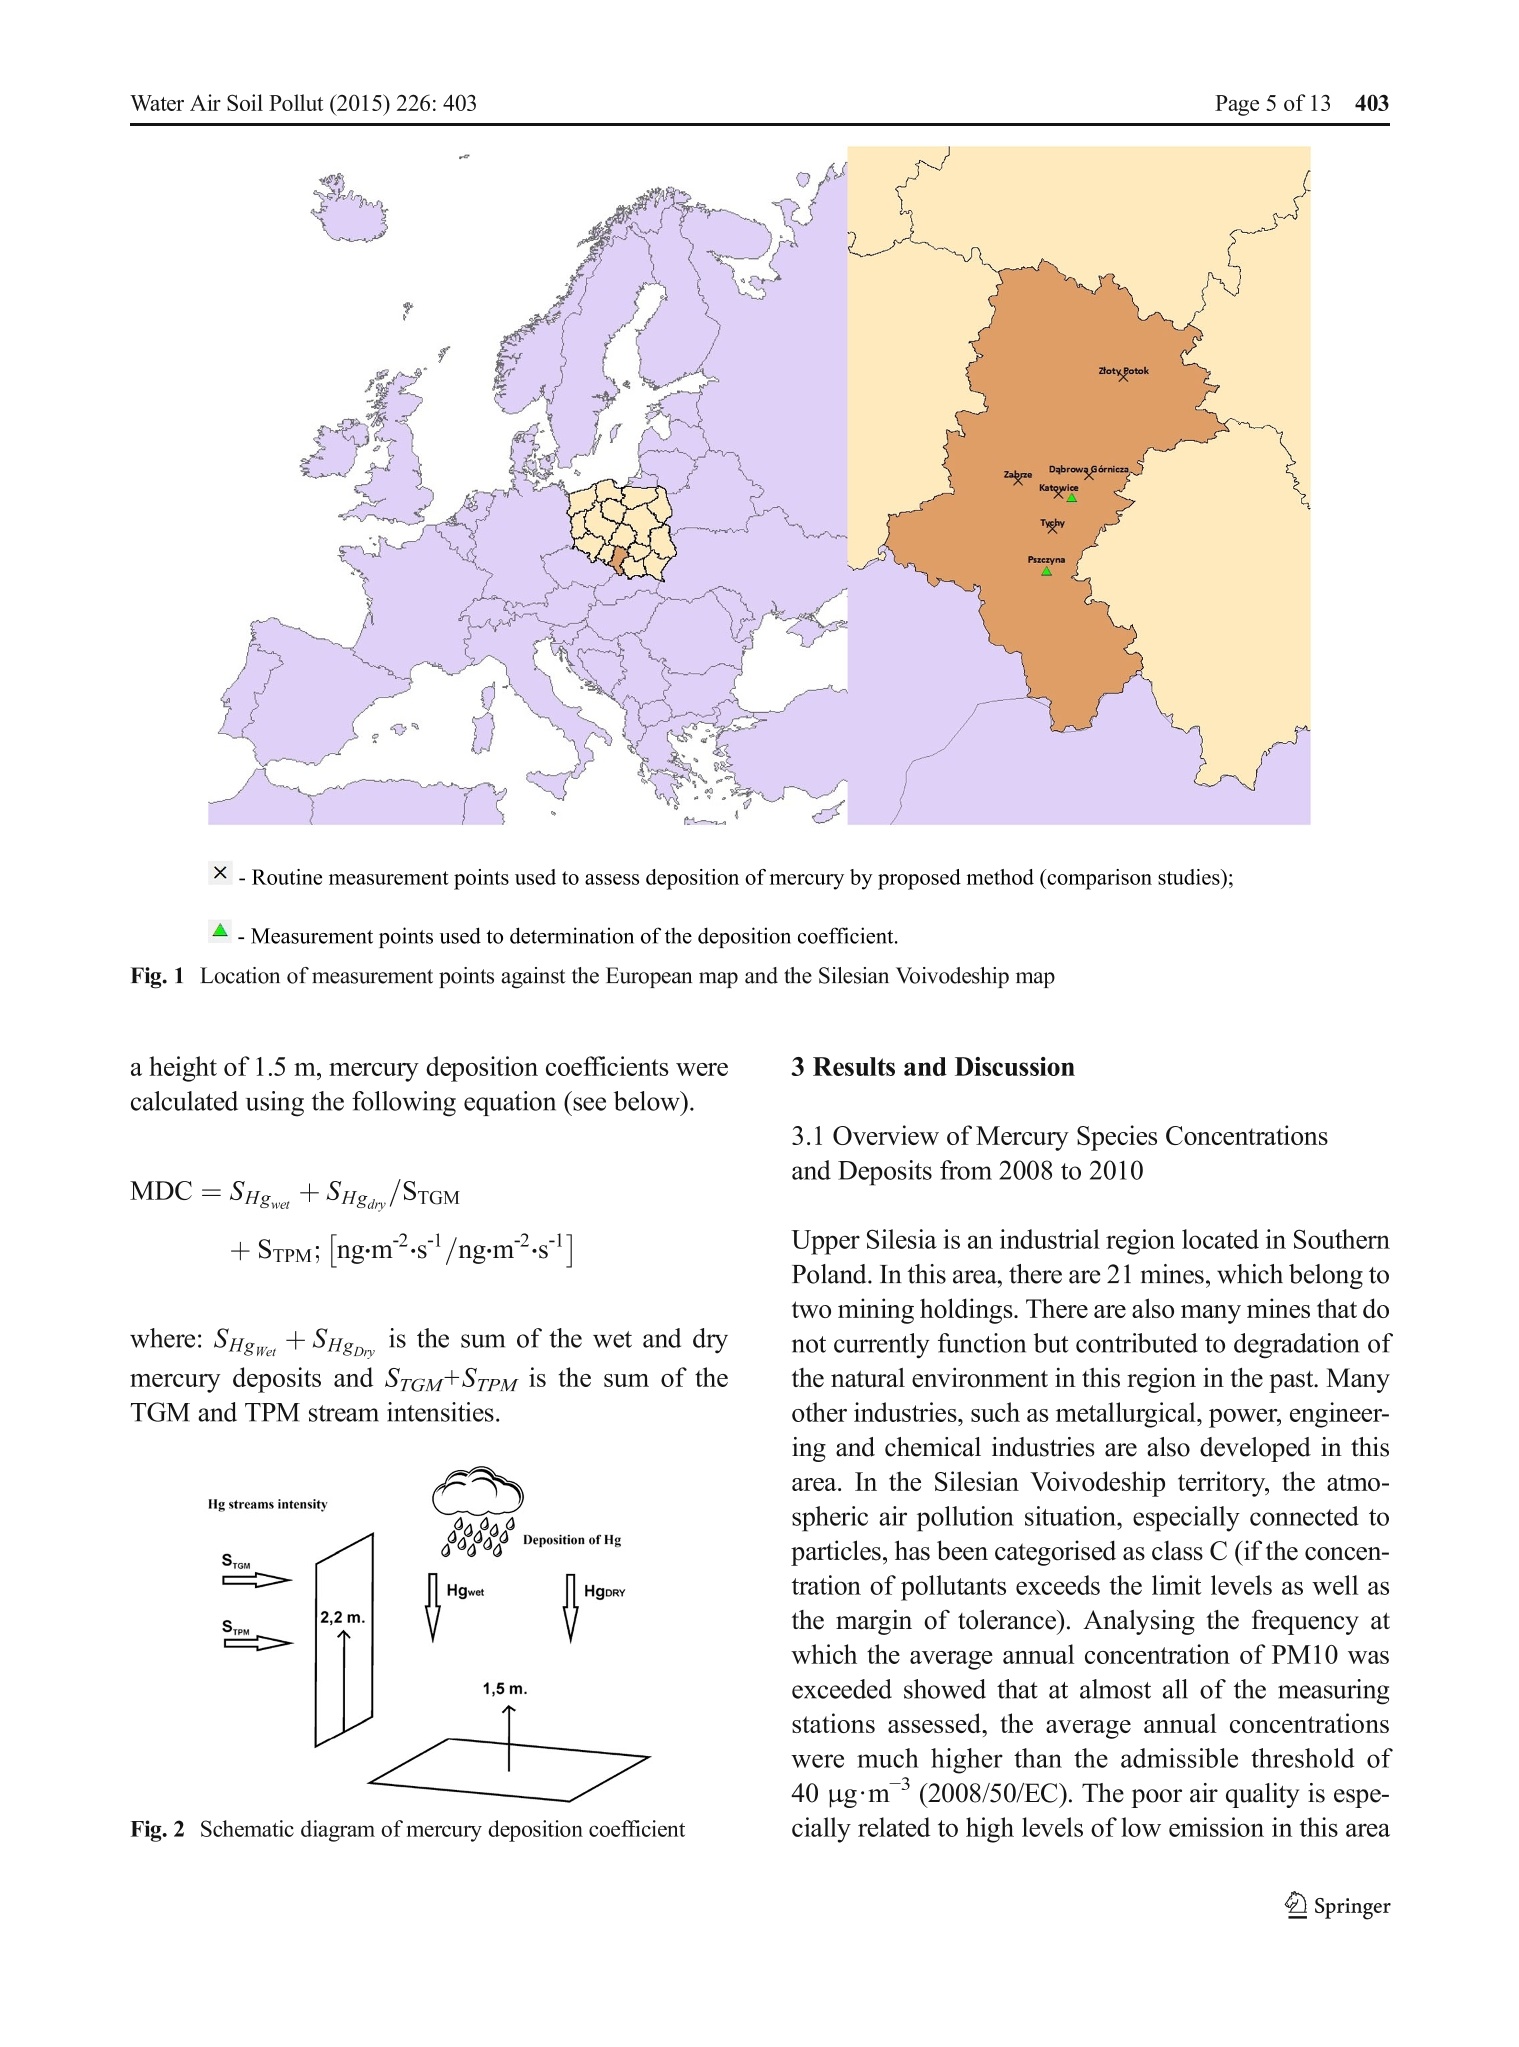
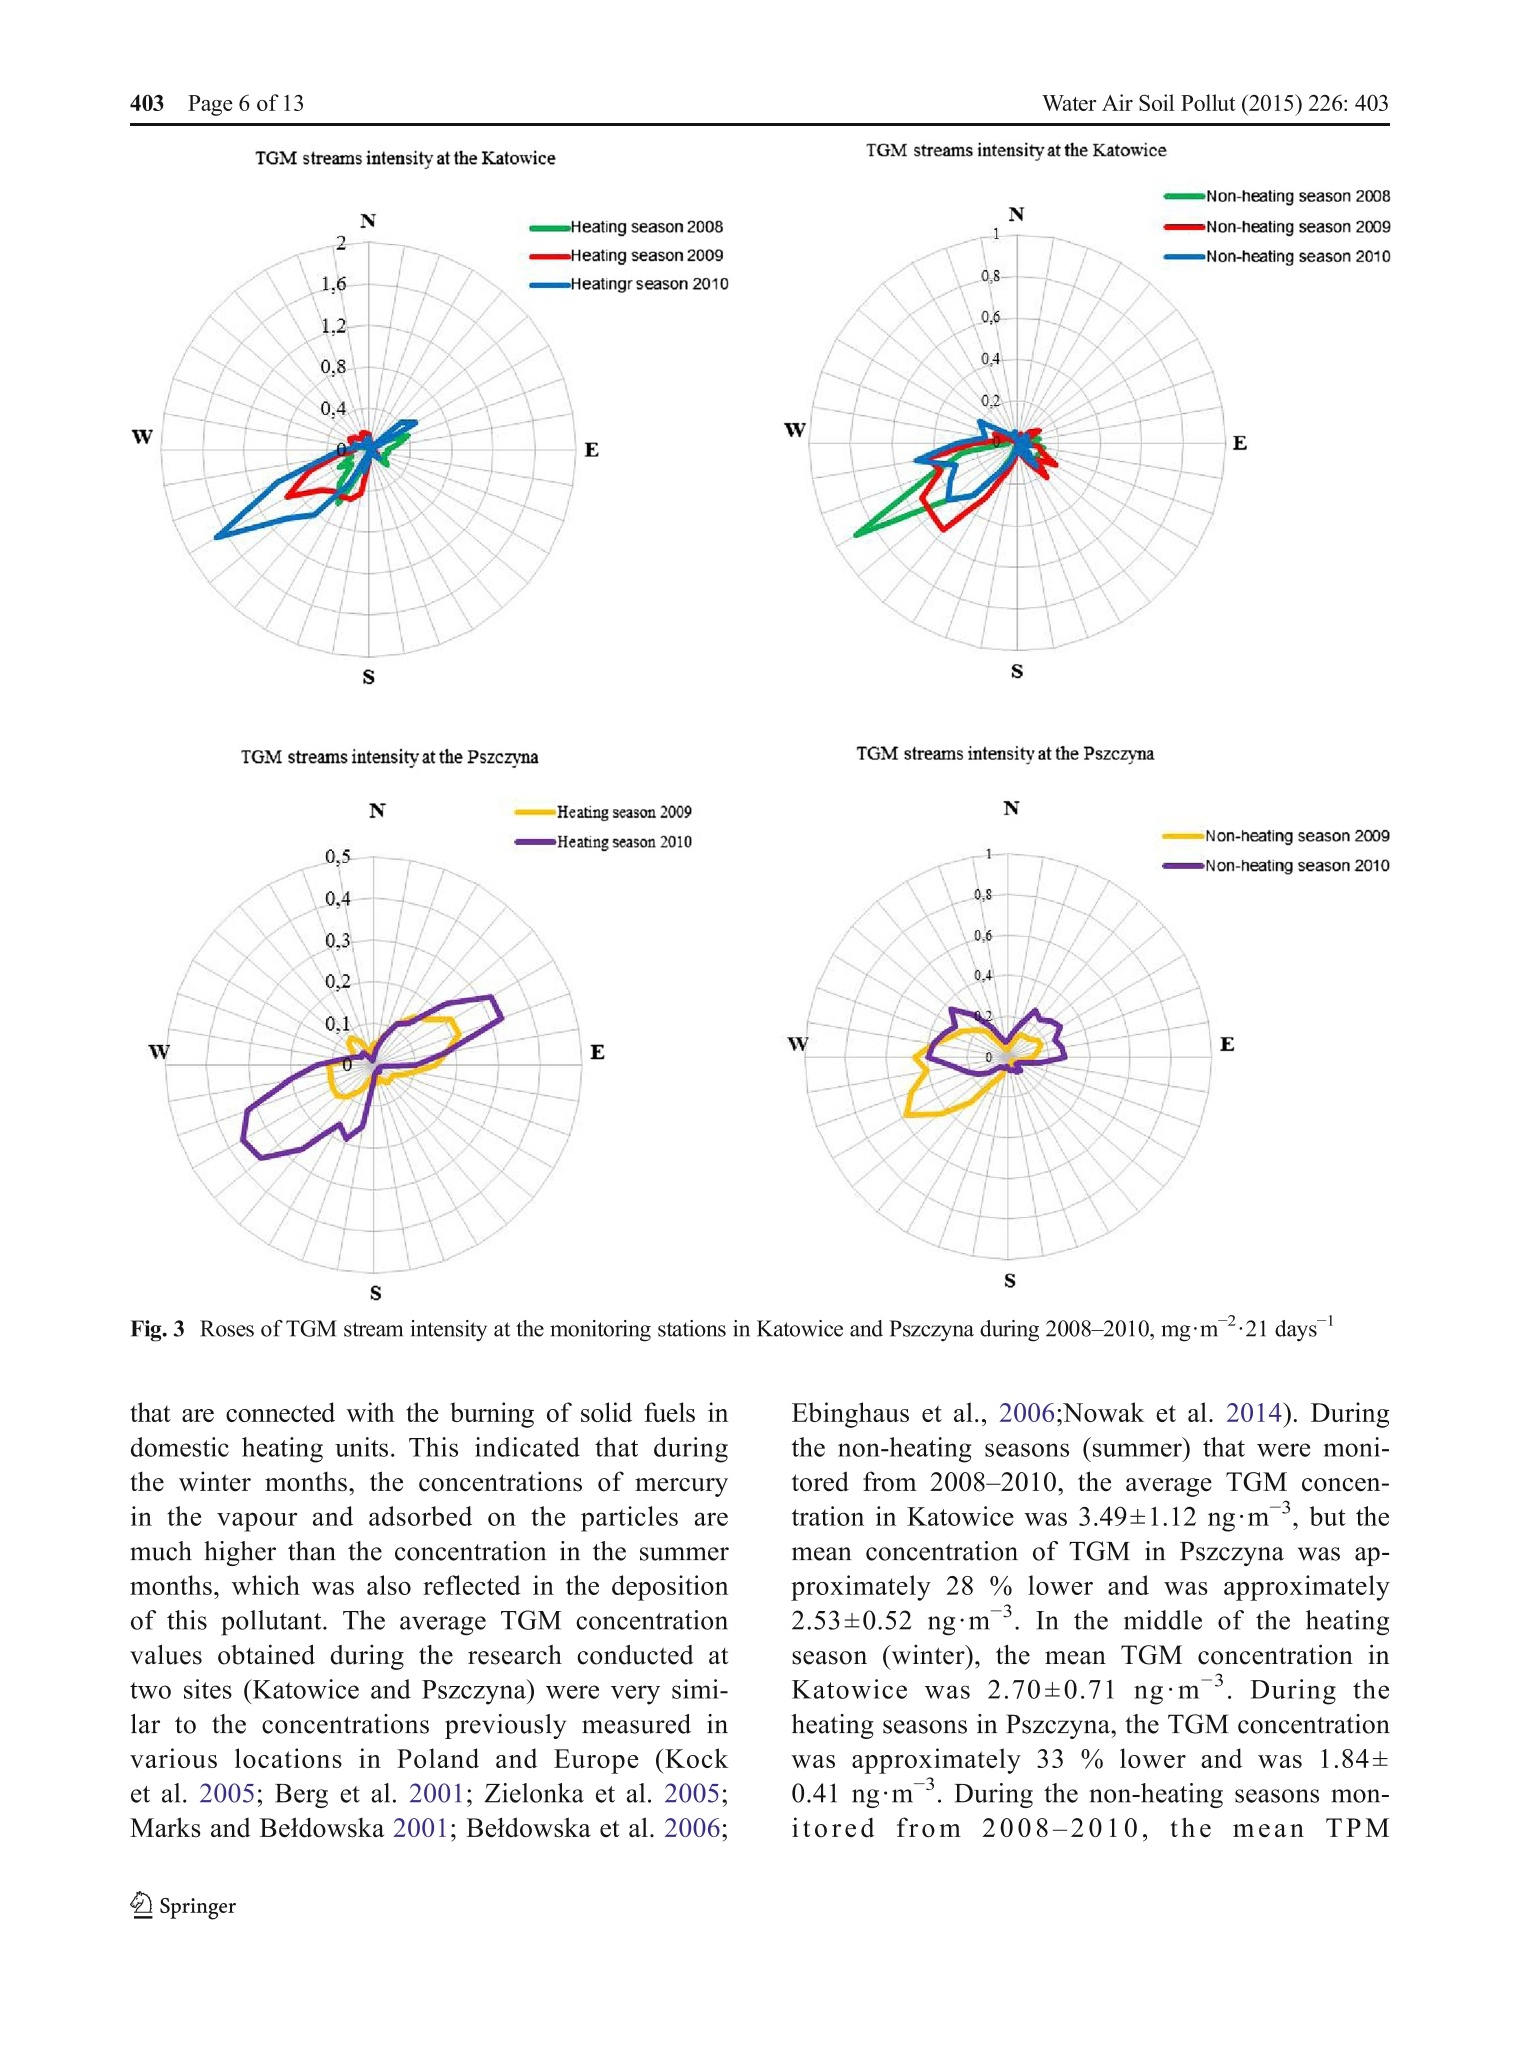
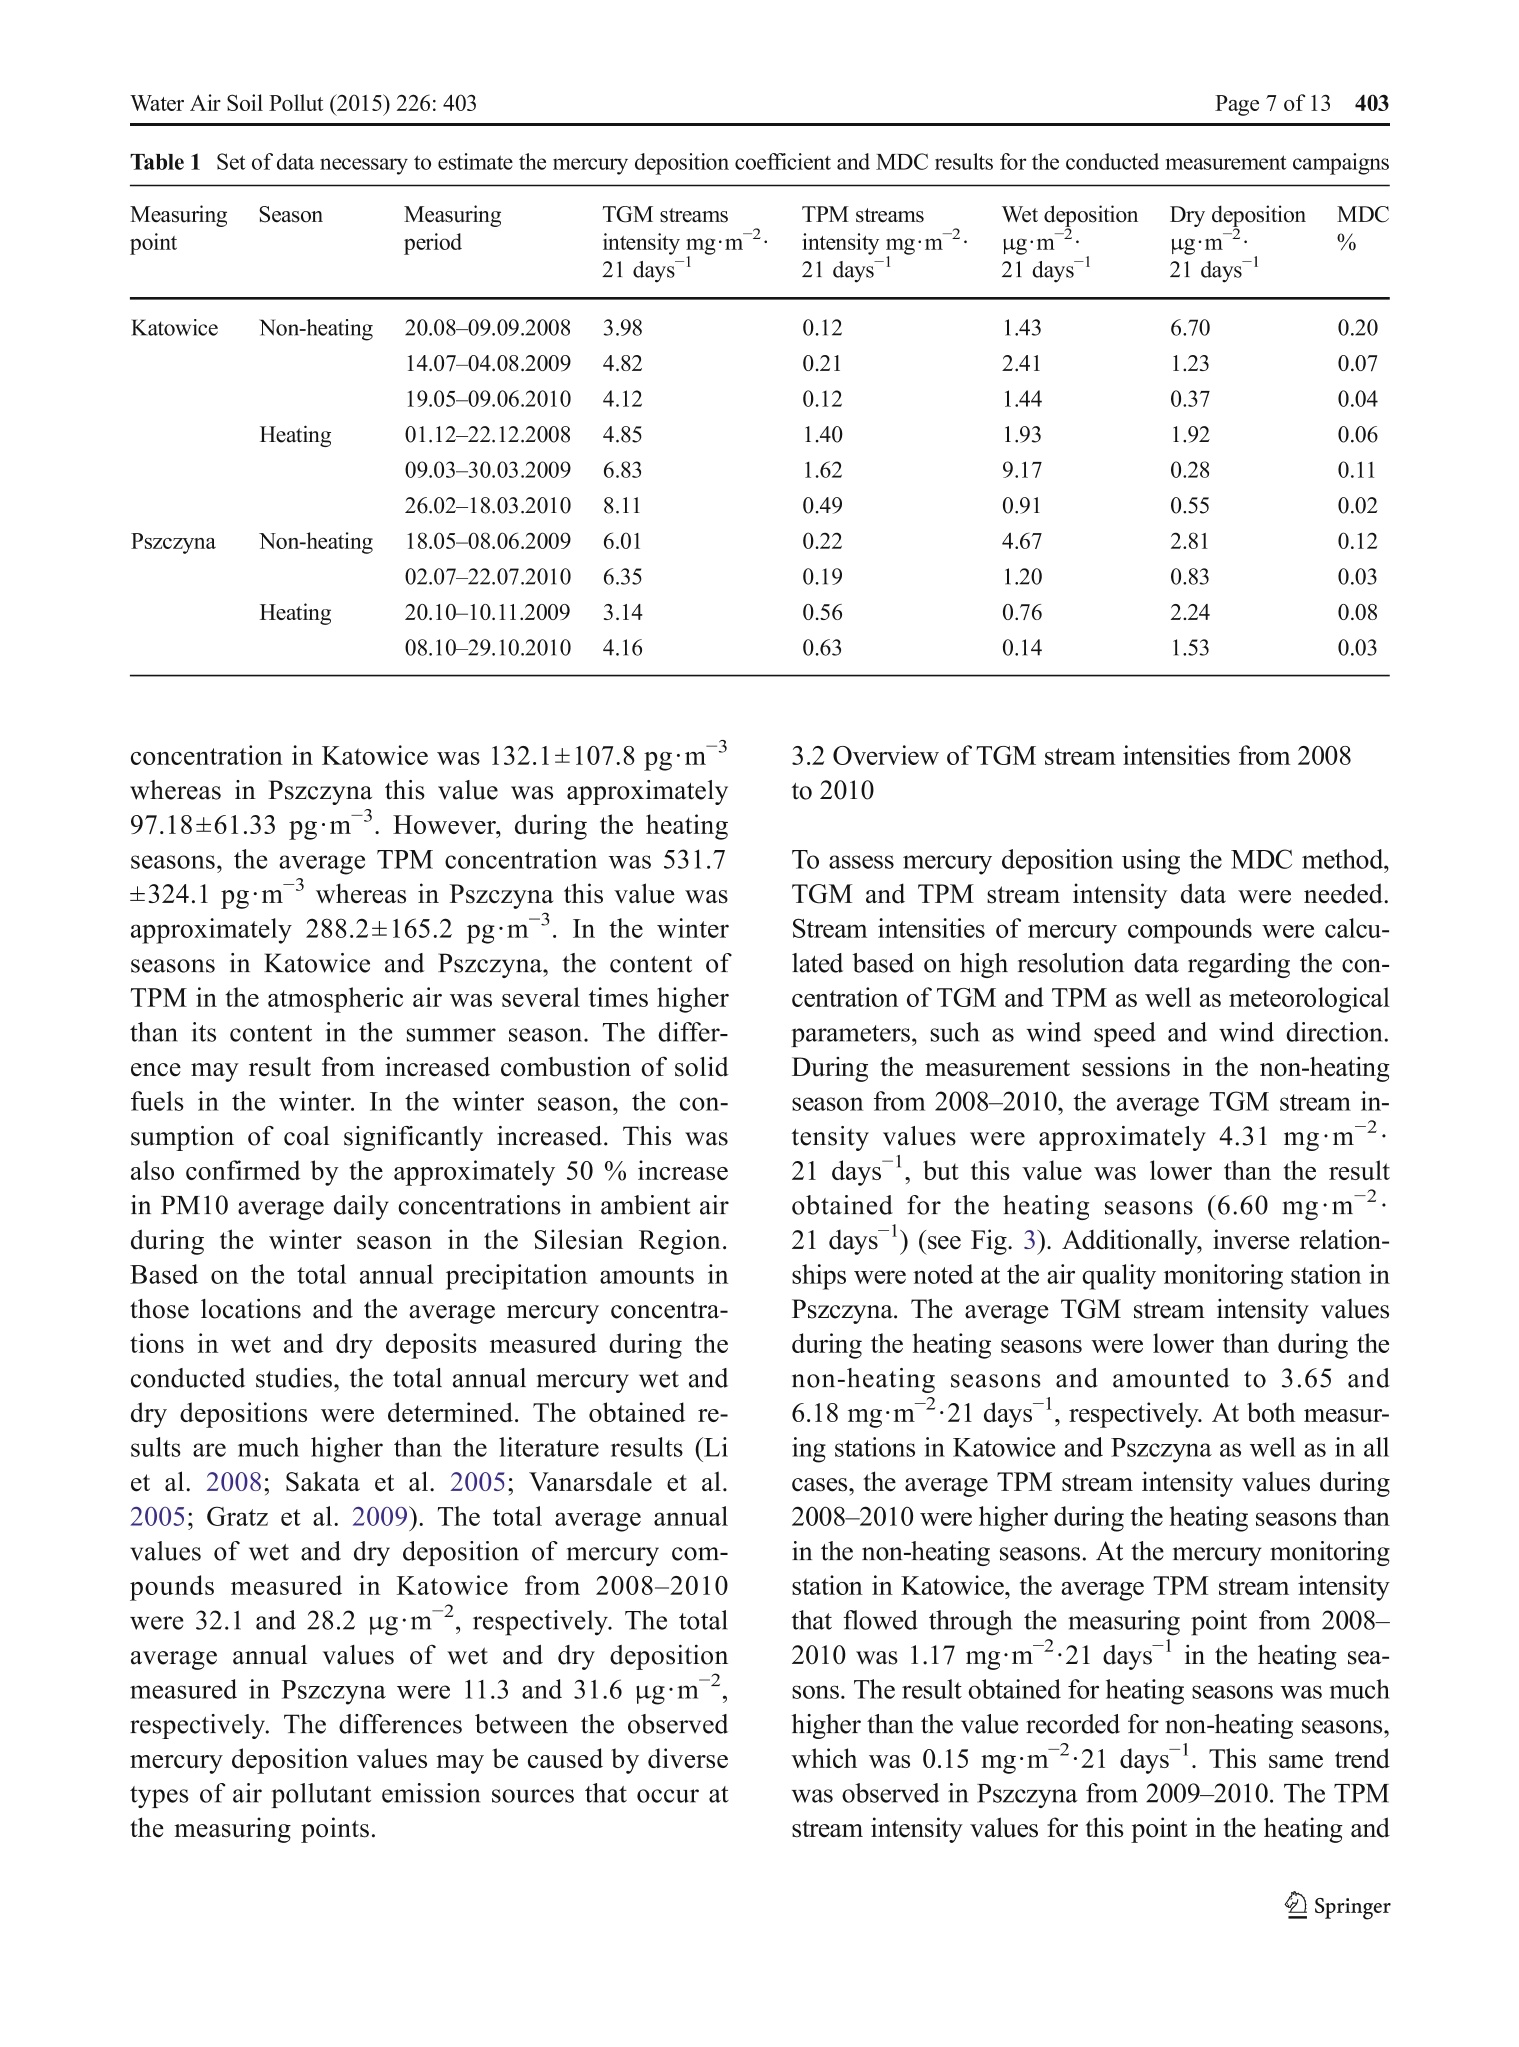
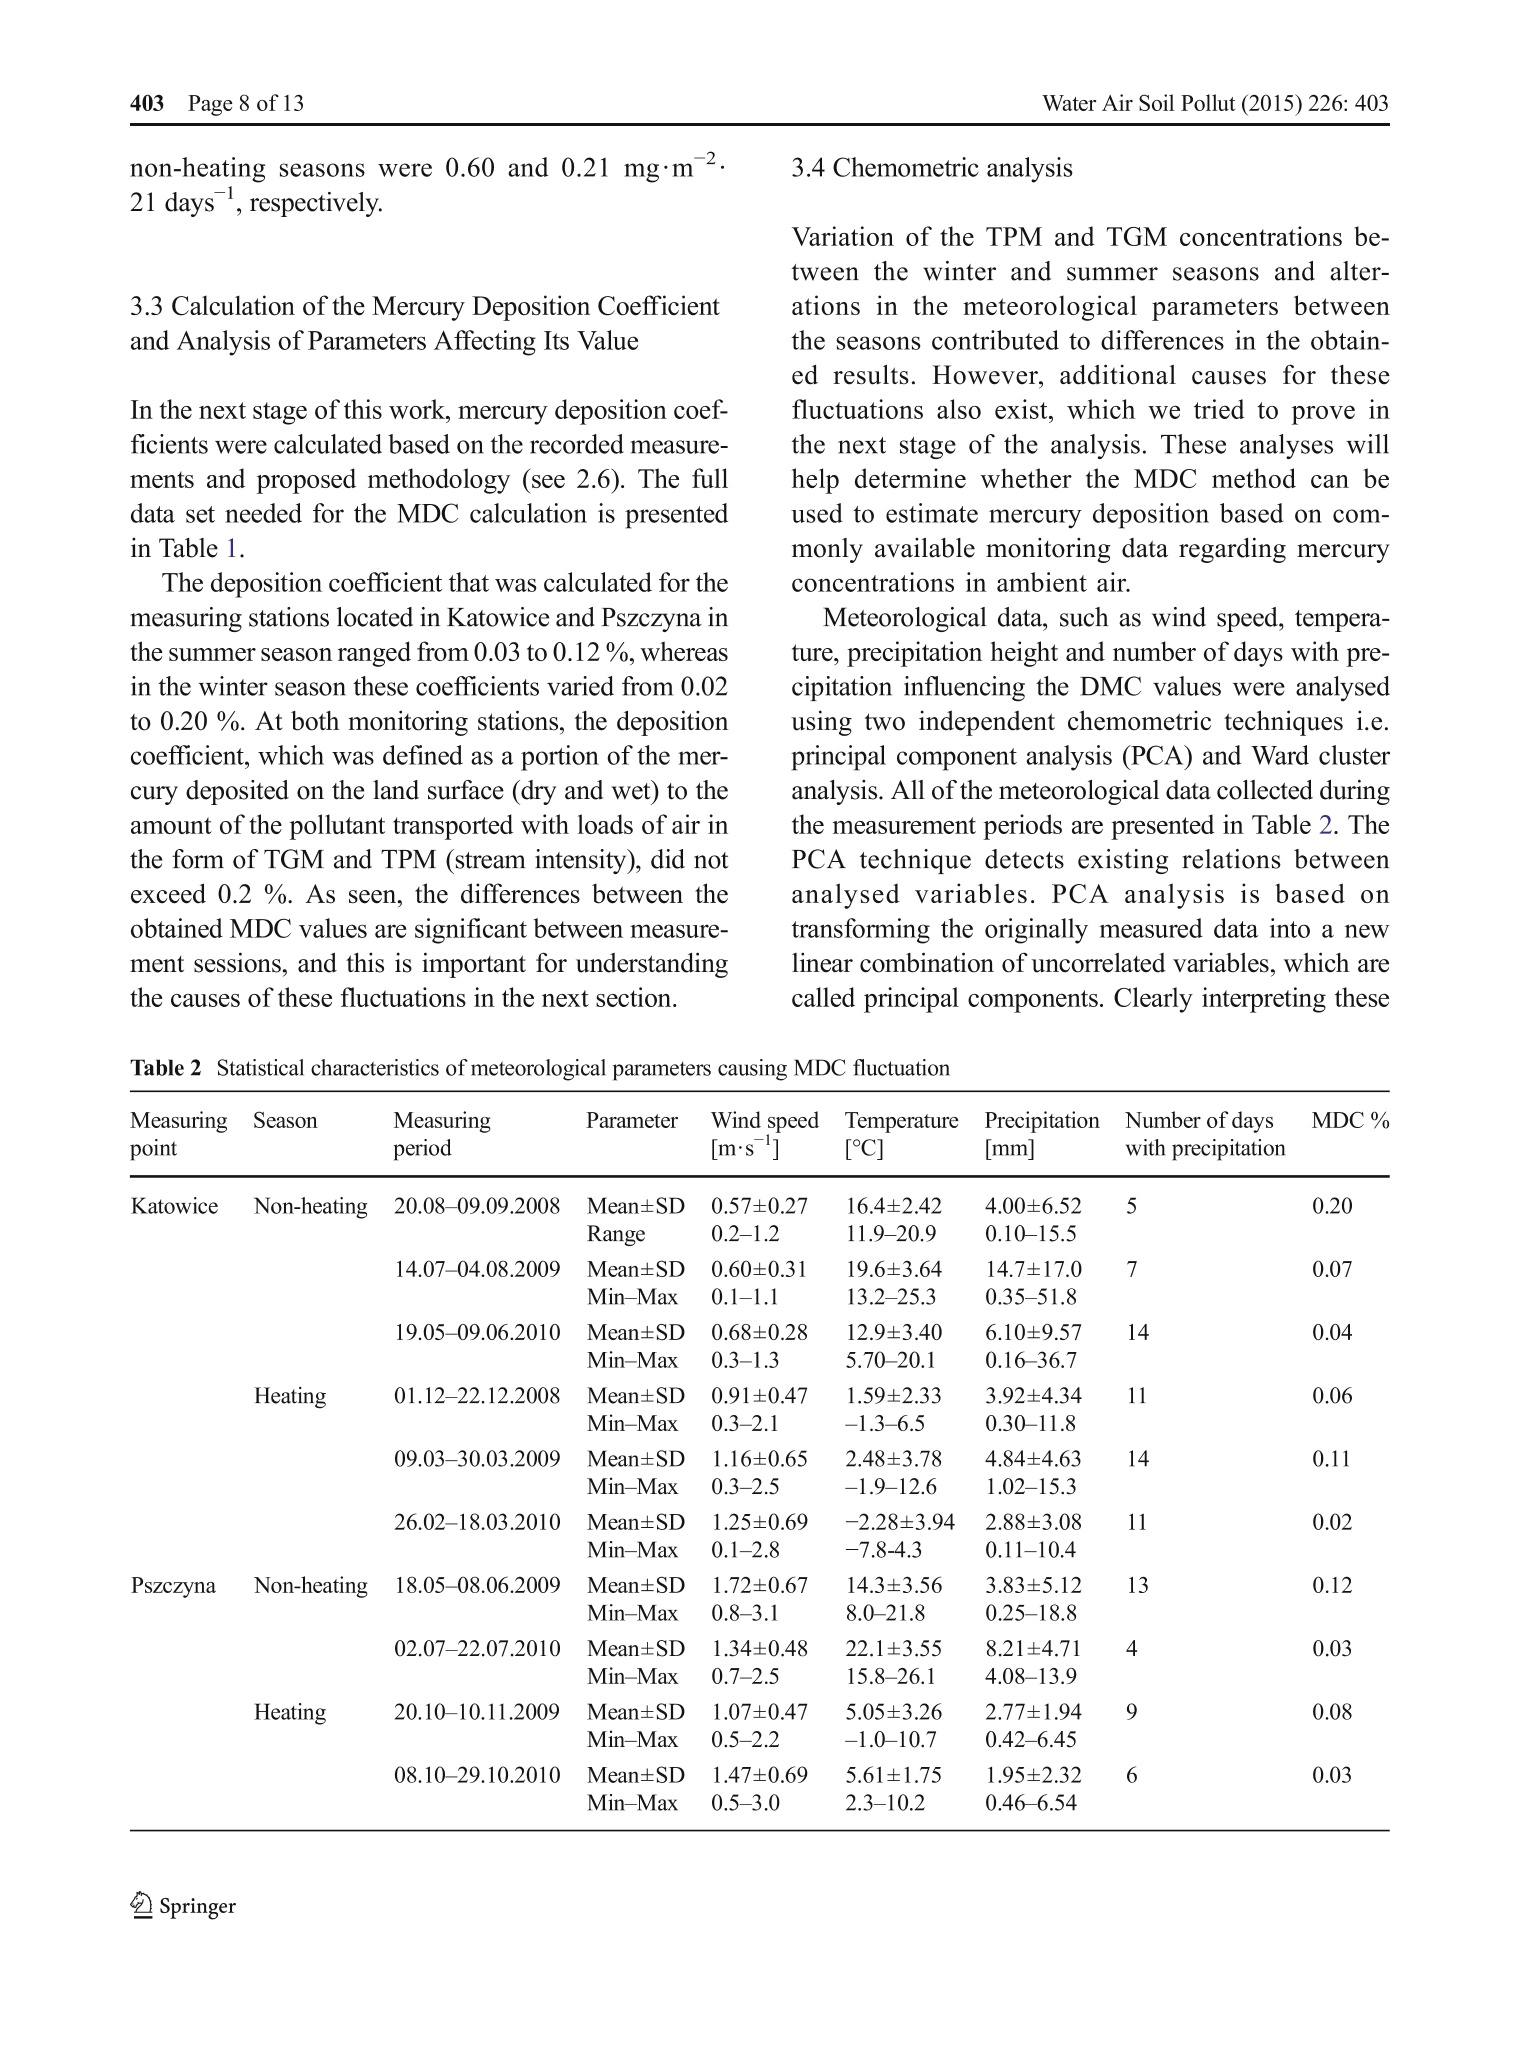
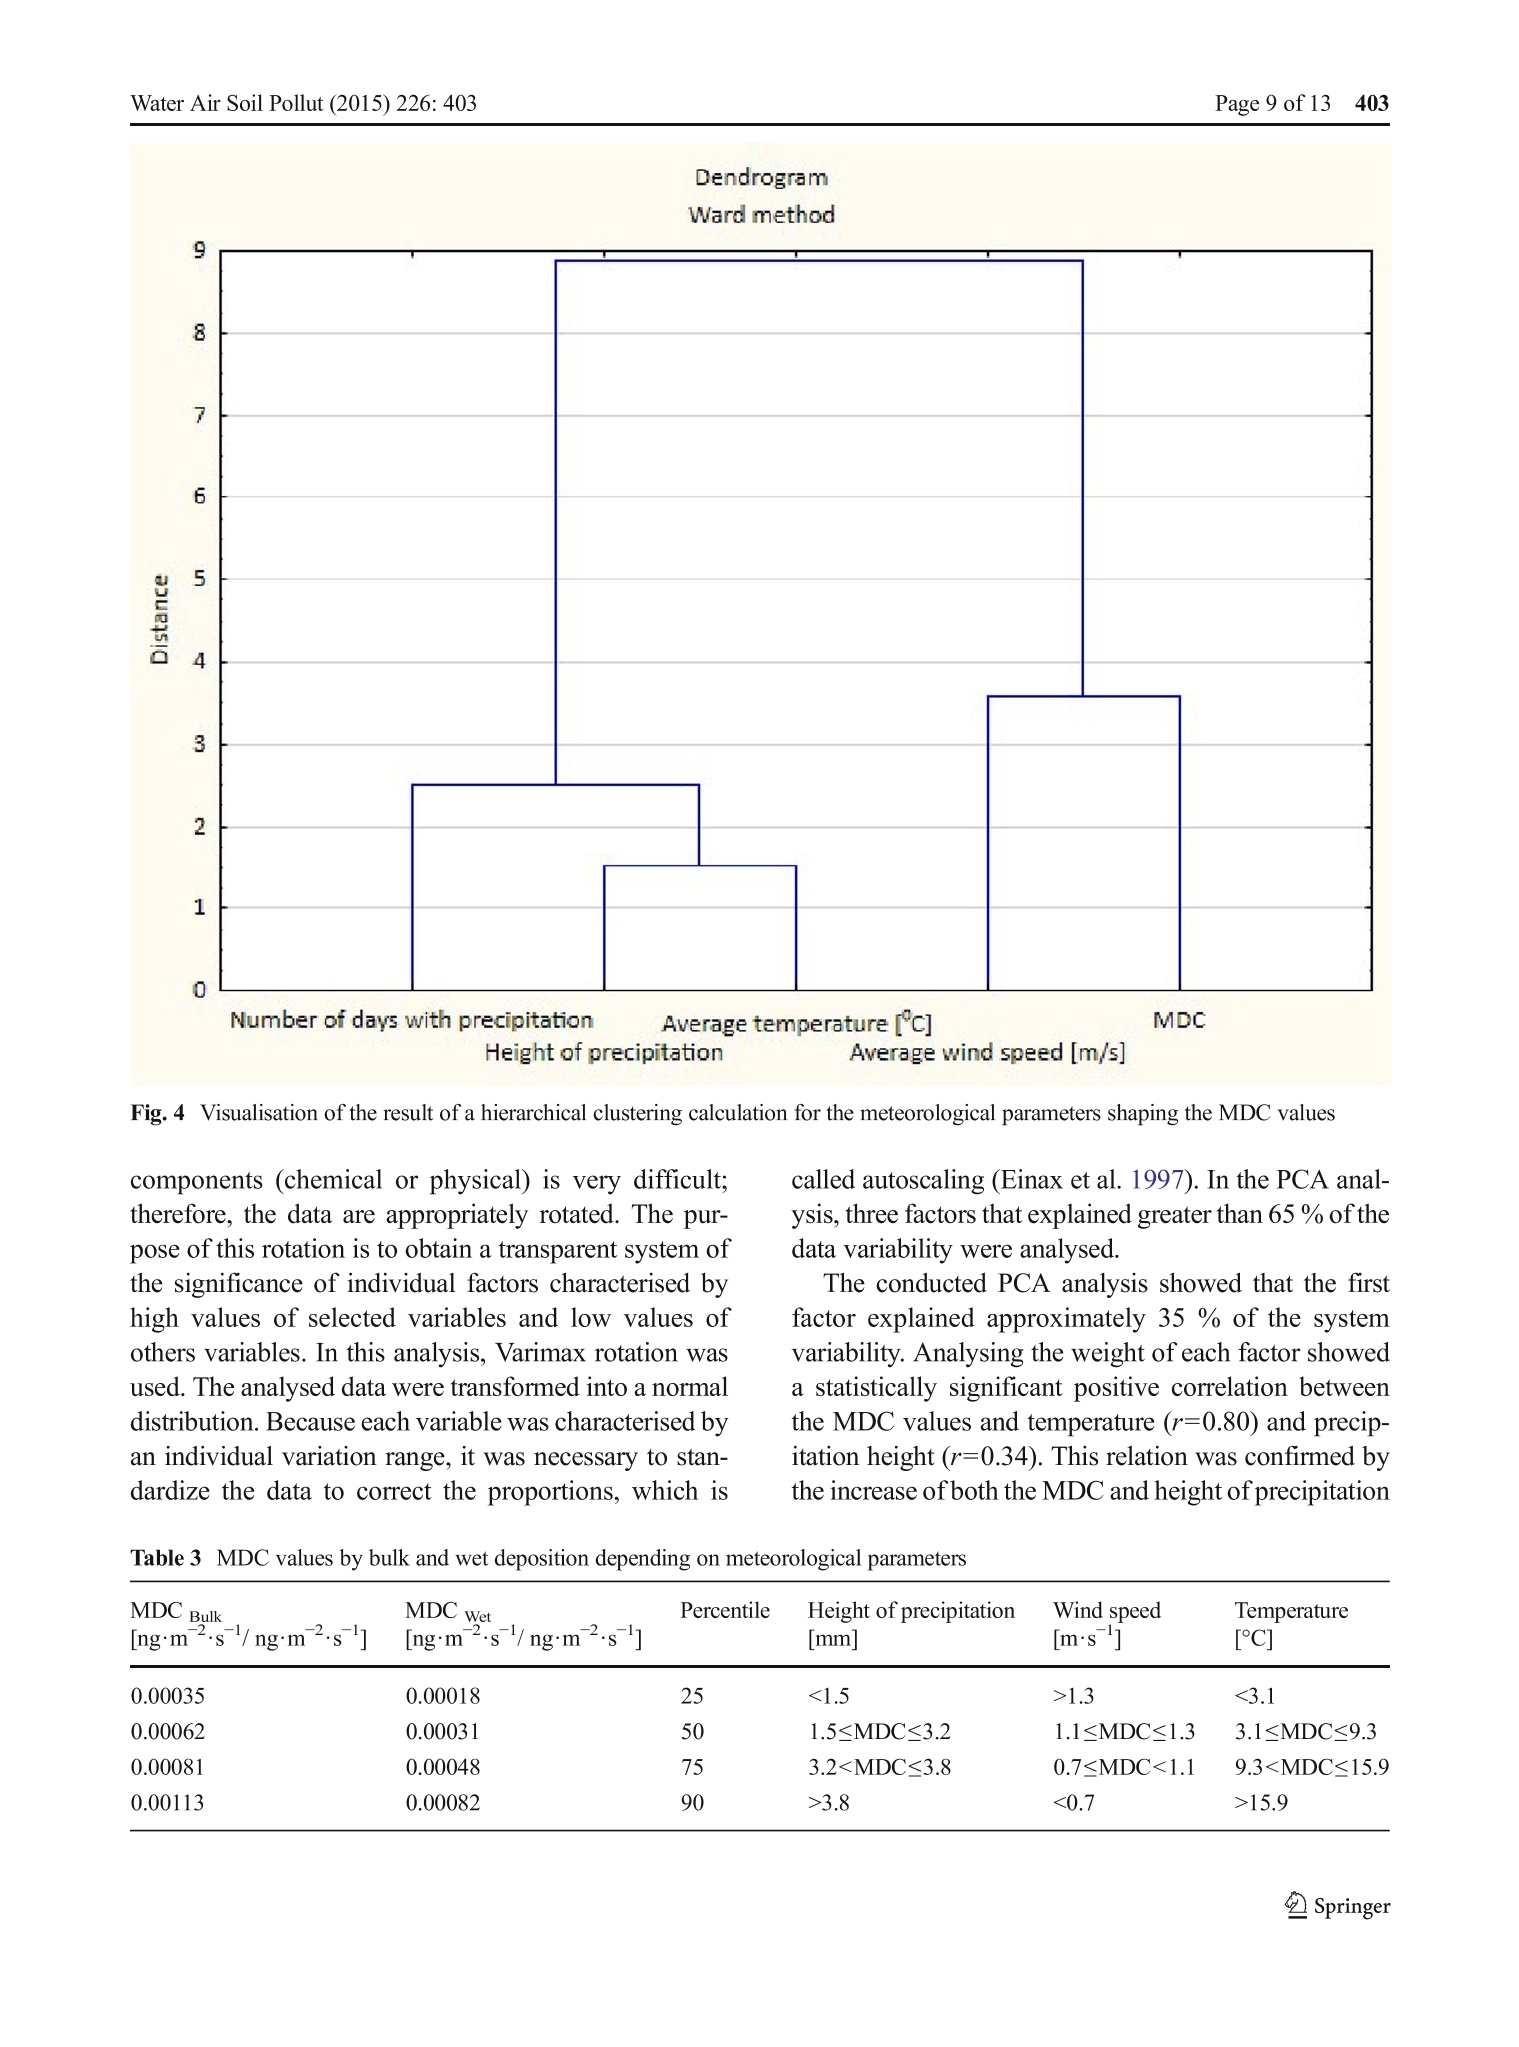
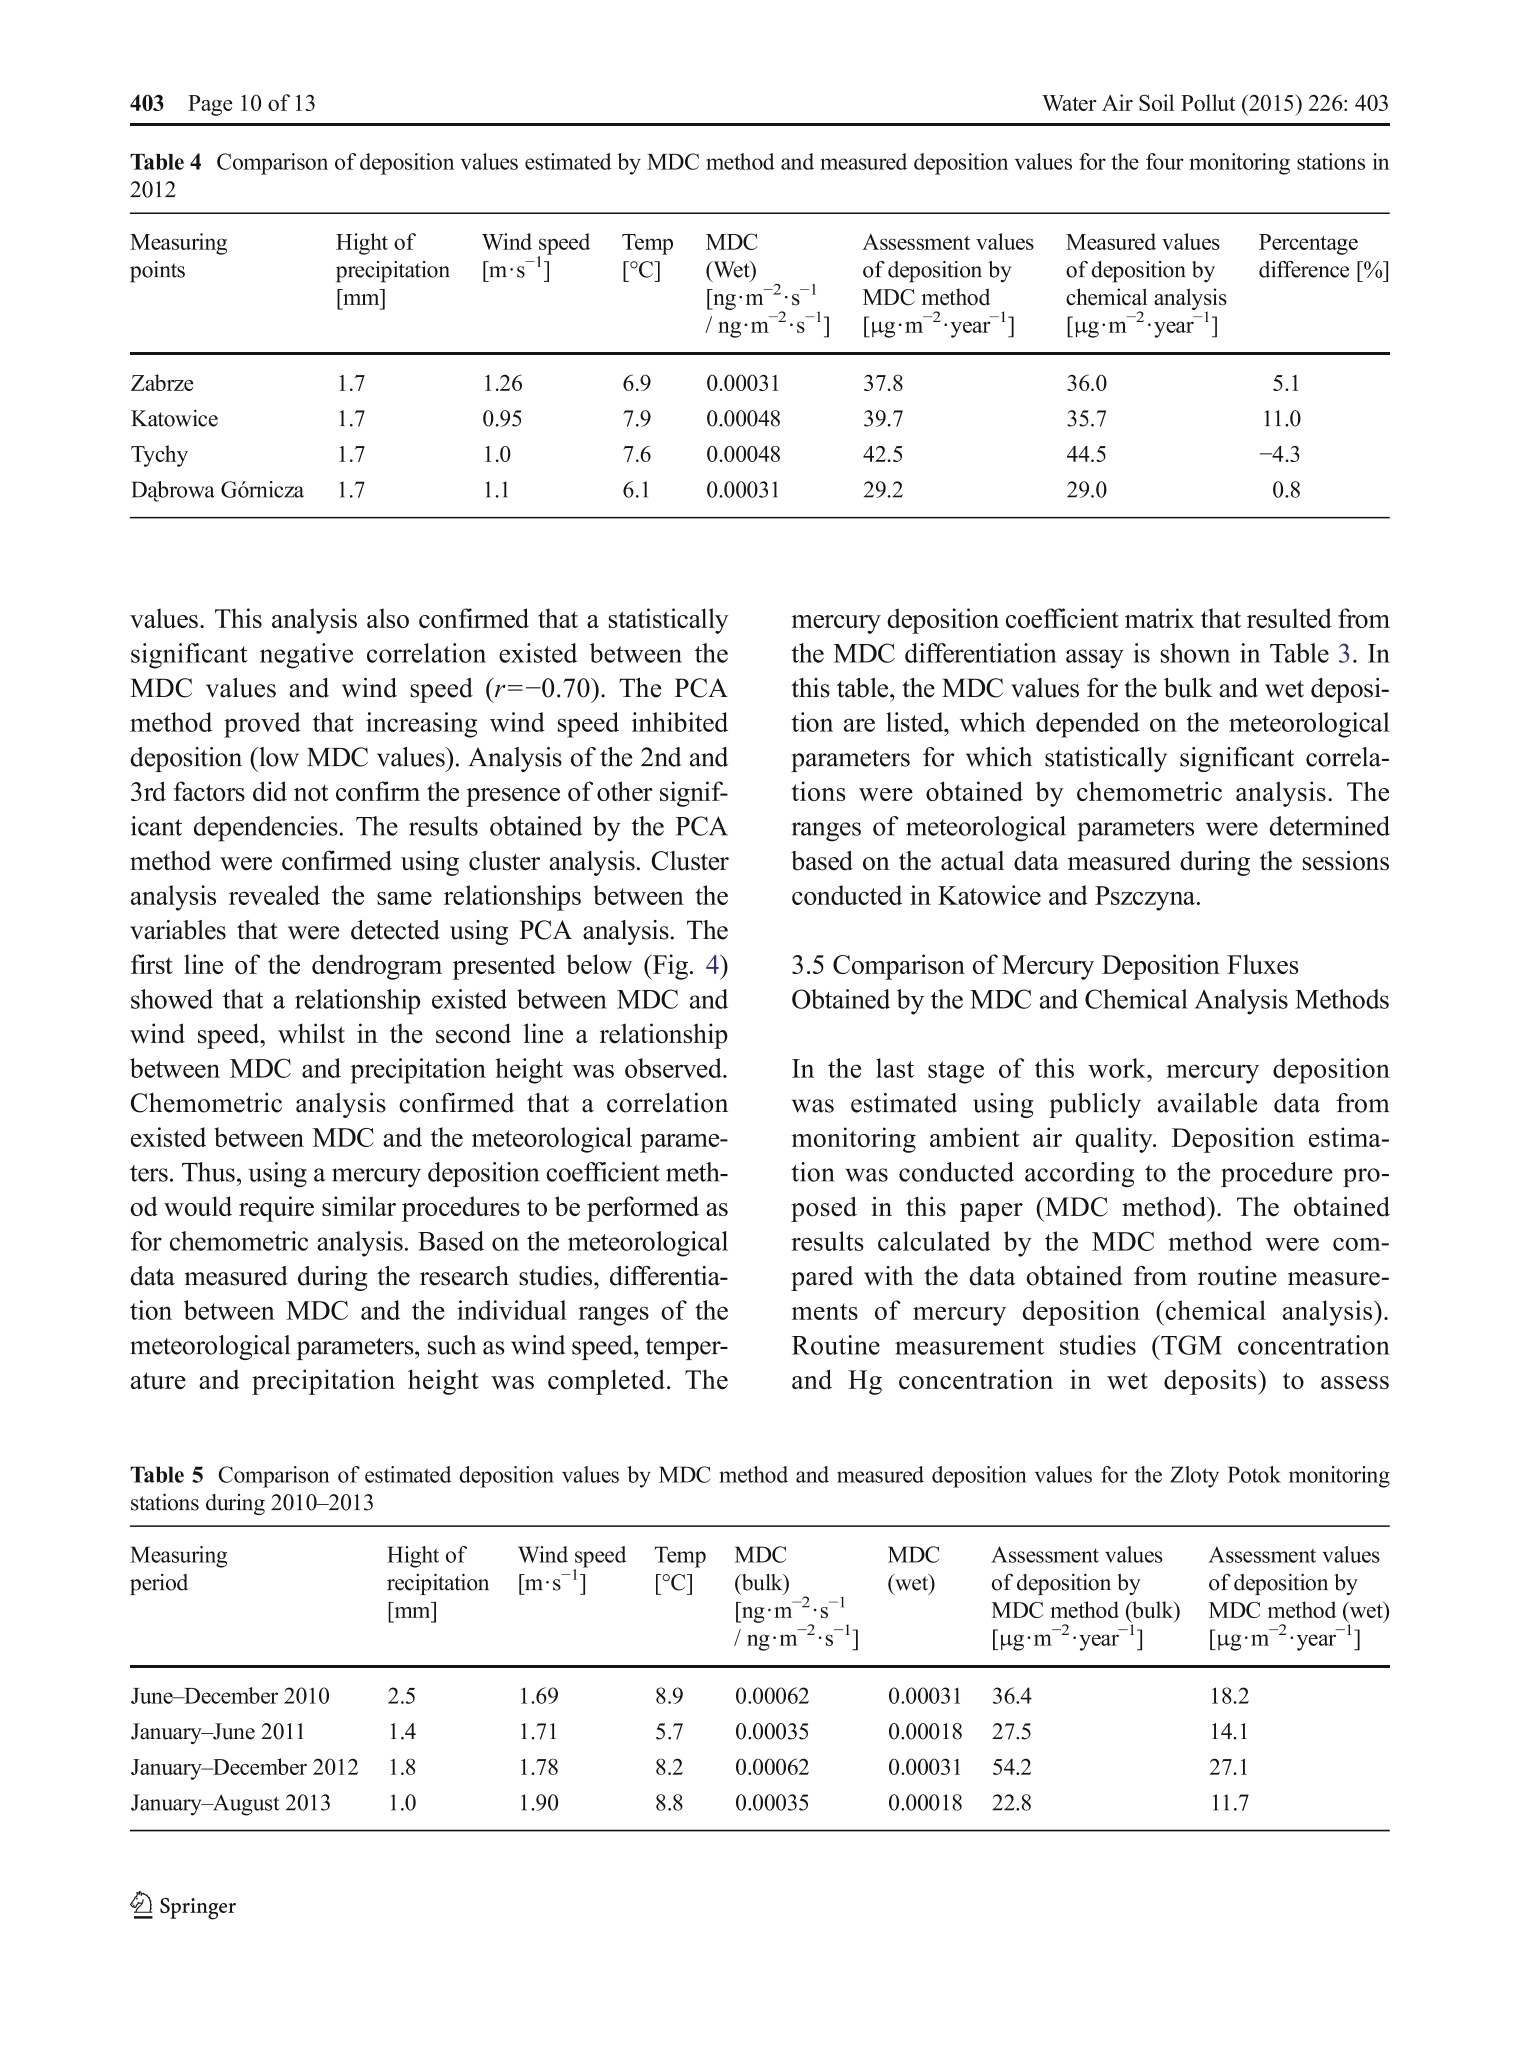
Water Air Soil Pollut (2015) 226: 403DOI 10.1007/s11270-015-2666-1 Water Air Soil Pollut (2015) 226: 403403Page 2 of 13 Conception of the Mercury Deposition Coefficient Basedon Long-term Stream Intensity Measurements of MercurySpecies TGM and TPM Bartosz Nowak· Marianna Czaplicka Abstract For many years, atmospheric mercury hasbeen perceived as a global pollutant. Transport of mer-cury compounds in the atmosphere and its deposition onthe earth’s surface is an important issue that requiresknowledge regarding the circulation of the variousforms of this metal between environmental components.There are many numerical models that can be used tostudy and image this phenomenon. These models arebased on data concerning mercury emission sources,concentrations of this contaminant on modelling areasand meteorological data to assess air mass inflow on aregional and global scale. A method to assess mercurydeposition fluxes on a local scale based only on streamintensity analysis of mercury is proposed in this study.Mercury deposition fluxes (bulk) that were assessed bythe MDC method at the Zloty Potok station (regionalbackground station for the Silesian Agglomeration) var-ied from 22.8 ugmyear(an 8-month period in2013) to 54.2 ugmyearin2012. Developing pro-cedures to estimate the mercury deposition coefficient(MDC) is useful in areas where only meteorologicalparameters and mercury concentrations in the atmo-spheric air are measured. The obtained deposition coef-ficient values enable quantification of a selected B. Nowak ()Institute for Ecology of Industrial Areas, 6 Kossutha Str.,40-844 Katowice, Polande-mail: nowak@ietu.katowice.pl M. Czaplicka Institute of Non-Ferrous Metals, 5 Sowinskiego Str.,44-100 Gliwice, Poland pollutant concentration and its potential impact resultingfrom deposition. Keywords Mercury deposition coefficient ·Atmospheric mercury species·Mercury wet and dry deposition 1 Introduction There are several reasons that justify environmentalmercury as a global concern. The first reason is thatonce mercury is introduced into the environment, itremains forever and does not degrade; the second reasonis that mercury can be transported over a long distancein a simple way due to the physical properties of themetal. Even small amounts of mercury in the environ-ment may cause negative health effects. Therefore, tak-ing action to reduce mercury emission and focusing onexpanding the knowledge about mercury circulation inthe environment are very important. In the last fewyears, mercury release,spread and changes in the envi-ronment have awakened significant interest, but despitenumerous studies regarding these issues, many of thephenomena remain unexplained. Concentrations of totalgaseous mercury (TGM) in ambient air in uncontami-nated areas ofAsia and North America range from 0.52to 21.03 ng'm’ (Fu et al. 2008; Choi et al. 2009;Nakagawa and Hirooto 1997; Lynam and Keeler 2006;Fu et al. 2009; Mazur et al. 2009; Liu et al. 2002).Additionally, in unpolluted areas in Europe, the TGMcontents in ambient air range from 0.66 to 6.20 ng'm. Average concentrations of TGM in ambient air in un-contaminated areas of Europe range from 1.96 to33.8 ngm(Kock et al. 2005; Berg et al. 2001;Zielonka et al. 2005; Pyta et al. 2009). Almost all ofthese previous research articles showed that concentra-tions ofTGM in winter seasons are significantly higherthan in summer seasons, with only a few exceptions incoastal zones, such as Cabo de Creus (Spain); Meze,Thau Lagoon (France); Piran Marine (Slovenia); NeveYam, Israel; Halifax (Canada) (Marks and Beldowska2001;Beldowska et al. 2006;Ebinghaus et al. 2006) andthe Silesian Region of Poland (Nowak et al. 2014).European legislation and internal regulations in variouscountries outside of the EU devote much attention tothis pollutant. Many actions have been specifically di-rected at reducing mercury emissions into the environ-ment and phasing-out certain mercury-containing prod-ucts (European Commission 2004; European Parliament2005).According to EU legislations, mercury should beconstantly monitored and is included in directives andprotocols, such as the CAFE Directive and Protocol onHeavy Metals (Directive 2004/107/EC). In 2014, theMinamata Convention on Mercury was entered, whichhas been signed by 128 and ratified by 10 countries sofar. The main goals of the convention are to providecomprehensive protection of the environment and hu-man health against the release of mercury into the atmo-sphere, water and soil. The provisions of the agreementgovern issues related to extraction of the metal, trade inproducts containing mercury and use of this metal inproducts and industrial processes. The Minamata Con-vention also established principles for safe managementof waste containing mercury and also regulated issuesrelated to mercury-contaminated sites (Minamata Con-vention 2014). Transport of mercury compounds in the atmo-sphere and its deposition on the earth’s surface isan important issue that requires knowledge regard-ing the circulation of the various forms of this metalbetween environmental components. There are manynumerical models that can be used to study andimage this phenomenon. These models are basedon data about mercury emission sources, concentra-tions of this contaminant on modelling areas andmeteorological data to assess air mass inflow. Oneof the basic models used to simulate pollutant trans-port in ambient air is the Advanced Statistical Tra-jectory Air Pollution model (ASTRAP) (Shannonand Volder 1995). More complex models describing the transport of various forms of mercury that arebased on air mass analysis also exist. One of thesemodels is the Regional Lagrangian Model of AirPollution (RELAMP) (Eder et al. 1986). This modelassumes that reactions in the gas phase are veryslow, including oxidation and reduction reactions,and therefore, reactions that may occur in raindropscontained within clouds are included in the calcula-tions. All of the numerical models require meteoro-logical and precision data regarding the types ofemission sources present in the modelling area(Travnikov 2005; Tsiros and Ambrose 1999;Bullock 2000). These models can describe not onlythe transport ofmercury in the atmosphere but alsothe wet and dry depositions and amounts of thesecontaminants exchanged between various elementsin the environment. To further understand the prin-cipal mechanisms governing mercury dispersion andcycling in the environment, a global observationsystem for mercury (GMOS) was created. This sys-tem was based on the ECHMERIT and GLEMOSglobal models and Regional Chemistry TransportModels (CTMs). The GMOS system utilizes datafrom ground-based stations at high altitudes andsea level locations, ad-hoc oceanographic cruisesover the Pacific, Atlantic and Mediterranean andfree tropospheric mercury measurements. Applica-tion of the GMOS can supplement direct measure-ments of mercury concentrations and depositionlevels, providing more comprehensive and detailedinformation on the global cycle of mercury(Bencardino et al. 2014; Pirrone et al. 2013;Gencarelli et al. 2014). A large number of emissionsources, such as point, linear and area sources, aswell as natural processes occurring in the environ-ment are so complex that without a detailed inven-tory of emission sources, the models cannot accuratelycapture the specificity ofthe phenomena that can occuron a local scale. Determining the actual mercury inflowat local measurement points is possible based only onanalysing the inflow of mercury streams in the immedi-ate area of the tested point. Although there are methodsto analyse contaminant stream inflows that include localand regional scales, simple tools for assessing mercurydeposition fluxes on a local scale based on commonlyavailable data are still lacking. Developing a method toassess contaminant deposition fluxes on a local scalebased only on stream intensity analysis of those pollut-ants is one of the challenges of environmental engineering.Accordingly, the primary goal ofthis studywas to develop a procedure to determine Hg depositionfluxes on a local scale based on mercury stream inten-sities measured in local ambient air monitoringprograms. 2 Experimental 2.1 Total Gaseous Mercury (TGM) Measurements TGM concentrations in ambient air were measured usinga RA-915+ LUMEX analyser (Lumex Analytics GmbH,Naher str., 558 Wakendorf II, Germany). The analyseroperation is based on the differential Zeeman atomicabsorption spectrometry technique, which is implement-ed using the direct Zeeman effect (Zeeman atomic ab-sorption spectrometry using high frequency modulationof light polarization,ZAAS-HFM). The analyser wasoperated in a continuous mode (time of individual mea-surement 60 s). Air samples were collected at a level of2.2 m above the ground. A new calibration method basedon preparing reference gas samples of mercury vapours inthe concentration range of LOQ-67.6ngmwas appliedto validate the analytical procedure for detecting mercuryvapours in the concentration range that occurs in ambientair (Nowak et al. 2014). The developed analytical proce-dure can be characterised by the following parameters:detection limit of 0.24 ng'm, limit of quantification of0.48 ngm’, working range from 0.48 to 67.6 ngm,linearity of 0.999, repeatability of 5.3 %, recovery from98.9 to 107.5 % and expanded uncertainty of 19.7 %.Application of this methodology over a long period oftime required stable operation of the analyser. At the inletof the analyser, a fibre filter was used to absorb particlesfrom the air. For the blank signal control, an effectivecarbon filter (CF 32 A2B2E2K2Hg-P3) was used toadsorb approximately 99.99 % of the mercury vapourpresent in the air. Using the carbon filter for blank signalcontrol significantly decreased the level of noise anddirectly affected the accuracy and precision of the analyt-ical procedure. The limits of detection and quantificationwere also improved by the significantly decreased back-ground noise. 2.2 Total Particulate Mercury (TPM) Measurement Particulate matter samples were collected on 47-mm Teflon filters (0.45-mm pore size) housed in acid-cleaned Teflon filter packs at a nominal flowrate of 10 1 min(Zielonka et al. 2005).Next, theends of the sampling filters were placed into acid-cleaned Petri dishes and stored in a refrigerator.Upon completion of the measurements, the filterswere brought to the laboratory for analysis. TheFilters and the particulate matter collected on theirsurfaces were placed into Teflon vessels for miner-alization in a microwave oven (Multiwave 3000-Anton Paar, Austria) using concentrated nitric acidand hydrochloric acid (1:1) (Hg≤0.000001 %, proanalysis, Merck, Germany). The concentrations ofmercury were determined by the cold vapor atomicabsorbtion spectrometry (CV-AAS) method usingan RA-915+ analyser equipped with an RP-91 at-tachment provided by Lumex Ltd. The operation ofthe analytical system was checked using appropri-ately prepared calibration solutions with referencematerial in the concentration range from 0 to500 ng1. The linear correlation coefficient ofthe calibration curve was R-=0.974. The methoddetection limit for TPM was approximately 5 pg'm for a 24 h sample at the applied flow rates. 2.3 Wet and dry deposition measurements Rainfall samples were collected on the bulk sampler.The sampler was made with an acid-washed open boro-silicate glass bottle and a 30-cm funnel composed of aninert material. The funnel was supported in a thermo-static housing system and the system protected the sam-ples from solar radiation and high temperatures. On thedays without rainfall, the dry deposit collected on theopen collector was washed with deionized water on thesite. After sampling, the filters with dry deposits wereplaced into acid-cleaned Petri dishes and stored in therefrigerator. The filters with dry deposits were analysedfollowing the same procedure as the TPM filters(Zielonka et al. 2005;Nowak et al. 2013). The wetdeposition samples were preserved with 1 ml of stabi-lizing solution (nitric acid and potassium dichromate;5g K2Cr207+500 ml HNO3/1000 ml) and stored in aTeflon bottle in the refrigerator. After the measurementswere completed, samples were mineralized in a waterbath for 2 h at a temperature of 95 °C using the follow-ing solutions: 0.2 ml (25g.1) of potassium permanga-nate, 0.2 ml of nitric acid (concentrated) and 0.5 ml(40 g.1) of potassium peroxidisulphate. To the obtain-ed solutions, 100g·1ofhydroxylamine hydrochloride was added dropwise to remove excess oxidizer. Theconcentration of mercury was determined by the CV-AAS method based on an RA-915+ analyser equippedwith an RP-91 attachment. The analyser was calibratedusing a mercury standard reference material in the con-centration range from 0 to 300 ng1. The linear corre-lation coefficient of the calibration curve was R2=0.97504. The detection and quantification limits for totalmercury in wet deposition samples were measured usingten independently prepared blank samples. LOD andLOQ amounted to 2 and 5 ng1, respectively. Therepeatability of this method was 9.4 %. The recoverieswere 100.4%. The laboratory glass and other glassequipment that were used in all conducted analyses werewashed in a laboratory washer (Miele G7883,Ontario).All calibration solutions and other reagents were pre-pared with high-purity deionized water, approximately0.5 uS/cm, Milli-Q(Millipore, Bedford, MA, USA).The nitric and hydrochloric acids used in the analysisshowed very low mercury contents (approximately Hg≤0.000001 %); therefore, its impact on the final resultswas neglected. The results were corrected using triplyprepared blank samples. 2.4 Meteorological Data Meteorological parameters were determined at allmeasurement sites. The meteorological stations inKatowice and Pszczyna were equipped with ultra-sonic anemometers (81000 YOUNG) used to mea-sure wind speed along the three axes x, y and z,which allowed determination of two horizontal ve-locities and one vertical velocity as well as air tem-perature and humidity. In other measuring points,meteorological conditions were measured accordingto the monitoring plan of the Silesian Inspectoratefor Environmental Protection. 2.5 Sampling Site The measurements were taken in the Upper Silesianregion (Southern Poland) from 2008 to 2010. Themeasuring points were located in the five followingSilesian cities (Fig. 1): Katowice, over 300 thou-sand inhabitants; Dabrowa Gornicza, approximately124 thousand inhabitants; Zabrze, approximately180 thousand inhabitants; Tychy, more than 128thousand inhabitants; Pszczyna, close to 26 thou-sand inhabitants..The measurements utilised to determine the deposition coefficient were taken attwo measuring points. The TGM and TPM mea-surements in the atmospheric air and the mercurycontents in dry and wet atmospheric precipitationswere taken in ten periods (each lasting 21 days) insummer and winter seasons; six measuring periodswere performed in Katowice and four in Pszczyna. 2.6 The Mercury Deposition Coefficient Method(MDC) This work showed that the mercury stream intensity(concentrations in ambient air and meteorologicalparameters) measured in routine air pollutant moni-toring programs can be used to assess mercury de-position. The MDC parameter allows for assessmentof mercury deposition. The main goal of this studywas to develop a procedure for determination of aHg deposition coefficient based on analysing mer-cury stream intensities and compare the obtainedresults with deposition values measured using chem-ical analysis. To calculate the deposition coefficientdata, the TGM and TPM stream intensities andmercury wet and dry deposition data collectedthroughout the measuring periods were used (tenmeasurement campaigns in Katowice and Pszczyna).The coefficient was calculated as a portion of themercury deposited on the land surface (mercuryvertical loads) in the amount of the pollutanttransported in the air in the form of TGM andTPM (stream intensity-mercury horizontal loads)within the entire measurement session (see Fig. 2).To determine the TGM and TPM stream intensities,high resolution data regarding the concentrations ofTGM and TPM as well as meteorological parameters(wind speed, wind direction) were used. Stream intensity is defined as a product of the pollut-ant concentrations and the vector opposite to the windspeed vector. The length of the inflow vector is equal tothe intensity of the pollutant stream inflow through thesurface that is perpendicular to the wind vector. Theinflow vector at the same time indicates the directionof pollutant inflow (TGM and TPM) and their streamintensities. Based on the TGM and TPM streams intensities,which were measured at a height of 2.2 m during onemeasurement session, and based on mercury concentra-tion data in wet and dry deposits (deposition valuesobtained during one measurement session) collected at X- Routine measurement points used to assess deposition of mercury by proposed method (comparison studies); -Measurement points used to determination of the deposition coefficient. Fig. 1 Location of measurement points against the European map and the Silesian Voivodeship map a height of 1.5 m, mercury deposition coefficients werecalculated using the following equation (see below). where: SHgwet +SHgp is the sum of the wet and drymercury deposits and STGM+STPM is the sum of theTGM and TPM stream intensities. Fig. 2 Schematic diagram of mercury deposition coefficient 3 Results and Discussion 3.1 Overview of Mercury Species Concentrationsand Deposits from 2008 to 2010 Upper Silesia is an industrial region located in SouthernPoland. In this area, there are 21 mines, which belong totwo mining holdings. There are also many mines that donot currently function but contributed to degradation ofthe natural environment in this region in the past. Manyother industries, such as metallurgical, power, engineer-ing and chemical industries are also developed in thisarea. In the Silesian Voivodeship territory, the atmo-spheric air pollution situation, especially connected toparticles, has been categorised as class C (if the concen-tration of pollutants exceeds the limit levels as well asthe margin of tolerance). Analysing the frequency atwhich the average annual concentration of PM10 wasexceeded showed that at almost all of the measuringstations assessed, the average annual concentrationswere much higher than the admissible threshold of40 ugm(2008/50/EC). The poor air quality is espe-cially related to high levels of low emission in this area TGM streams intensity at the Katowice TGM streams intensity at the Pszczyna TGM streams intensity at the Pszczyna Fig. 3 Roses of TGM stream intensity at the monitoring stations in Katowice and Pszczyna during 2008-2010, mgm21 days that are connected with the burning of solid fuels indomestic heating units. This indicated that duringthe winter months, the concentrations of mercuryin the vapour and adsorbed on the particles aremuch higher than the concentration in the summermonths, which was also reflected in the depositionof this pollutant. The average TGM concentrationvalues obtained during the research conducted attwo sites (Katowice and Pszczyna) were very simi-lar to the concentrations previously measured invarious locations in Poland and Europe (Kocket al. 2005; Berg et al. 2001; Zielonka et al. 2005;Marks and Beldowska 2001: Beldowska et al. 2006: Ebinghaus et al., 2006;Nowak et al. 2014). Duringthe non-heating seasons (summer) that were moni-tored from 2008-2010, the average TGM concen-tration in Katowice was 3.49±1.12 ngm, but themean concentration of TGM in Pszczyna was ap-proximately 28 % lower and was approximately2.53±0.52 ng'm. In the middle of the heatingseason (winter), the mean TGM concentration inKatowice was2.70±0.71 ngm. During theheating seasons in Pszczyna, the TGM concentrationwas approximately 33 % lower and was1.84±0.41 ng'm. During the non-heating seasons mon-itored ffrom2008-2010, the;Imean TPM Table 1 Set of data necessary to estimate the mercury deposition coefficient and MDC results for the conducted measurement campaigns Measuring Season Measuring TGM streams TPM streams Wet deposition Dry deposition MDC point period intensity mg m intensity mgm ug'm ug'm . % 21 days -1 21 days 21 days 21 days Katowice Non-heating 20.08-09.09.2008 3.98 0.12 1.43 6.70 0.20 14.07-04.08.2009 4.82 0.21 2.41 1.23 0.07 19.05-09.06.2010 4.12 0.12 1.44 0.37 0.04 Heating 01.12-22.12.2008 4.85 1.40 1.93 1.92 0.06 09.03-30.03.2009 6.83 1.62 9.17 0.28 0.11 26.02-18.03.2010 8.11 0.49 0.91 0.55 0.02 Pszczyna Non-heating 18.05-08.06.2009 6.01 0.22 4.67 2.81 0.12 02.07-22.07.2010 6.35 0.19 1.20 0.83 0.03 Heating 20.10-10.11.2009 3.14 0.56 0.76 2.24 0.08 08.10-29.10.2010 4.16 0.63 0.14 1.53 0.03 concentration in Katowice was 132.1±107.8 pg'mwhereas in Pszczyna this value was approximately97.18±61.33 pg'm. However, during the heatingseasons, the average TPM concentration was 531.7±324.1 pgmwhereas in Pszczyna this value wasapproximately 288.2±165.2 pgm. In the winterseasons in Katowice and Pszczyna, the content ofTPM in the atmospheric air was several times higherthan its content in the summer season. The differ-ence may result from increased combustion of solidfuels in the winter. In the winter season, the con-sumption of coal significantly increased. This wasalso confirmed by the approximately 50 % increasein PM10 average daily concentrations in ambient airduring the winter season in the Silesian Region.Based on the total annual precipitation amounts inthose locations and the average mercury concentra-tions in wet and dry deposits measured during theconducted studies, the total annual mercury wet anddry depositions were determined. The obtained re-sults are much higher than the literature results (Liet al. 2008; Sakata et al. 2005; Vanarsdale et al.2005; Gratz et al. 2009). The total average annualvalues of wet and dry deposition of mercury com-pounds measured in Katowice from 2008-2010were 32.1 and 28.2 ug'm,respectively. The totalaverage annual values of wet and dry depositionmeasured in Pszczyna were 11.3 and 31.6 pg·m,respectively. The differences between the observedmercury deposition values may be caused by diversetypes of air pollutant emission sources that occur atthe measuring points. ·3.2 Overview of TGM stream intensities from 2008to 2010 To assess mercury deposition using the MDC method,TGM and TPM stream intensity data were needed.Stream intensities of mercury compounds were calcu-lated based on high resolution data regarding the con-centration of TGM and TPM as well as meteorologicalparameters, such as wind speed and wind direction.During the measurement sessions in the non-heatingseason from 2008-2010, the average TGM stream in-tensity values were approximately 4.31 mg'm21 days, but this value was lower than the resultobtained for the heating seasons (6.60 mg'm ·21 days ) (see Fig. 3). Additionally, inverse relation-ships were noted at the air quality monitoring station inPszczyna. The average TGM stream intensity valuesduring the heating seasons were lower than during thenon-heating seasons and amounted to 3.65 and6.18 mgm221 days, respectively. At both leasur-ing stations in Katowice and Pszczyna as well as in allcases, the average TPM stream intensity values during2008-2010 were higher during the heating seasons thanin the non-heating seasons. At the mercury monitoringstation in Katowice, the average TPM stream intensitythat flowed through the measuring point from 2008-2010 was 1.17 mg*m2-21 days in the heating sea-sons. The result obtained for heating seasons was muchhigher than the value recorded for non-heating seasons,which was 0.15 mgm -21 days. This same trendwas observed in Pszczyna from 2009-2010. The TPMstream intensity values for this point in the heating and non-heating seasons were 0.60 and 0.21 mg'm21 days,respectively. 3.3 Calculation of the Mercury Deposition Coefficientand Analysis of Parameters Affecting Its Value In the next stage of this work, mercury deposition coef-ficients were calculated based on the recorded measure-ments and proposed methodology (see 2.6). The fulldata set needed for the MDC calculation is presentedin Table 1. The deposition coefficient that was calculated for themeasuring stations located in Katowice and Pszczyna inthe summer season ranged from 0.03 to 0.12%,whereasin the winter season these coefficients varied from 0.02to 0.20%.At both monitoring stations, the depositioncoefficient, which was defined as a portion of the mer-cury deposited on the land surface (dry and wet) to theamount of the pollutant transported with loads of air inthe form of TGM and TPM (stream intensity), did notexceed 0.2 %. As seen, the differences between theobtained MDC values are significant between measure-ment sessions, and this is important for understandingthe causes of these fluctuations in the next section. 3.4 Chemometric analysis Variation of the TPM and TGM concentrations be-tween the winter and summer seasons and alter-ations in the meteorological parameters betweenthe seasons contributed to differences in the obtain-ed results. However, additional causes for thesefluctuations also exist, which we tried to prove inthe next stage of the analysis. These analyses willhelp determine whether the MDC method can beused to estimate mercury deposition based on com-monly available monitoring data regarding mercuryconcentrations in ambient air. Meteorological data, such as wind speed, tempera-ture, precipitation height and number of days with pre-cipitation influencing the DMC values were analysedusing two independent chemometric techniques i.e.principal component analysis (PCA) and Ward clusteranalysis. All of the meteorological data collected duringthe measurement periods are presented in Table 2. ThePCA technique detects existing relations betweenanalysed variables. PCA analysis is based ontransforming the originally measured data into a newlinear combination of uncorrelated variables, which arecalled principal components. Clearly interpreting these Table 2 Statistical characteristics of meteorological parameters causing MDC fluctuation Measuring Season Measuring Parameter Wind speed Temperature Precipitation Number of days MDC% point period ms °C1 mm with precipitation Katowice Non-heating 20.08-09.09.2008 Mean±SD 0.57±0.27 16.4±2.42 4.00±6.52 5 0.20 Range 0.2-1.2 11.9-20.9 0.10-15.5 14.07-04.08.2009 Mean±SD 0.60±0.31 19.6±3.64 14.7±17.0 7 0.07 Min-Max 0.1-1.1 13.2-25.3 0.35-51.8 19.05-09.06.2010 Mean±SD 0.68±0.28 12.9±3.40 6.10±9.57 14 0.04 Min-Max 0.3-1.3 5.70-20.1 0.16-36.7 Heating 01.12-22.12.2008 Mean±SD 0.91±0.47 1.59±2.33 3.92±4.34 11 0.06 Min-Max 0.3-2.1 -1.3-6.5 0.30-11.8 09.03-30.03.2009 Mean±SD 1.16±0.65 2.48±3.78 4.84±4.63 14 0.11 Min-Max 0.3-2.5 -1.9-12.6 1.02-15.3 26.02-18.03.2010 Mean±SD 1.25±0.69 -2.28±3.94 2.88±3.08 11 0.02 Min-Max 0.1-2.8 -7.8-4.3 0.11-10.4 Pszczyna Non-heating 18.05-08.06.2009 Mean±SD 1.72±0.67 14.3±3.56 3.83±5.12 13 0.12 Min-Max 0.8-3.1 8.0-21.8 0.25-18.8 02.07-22.07.2010 Mean±SD 1.34±0.48 22.1±3.55 8.21±4.71 4 0.03 Min-Max 0.7-2.5 15.8-26.1 4.08-13.9 Heating 20.10-10.11.2009 Mean±SD 1.07±0.47 5.05±3.26 2.77±1.94 9 0.08 Min-Max 0.5-2.2 -1.0-10.7 0.42-6.45 08.10-29.10.2010 Mean±SD 1.47±0.69 5.61±1.75 1.95±2.32 6 0.03 Min-Max 0.5-3.0 2.3-10.2 0.46-6.54 Dendrogram Height of precipitation Average wind speed [m/s] Fig. 4 Visualisation of the result of a hierarchical clustering calculation for the meteorological parameters shaping the MDC values components (chemical or physical) is very difficult;therefore, the data are appropriately rotated. The pur-pose ofthis rotation is to obtain a transparent system ofthe significance of individual factors characterised byhigh values of selected variables and low values ofothers variables. In this analysis, Varimax rotation wasused.The analysed data were transformed into a normaldistribution. Because each variable was characterised byan individual variation range, it was necessary to stan-dardize the data to correct the proportions, which is called autoscaling (Einax et al. 1997). In the PCA anal-ysis, three factors that explained greater than 65 % ofthedata variability were analysed. The conducted PCA analysis showed that the firstfactor explained approximately 35 % of the systemvariability. Analysing the weight of each factor showeda statistically significant positive correlation betweenthe MDC values and temperature(r=0.80) and precip-itation height (r=0.34). This relation was confirmed bythe increase of both the MDC and height of precipitation Table 3 MDC values by bulk and wet deposition depending on meteorological parameters MDC i5k [ng'm-2.s-/ngms] MDC we Percentile Height of precipitation Wind speed Temperature lng'm-2.s-/ngm.s] mml [m·s1 rc1 0.00035 0.00018 25 <1.5 >1.3 <3.1 0.00062 0.00031 50 1.53.8 <0.7 >15.9 Table 4 Comparison of deposition values estimated by MDC method and measured deposition values for the four monitoring stations in2012 Measuring points Hight of Wind speed Temp MDC Assessment values Measured values Percentage precipitation [m·s1 「°C1 (Wet) of deposition by of deposition by difference [%] |mm| [ngm MDC method chemical analysis /ngm [ugmyear ] lugm 2.'year Zabrze 1.7 1.26 6.9 0.00031 37.8 36.0 5.1 Katowice 1.7 0.95 7.9 0.00048 39.7 35.7 11.0 Tychy 1.7 1.0 7.6 0.00048 42.5 44.5 -4.3 Dabrowa Gornicza 1.7 1.1 6.1 0.00031 29.2 29.0 0.8 values. This analysis also confirmed that a statisticallysignificant negative correlation existed between theMDC values and wind speed(r=-0.70). The PCAmethod proved that increasing wind speed inhibiteddeposition (low MDC values). Analysis of the 2nd and3rd factors did not confirm the presence of other signif-icant dependencies. The results obtained by the PCAmethod were confirmed using cluster analysis. Clusteranalysis revealed the same relationships between thevariables that were detected using PCA analysis. Thefirst line of the dendrogram presented below (Fig. 4)showed that a relationship existed between MDC andwind speed, whilst in the second line a relationshipbetween MDC and precipitation height was observed.Chemometric analysis confirmed that a correlationexisted between MDC and the meteorological parame-ters. Thus, using a mercury deposition coefficient meth-od would require similar procedures to be performed asfor chemometric analysis. Based on the meteorologicaldata measured during the research studies, differentia-tion between MDC and the individual ranges of themeteorological parameters, such as wind speed, temper-ature and precipitation height was completed. The mercury deposition coefficient matrix that resulted fromthe MDC differentiation assay is shown in Table 3. Inthis table,the MDC values for the bulk and wet deposi-tion are listed, which depended on the meteorologicalparameters for which statistically significant correla-tions were obtained by chemometric analysis. Theranges of meteorological parameters were determinedbased on the actual data measured during the sessionsconducted in Katowice and Pszczyna. 3.5 Comparison of Mercury Deposition FluxesObtained by the MDC and Chemical Analysis Methods In the last stage of this work, mercury depositionwas estimated using publicly available data frommonitoring ambient air quality. Deposition estima-tion was conducted according to the procedure pro-posed in this paper (MDC method). The obtainedresults calculated by the MDC method were com-pared with the data obtained from routine measure-ments of mercury deposition (chemical analysis).Routine measurement studies (TGM concentrationand Hg concentration in wet deposits) to assess Table 5 Comparison of estimated deposition values by MDC method and measured deposition values for the Zloty Potok monitoringstations during 2010-2013 Measuring period Hight of Wind speed Temp MDC MDC Assessment values Assessment values recipitation mm| 「m·s1 1C1 (bulk) (wet) of deposition by of deposition by [ng'm s -2 MDC method (bulk) MDC method (wet) /ng'm s [ugm year ] Hg'm year 1 June-December 2010 1.69 0.00062 0.00031 36.4 18.2 January-June 2011 1.71 0.00035 0.00018 27.5 14.1 January-December 2012 1.78 0.00062 0.00031 54.2 27.1 January-August 2013 1.90 0.00035 0.00018 22.8 11.7 mercury deposition using the proposed method andcompare the obtained results with real measuredvalues were conducted by the inspectorate for envi-ronmental protection from 2008 to 2010 in DabrowaGornicza, Katowice, Tychy and Zabrze (Czaplicka et al.2009). Based on the TGM concentration data in ambientair and wind field data, mercury vapour stream intensitiesat four measurement stations were calculated. In the nextstep, statistical characteristics of meteorological parame-ters were appropriately selected for MDC analysis, asshown in Table 4. When all relevant parameters e.g.TGM stream intensity, were collected, mercury wet de-position was calculated (individual meteorological pa-rameters at each measuring point were chosen) (seeTable 4). Mercury deposition fluxes that were assessedby the MDC method in 2012 at the four measuringstations ranged from 29.2 (Dabrowa Gornicza) to42.5 ugm2year(Tychy). Similarly, values measuredby chemical analysis in these places varied from 29.0(Dabrowa Górnicza) to 44.5 ug m.year(Tychy)(Czaplicka et al.2009). The percent difference betweenthe results obtained by the two methods fluctuated fromeO丛-4.3 to 11 %. The highest mercury deposition flux devi-ation was approximately 4 ugmyear, which wasnoted at the Katowice station, whilst the smallest differ-ence of approximately 0.2 ugmyearwas observedat the Dabrowa Gornicza station. The absolute percentdifference between the two deposition estimationmethods for the four points was 5.3 %. 3.6 Assessment of Mercury Deposition Fluxesby the MDC Method The mercury deposition assessment also used TGMconcentrations and meteorological data obtainedfrom 2010-2013 that were measured under thenational monitoring program by the Silesian Inspec-torate for Environmental Protection at the ZlotyPotok station. This station is located in a rural areaand provides regional background for the SilesianAgglomeration. To estimate the deposition of mer-cury in Zloty Potok, appropriate MDC values werechosen according to Table 3, and the meteorologi-cal data presented below were also utilised (seeTable 5). Estimated mercury deposition fluxes(bulk) at the Zloty Potok station varied from22.88ugm.year (an 8-month period in 2013)to 54.2 ugm.year in 2012. The obtained re-sults can be compared with mercury deposition values measured between April 2008 and Septem-ber 2009 at eight monitoring locations in the Sile-sian Agglomeration territory (Zabrze, Bytom,Radzionkow, Katowice, Dabrowa Gornicza Tychy)(Czaplicka et al. 2009). The mercury depositionresults were significantly different for individualmonths depending on the precipitation height. Forthe Silesian Agglomeration, the mercury wet depo-sition during an 18 month measuring period rangedfrom 32 to 48 ug m. Recalculating these valuesfor a full year generated mercury deposition fluxesbetween 21.3 and 32.0 ug'm2. Correlating themeasured values with the values calculated by theMDC method at the Zloty Potok monitoring stationin 2012 showed that the obtained results arecomparable. 4 Conclusions The research presented above demonstrated that inareas where only meteorological parameters andmercury concentrations in atmospheric air are mea-sured, it is possible to increase the amount ofinformation about the processes of environmentalpollution with mercury and what can be done usingthe MDC method. The proposal to calculate thedeposition coefficient using TGM and TPM streamintensities isS Ea new solution. This is especiallyimportant when we want to assess to what extentthe process of mercury deposition contributes to thepollution of soil, vegetation and surface waters. Theproposed deposition coefficient allows quantifica-tion of a selected pollutant concentration and itspotential impact as a result of deposition. Furtherstudies on the deposition coefficient may contribute todeveloping methods to estimate the impact of ambientair pollutants on other environmental components basedon analyses ofthe pollutant stream intensity. Addition-ally, we may be able to determine the direction fromwhich the pollutant (risk) was derived. Further develop-ment of this method may lead to identification of mer-cury emission sources. ( Acknowledgements S This work co n stitutes a part o f the p r o- j ect: Transport of s elected f orms o f mercury in th e system: atmosphere-deposition-land s u rface in areas o f low a nd highmercury emission. T he project was f unded by grants from theMinistry of Science and Higher Education (Contract no. N N305 1 11434). ) Open Access This article is distributed under the terms of theCreative Commons Attribution 4.0 International License (http://creativecommons.org/licenses/by/4.0/),which permits unrestrict-ed use, distribution, and reproduction in any medium, providedyou give appropriate credit to the original author(s) and the source,provide a link to the Creative Commons license, and indicate ifchanges were made. References ( Beldowska, L., F alkowska, A., & Lewandowska, A. (2006). Th e gaseous mercury concentration l e vel in t he breathed air of the coastal zone ofthe G ulf of Gdansk (w :J. K onieczynski.Air P rotection in Theory and P r actice,2 , I n stitute of Environmental E ngineering Polish Academy of Sciences, pp. 13 - 22). ) Bencardino, M., Sprovieri, F., & Pirrone, N. (2014). The GMOScyber (e)-infrastructure: advanced services for supportingscience and policy. Environtal Science Pollution Research,21,4193-208. Berg, T., Bartnicki, J., Munthe, J., Lattila, H., Hrehoruk, J., &Mazur, A. (2001). Atmospheric mercury species in theEuropean Arctic: measurements and modeling. AtmosphericEnvironment, 35,2569-2582. Bullock, R. (2000). Current methods and research strategies formodeling atmospheric mercury. Fuel Processing Technology,65,459-471. Choi, E. M., Ki, S. H., Holsen, T., & Yi, S. M. (2009). Totalgaseous concentration in mercury in Seoul, Korea: Localsources compared to long-range transport from China andJapan. Environmental Pollution, 157,816-822. Czaplicka, M., Szmyd, E., Grzegorczyk, M., Pyta, H., Zajusz,R.,Kubica, B., & Smolarski, M. (2009). Assessment of thedegree ofatmospheric air pollution by mercury, includingits physical and chemical speciation in the light of theDirective 2004/107/WE (IMN Gliwice-IPIS PAN Zabrzereport). http://www.katowice.pios.gov.pl/monitoring/srodowisko/rtec2009.pdf. Directive 2004/107/EC of the European Parliament and theCouncil of 15 December 2004 relating to arsenic, cadmium,mercury, nickel and polycyclic aromatic hydrocarbons inambient air. Ebinghaus, R., Banic, C., Beauchamp, S., Jaffe, D., Kock, H.,Pirrone, N., Poissant, L., Sprovieri, F., & Weiss-Penzias, P.(2006). Spatial coverage and temporal trends of land-basedatmospheric mercury measurements in the northern and south-ern hemispheres. In N. Pirrone & R. Mason (Eds.), Mercuryfate and transport in the global atmosphere (pp. 222-291).New York: Springer Dordrecht Heidelberg London. ( Eder, B., C o ventry, D., Clark, T., Bollinger, C . RELAMP: a regional L agrangian m o del of ai r pollution-users guide, Project Report, EPA/600/8-86/013, US EnvironmentalProtection Agency, Research Triangle P a rk 1 9 86;NC. ) ( Einax, J., Zwanziger , H. , & GeiB, S. (1997). Chemometrics in environmental analysis. Berlind: WILEY. ) European Commission.(2004). Extended impact assessment re-view.Ottignes: Institut pour un Developpment Durable. ( Fu, X., Feng, X., Zhu, W ., W ang, S . , & L u , J. ( 2 008). T o talgaseous mercury concentrations in ambient air in the e a sternslope of Mt. G ongga, S o uth-Eastern fringe o f the T i betanplateau, China. Atmospheric Environment, 42, 970-979. ) Fu, X., Feng, X., Wang, S., Rothenberg, S., Shang, L., Li,Z., &Qui, G. (2009). Temporal and spatial distributions of totalgaseous mercury concentrations in ambient air in a moun-tainous area in southwestern China: implications for indus-trial and domestic mercury emissions in remote areas inChina. The Science of the Total Environment, 407, 2306-2314. Gencarelli, C., De Simone, F., Hedgecock, I., Sprovieri, F., &Pirrone,N. (2014). Development and application of a region-al scale atmospheric mercury model based on WRF/Chem: aMediterranean area investigation. Environmental Scienceand Pollution Research, 21,4095-109. Gratz, L., Keeler, G., Miller, E. (2009). Long-term relationshipsbetween mercury wet deposition and meteorology.Atmospheric Environment, 43, 6218-6229. ( K ock, H., B i eber,E., Eb i nghaus, R., Spain, T., & Thess, B. (2005). Comparison o f long-terms and seasonal variations of atmo-spheric mercury concentrations at the two European c o astalmonitoring stations M ace H e ad, Ir e land, and Zi n gst,Germany. Atmospheric Environment, 3 9,7549-7 5 56. ) ( L i, J., Sommar, J . , W angberg, I., Lin d qvist, O. & W ei, S. (2008).Short-time v ariation of mercury speciation i n u rban ofGoteborg during G OTE-2005. Atmospheric Environment, 42, 8382-8388. ) ( Liu, S . , Nadim,F . , Perkins, C., Carley, R., Hoag, G., Lin, Y., &Chen, L. ( 2002). Atmospheric m e rcury monitoring su r vey in B eijing, China. Chemosphere,4 8 , 97-1 0 7. ) Lynam,M., & Keeler, G. (2006). Source-receptor relationships formercury in urban Detroit. Michigan AtmosphericEnvironment, 39,3144-3155. ( Marks, R., & Beldowska,M.(2001). Air-sea exchange of mercuryvapour over the G ulf of Gdansk and so u thern Ba l tic Sea.Journal of Marine Systems, 27,315-324. ) ( Mazur, M., Mintz,R., Lapalme, M., & Wiens, B. (2009). Ambientair total gaseous m ercury concentrations in th e vi c inity ofcoal-fired power plants in Alberta. Canada Science of the Total Environment, 408, 373- 3 81. ) Minamata Convention. (2014). Minamata Convention onMercury, UNEP. http://mercuryconvention.org/Convention. ( N akagawa, R . , & H ir ooto, M.(1997). G e ographical d i stributionand background levels of total mercury in a ir in Ja p an and neighboring countries. Chemosphere, 34,801-8 0 6. ) ( N owak, B . ,Czaplicka, M . , Grzegorczyk, M . ,& Z i e lonka, U. ( 2 013). Comparison o f m e rcury measurement methods in wet deposi- tion. Environment P r otection Engineering, 39, 75-85. ) ( Nowak,B., Korszun, K.,& Zielonka,U.(2014). Long-term mea-surements ofatmospheric mercury species (TGM, TPM) andHg deposition in the Silesian region,Poland-conception ofthe mercury d eposition coefficient. Archives of Environmental Protection, 40,43-60. ) ( Parliament, E. (2005). COM 20: community strategy concerning mercury. ) ( P irrone,N., Aas, W., Cinnirella, S., Ebinghaus, R ., Hedgecock, I.,Pacyna, J ., Sprovieri, F. , & Sunderland, E. (2013). Towardthe next generation of a ir quality monitoring: mercury.Atmospheric Environment, 80,599-611. ) ( Pyta, H., Rosik-Dulewska, C., & Czaplicka, M. (2009). Speciation of ambient m ercury i n t h e U p per Silesia R e gion. P o land, Water, Air; & Soil Pollution , 197 , 233-240. ) ( Sakata, A. & Marumoto, K., (2005). Wet and dry deposition fl u xesof mercury i n Japan. Atmospheric Environment 39, 3 139- 3146. ) ( Shannon, J., & Volder, E. (1995) . Modeling atmospheric concen-trations of mercury and d eposition t o t he G reat L akes.Atmospheric Environment, 29, 1649- 1 661. ) ( Travnikov, O. ( 2 005). C o ntribution of the intercontinental a t mo-spheric transport to mercury pollution i n t he N orthernHemisphere. Atmospheric Environment, 39, 7 5 41- 7 548. ) ( Tsiros, I.,& Ambrose, R . ( 1999). A n e n vironmental simulation model f o r transport and fate of mercury i n small r u ral catch- ments. Chemosphere, 3 9, 477-492. ) Vanarsdale, A., Weiss,J., Keeler, G., Miller, E., Boulet, G., Brultte,R. & Poissant, L. (2005). Patterns of mercury deposition andconcentration in northeastern North America. Ecotoxicology,14, 37-52. ( Zielonka, U . , H lawiczka, S., F udala, J., Wangberg, I., & Munthe, J. ( 2005). Seasonal mercury concentrations measured in r ural air in Southern Poland. Contribution from l ocal a nd regional c oal combustion. A t mospheric Environment, 39, 7580-7586. ) Springer 关键词 汞沉降系数 大气汞形态 汞干沉降和湿沉降 引言 环境内的汞之所以被视为全球问题有多个原因。第一个原因是一旦汞进入环境,它便永远存在,不可降解;第二原因是由于汞的物理性质,它很容易远距离扩散。即使是环境中存在少量汞,也会对健康造成消极影响。因此,需要采取行动减少汞排放,重视拓展环境中汞循环的相关知识。在过去的数年中,环境中的汞排放、传输和转换引起了广泛的关注,但虽然对这些问题有着无数研究,很多现象仍未得到解释。摘要 多年来,大气汞一直被视为全球污染物。转移大气中的汞化合物及其在地表的沉降是一个需要对该金属的各种形态在环境要素间循环具有一定知识的重要问题。有很多数值模型可以用来研究和表现这一现象。该等模型基于汞排放源相关数据、模型区内该污染物的浓度和气象数据,以评估地区和全球规模的空气质量流量。本研究中提出了一种仅基于汞流强度分析评估本地规模内汞沉降通量的方法。使用MDC方法评估得到的Zloty Potok站(西里西亚区的地区本底站)汞沉降通量(混合沉降)范围从22.8 μg·m?2·年?1(根据2013年8个月期间数据测得)到2012年的54.2 μg·m?2·年?1。开发出能够用于仅测得气象参数和常压空气中汞浓度区域的汞沉降系数 (MDC)评估方法。通过得到的沉降系数值,能够量化所选污染物的浓度及沉降带来的潜在影响。厂商广告执行的所有分析中使用的实验室玻璃器皿和所有的玻璃设备都经过Miele美诺清洗消毒机的再处理。敬请留下联系方式,了解更多关于Miele清洗消毒机特点,我们愿将为您提供中文参考译文。关于德国美诺Miele创立于1899年,德国美诺Miele专注于清洗领域。百余年来,推动着清洗动力学的研究与应用,为器皿的再处理提供了整体系统解决方案。为了满足不同应用领域的再处理需求,Miele已为十数万客户提供了清洗消毒机及其验证服务,最佳的机器与附件、清洗剂、水质和温度及时间的最佳配合程序,广受赞誉。 德国美诺 中国总公司电话:+86 21 6157 3500 传真:+86 21 6157 3511 地址:上海市静安区石门一路82号 (200040) 邮箱:professional@cn.miele.com
确定
还剩11页未读,是否继续阅读?

产品配置单

美诺中国 Miele China为您提供《大气中汞沉降系数,大气汞形态,汞干沉降和湿沉降检测方案(洗瓶机)》,该方案主要用于空气中(类)金属及其化合物检测,参考标准--,《大气中汞沉降系数,大气汞形态,汞干沉降和湿沉降检测方案(洗瓶机)》用到的仪器有德国美诺PG8583清洗机
推荐专场

相关方案
更多