


Differential Scanning Calorimetry (DSC) is used to measure heat flow into or out of a sample as it is exposed to a controlled thermal profile. DSC provides both qualitative and quantitative information about material transitions such as the glass transition, crystallization, curing, melting, and decomposition. For some of these transitions, DSC can provide not only the temperature at which the transition (reaction) occurs and how much total heat is involved, but DSC can also provide valuable information about the rate (kinetics) of reaction. Furthermore, with the advent of easy-touse computer based data analysis programs, the ability to obtain such kinetic information has become more practical.?
方案详情

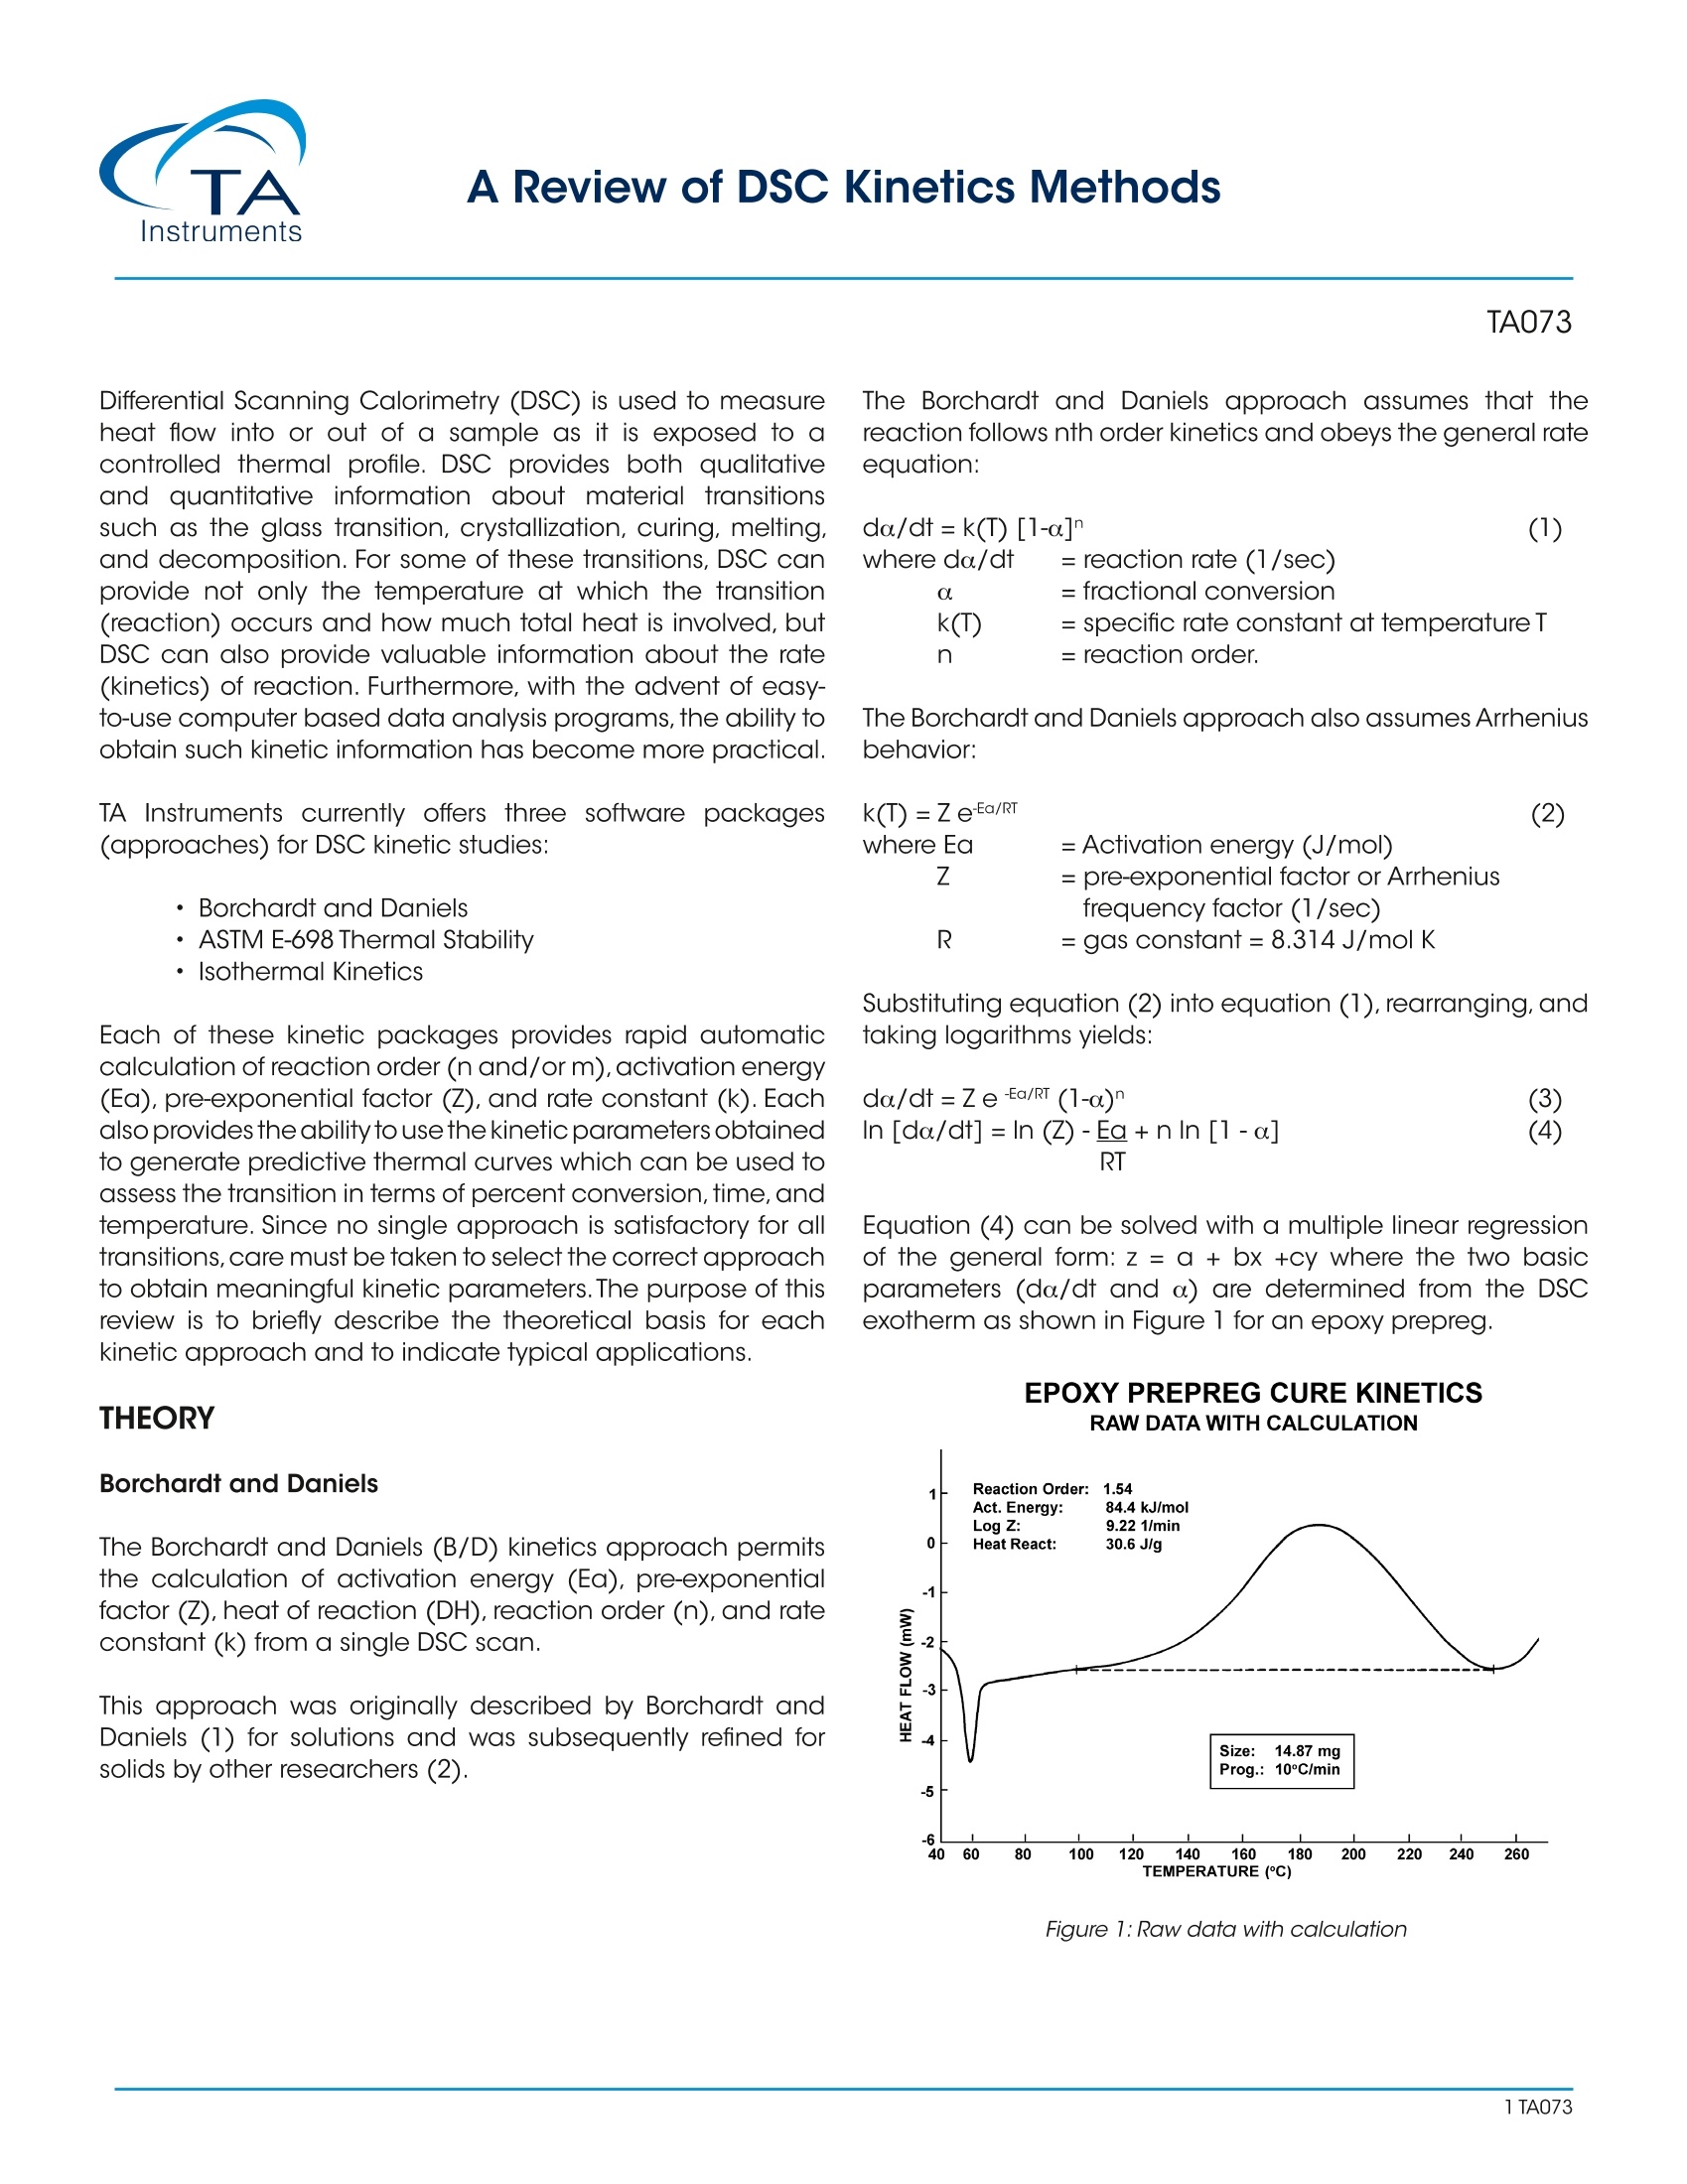
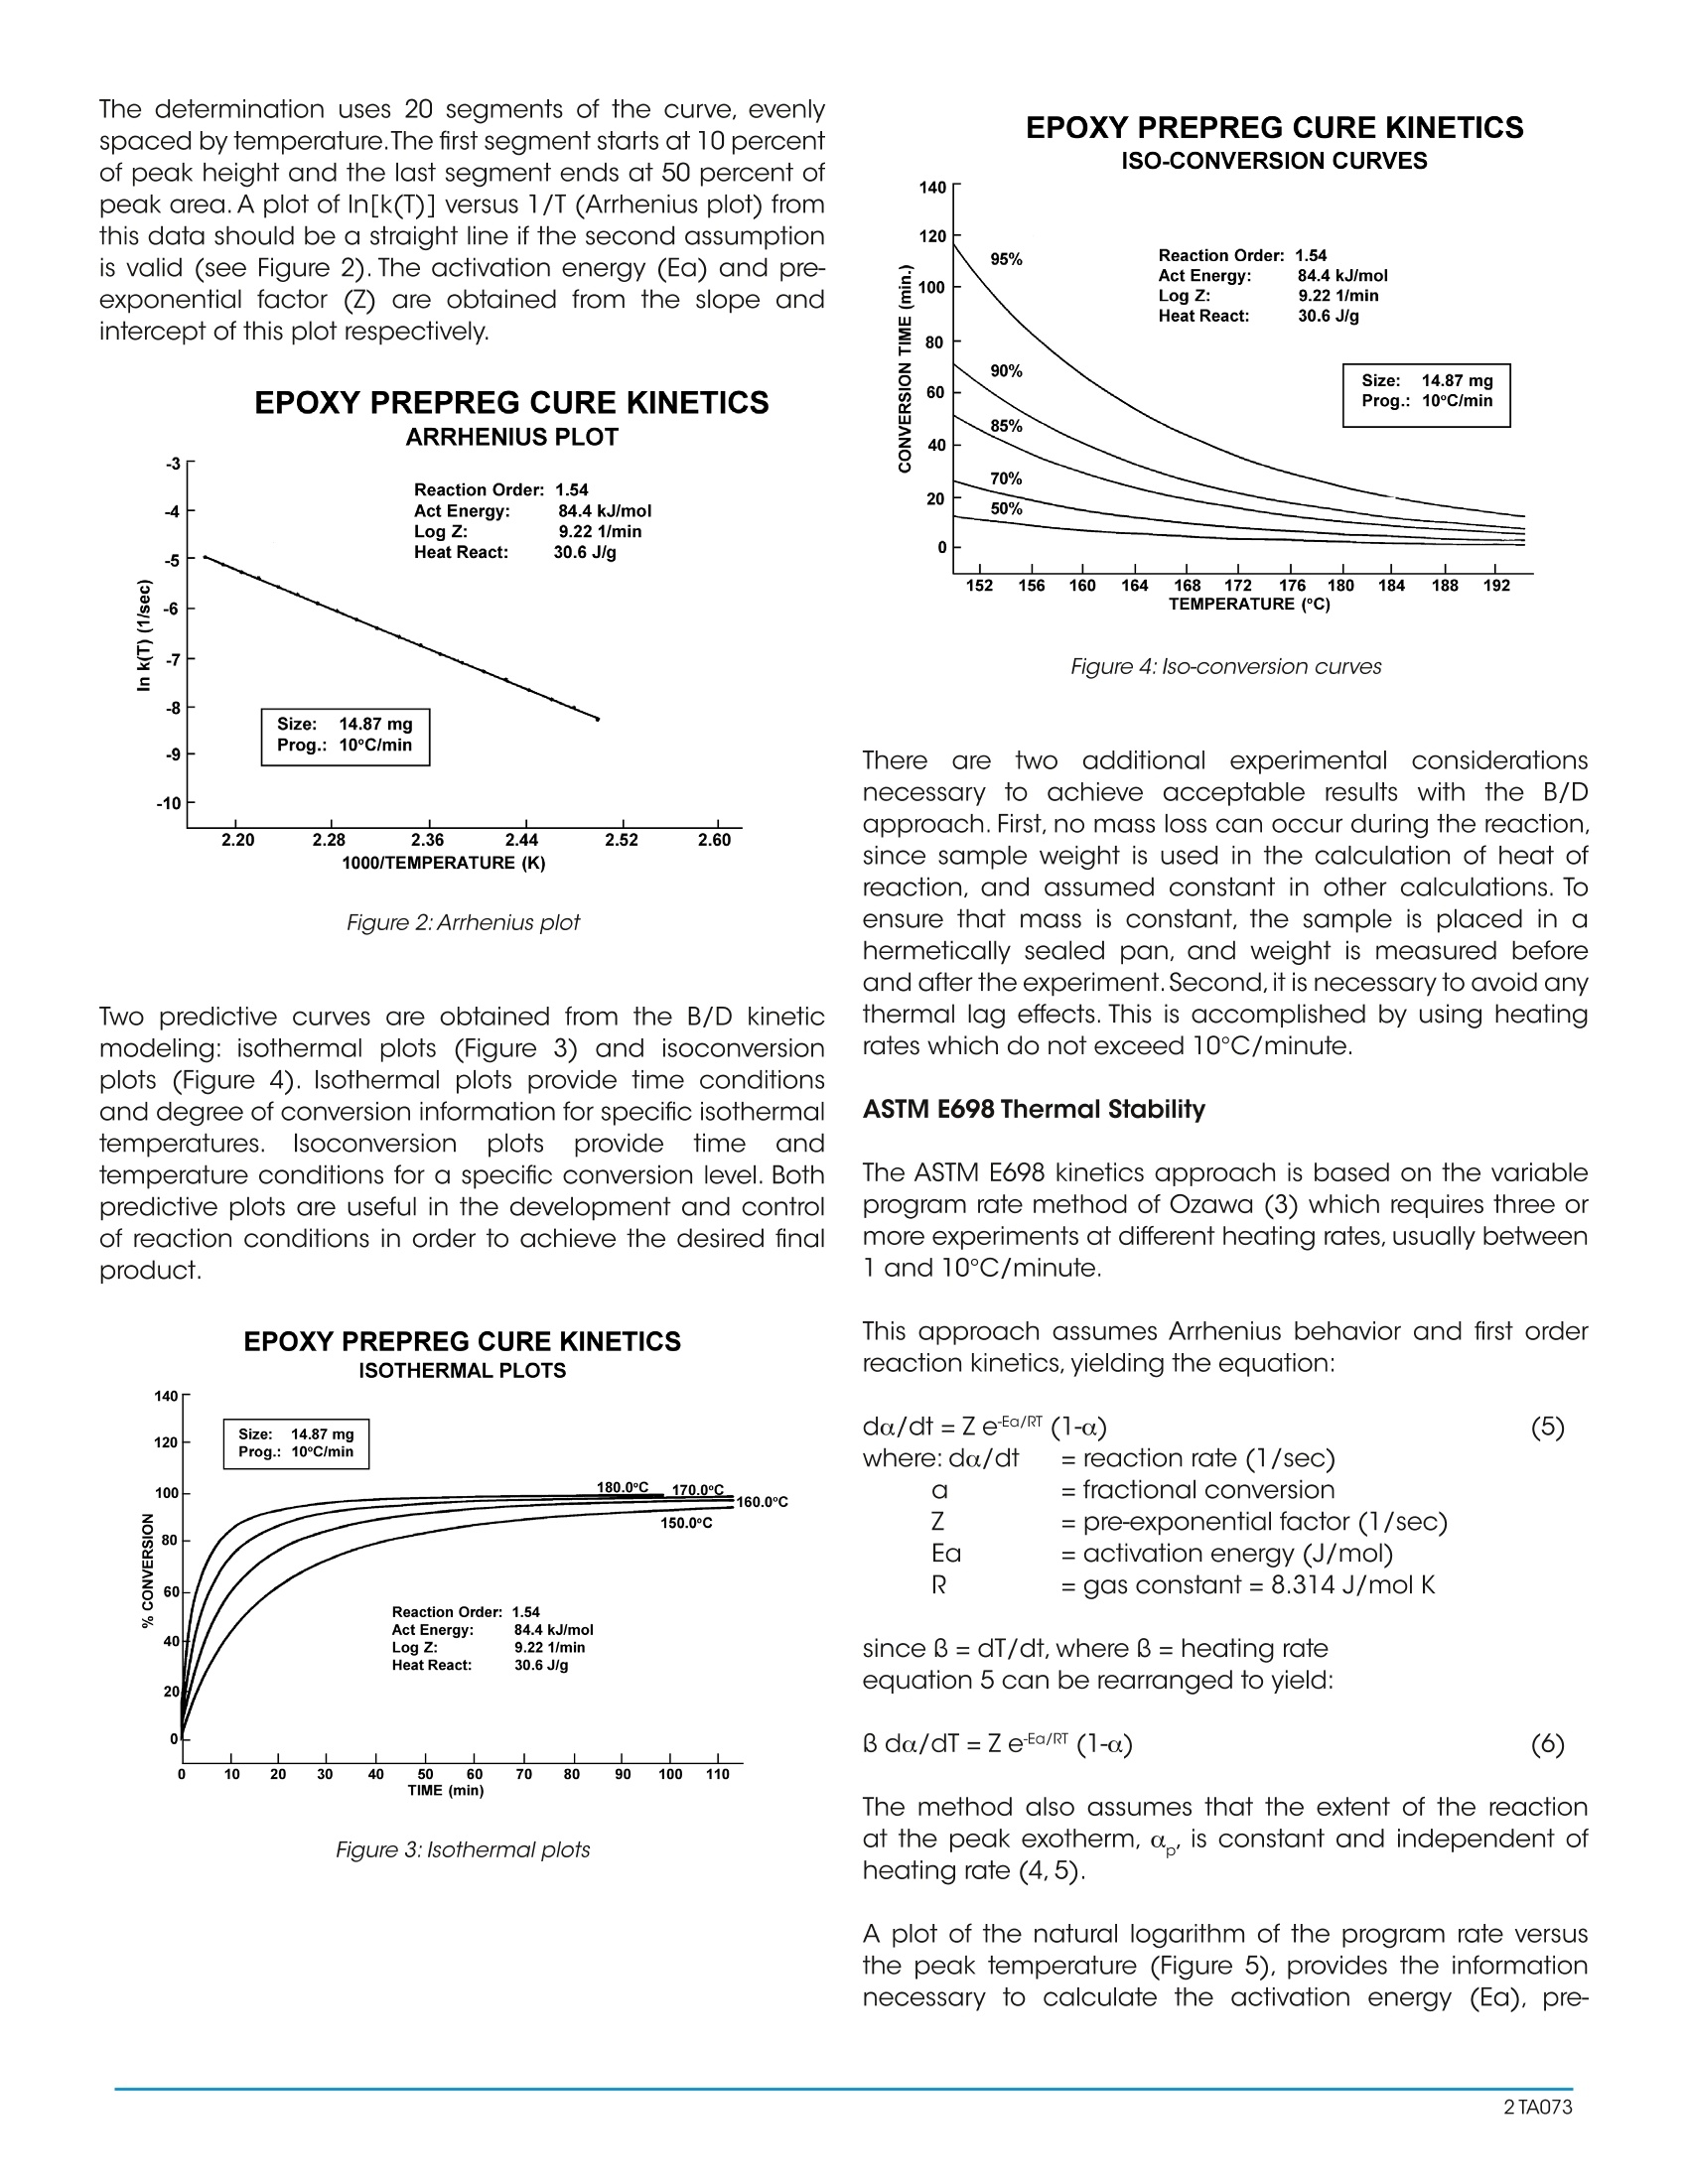
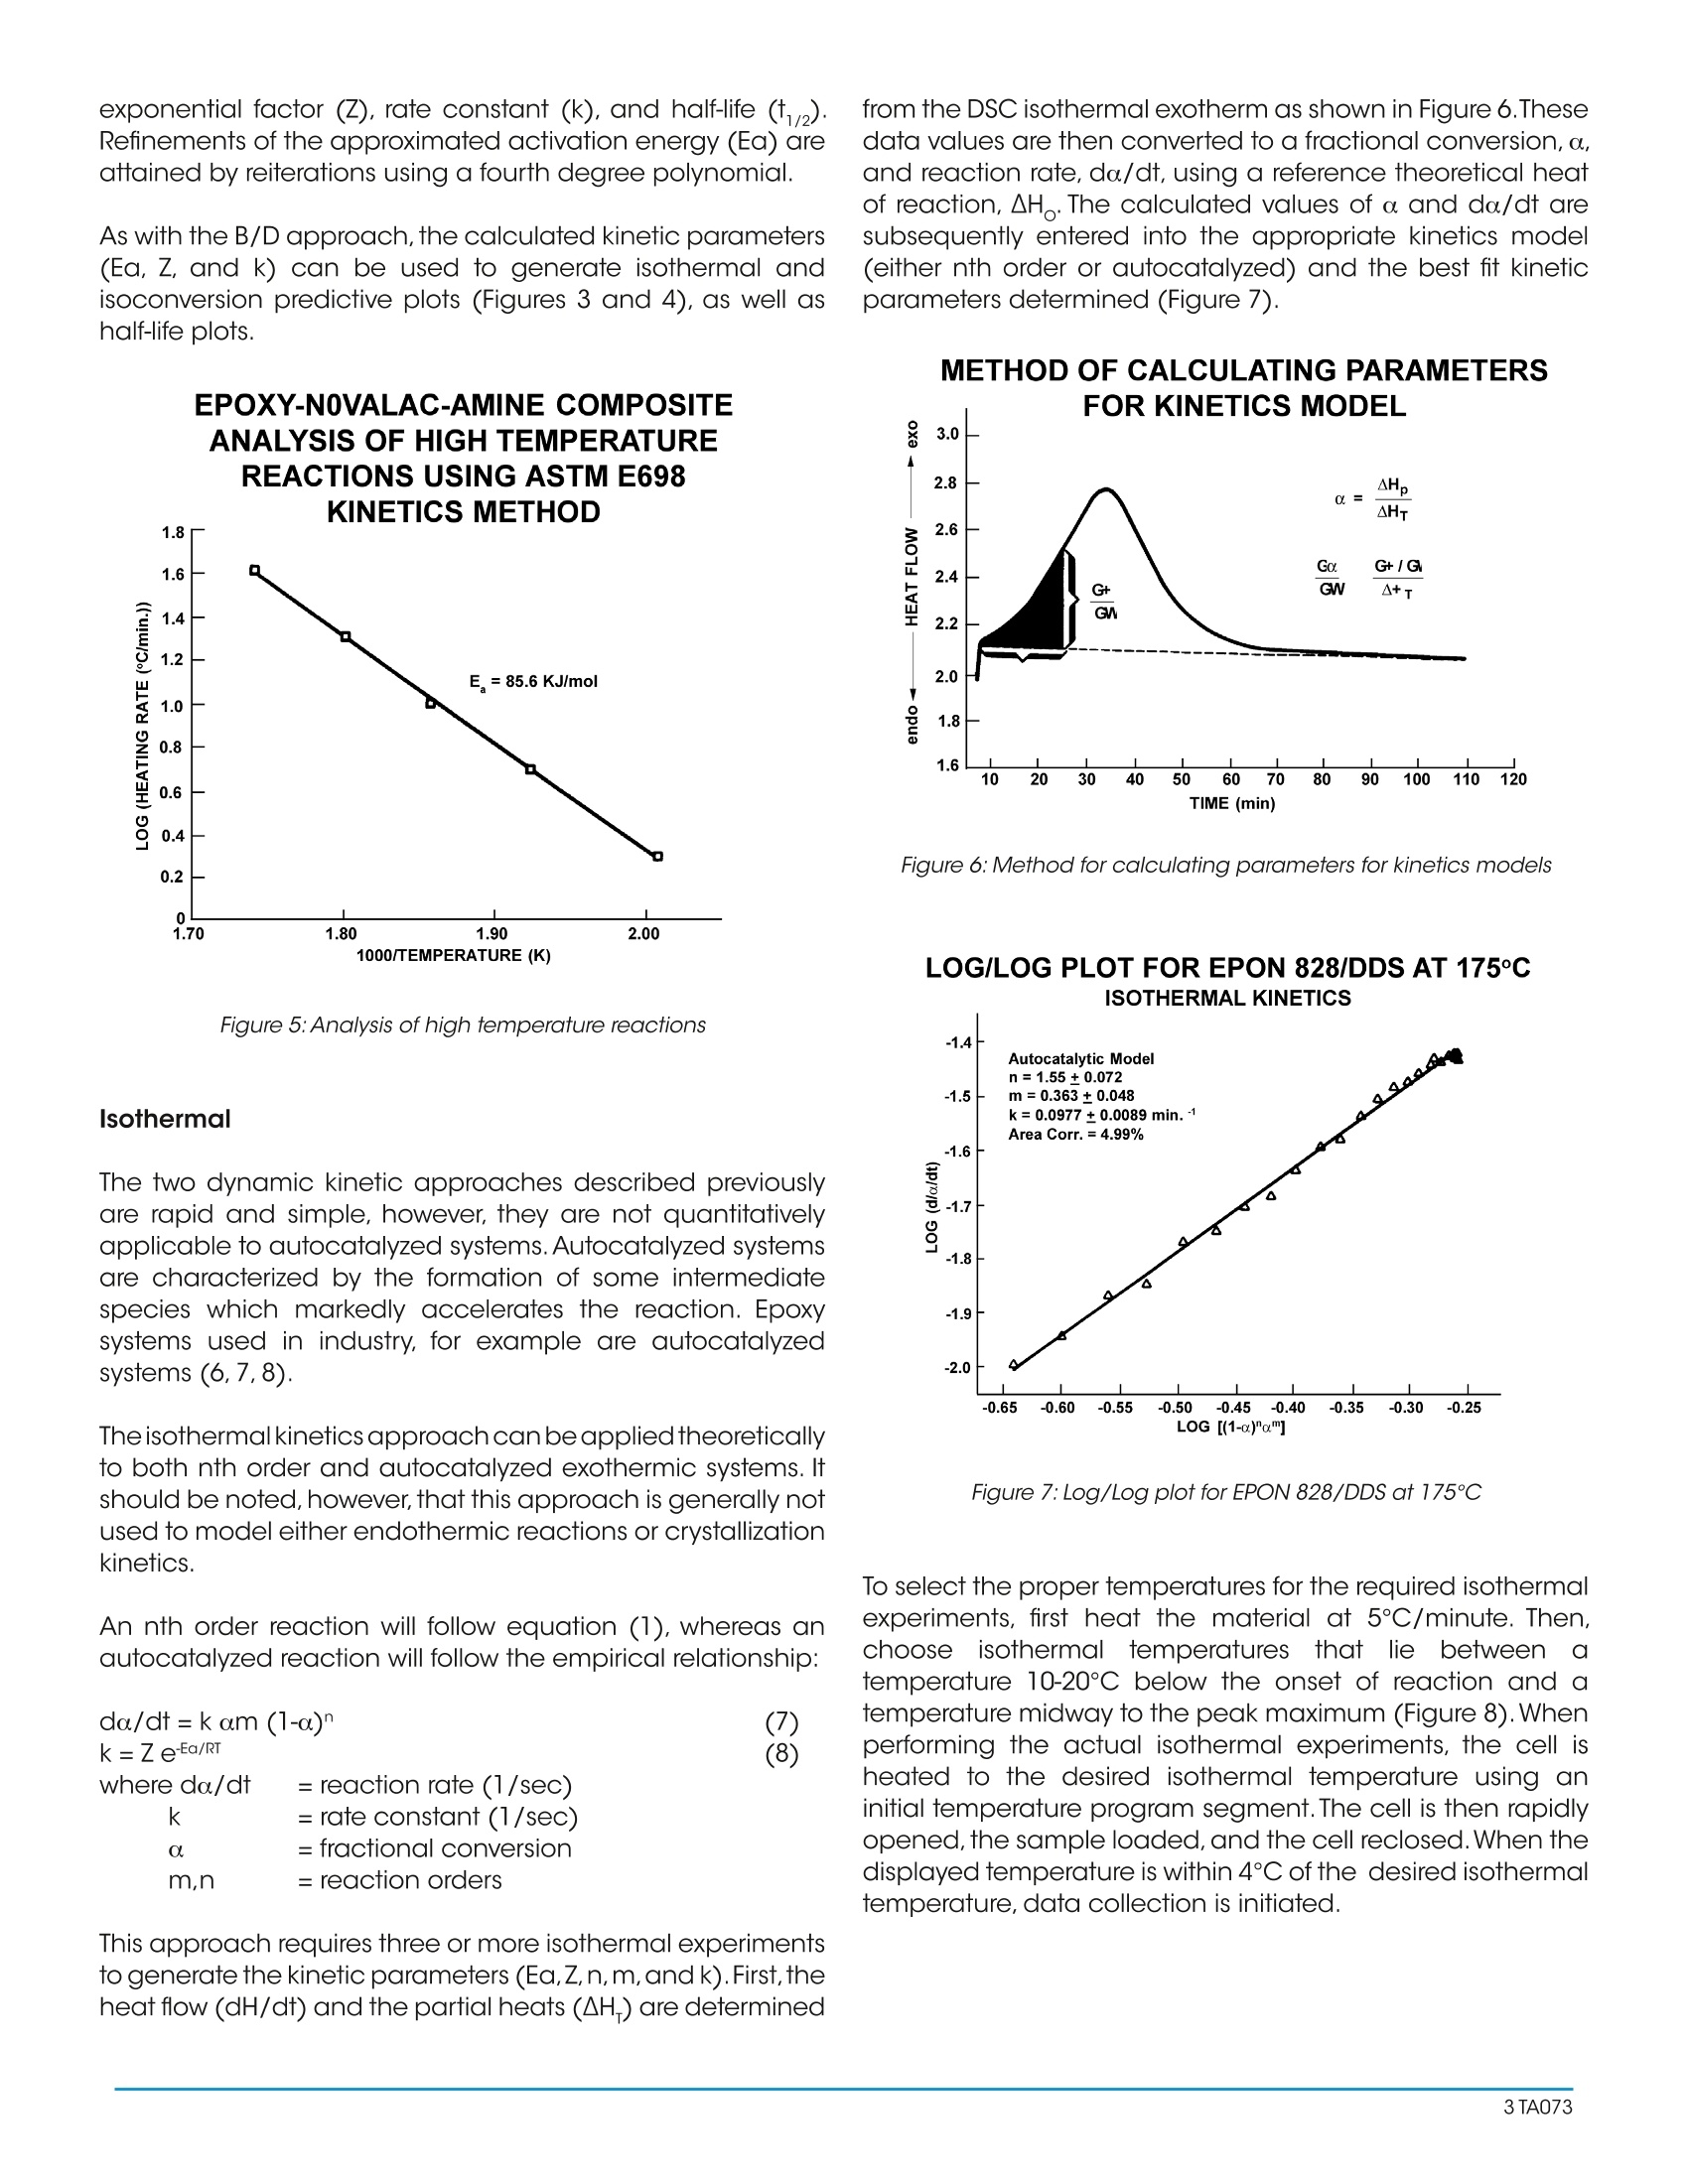
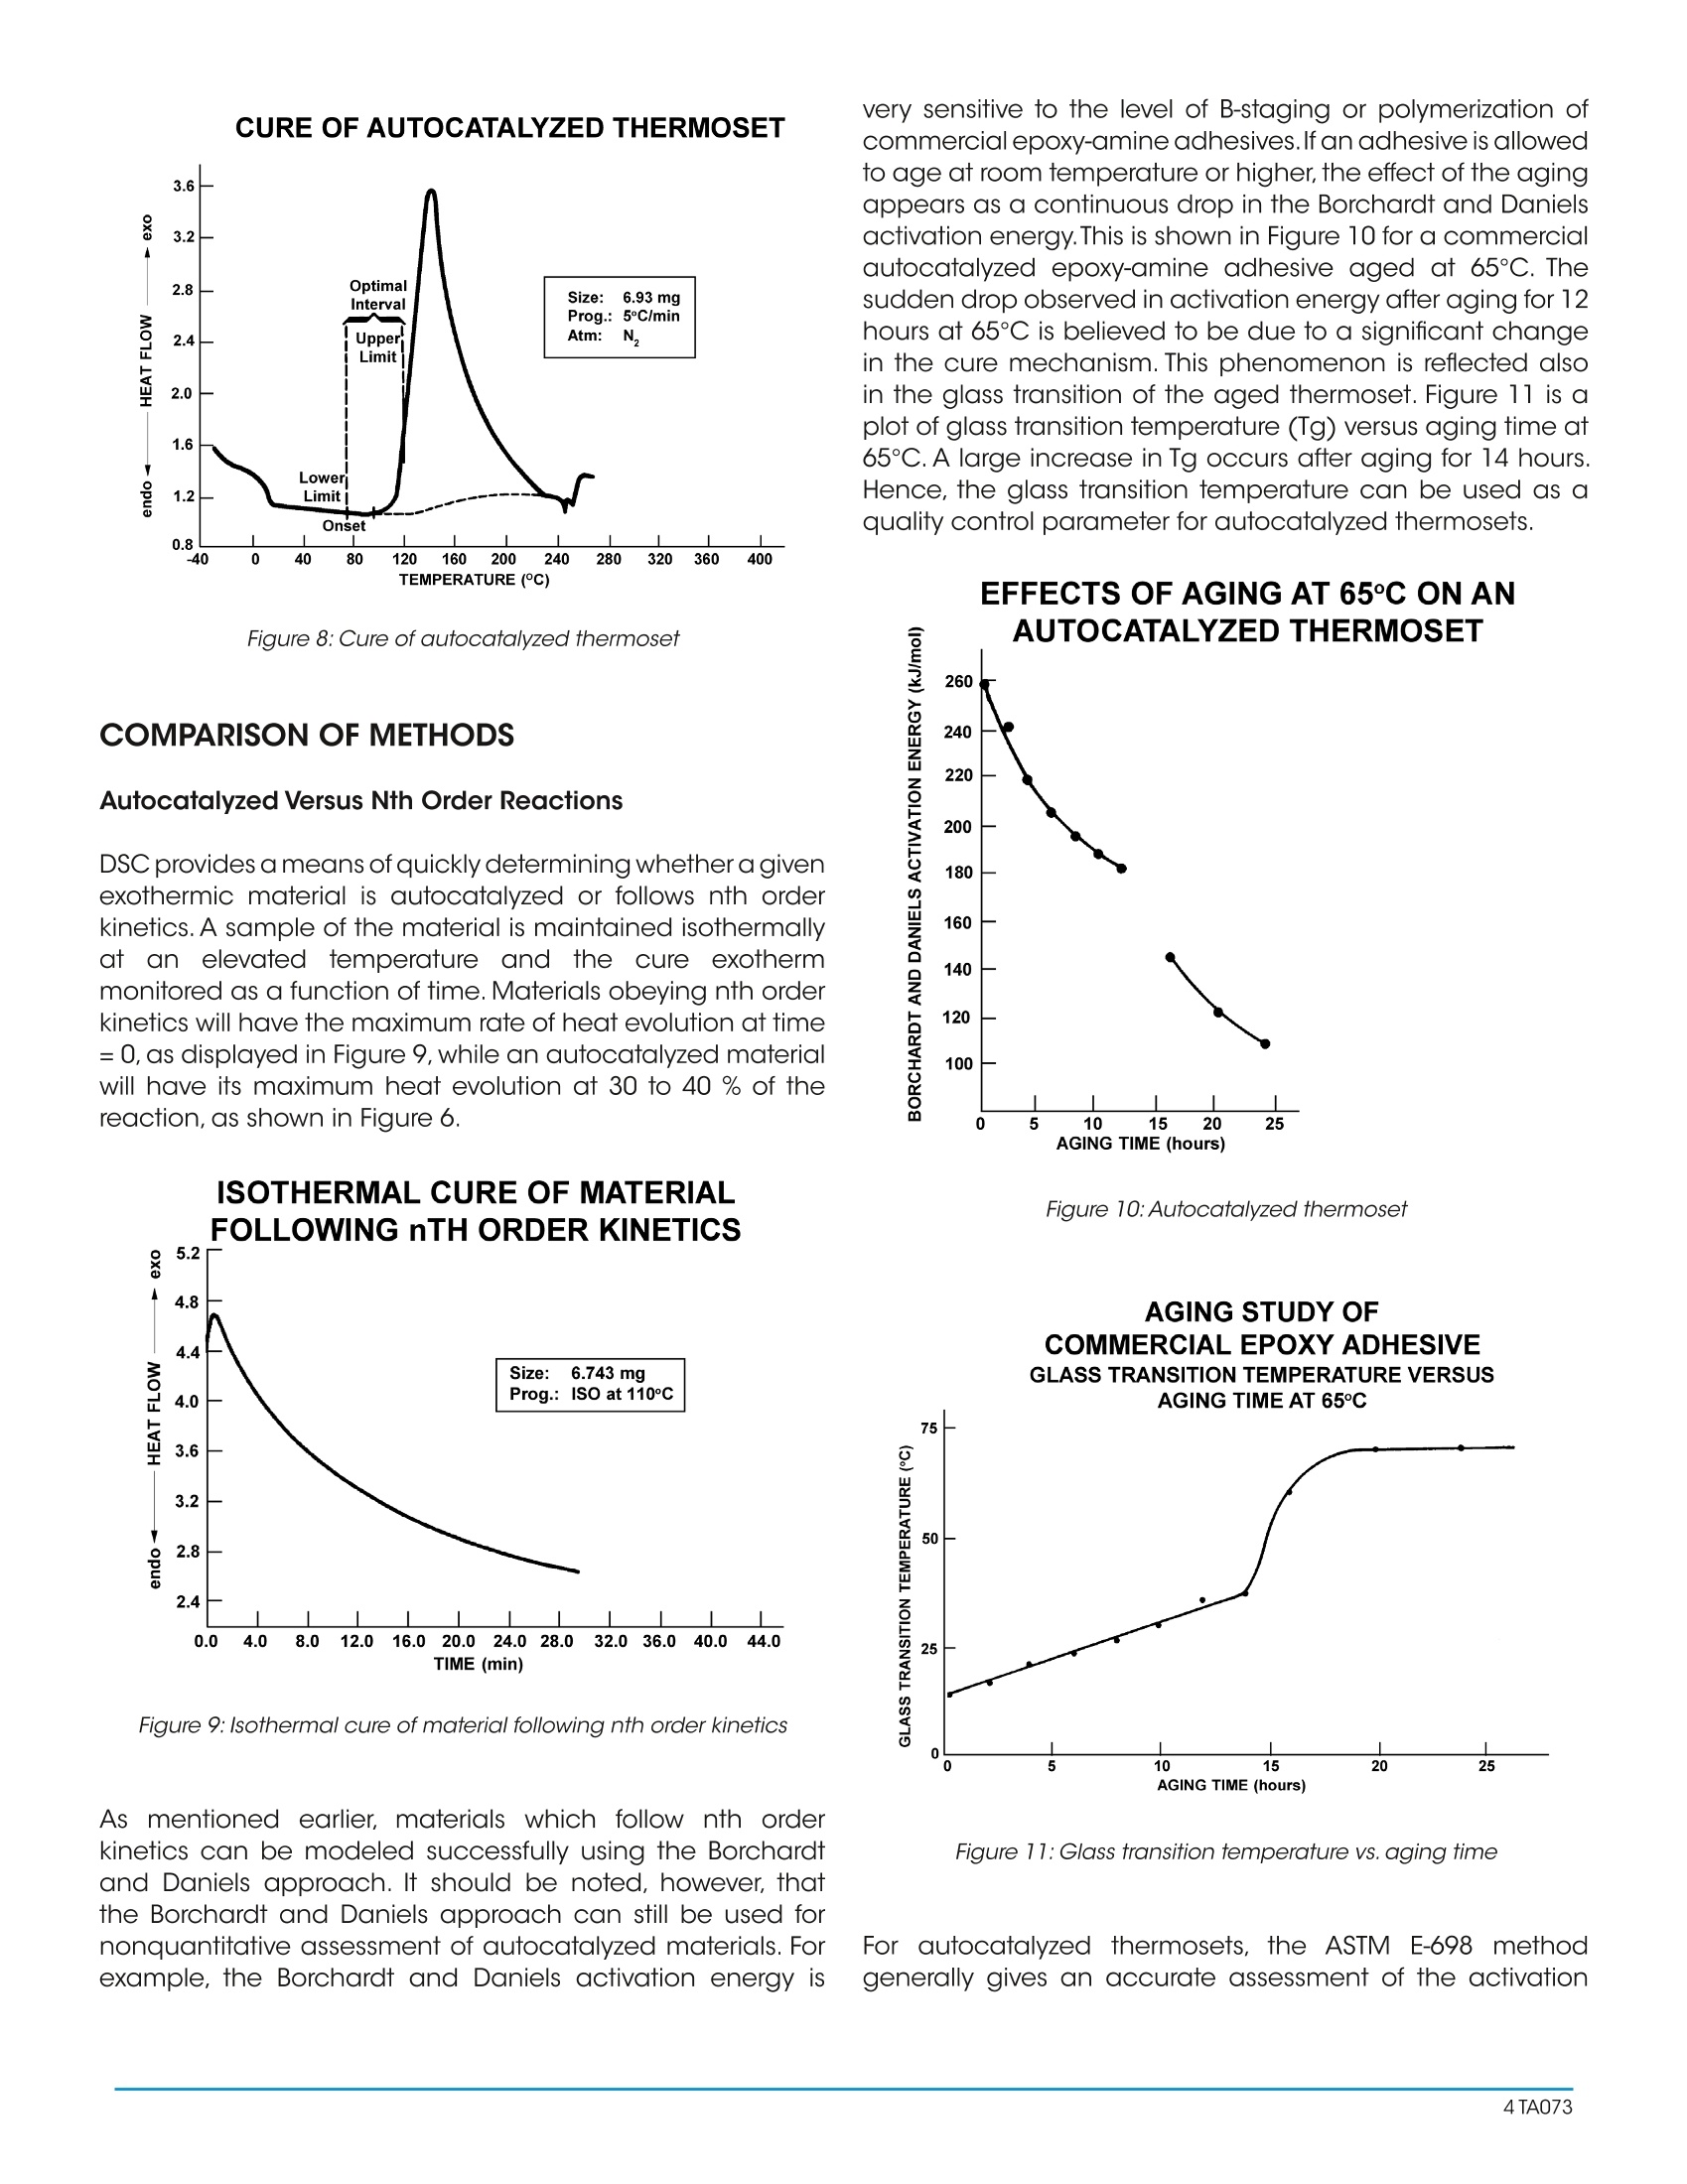
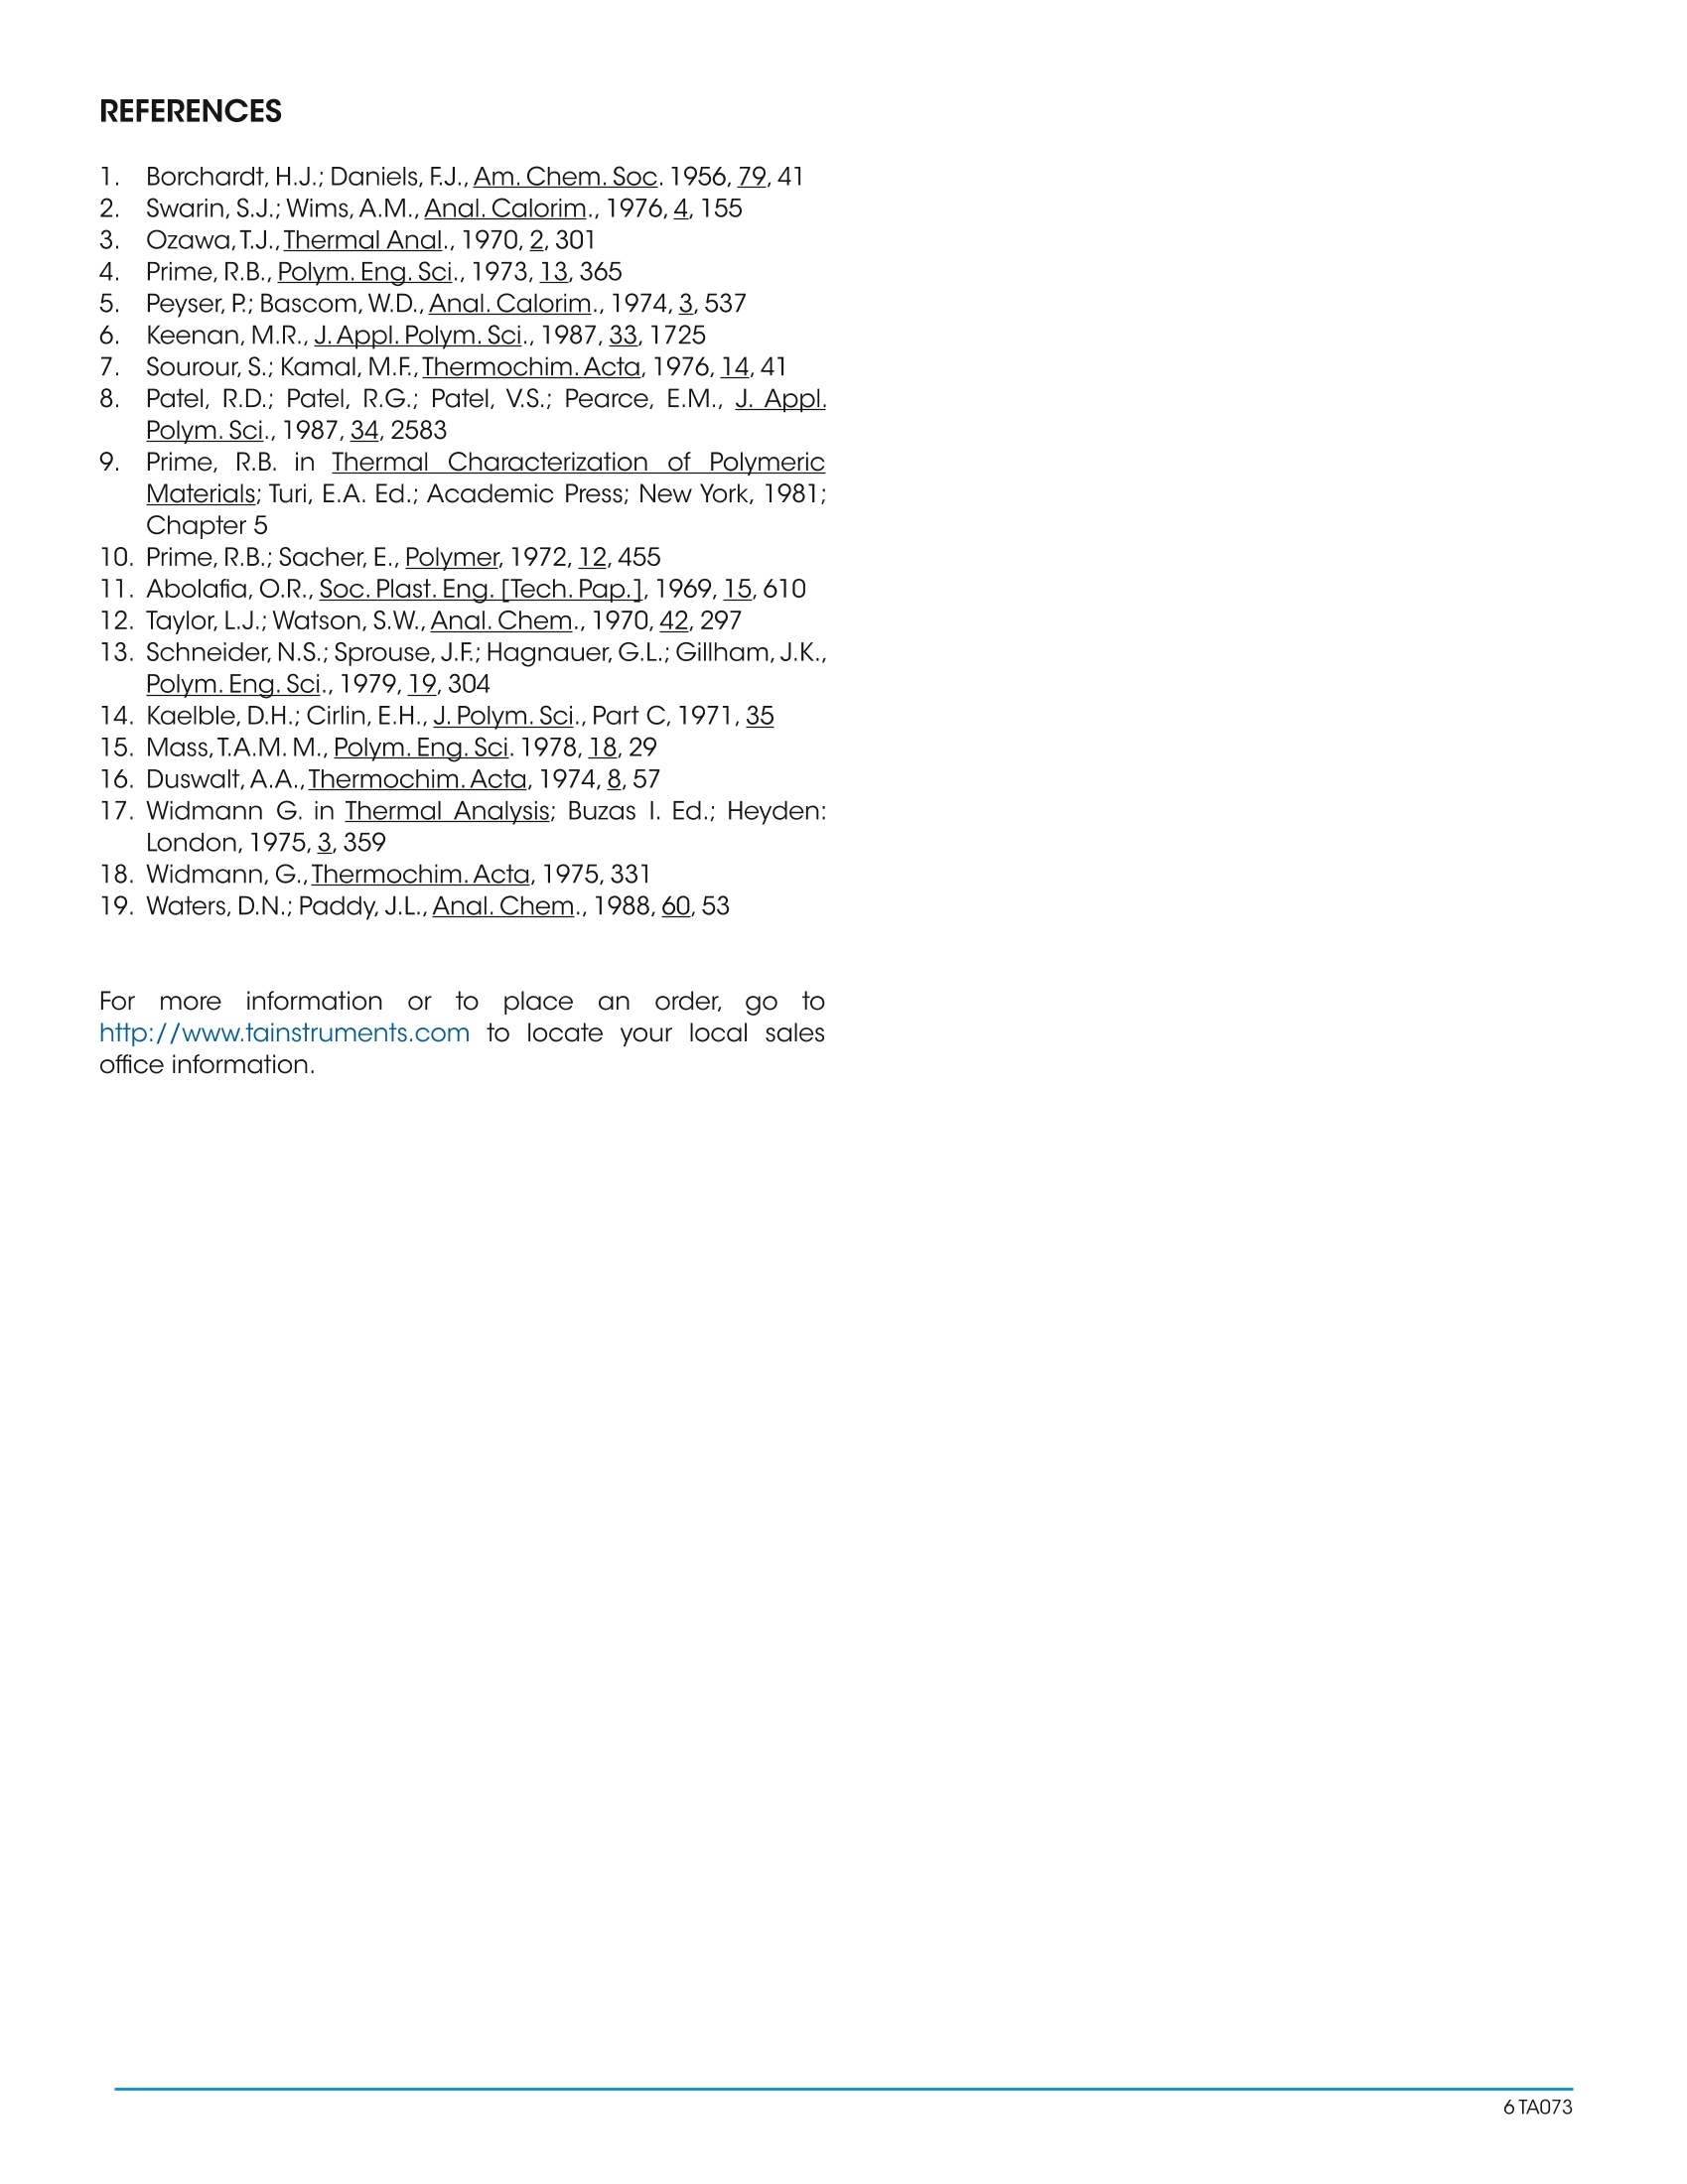
A Review of DSC Kinetics Methods CURE OF AUTOCATALYZED THERMOSET Differential Scanning Calorimetry (DSC) is used to measureheat flow into or out of a sample as it is exposed to acontrolled thermal profile. DSC provides both qualitativeand quantitative information about material transitionssuch as the glass transition, crystallization, curing, melting,and decomposition. For some of these transitions, DSC canprovide not only the temperature at which the transition(reaction) occurs and how much total heat is involved, butDSC can also provide valuable information about the rate(kinetics) of reaction. Furthermore, with the advent of easy-to-use computer based data analysis programs, the ability toobtain such kinetic information has become more practical. TA Instruments currently offers three software packages(approaches) for DSC kinetic studies: ·Borchardt and Daniels · ASTM E-698 Thermal Stability ·Isothermal Kinetics Each of these kinetic packages provides rapid automaticcalculation of reaction order (n and/orm), activation energy(Ea), pre-exponential factor (Z), and rate constant (k). Eachalso provides the ability to use the kinetic parameters obtainedto generate predictive thermal curves which can be used toassess the transition in terms of percent conversion,time, andtemperature. Since no single approach is satisfactory for alltransitions, care must be taken to select the correct approachto obtain meaningful kinetic parameters.The purpose of thisreview is to briefly describe the theoretical basis for eachkinetic approach and to indicate typical applications. THEORY Borchardt and Daniels The Borchardt and Daniels (B/D) kinetics approach permitsthe calculation of activation energy (Ea), pre-exponentialfactor (Z), heat of reaction (DH), reaction order (n), and rateconstant (k) from a single DSC scan. This approach was originally described by Borchardt andDaniels (1) for solutions and was subsequently refined forsolids by other researchers (2). The Borchardt and Daniels approach assumes that thereaction follows nth order kinetics and obeys the general rateequation: 0. = fractional conversion k(T) = specific rate constant at temperatureTn = reaction order. The Borchardt and Daniels approach also assumes Arrheniusbehavior: where Ea = Activation energy (J/mol)=pre-exponential factor or Arrheniusfrequency factor (1/sec)R =gas constant=8.314 J/mol K Substituting equation (2) into equation(1), rearranging, andtaking logarithms yields: Equation (4) can be solved with a multiple linear regressionof the general form: z = a + bx +cy where the two basicparameters (do./dt and a) are determined from the DSCexotherm as shown in Figure 1 for an epoxy prepreg. EPOXY PREPREG CURE KINETICSRAW DATA WITH CALCULATION Figure 1:Raw data with calculation The determination uses 20 segments of the curve, evenlyspaced by temperature.The first segment starts at 10 percentof peak height and the last segment ends at 50 percent ofpeak area. A plot of In[k(T)] versus 1/T (Arrhenius plot) fromthis data should be a straight line if the second assumptionis valid (see Figure2). The activation energy (Ea) and pre-exponential factor (Z) are obtained from the slope andintercept of this plot respectively. EPOXY PREPREG CURE KINETICSARRHENIUS PLOT Figure 2:Arrhenius plot Two predictive curves are obtained from the B/D kineticmodeling: isothermal plots (Figure 3) and isoconversionplots (Figure 4). Isothermal plots provide time conditionsand degree of conversion information for specific isothermaltemperatures. Isoconversion plotsprovide time andtemperature conditions for a specific conversion level. Bothpredictive plots are useful in the development and controlof reaction conditions in order to achieve the desired finalproduct. Figure 3: Isothermal plots EPOXY PREPREG CURE KINETICSISO-CONVERSION CURVES 140 一EZOZO Figure 4:Iso-conversion curves There aretwo additional experimental considerationsnecessary to achieve acceptable results with the B/Dapproach. First, no mass loss can occur during the reaction,since sample weight is used in the calculation of heat ofreaction, and assumed constant in other calculations. Toensure that mass is constant, the sample is placed in ahermetically sealed pan, and weight is measured beforeand after the experiment.Second, it is necessary to avoid anythermal lag effects. This is accomplished by using heatingrates which do not exceed 10°C/minute. ASTM E698 Thermal Stability The ASTM E698 kinetics approach is based on the variableprogram rate method of Ozawa (3) which requires three ormore experiments at different heating rates, usually between1 and 10°C/minute. This approach assumes Arrhenius behavior and first orderreaction kinetics, yielding the equation: do/dt=ZeEa/RT (1-a.) (5) where: do/dt = reaction rate (1/sec)a= fractional conversionZ =pre-exponential factor (1/sec)E= activation energy (J/mol)= gas constant=8.314J/mol K since 3= dT/dt, where 3= heating rateequation 5 can be rearranged to yield: The method also assumes that the extent of the reactionat the peak exotherm, a, is constant and independent ofheating rate (4,5). A plot of the natural logarithm of the program rate versusthe peak temperature (Figure 5), provides the informationnecessary to calculate the activation energy (Ea), pre- exponential factor (Z), rate constant (k), and half-life(t).Refinements of the approximated activation energy (Ea) areattained by reiterations using a fourth degree polynomial. As with the B/D approach,the calculated kinetic parameters(Ea, Z, and k) can be used to generate isothermal andisoconversion predictive plots (Figures 3 and 4), as well ashalf-life plots. EPOXY-N0VALAC-AMINE COMPOSITE ANALYSIS OF HIGH TEMPERATURE Figure 5:Analysis of high temperature reactions Isothermal The two dynamic kinetic approaches described previouslyare rapid and simple, however, they are not quantitativelyapplicable to autocatalyzed systems.Autocatalyzed systemsare characterized by the formation of some intermediatespecies which markedly accelerates the reaction. Epoxysystems used in industry, for example are autocatalyzedsystems (6,7,8). Theisothermal kinetics approach can be applied theoreticallyto both nth order and autocatalyzed exothermic systems. Itshould be noted, however, that this approach is generally notused to model either endothermic reactions or crystallizationkinetics. An nth order reaction will follow equation (1), whereas anautocatalyzed reaction will follow the empirical relationship: where do/dt = reaction rate (1/sec) = rate constant (1/sec) = fractional conversion m,n = reaction orders This approach requires three or more isothermal experimentsto generate the kinetic parameters (Ea,Z,n,m,and k). First,theheat flow (dH/dt) and the partial heats (AH) are determined from the DSC isothermal exotherm as shown in Figure6.Thesedata values are then converted to a fractional conversion, a,and reaction rate, da/dt, using a reference theoretical heatof reaction, AH .The calculated values of aand do/dt aresubsequently entered into the appropriate kinetics model(either nth order or autocatalyzed) and the best fit kineticparameters determined (Figure 7). METHOD OF CALCULATING PARAMETERS Figure 6: Method for calculating parameters for kinetics models LOG/LOG PLOT FOR EPON 828/DDS AT 175°CISOTHERMAL KINETICS Figure 7:Log/Log plot for EPON 828/DDS at 175℃ To select the proper temperatures for the required isothermalexperiments, first heat the material at 5℃/minute. Then,choose1isothermal temperaturesthat liebetween (imperature 10-20℃ below the onset of reaction and atemperature midway to the peak maximum (Figure 8). Whenperforming the actual isothermal experiments, the cell isheated to the desired isothermal temperature using aninitial temperature program segment. The cell is then rapidlyopened, the sample loaded, and the cell reclosed.When thedisplayed temperature is within 4℃ of the desired isothermaltemperature, data collection is initiated. Figure 8: Cure of autocatalyzed thermoset COMPARISON OF METHODS Autocatalyzed Versus Nth Order Reactions DSC provides ameans of quickly determining whether a givenexothermic material is autocatalyzed or follows nth orderkinetics. A sample of the material is maintained isothermallyat an elevated temperature and the cure exothermmonitored as a function of time. Materials obeying nth orderkinetics will have the maximum rate ofheat evolution at time=0, as displayed in Figure 9, while an autocatalyzed materialwill have its maximum heat evolution at 30 to 40 % of thereaction, as shown in Figure 6. |SOTHERMAL CURE OF MATERIALFOLLOWING nTH ORDER KINETICS Figure 9: Isothermal cure of material following nth order kinetics As mentioned earlier, materials which follow nth orderkinetics can be modeled successfully using the Borchardtand Daniels approach. It should be noted, however, thatthe Borchardt and Daniels approach can still be used fornonquantitative assessment of autocatalyzed materials. Forexample, the Borchardt and Daniels activation energy is very sensitive to the level of B-staging or polymerization ofcommercial epoxy-amine adhesives.If an adhesive is allowedto age at room temperature or higher, the effect of the agingappears as a continuous drop in the Borchardt and Danielsactivation energy.This is shown in Figure 10 for a commercialautocatalyzed epoxy-amine adhesive aged at 65℃. Thesudden drop observed in activation energy after aging for 12hours at 65℃ is believed to be due to a significant changein the cure mechanism. This phenomenon is reflected alsoin the glass transition of the aged thermoset. Figure 11 is aplot of glass transition temperature (Tg) versus aging time at65℃. A large increase in Tg occurs after aging for 14 hours.Hence, the glass transition temperature can be used as aquality control parameter for autocatalyzed thermosets. EFFECTS OF AGING AT 65°C ON ANAUTOCATALYZED THERMOSET Figure 10:Autocatalyzed thermoset AGING STUDY OF Figure 11: Glass transition temperature vs. aging time For autocatalyzed thermosets, the ASTM E-698 methodgenerally gives an accurate assessment of the activation energy. However, the pre-exponential factor (Z) may not bevalid since the calculation of Z assumes nth order behavior.To determine whether the ASTM E-698 approach successfullydescribes the thermoset kinetics, the 60-minute half-lifetest should be used. In this procedure, the residual heat ofcure of a sample which has been isothermally cured for 60minutes at a temperature where half-life is about 120 minutesis compared to the heat of cure (AH ) of a freshly preparedsample. The ratio of the two exotherms (AH residual/AH) should be 0.5±0.05. If it is not, then the ASTM E-698method does not successfully model the cure kinetics of thethermoset; probably due to an incorrect assessment of Z. Amore accurate estimation of the pre-exponential factor canbe subsequently made using an autocatalyzed cure-rateexpression. Dynamic Versus Isothermal Techniques As described previously, the Borchardt and Danielsapproach requires only a single temperature programmedexperiment. In theory, a dynamic DSC trace should containall the kinetic information normally embodied in a series ofisothermal experiments (9). This makes the B/D approachhighly attractive. This technique is fairly rapid and worksreasonably well for simple, first order reactions. On the otherhand, previous work (4, 10, 11,12) indicates the B/D methodis not applicable in any of the following cases: ·Overlapping reaction peaks ·Decomposition occurs during reaction ·Autocatalyzed reactions For more complex systems, therefore, ASTM or isothermalmethods must be used. The ASTM method is often the only means to analyzereactions with irregular baselines (13), solvent effects (14), ormultiple exotherms (15). In these cases, the B/D method andisothermal measurements are unreliable.This is because thepeak temperatures at different heating rates (the basis forASTM calculations) is not affected significantly by baselineshift, while the peak area, which is used to determine reactionrate and fractional conversion in the B/D and isothermalapproaches, is affected. Conversely, some situations where the ASTM method maynot be applicable include materials where isomerizationchanges occur at the reaction temperature or decompositionoccurs upon melting (16). These cases can be recognized,however, by a non-linear plot of log (program rate) versuspeak temperature, or by a wide discrepancy between thepredicted data and the isothermal aging confirmation.Also,both dynamic methods (B/D and ASTM) assume that thereaction under investigation follows Arrhenius behavior andnth order kinetics. Reactions which do not adhere to theseassumptions, therefore, should be modeled with isothermaltechniques. Furthermore, the isothermal method offers the advantagesof easier data interpretation and broader applicability. This technique has been successfully applied in both nthorder (17, 18) and autocatalytic (6, 7) reactions. For theinvestigation of a new reaction where the order and thereaction mechanism are not known, the isothermal methodshould be used. Although the isothermal experiments may be more timeconsuming, they often generate more reliable kineticparameters.This is because the isothermal method introducesfewer experimental variables into a single measurement sothat the scope for ambiguity in the interpretation of data isreduced (19). SUMMARY Modeling the kinetics of material reactions provides thescientist and engineer with valuable information for:process development and prediction of optimum reactiontemperatures, process control by optimization of reactionadvancement or conversion, and estimation of materiallifetimes.Several DSC approaches are available for obtainingthis kinetic information.The chart shown in Figure 12 providesbroad guidelines for deciding which DSC method is mostappropriate. Figure 12: Selecting a DSC method ( REFERENCES ) ( . Ozawa,T.J. , Thermal Anal.,1970,2,301 ) ( P rime, R.B., Polym.Eng. S ci.,1973,13,365 ) ( P eyser, P;Bascom, W.D.,Anal.Calorim.,1 9 74,3,537 ) ( 1 . B orchardt,H.J.; Daniels,F.J.,Am. Chem.Soc. 1956,79,41 2 . . Swarin, S.J.;Wims,A.M.,Anal. Calorim., 1 976,4,155 345678 ) ( Keenan,M.R.,J.Appl. Polym. Sci., 1987,33,1725 ) ( S ourour, S.; Kamal, M.F,Thermochim.Acta, 1976,14,41 ) ( P atel, R .D.; P atel, R.G.; P atel, V.S.; Pearce, E .M., J . Appl. Polym. Sci.,1987,34,2583 ) ( 9. P rime, R .B. in Thermal C haracterization o f P olymeric Materials; Turi , E.A. Ed.; Academic Press; New York, 1981; Chapter 5 ) ( 10. Prime,R.B.;Sacher, E.,Polymer 1972,12,455 ) ( 11. Abolafia, O.R., Soc. Plast. Eng.[Tech.Pap.], 1969,15,610 ) ( 12. Taylor, L.J.;Watson, S.W.,Anal. Chem. , 1970,42,297 ) ( 13. Schneider, N.S.; Sprouse,J.F;Hagnauer, G.L.; Gillham,J.K., Polym.Eng.Sci., 1979,19,304 ) ( 14. Kaelble, D.H.; C irlin, E.H., J. Polym.Sci., Part C, 197 1 ,35 ) ( 15. M ass,T.A.M.M.,Polym.Eng. Sci.1978,18,29 ) ( 16. Duswalt,A.A.,Thermochim.Acta, 1974,8,57 ) ( 17. Widmann G. in Thermal An a lysis; B u zas I. Ed.; H eyden: London, 1975,3,359 ) ( 18. Widmann, G., Th erm ochi m .Ac ta,1975,331 ) ( 19. Waters, D.N.;Paddy, J.L.,Ana l.Che m., 1988,60,53 ) A Differential Scanning Calorimetry (DSC) is used to measure heat flow into or out of a sample as it is exposed to a controlled thermal profile. DSC provides both qualitative and quantitative information about material transitions such as the glass transition, crystallization, curing, melting, and decomposition. For some of these transitions, DSC can provide not only the temperature at which the transition (reaction) occurs and how much total heat is involved, but DSC can also provide valuable information about the rate (kinetics) of reaction. Furthermore, with the advent of easy-touse computer based data analysis programs, the ability to obtain such kinetic information has become more practical.
确定

还剩4页未读,是否继续阅读?

产品配置单

TA仪器为您提供《信息材料中材料的玻璃化转变、结晶、固化、熔融和分解检测方案(差示扫描量热)》,该方案主要用于其他中材料的玻璃化转变、结晶、固化、熔融和分解检测,参考标准--,《信息材料中材料的玻璃化转变、结晶、固化、熔融和分解检测方案(差示扫描量热)》用到的仪器有TA仪器 Discovery差示扫描量热仪
推荐专场
相关方案
更多
该厂商其他方案
更多