


采用下落法量热计测量了硅材料在700~1820K温度范围内的热焓,采用氮化硼做为试样坩埚。通过热焓随温度的变化曲线测量硅材料的熔解时焓值和熔融点分别为48.31±0.18kJ/mol和1687±5K。分别采用Shomate函数推导固态区间和最小二乘法推导液态区间的热焓和热容方程,并与文献值进行了比较。
方案详情

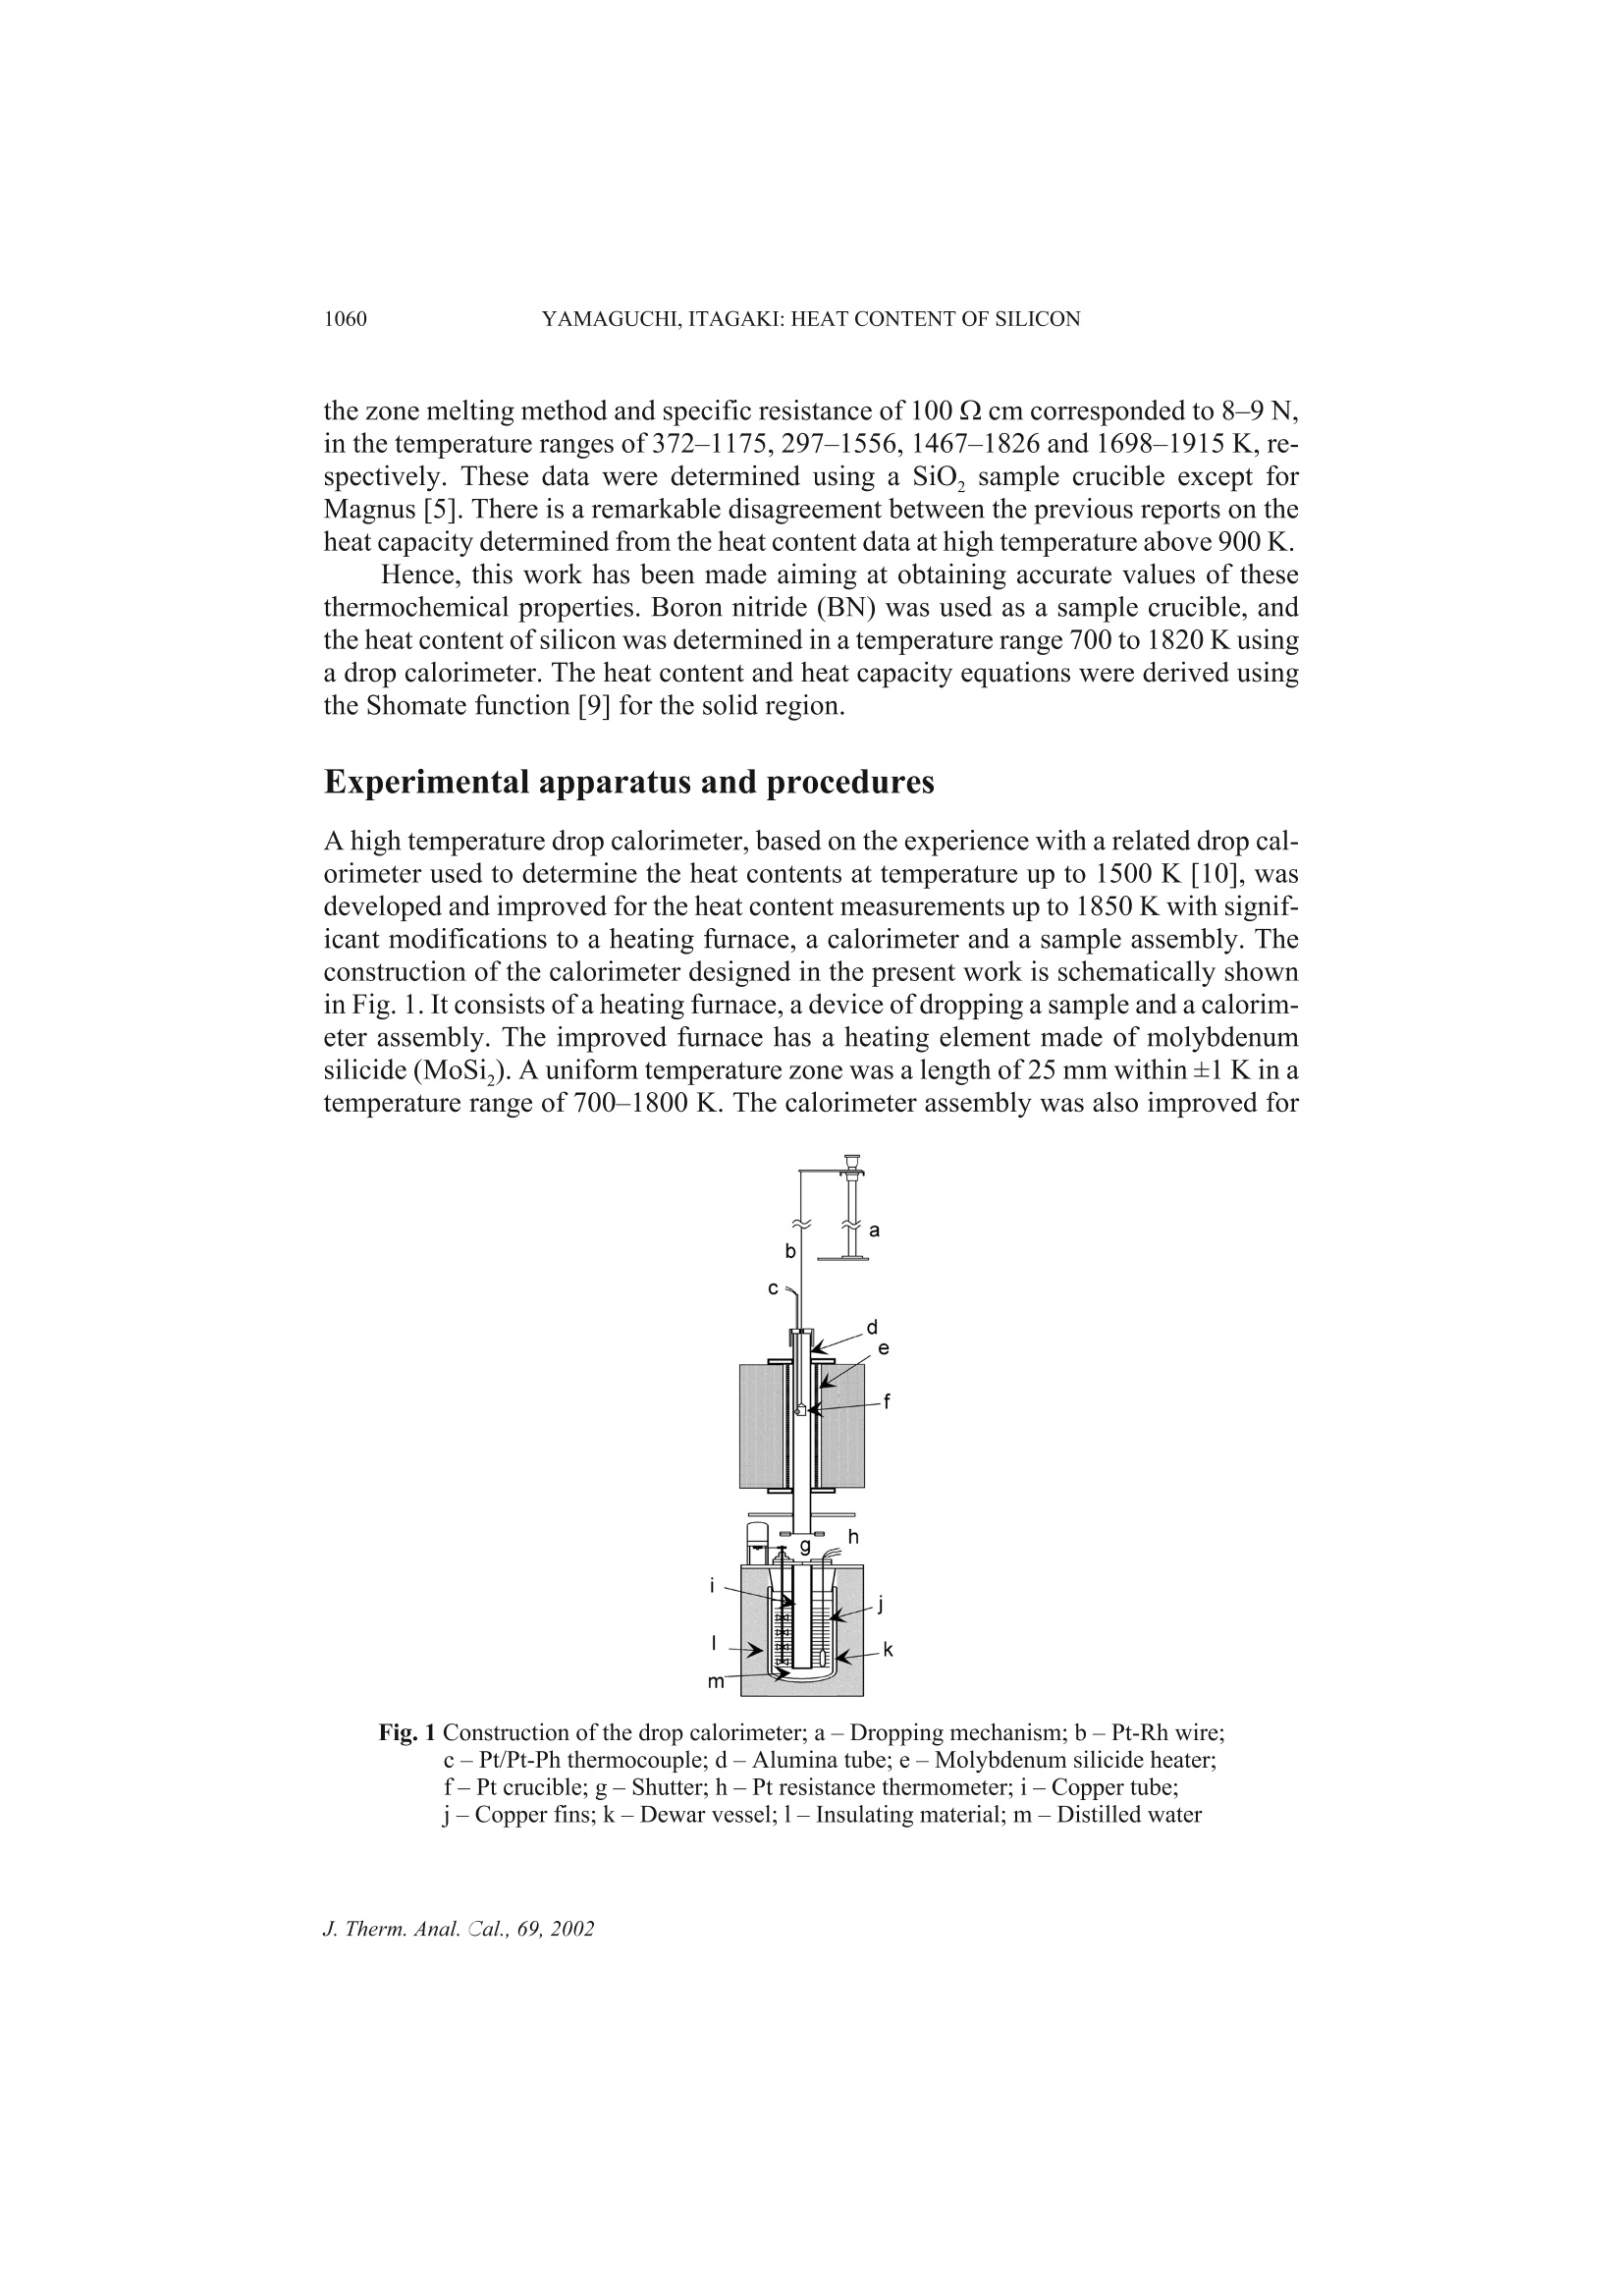
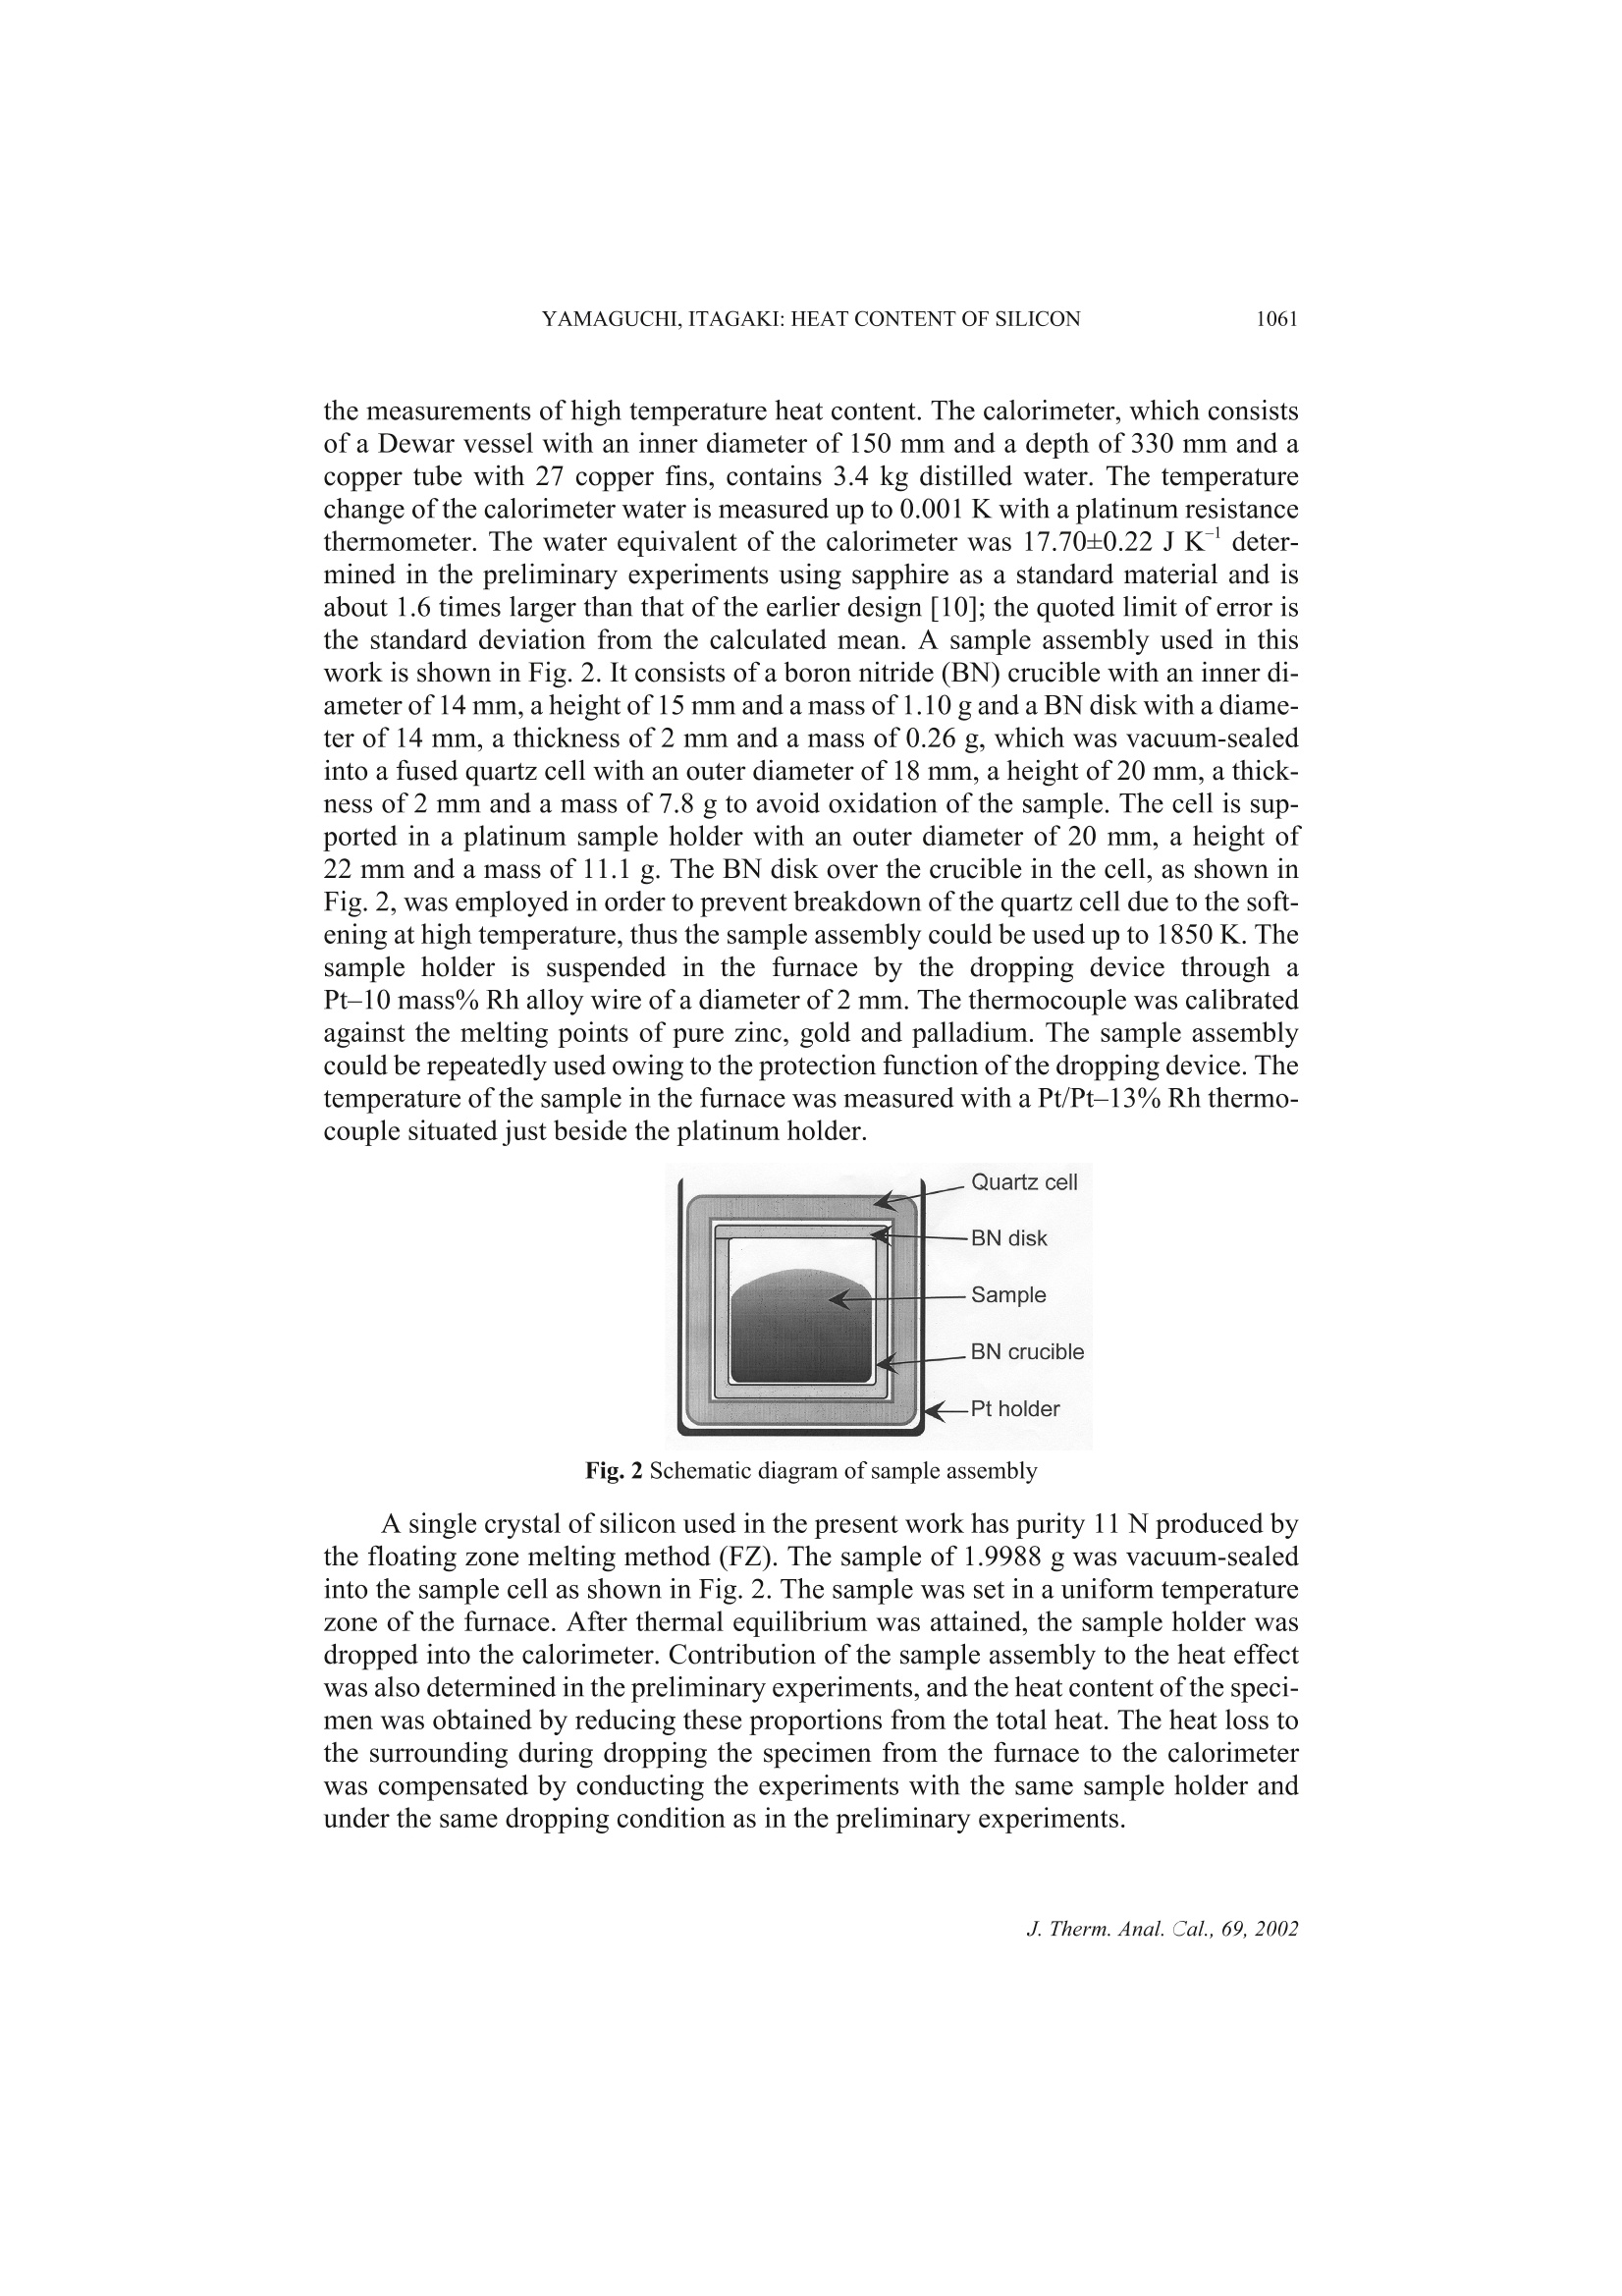
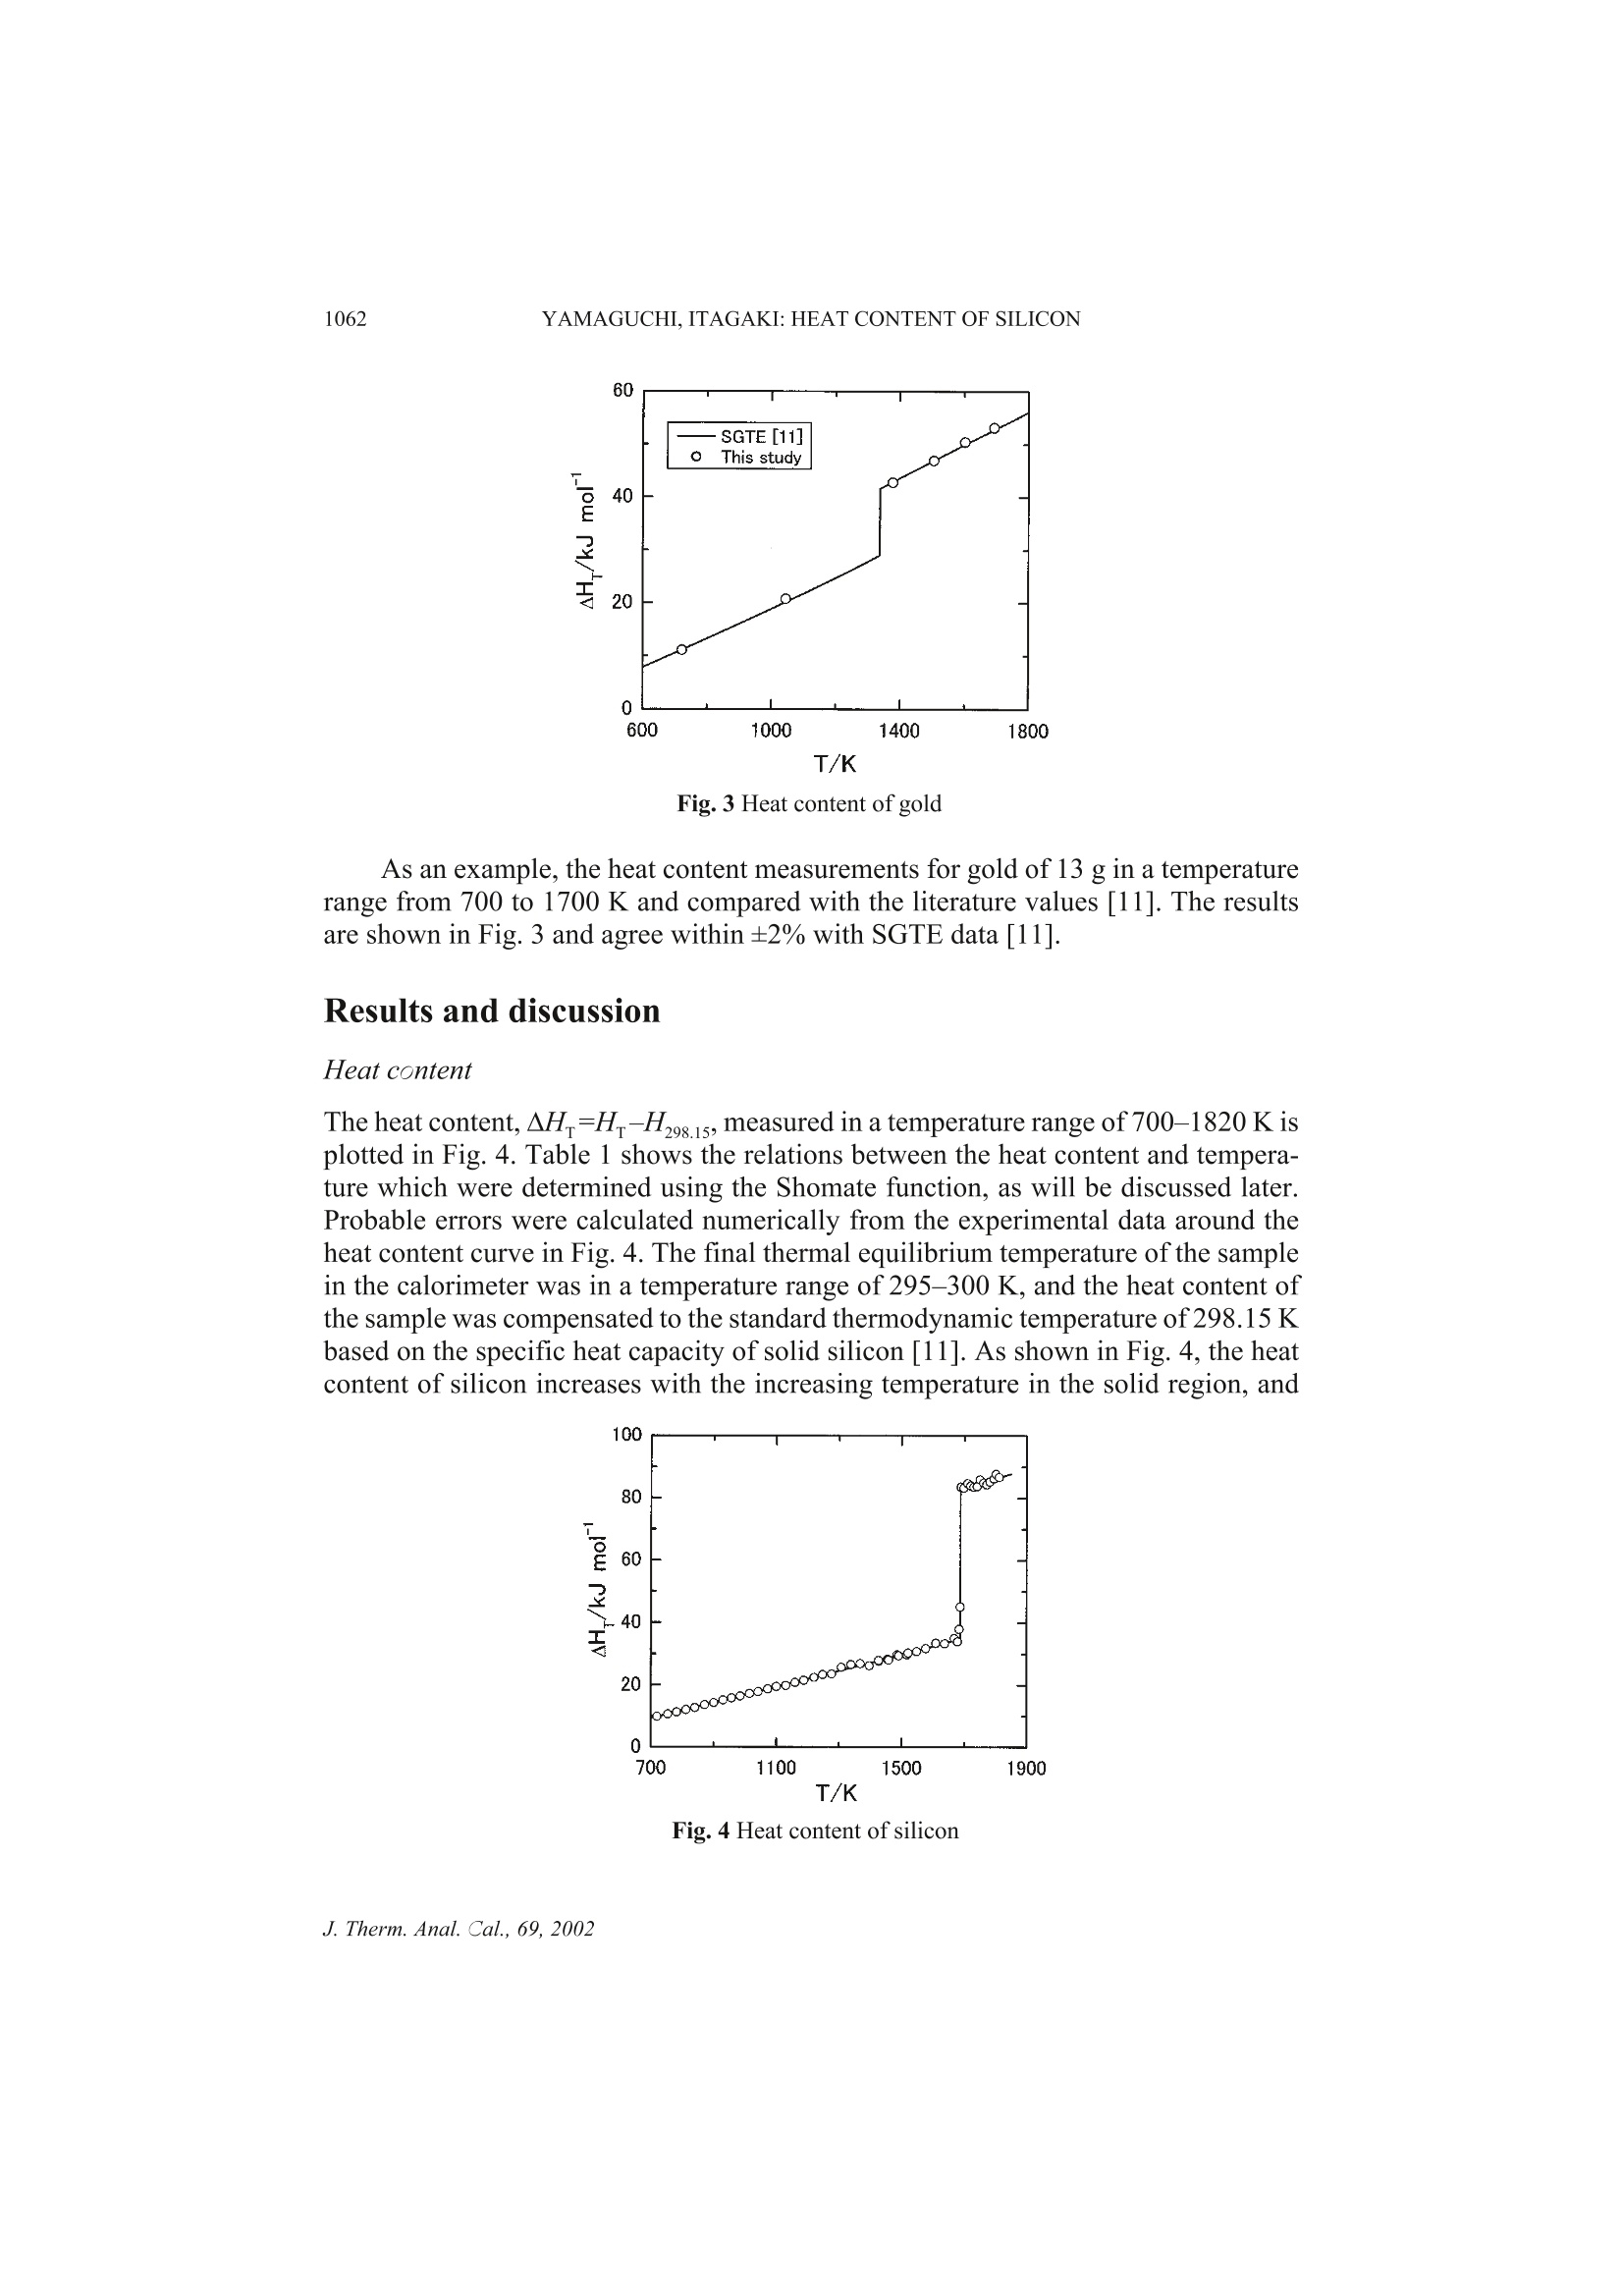
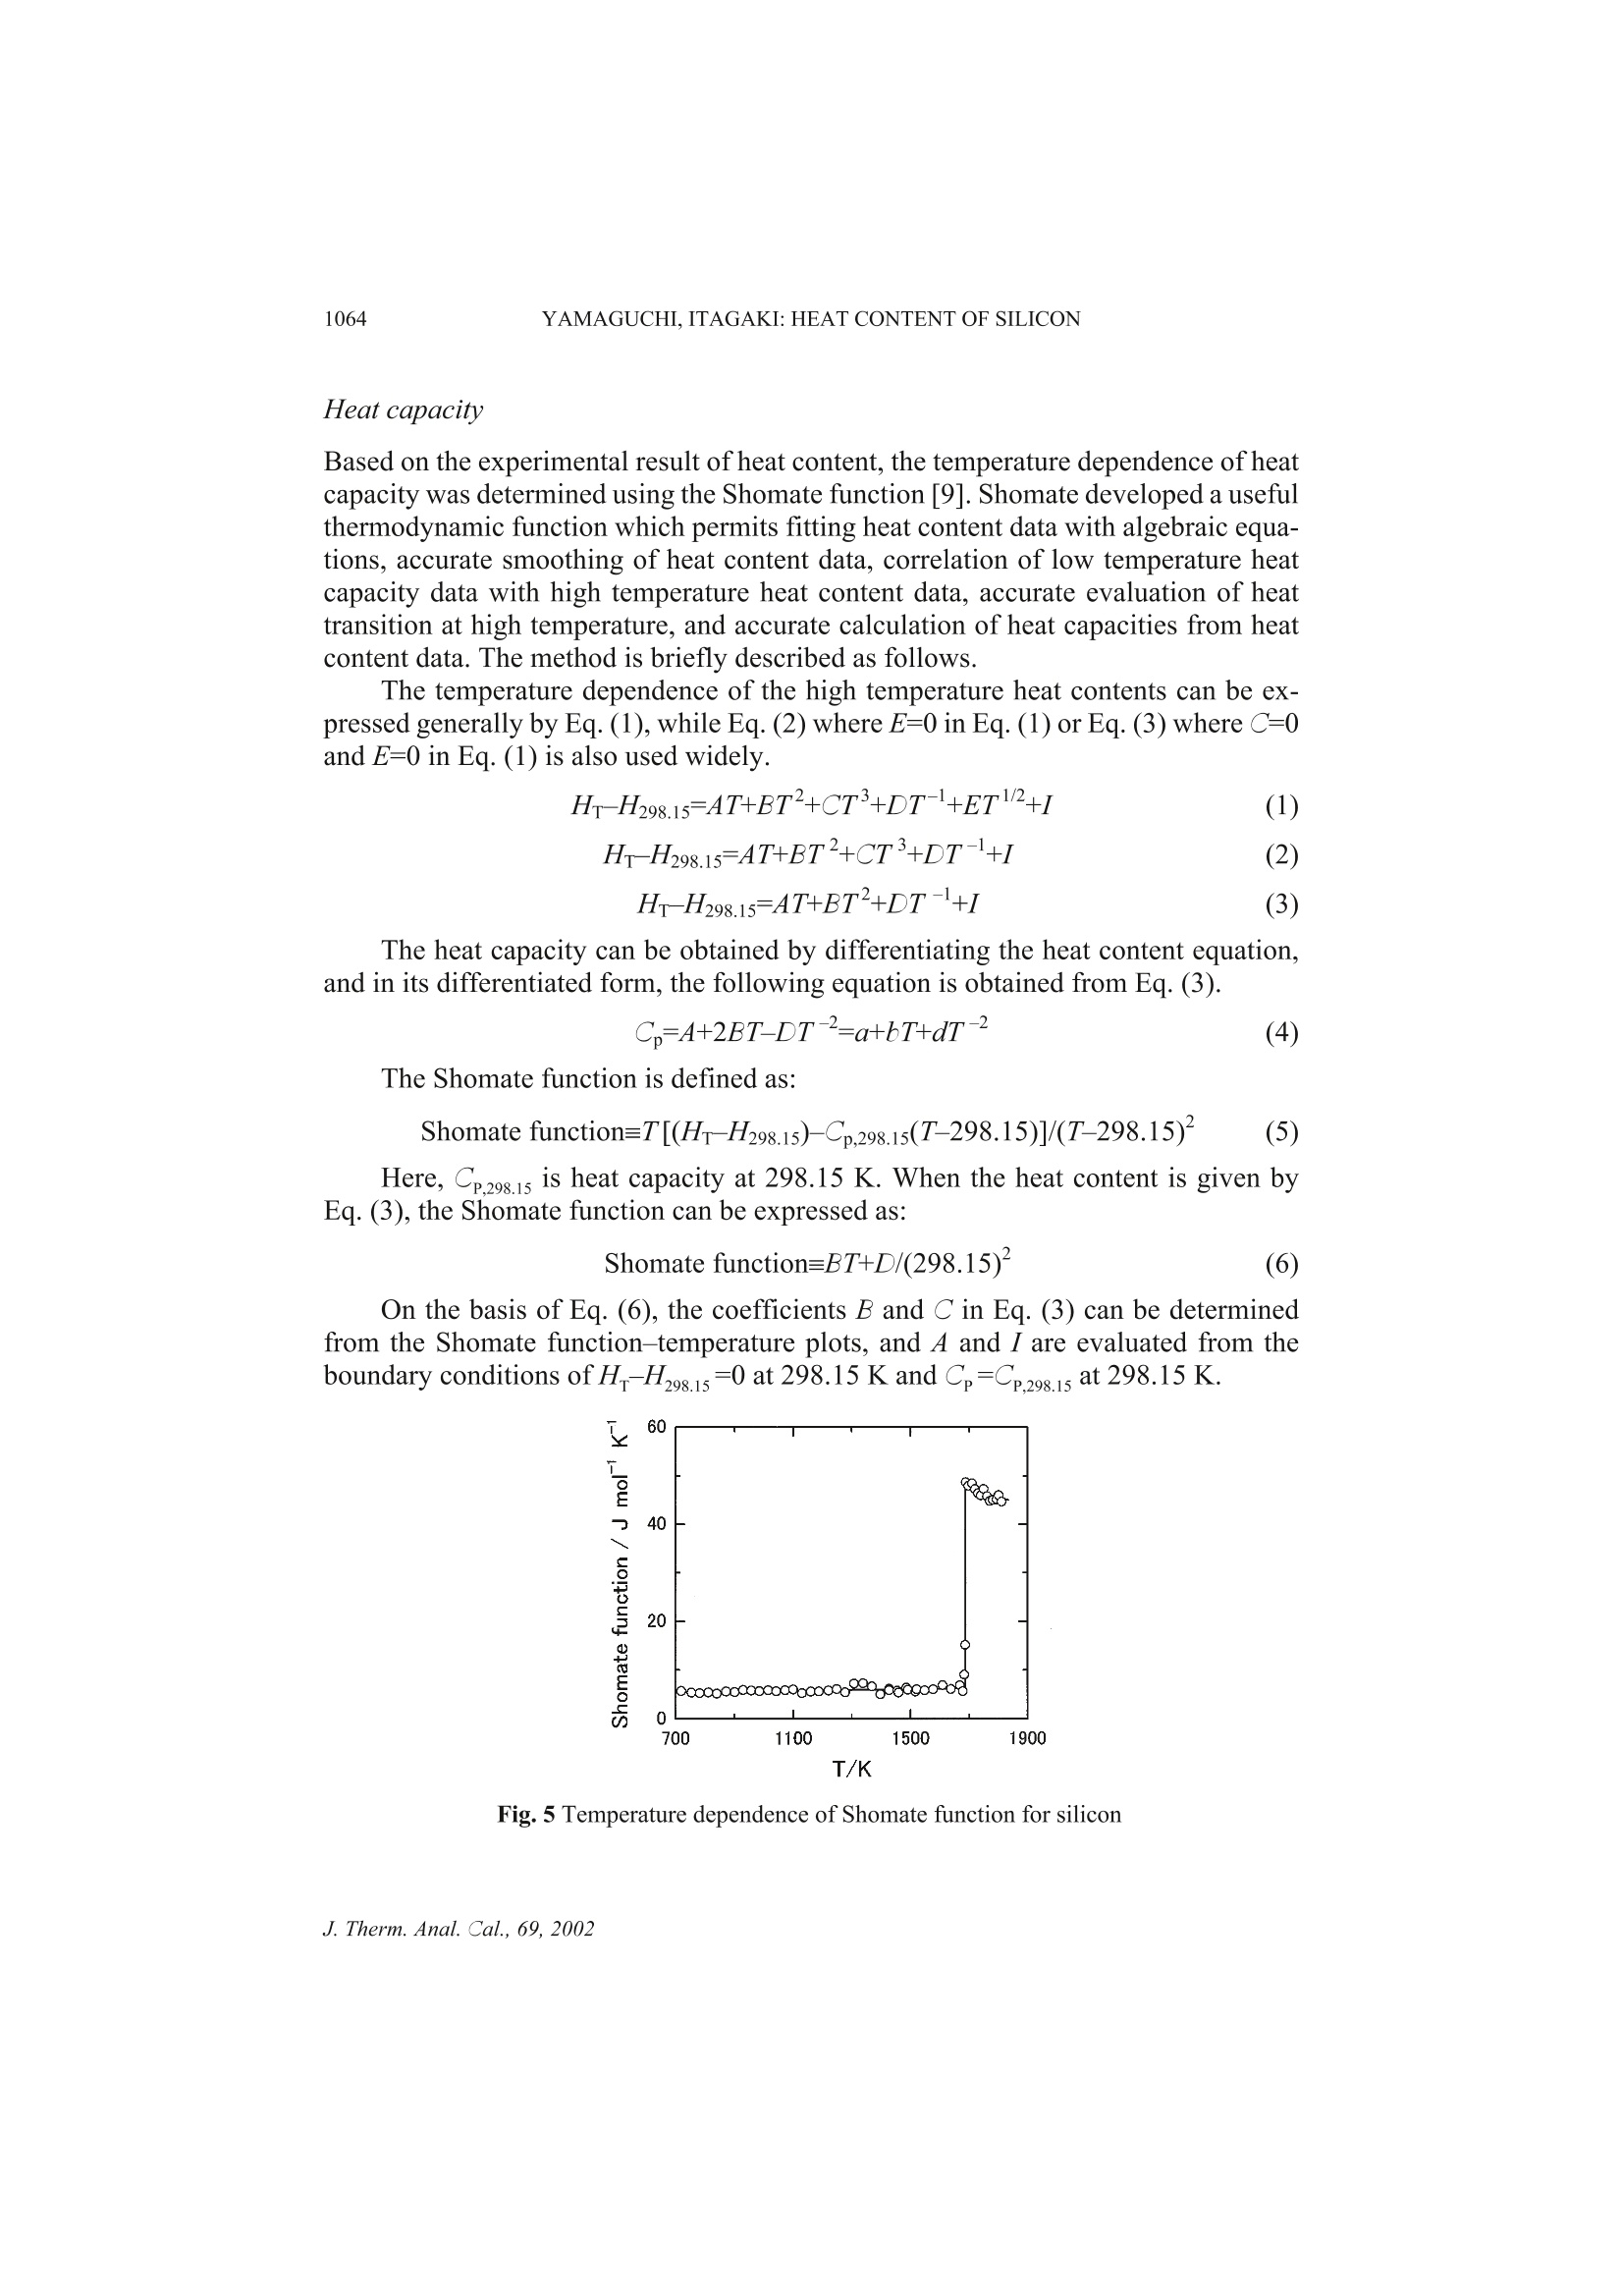
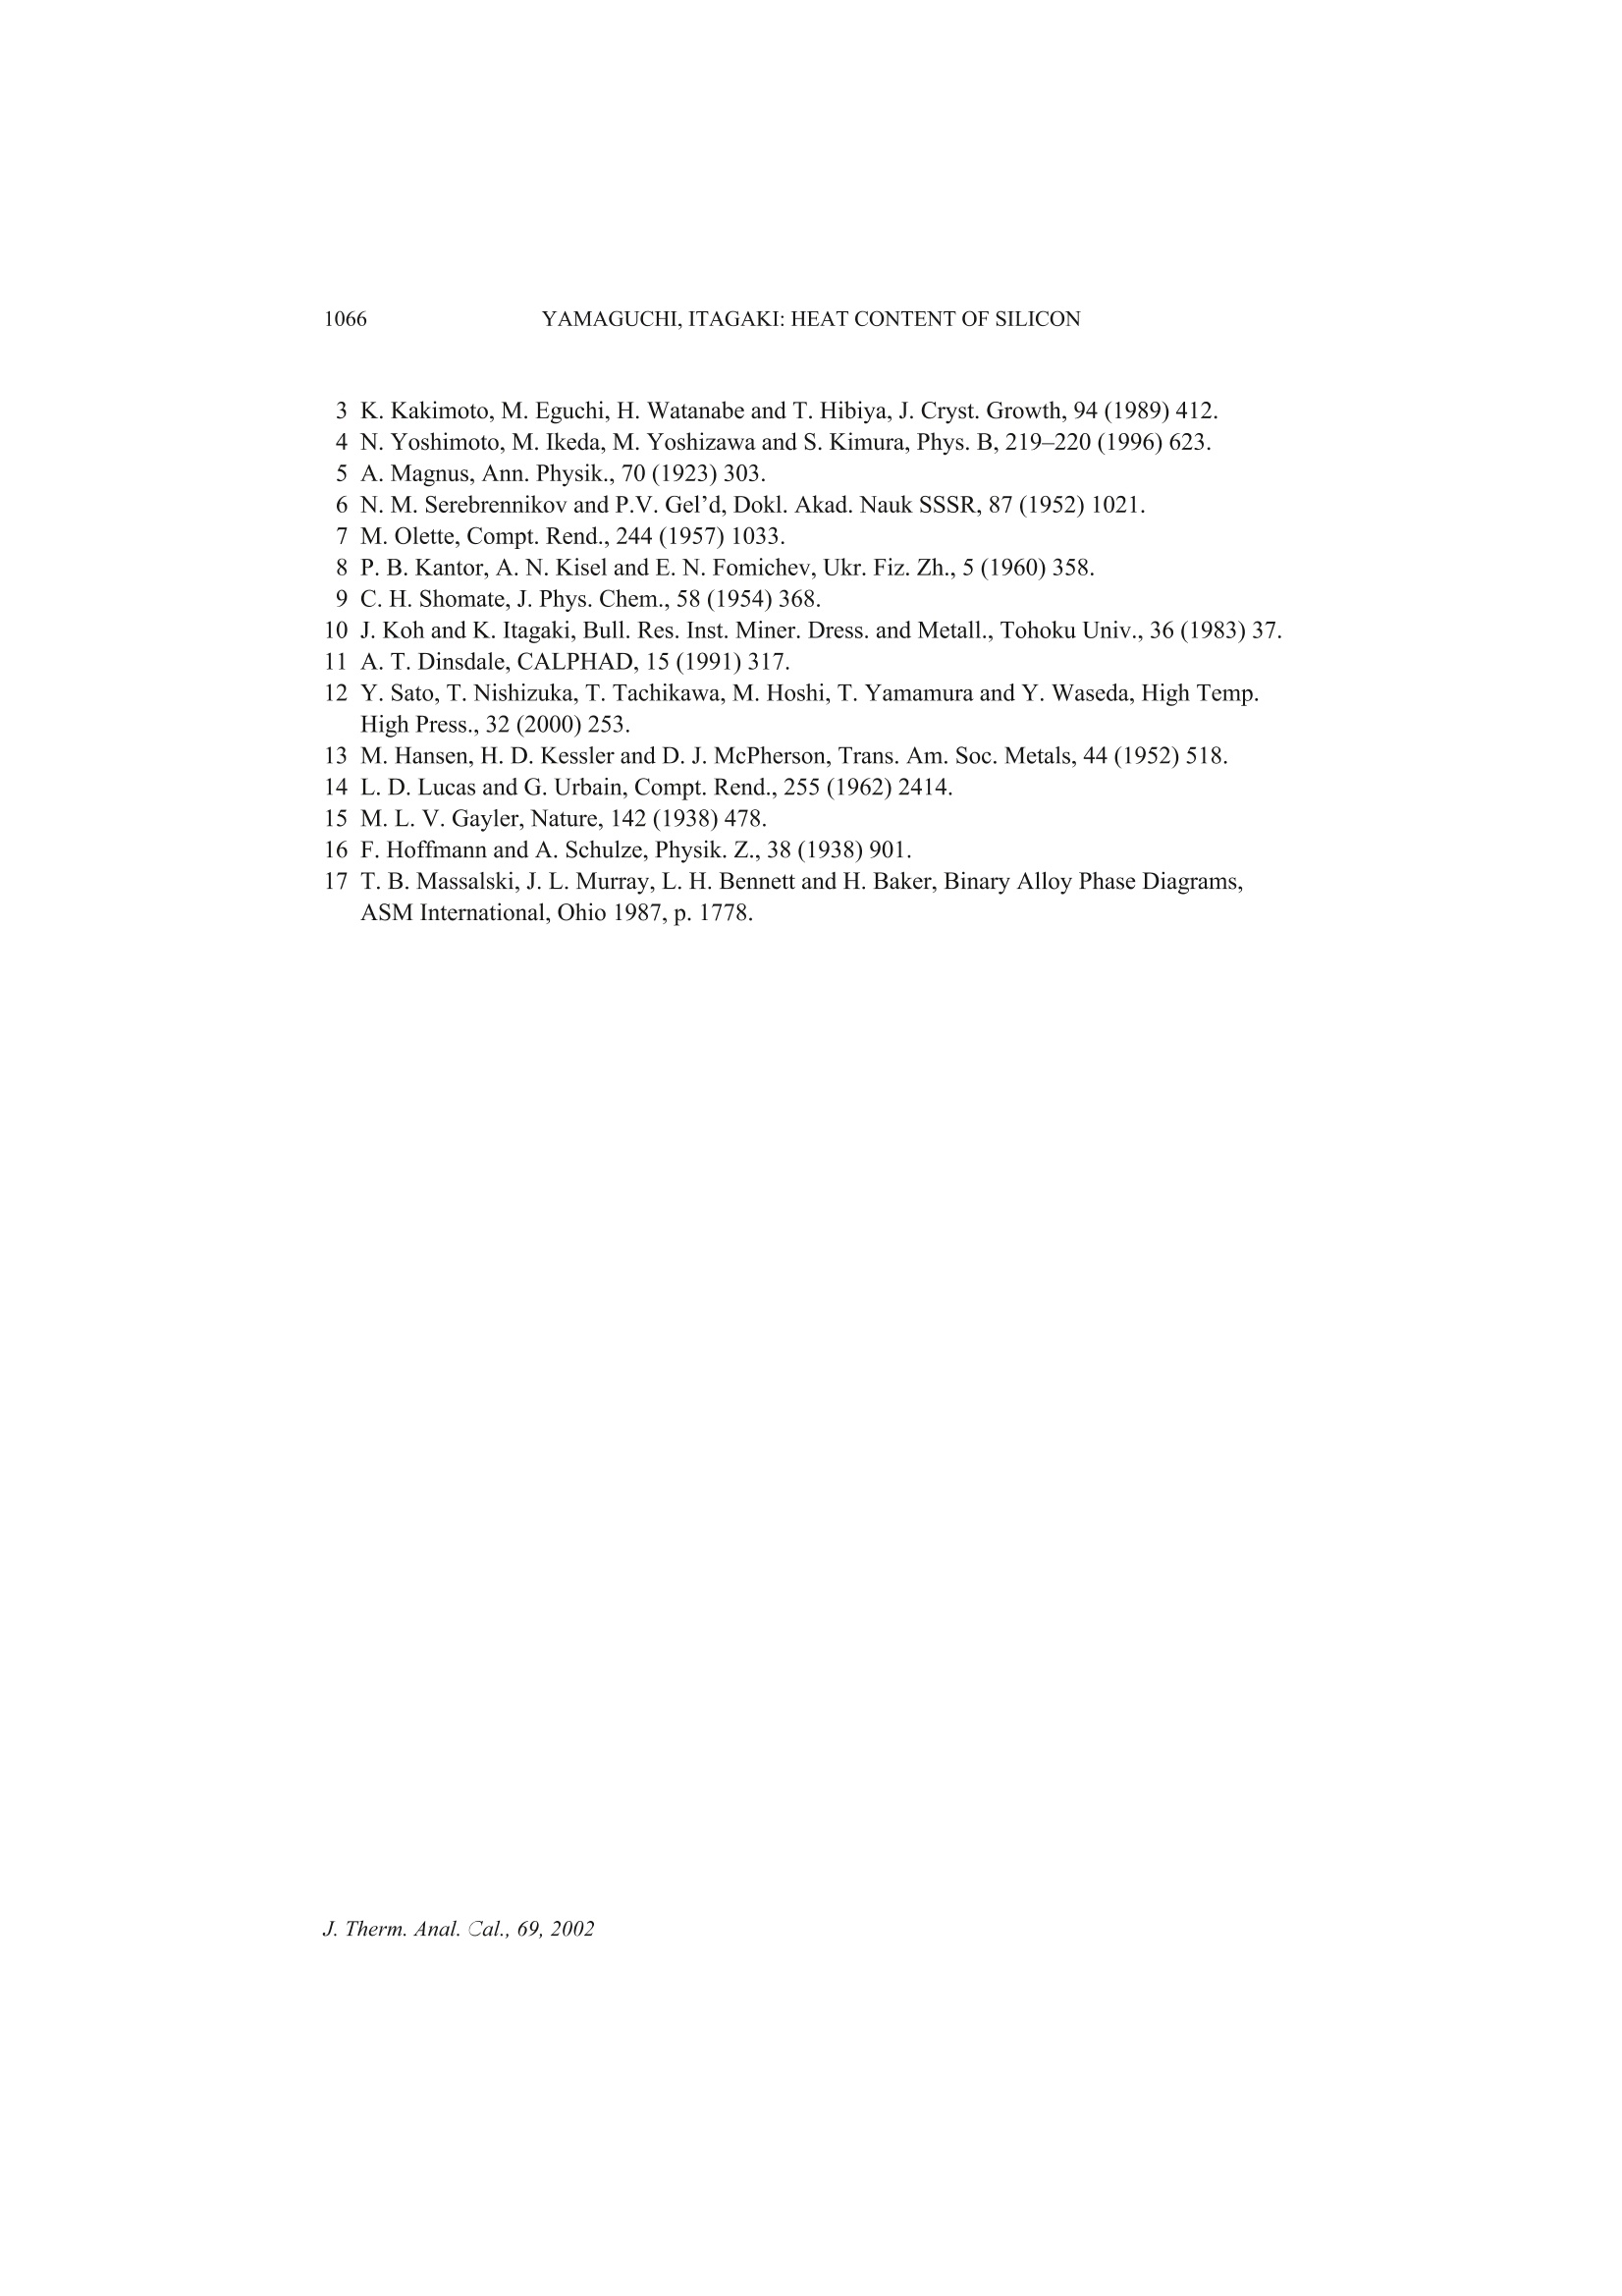
Journal of Thermal Analysis and Calorimetry, Vol. 69 (2002) 1059-1066 1060YAMAGUCHI,ITAGAKI: HEAT CONTENT OF SILICON MEASUREMENT OFHIGH TEMPERATURE HEATCONTENT OF SILICON BY DROP CALORIMETRY K. Yamaguchi *and K. Itagaki Department of Materials Science and Technology, Faculty of Engineering, Iwate University,Ueda, Morioka, 020-8551, JapanInstitute of Multidisciplinary Research for Advanced Materials, Tohoku University, Katahira,Aoba-Ku, Sendai, 980-8577, Japan Abstract Heat content of silicon has been measured in a temperature range of 700-1820 K using a drop calo-rimeter. Boron nitride was used as a sample crucible.The enthalpy of fusion and the melting point ofsilicon determined from the heat content-temperature plots are 48.31±0.18 kJ moland 1687±5 K,respectively. The heat content and heat capacity equations were derived using the Shomate functionfor the solid region and the least square method for the liquid region, respectively, and comparedwith the literature values. Keywords: drop calorimeter, enthalpy of fusion, heat capacity, heat content, high temperature,melting point, silicon Introduction Single crystals of silicon are important materials used in electronic device applica-tions. The solid and liquid phases coexist at the quasi-equilibrium state in conven-tional processes to fabricate the single crystal of silicon. Therefore, knowledge of thethermochemical data such as heat capacity, melting point and enthalpy of fusion isimportant for the analysis of fabricating processes. Furthermore, production of a sin-gle crystal of silicon having the higher quality and a larger diameter is required for theCzochralski (Cz) technique of single crystal growth. In order to achieve this demand,mathematical simulations of the transport phenomena prevailing in the Cz singlecrystal growth have been carried out based on the thermochemical data. On the otherhand, anomalous behavior for liquid silicon has been reported by viscosity [1, 2],density [3] and sound velocity [4] measurements. A careful investigation ofthermochemical properties is thought to be of interest. Nevertheless, only few dataare reported on the heat content measurements of silicon. By means of drop calorime-try, Magnus [5], Serebrennikov and Gel'd [6], Olette [7] and Kantor et al. [8] mea-sured the heat content of silicon, that had 99.2, 99.3, 99.99 mass% purity prepared by ( Author for correspondence: E-mail: b enko@iwate-u.ac.jp ) ( 1418- 2 874/2002/$ 5.00 ) the zone melting method and specific resistance of 100 Q cm corresponded to 8-9 N,in the temperature ranges of 372-1175,297-1556,1467-1826 and 1698-1915 K,re-spectively. These data were determined using a Sio, sample crucible except forMagnus [5]. There is a remarkable disagreement between the previous reports on theheat capacity determined from the heat content data at high temperature above 900 K. Hence, this work has been made aiming at obtaining accurate values of thesethermochemical properties. Boron nitride (BN) was used as a sample crucible, andthe heat content of silicon was determined in a temperature range 700 to 1820 K usinga drop calorimeter. The heat content and heat capacity equations were derived usingthe Shomate function [9] for the solid region. Experimental apparatus and procedures A high temperature drop calorimeter, based on the experience with a related drop cal-orimeter used to determine the heat contents at temperature up to 1500 K [10], wasdeveloped and improved for the heat content measurements up to 1850 K with signif-icant modifications to a heating furnace, a calorimeter and a sample assembly. Theconstruction of the calorimeter designed in the present work is schematically shownin Fig. 1. It consists of a heating furnace, a device of dropping a sample and a calorim-eter assembly. The improved furnace has a heating element made of molybdenumsilicide (MoSi,). A uniform temperature zone was a length of 25 mm within ±1 K in atemperature range of 700-1800 K. The calorimeter assembly was also improved for Fig. 1 Construction of the drop calorimeter; a- Dropping mechanism; b-Pt-Rh wire; c-Pt/Pt-Ph thermocouple;d- Alumina tube; e-Molybdenum silicide heater; f-Pt crucible; g-Shutter; h - Pt resistance thermometer; i-Copper tube; j-Copper fins; k-Dewar vessel;1-Insulating material; m -Distilled water the measurements of high temperature heat content. The calorimeter, which consistsof a Dewar vessel with an inner diameter of 150 mm and a depth of 330 mm and acopper tube with 27 copper fins, contains 3.4 kg distilled water. The temperaturechange of the calorimeter water is measured up to 0.001 K with a platinum resistancethermometer. The water equivalent of the calorimeter was 17.70±0.22 JKdeter-mined in the preliminary experiments using sapphire as a standard material and isabout 1.6 times larger than that of the earlier design [10]; the quoted limit of error isthe standard deviation from the calculated mean. A sample assembly used in thiswork is shown in Fig. 2. It consists of a boron nitride (BN) crucible with an inner di-ameter of 14 mm, a height of 15 mm and a mass of 1.10 g and a BN disk with a diame-ter of 14 mm, a thickness of 2 mm and a mass of 0.26 g, which was vacuum-sealedinto a fused quartz cell with an outer diameter of 18 mm, a height of 20 mm, a thick-ness of 2 mm and a mass of 7.8 g to avoid oxidation of the sample. The cell is sup-ported in a platinum sample holder with an outer diameter of 20 mm, a height of22 mm and a mass of 11.1 g. The BN disk over the crucible in the cell, as shown inFig. 2, was employed in order to prevent breakdown of the quartz cell due to the soft-ening at high temperature, thus the sample assembly could be used up to 1850 K. Thesample holder is suspended in the furnace by the dropping device through aPt-10 mass% Rh alloy wire of a diameter of 2 mm. The thermocouple was calibratedagainst the melting points of pure zinc, gold and palladium. The sample assemblycould be repeatedly used owing to the protection function of the dropping device. Thetemperature ofthe sample in the furnace was measured with a Pt/Pt-13% Rh thermo-couple situated just beside the platinum holder. Fig. 2 Schematic diagram of sample assembly A single crystal of silicon used in the present work has purity 11 N produced bythe floating zone melting method (FZ). The sample of 1.9988 g was vacuum-sealedinto the sample cell as shown in Fig. 2. The sample was set in a uniform temperaturezone of the furnace. After thermal equilibrium was attained, the sample holder wasdropped into the calorimeter. Contribution of the sample assembly to the heat effectwas also determined in the preliminary experiments, and the heat content of the speci-men was obtained by reducing these proportions from the total heat. The heat loss tothe surrounding during dropping the specimen from the furnace to the calorimeterwas compensated by conducting the experiments with the same sample holder andunder the same dropping condition as in the preliminary experiments. Fig. 3 Heat content of gold As an example, the heat content measurements for gold of 13 g in a temperaturerange from 700 to 1700 K and compared with the literature values [11]. The resultsare shown in Fig. 3 and agree within ±2% with SGTE data [11]. Results and discussion Heat content The heat content,AH=H-H298.15, measured in a temperature range of 700-1820 K isplotted in Fig. 4. Table 1 shows the relations between the heat content and tempera-ture which were determined using the Shomate function, as will be discussed later.Probable errors were calculated numerically from the experimental data around theheat content curve in Fig. 4. The final thermal equilibrium temperature of the samplein the calorimeter was in a temperature range of 295-300 K, and the heat content ofthe sample was compensated to the standard thermodynamic temperature of 298.15 Kbased on the specific heat capacity of solid silicon [11]. As shown in Fig. 4, the heatcontent of silicon increases with the increasing temperature in the solid region, and Fig. 4 Heat content of silicon represents deflection point at a melting point temperature of 1687 K while the heatcontent in the liquid region again increases linearly within the limit of experimentalaccuracy. If the anomalous behavior attributed to the structure changes exists in theliquid, the measured heat content in the liquid region would be curve due to thechange in the heat capacity. Therefore, the anomalies seem unlikely as far as the tem-perature dependence of the heat content is concerned. Sato et al. also reported noanomaly in the liquid silicon by a viscosity measurement in recent years [12]. Table 1 Heat content of silicon AHT=AT+BT2+CT +I Substance AH-/J mol Temp. range/K A B·10 C·10 Probable error Si(s) 24.5 0.75 4.37 -0.89 ±40 700-1687 Si(l) 28.7 3.47 ±140 1687-1820 As listed in Table 2, the enthalpy of fusion and the melting point of silicon are48.31±0.18 kJ mol and 1687±5 K, respectively. Within the limit of experimental ac-curacy, the melting point of silicon agrees well with the literature values[7, 8, 11, 13-17]. The enthalpy of fusion determined in this study is about 2 kJ mollower than the data reported by Olette [7] and Kantor et al.[8]. The heat content ofthe solid silicon agrees with the previous data [5, 6] at low temperature, but divergesat higher temperature, being about 1 kJ mol lower than the reported values. For theliquid region, the heat content in the present work is about3 kJ mol lower than thedata of Olette [7] and Kantor et al.[8]. At high temperature, the result determined inthe present work is lower than the previous data, which may be due to the differencein the purity of samples and the crucible materials. Table 2 Melting point, enthalpy and entropy of fusion for silicon Melting point/K Enthalpy of fusion/kJ mol1一1 Entropy of fusion/ J molK References 1685±2 50.61±0.42 Olette [7] 1690±4 50.00±0.75 Kantor et al. [8] 1683±5 Hansen et al. [131 1683±1 Lucas and Urbain [14] 1688±2 Gayler [15] 1683±2 Hoffmann and Schulze [16] 1687 Massalski et al. [17] 1687 50.2 29.8 SGTE [11] 1687±5 48.31±0.18 28.6±0.2 this study Heat capacity Based on the experimental result of heat content, the temperature dependence of heatcapacity was determined using the Shomate function [9]. Shomate developed a usefulthermodynamic function which permits fitting heat content data with algebraic equa-tions, accurate smoothing of heat content data, correlation of low temperature heatcapacity data with high temperature heat content data, accurate evaluation of heattransition at high temperature, and accurate calculation of heat capacities from heatcontent data. The method is briefly described as follows. The temperature dependence of the high temperature heat contents can be ex-pressed generally by Eq. (1),while Eq. (2) where E=0 in Eq. (1) or Eq. (3) whereC=0and E=0 in Eq. (1) is also used widely. The heat capacity can be obtained by differentiating the heat content equation,and in its differentiated form, the following equation is obtained from Eq. (3). The Shomate function is defined as: Here, CP,298.15 is heat capacity at 298.15 K. When the heat content is given byEq. (3), the Shomate function can be expressed as: On the basis of Eq. (6), the coefficients B and C in Eq. (3) can be determinedfrom the Shomate function-temperature plots, and A and I are evaluated from theboundary conditions ofH-H298.15=0 at 298.15 K and Cp=CP,298.15 at 298.15 K. Fig. 5 Temperature dependence of Shomate function for silicon The Shomate function of silicon calculated using the heat content value and the lit-erature data of C2981s=20.00 J molK-[11] is shown in Fig. 5. Above 700 K and belowmelting point, the Shomate function exhibits a linear equation against temperature asgiven below: Table 3 Heat capacity of silicon Substance C,/J mol K Temp. range/K B·10' C·10 Si(s) 24.5 1.5 -4.37 700-1687 Si(l) 28.7 1687-1820 Fig. 6 Heat capacity of silicon Hence, the heat content and heat capacity of the solid in a high temperature regioncan be expressed by Eqs (3) and (4). The heat capacity in the solid determined by theShomate function and that in the liquid calculated by the least square method are listed inTable 3, and the heat capacity is shown in Fig. 6 with the literature data. Above 1100 Kand below the melting point, the heat capacity of solid silicon is about 1-2.5 Jmol Klower than the previous data [5-8]. The heat capacity for the liquid region is about1 J mol K lower and 3 J mol K higher than the literature values of Olette [7] andKantor et al.[8], respectively. References 1 V.M.Glazov,S. N. Chizhevskaya and N. N. Glagoleva, Liquid Semiconductors, PlenumPress, New York 1969, p. 55. 2 H. Sasaki, K. Tokizaki, K. Terashima and S. Kimura, Jpn. J. Appl. Phys., 33 (1994)3803. ( 3 K . K akimoto, M. E g uchi, H . Watanabe and T. Hibiya, J. C ryst. Growth, 9 4 (1989) 412. ) 4 N. Yoshimoto, M. Ikeda, M. Yoshizawa and S. Kimura, Phys. B, 219-220 (1996) 623.5 A. Magnus, Ann. Physik., 70 (1923) 303. 6 N.M. Serebrennikov and P.V. Gel’d, Dokl. Akad. Nauk SSSR, 87 (1952)1021.7 M. Olette, Compt. Rend., 244 (1957) 1033. 8 P. B.Kantor, A. N. Kisel and E. N. Fomichev, Ukr. Fiz. Zh., 5 (1960) 358.9 C. H. Shomate,J. Phys. Chem., 58 (1954)368. 10 J. Koh and K. Itagaki, Bull. Res. Inst. Miner. Dress. and Metall., Tohoku Univ., 36 (1983) 37. 11 A. T.Dinsdale, CALPHAD, 15 (1991) 317. 12 Y. Sato, T. Nishizuka, T. Tachikawa, M. Hoshi, T. Yamamura and Y. Waseda, High Temp.High Press., 32 (2000)253. 13 M. Hansen, H. D. Kessler and D. J. McPherson, Trans. Am. Soc. Metals, 44 (1952)518. 14 L. D. Lucas and G. Urbain, Compt. Rend., 255 (1962)2414. 15 M.L. V. Gayler, Nature, 142 (1938) 478. 16 F. Hoffmann and A. Schulze, Physik. Z., 38 (1938)901. 17 T.B. Massalski, J.L. Murray, L. H. Bennett and H. Baker, Binary Alloy Phase Diagrams,ASM International, Ohio 1987, p. 1778. Akademiai Kiado, BudapestC Akademiai Kiado, BudapestKluwer Academic Publishers, Dordrecht J. Therm. Anal. Cal.,
确定


还剩6页未读,是否继续阅读?

产品配置单
上海依阳实业有限公司为您提供《硅,半导体,固体材料中热容,热焓,比热容检测方案 》,该方案主要用于其他中热容,热焓,比热容检测,参考标准--,《硅,半导体,固体材料中热容,热焓,比热容检测方案 》用到的仪器有下落法中温量热仪/比热容测定仪
推荐专场

相关方案
更多