


方案详情
文
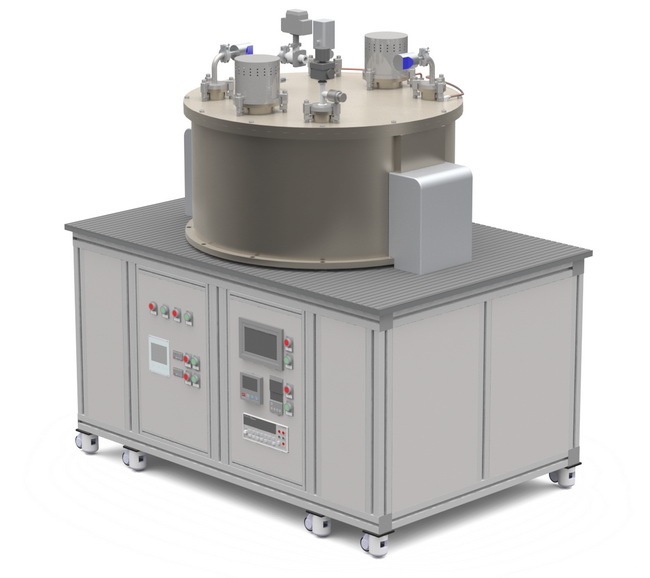
本文详细介绍了NASA在高温隔热材料热流计法测试技术方面的研究工作,介绍了用于模拟典型空间飞行器再入气动加热过程中高温隔热材料在大温度梯度下的有效导热系数热流计法测试装置的设计和一些典型材料的测试。在测试中,被测试样的冷面保持在室温左右,试样热面则最高被加热到将近1000℃,试样所处环境气压变化范围为1E-04托~760托,所有测试都是在干燥氮气环境下进行。研制完成后的测试设备分别对三种不同密度的高温隔热材料进行了不同热面温度和不同气压下的测试。
方案详情

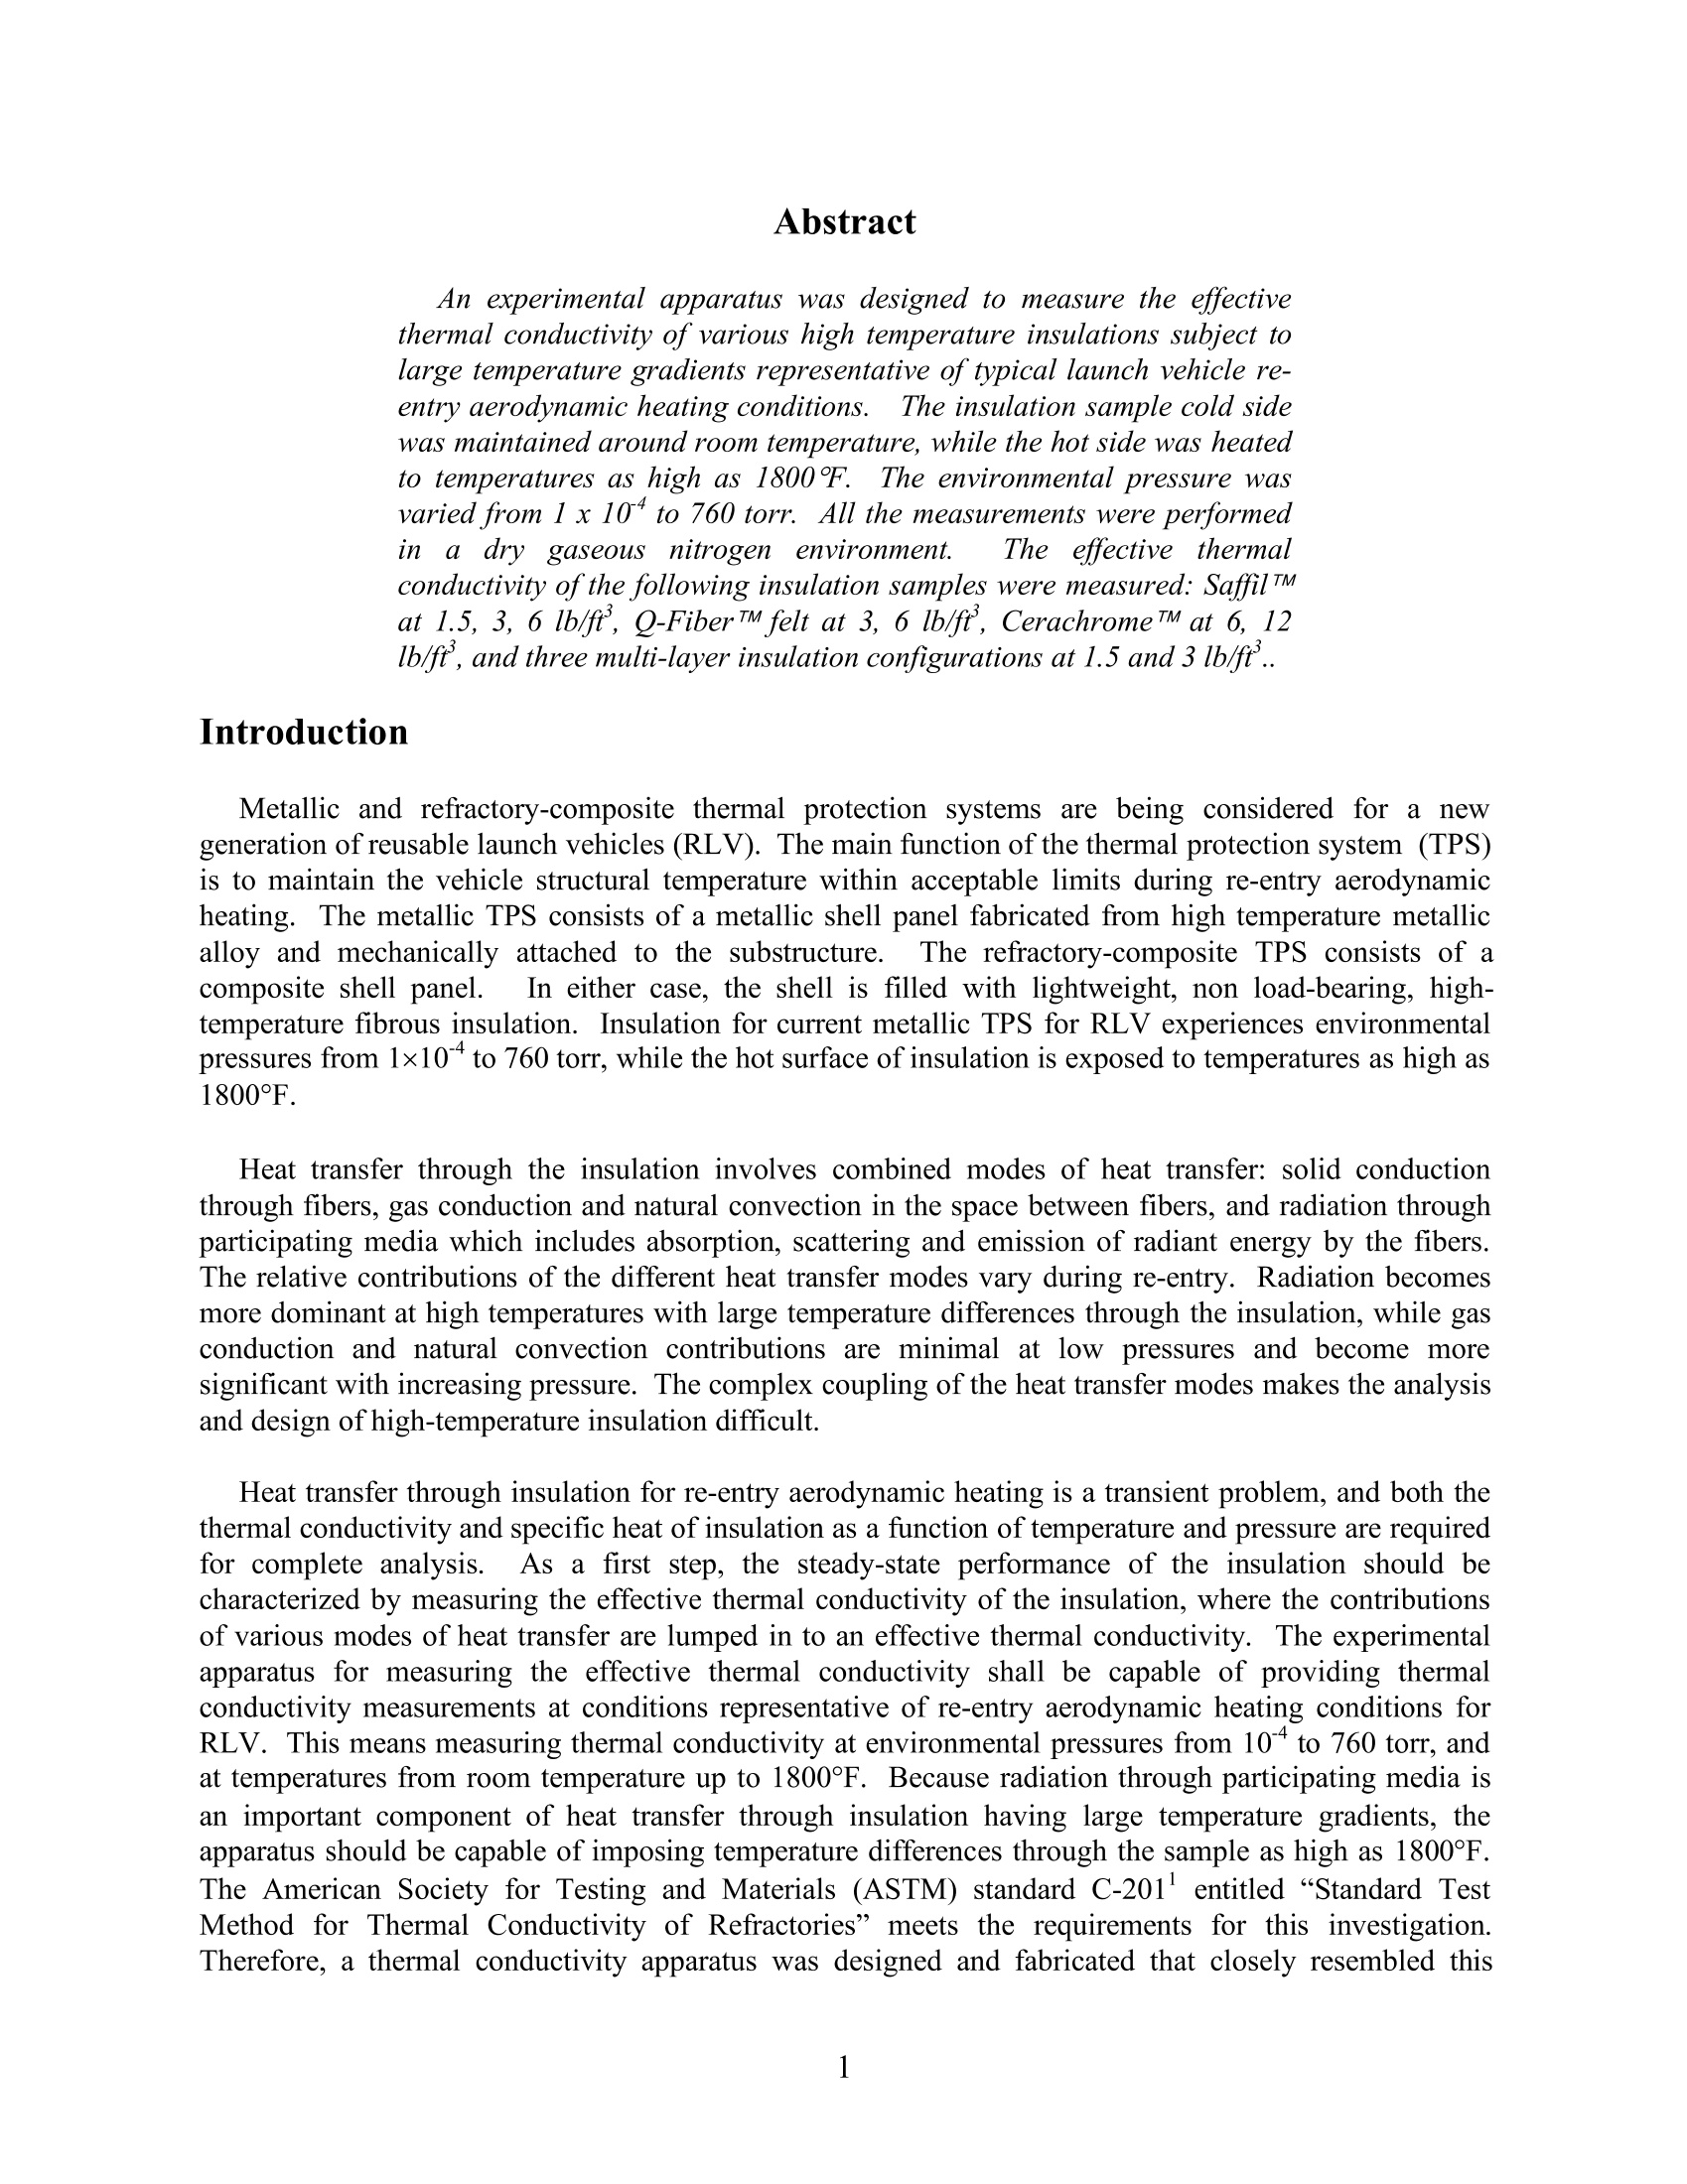
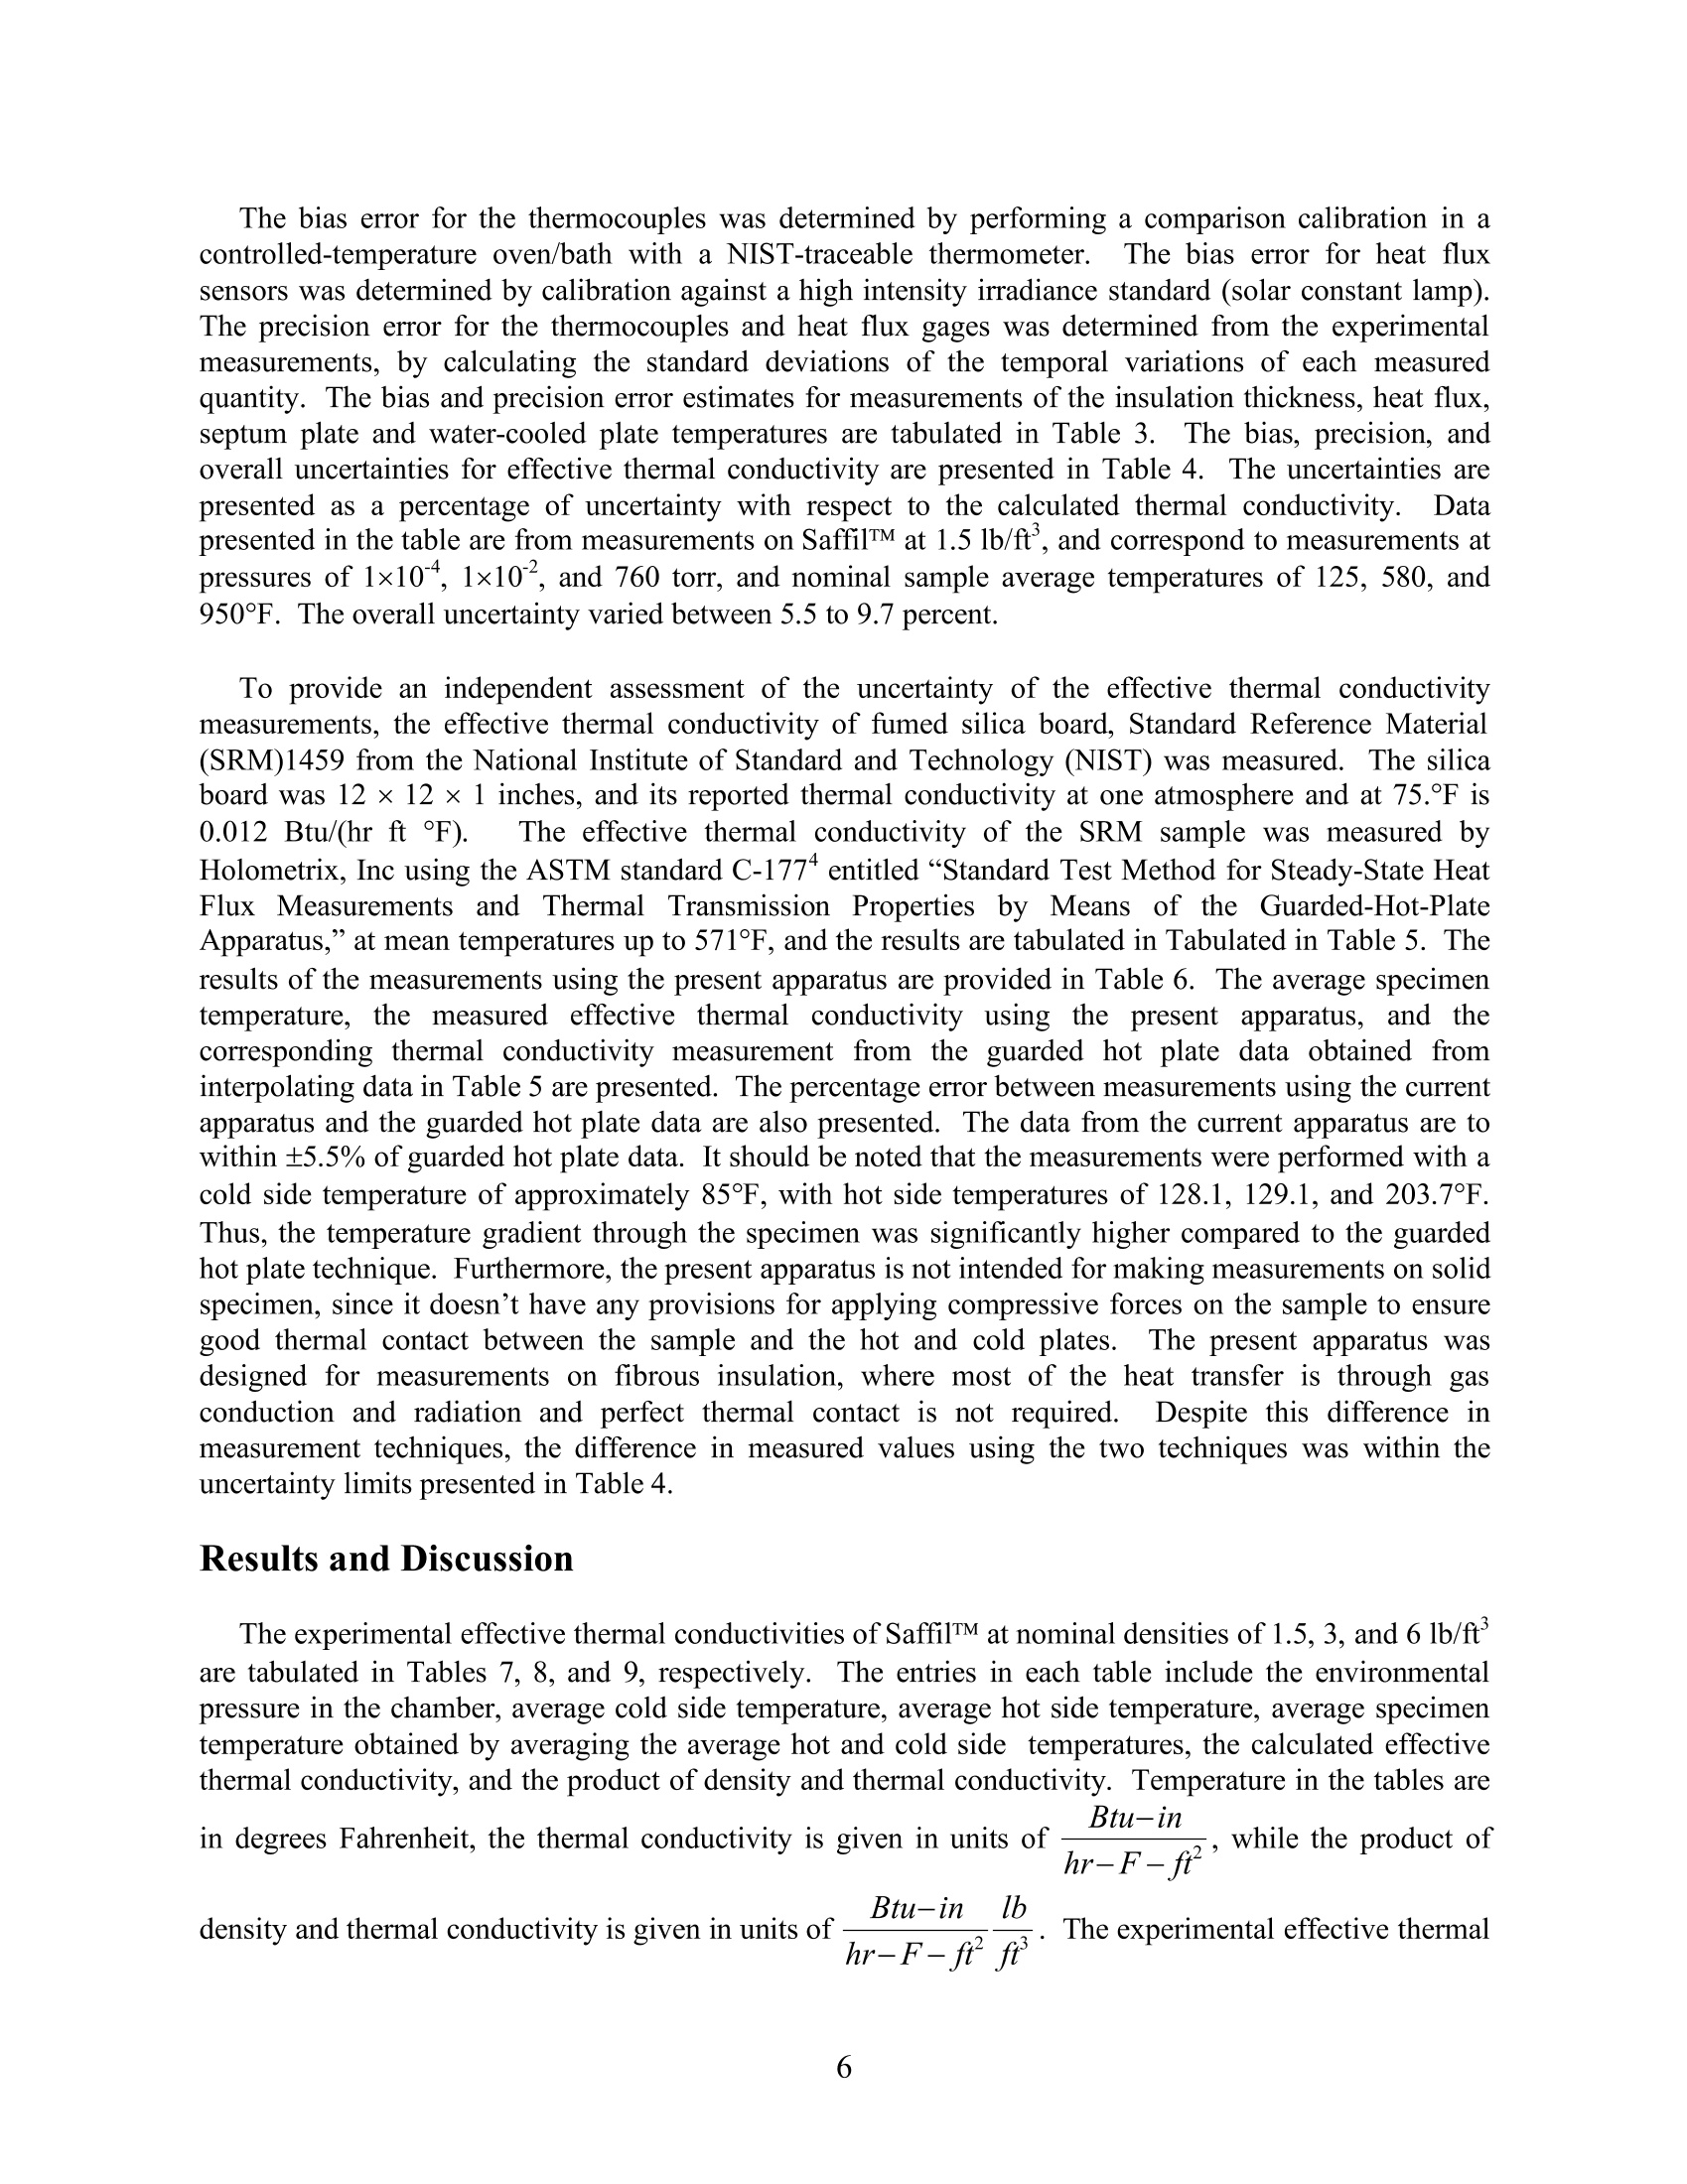
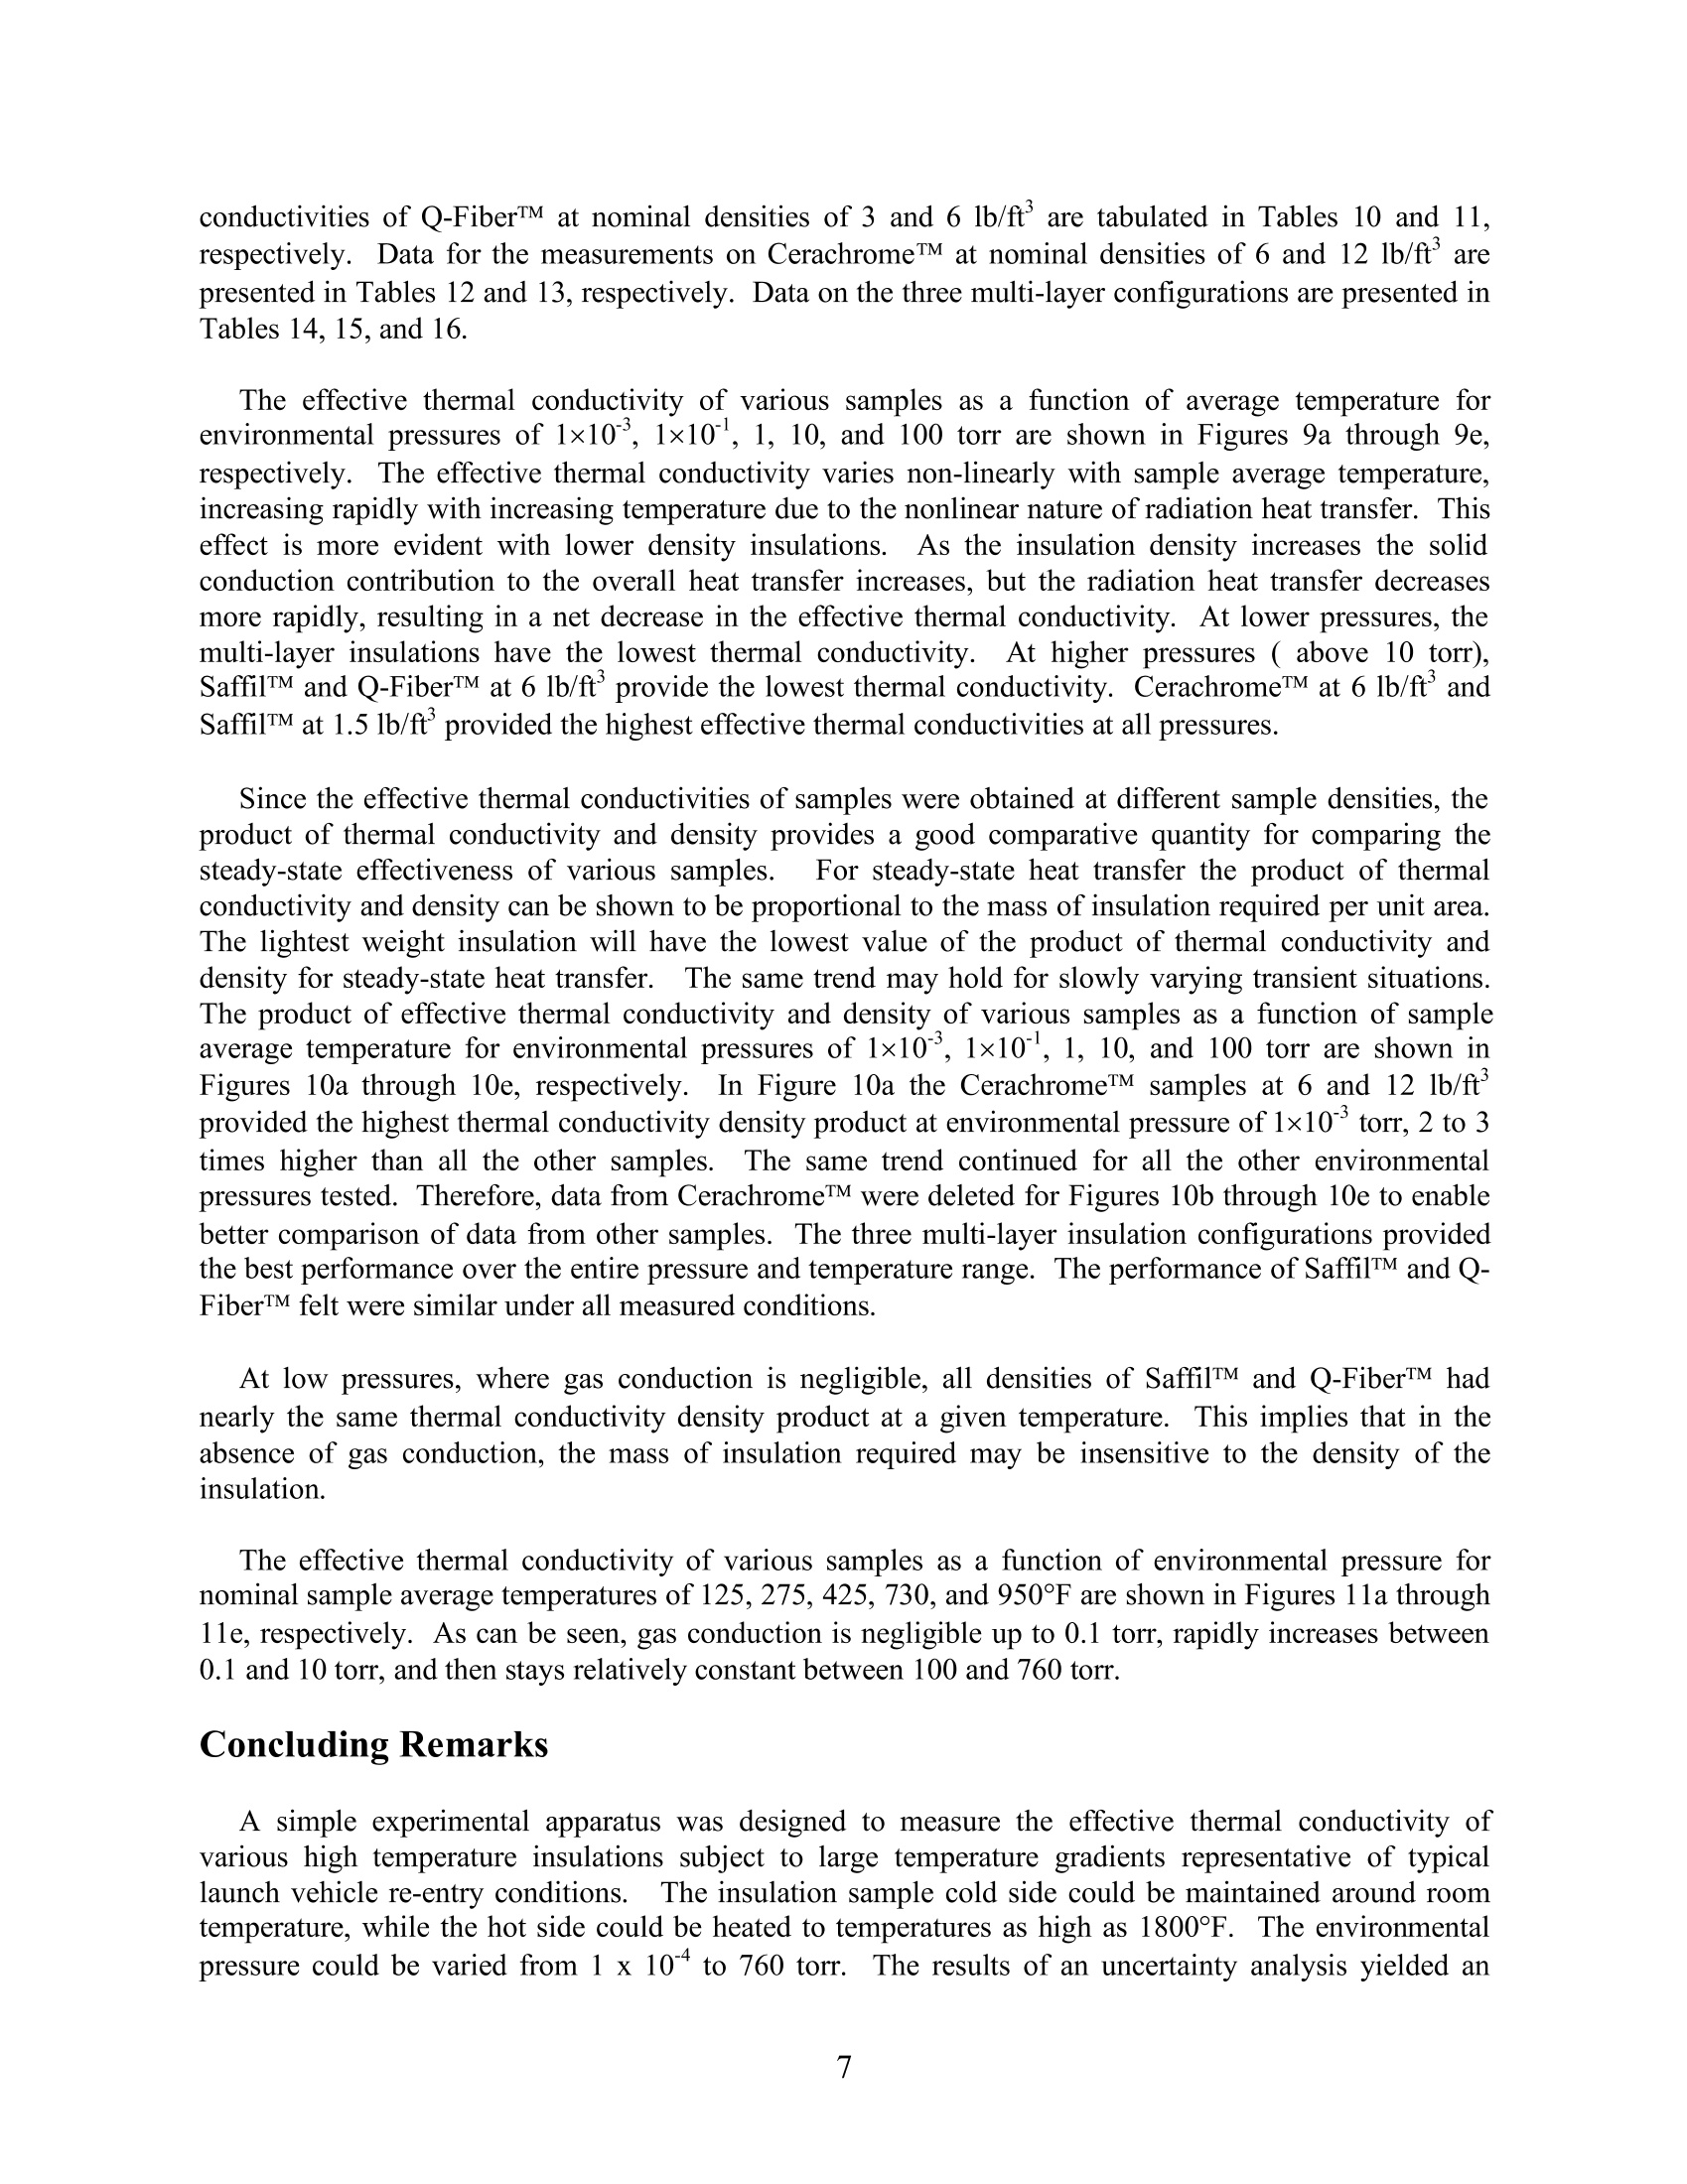
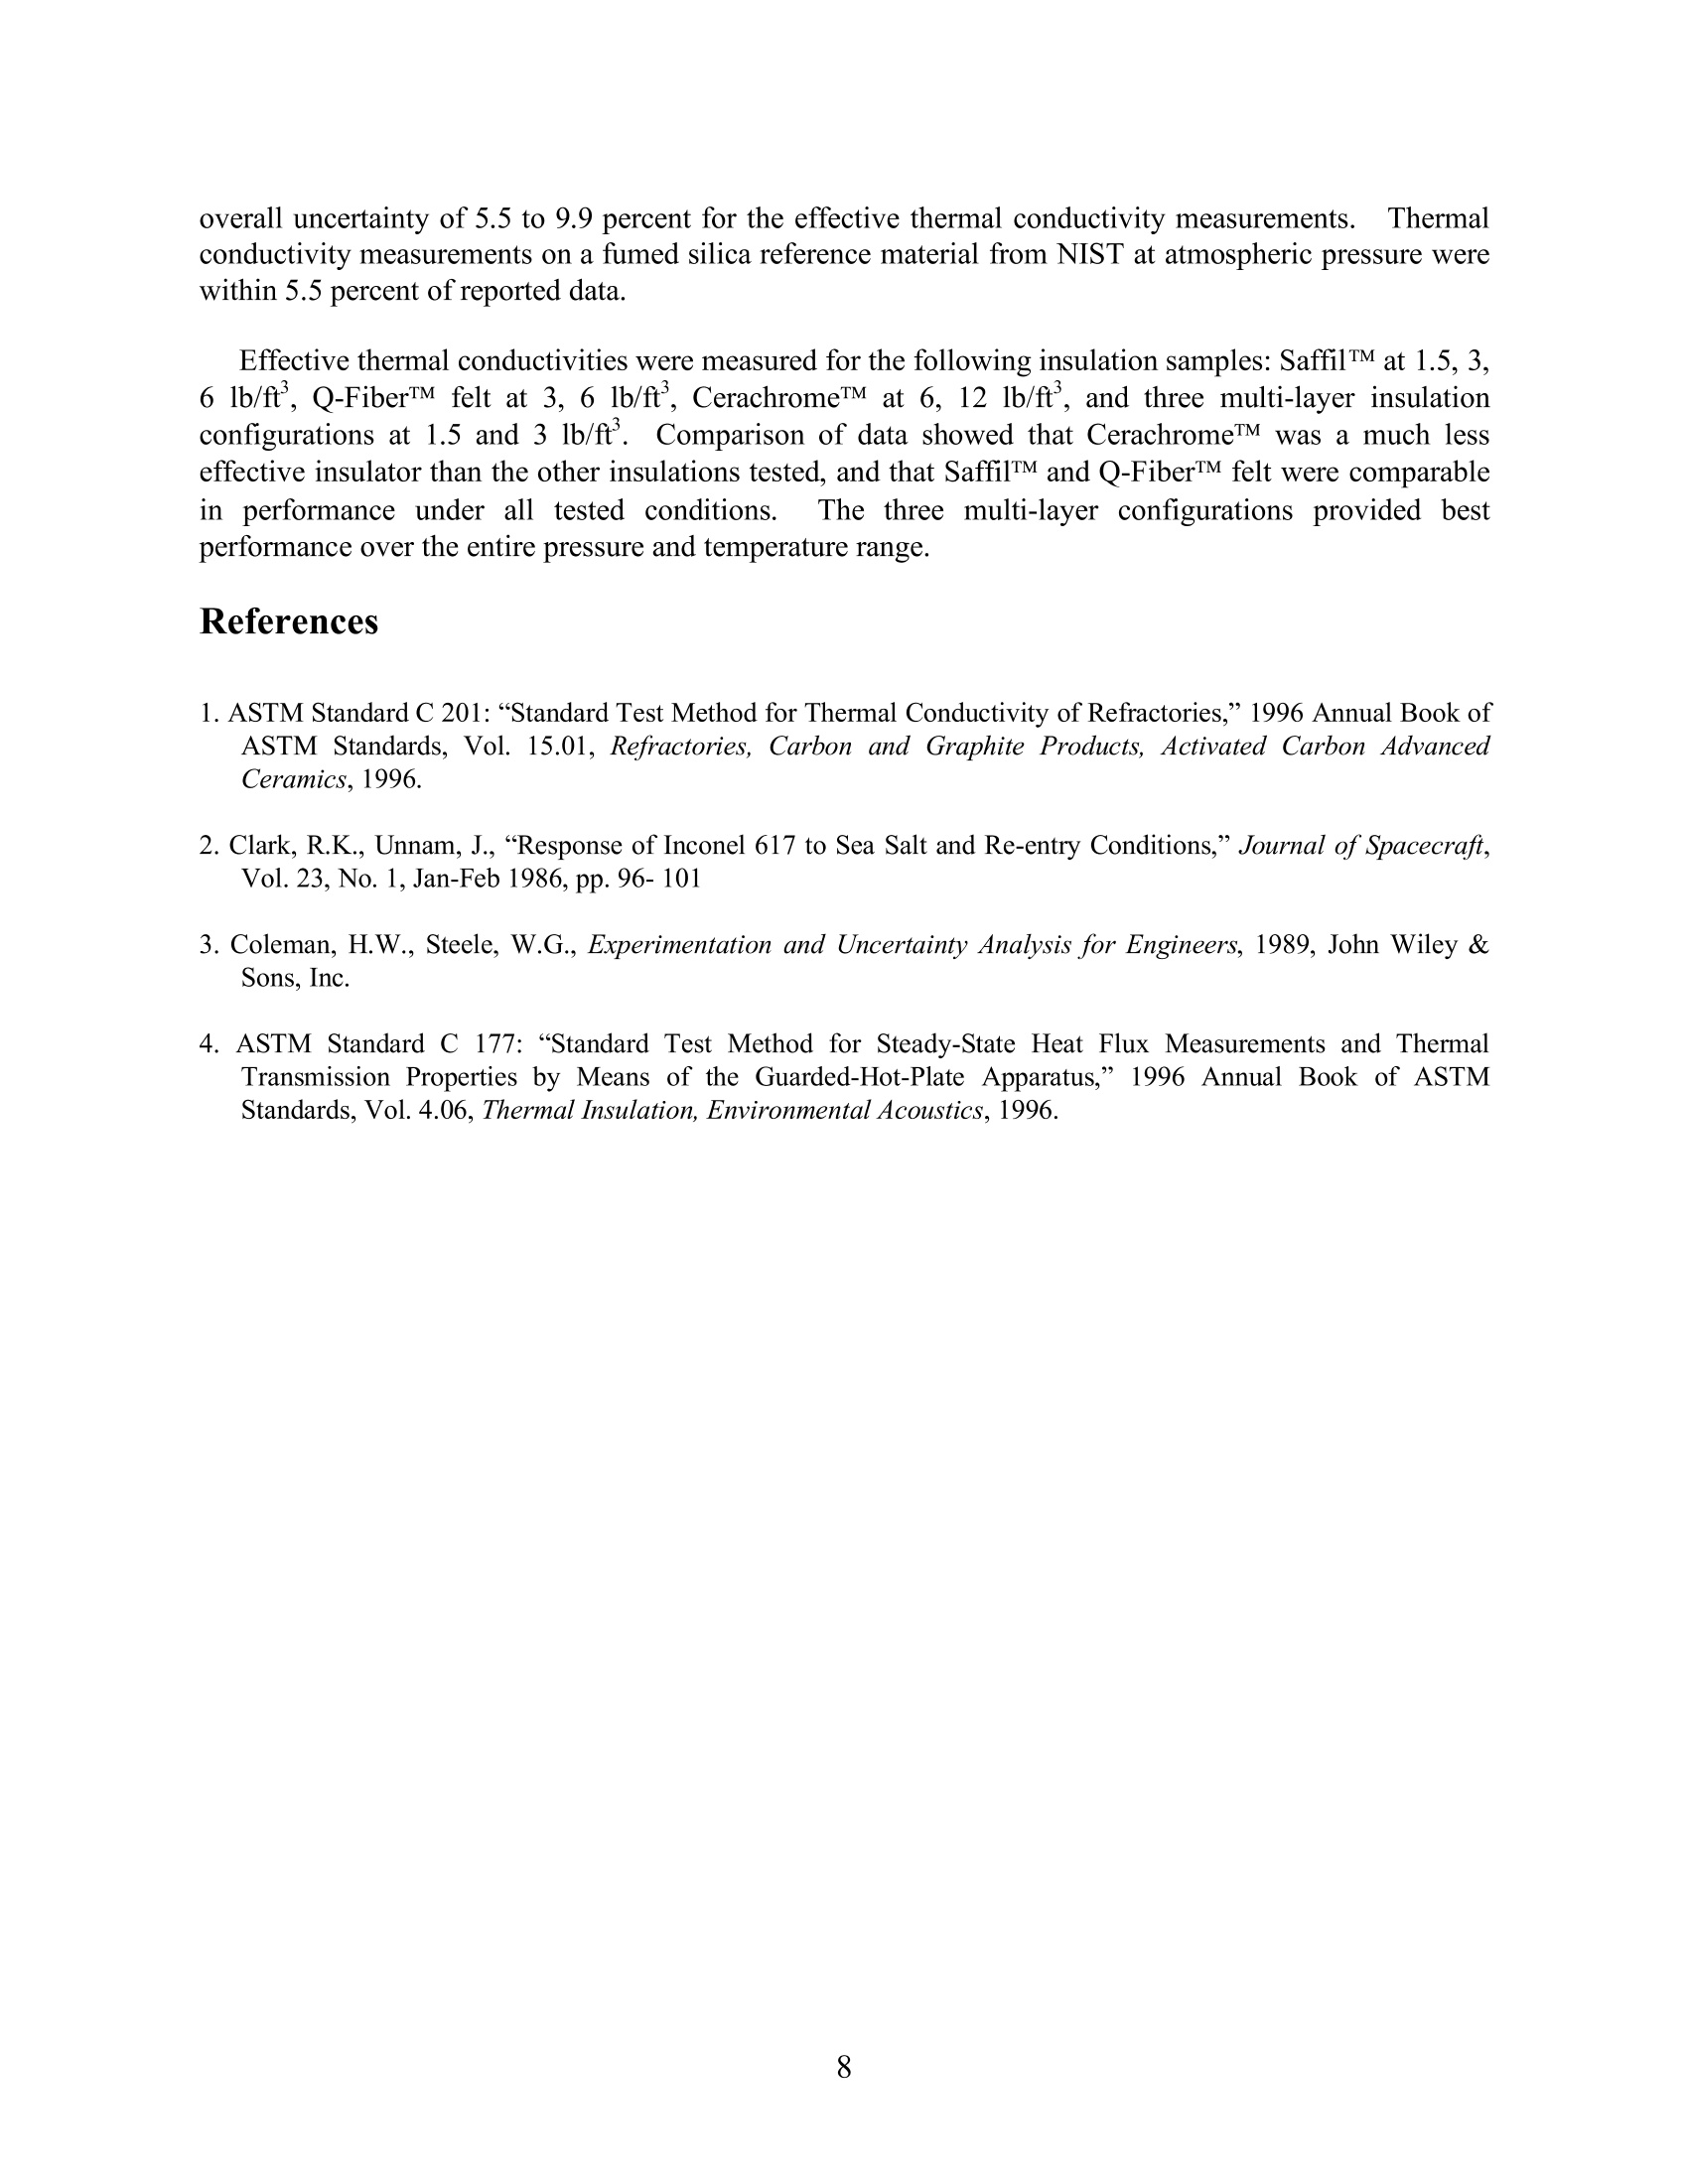
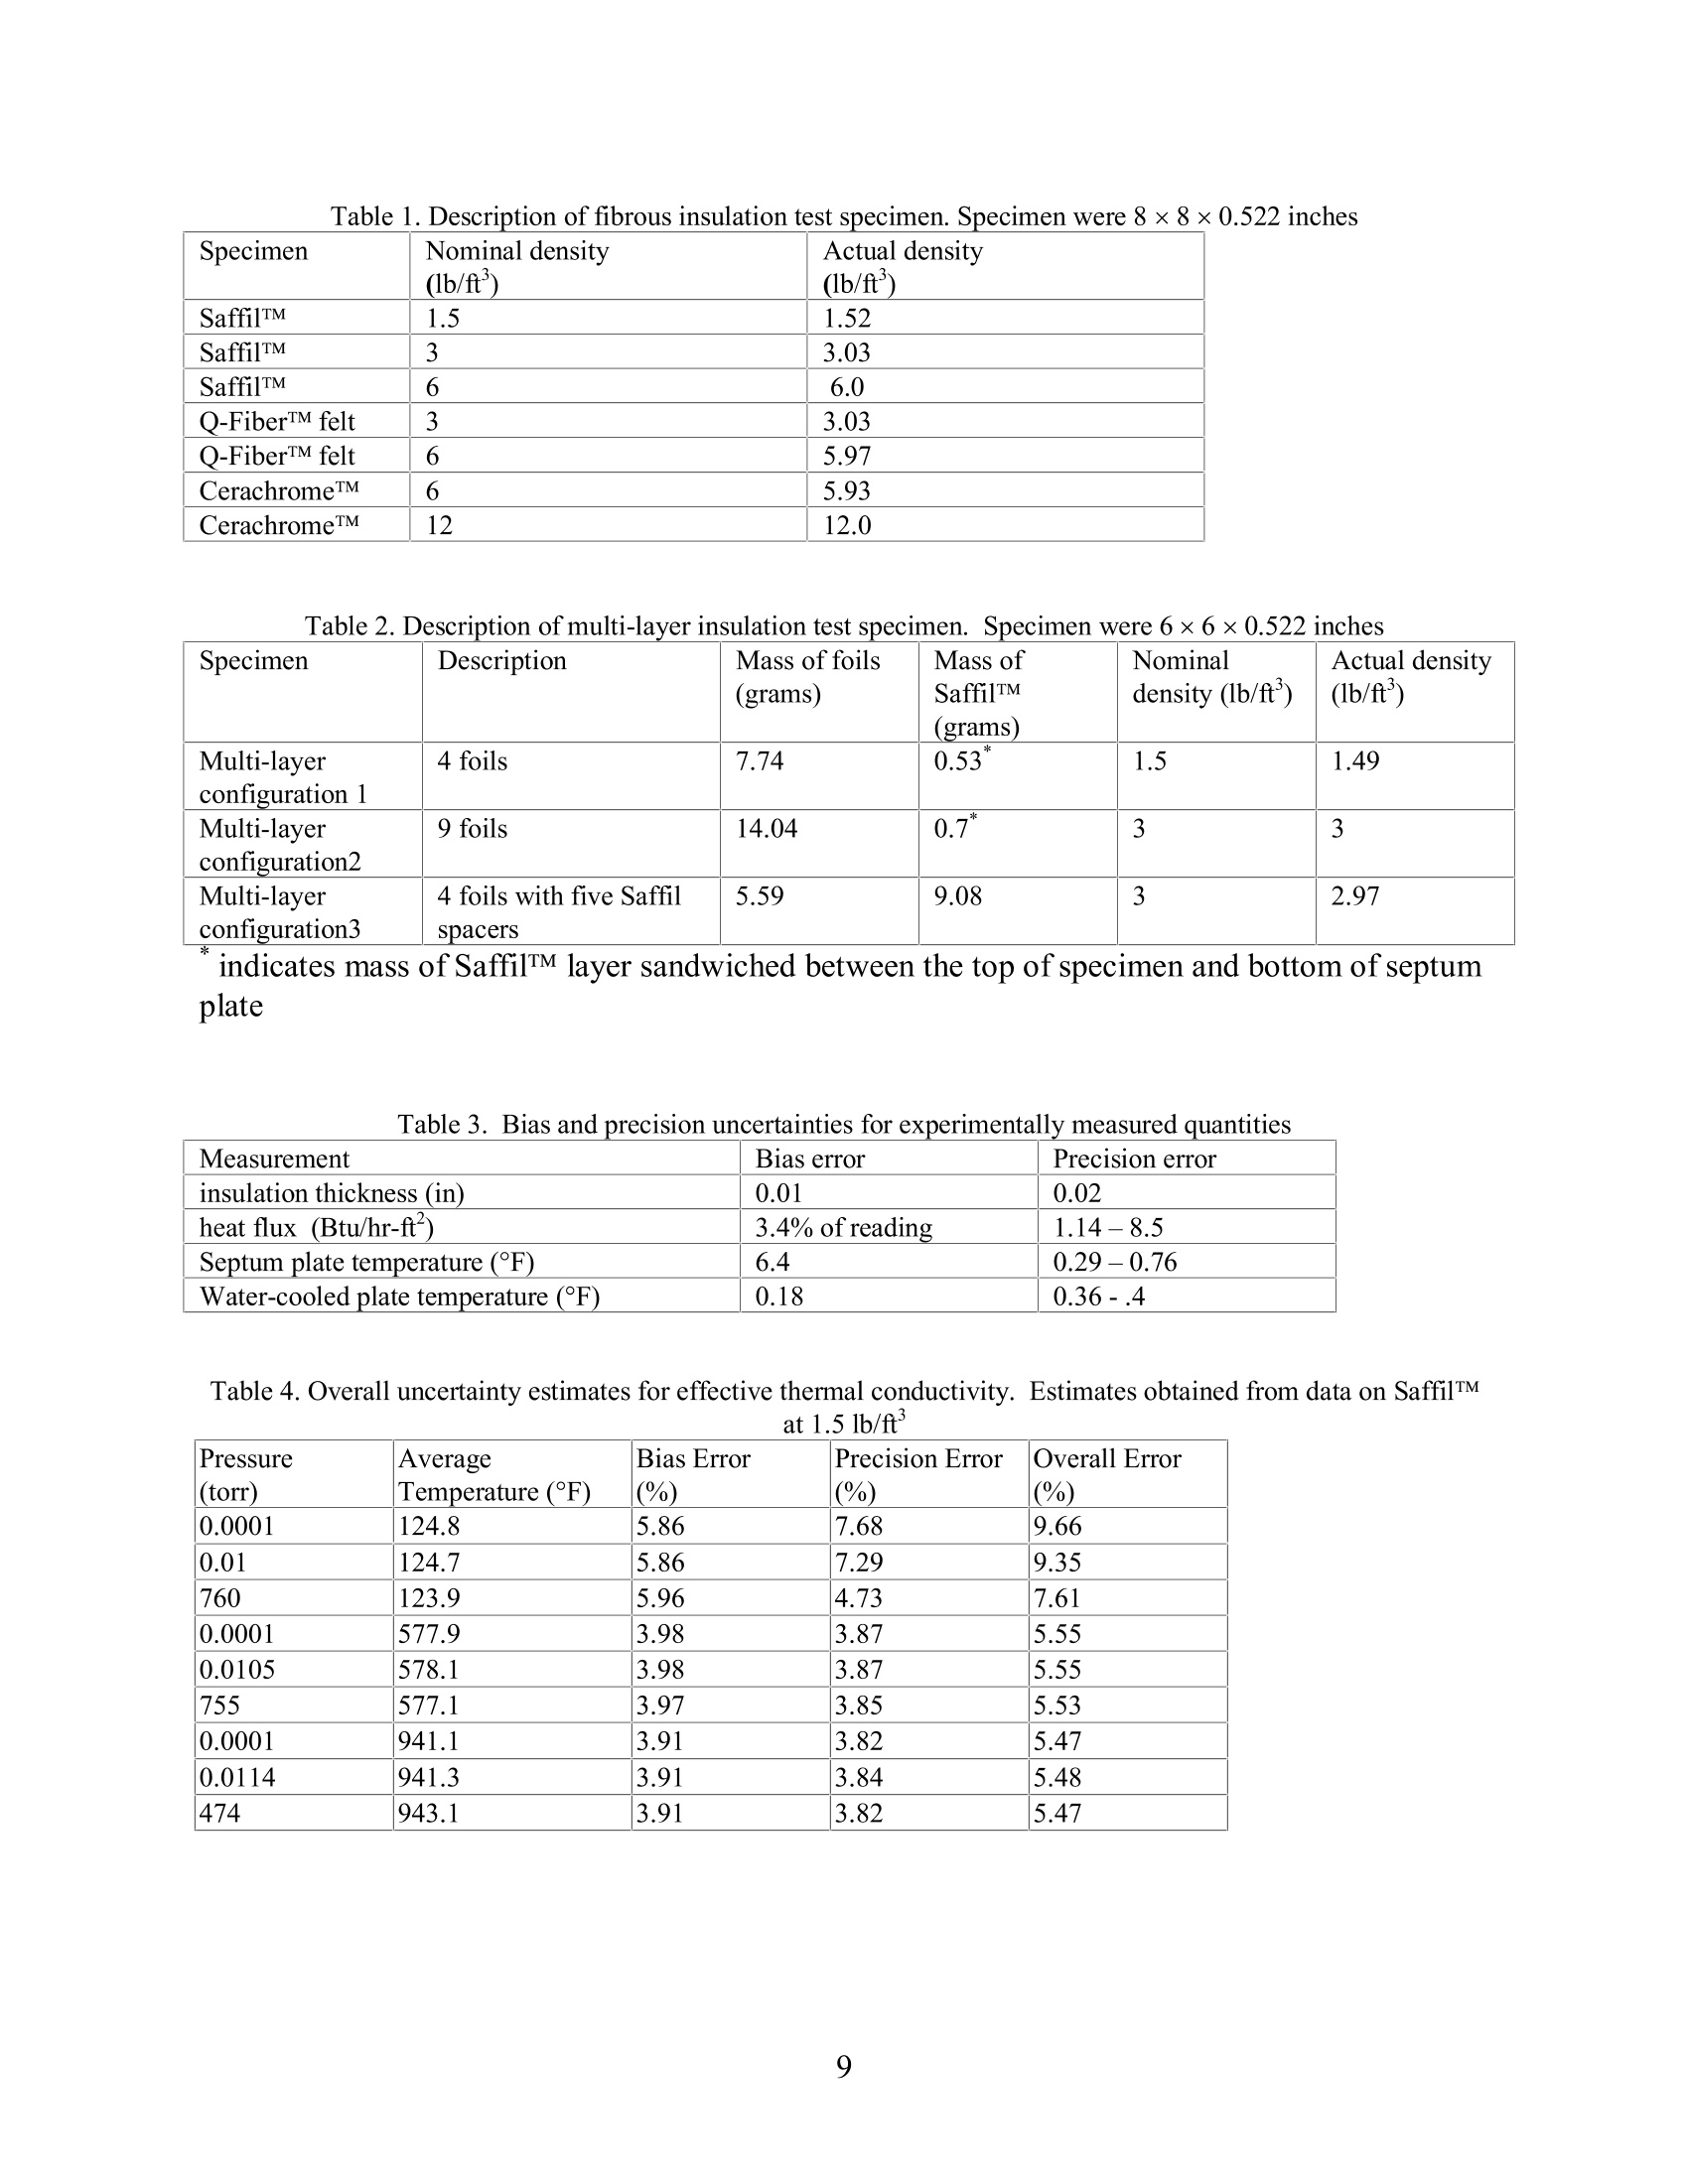
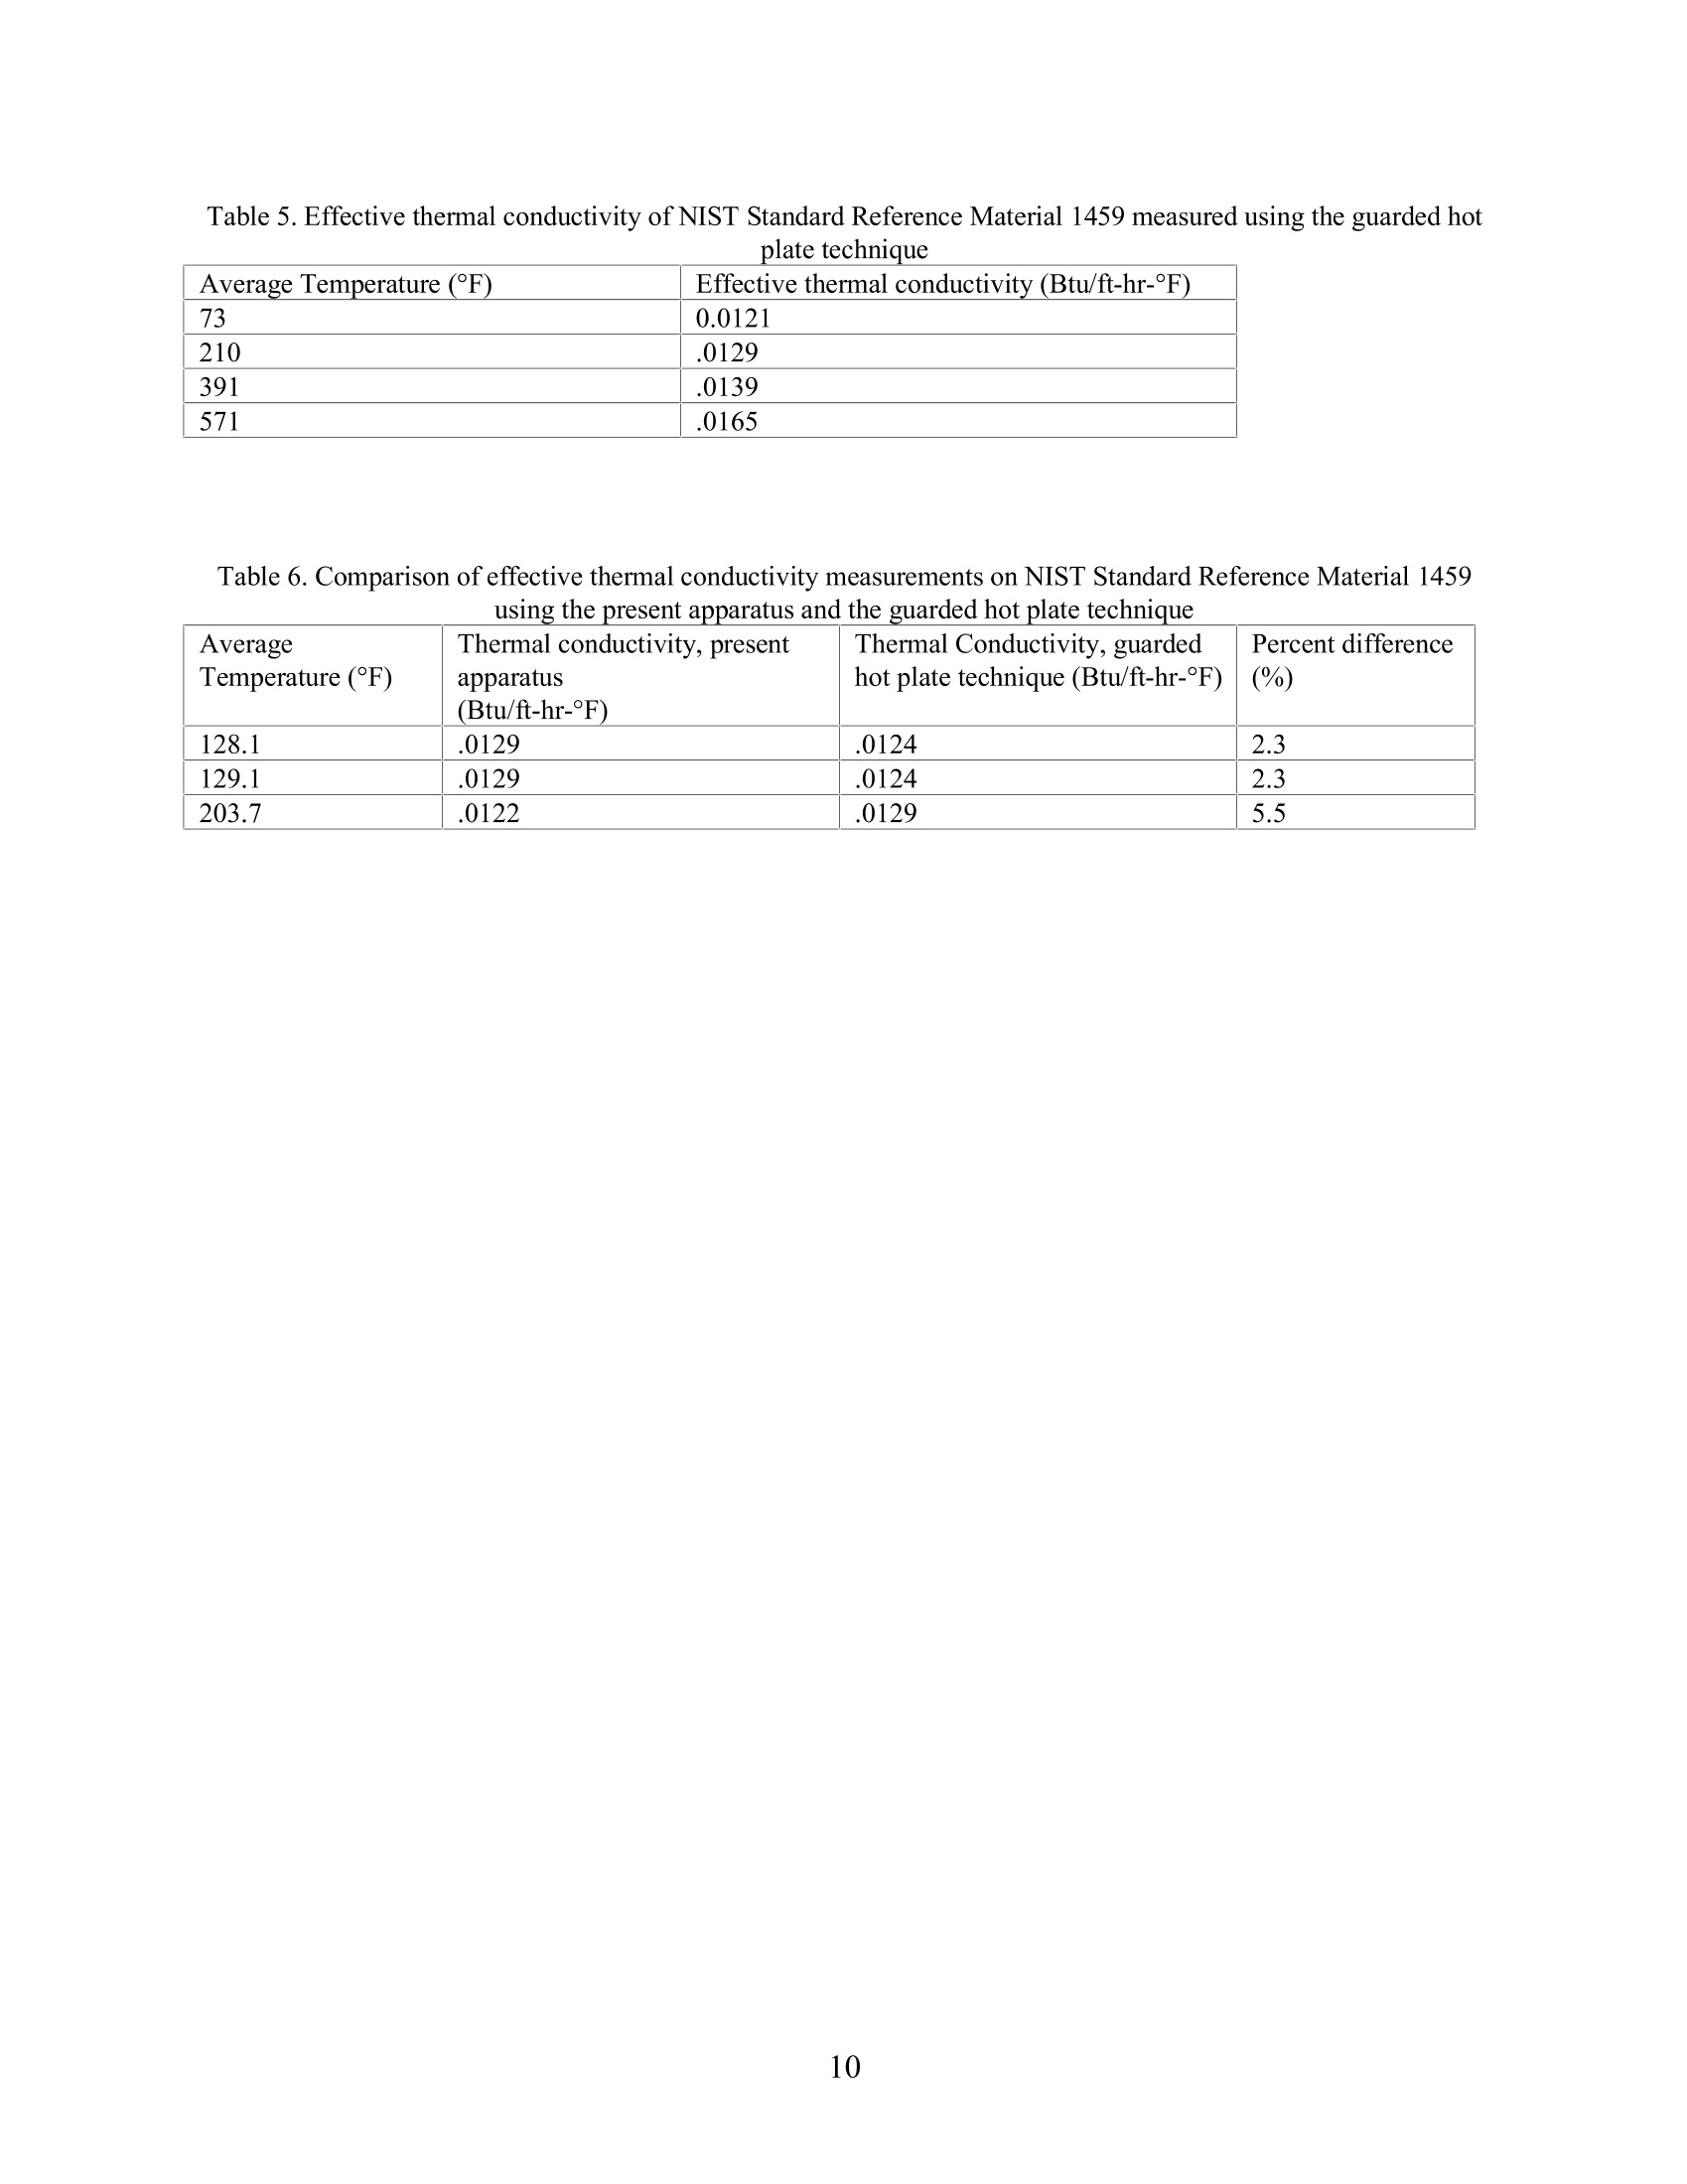
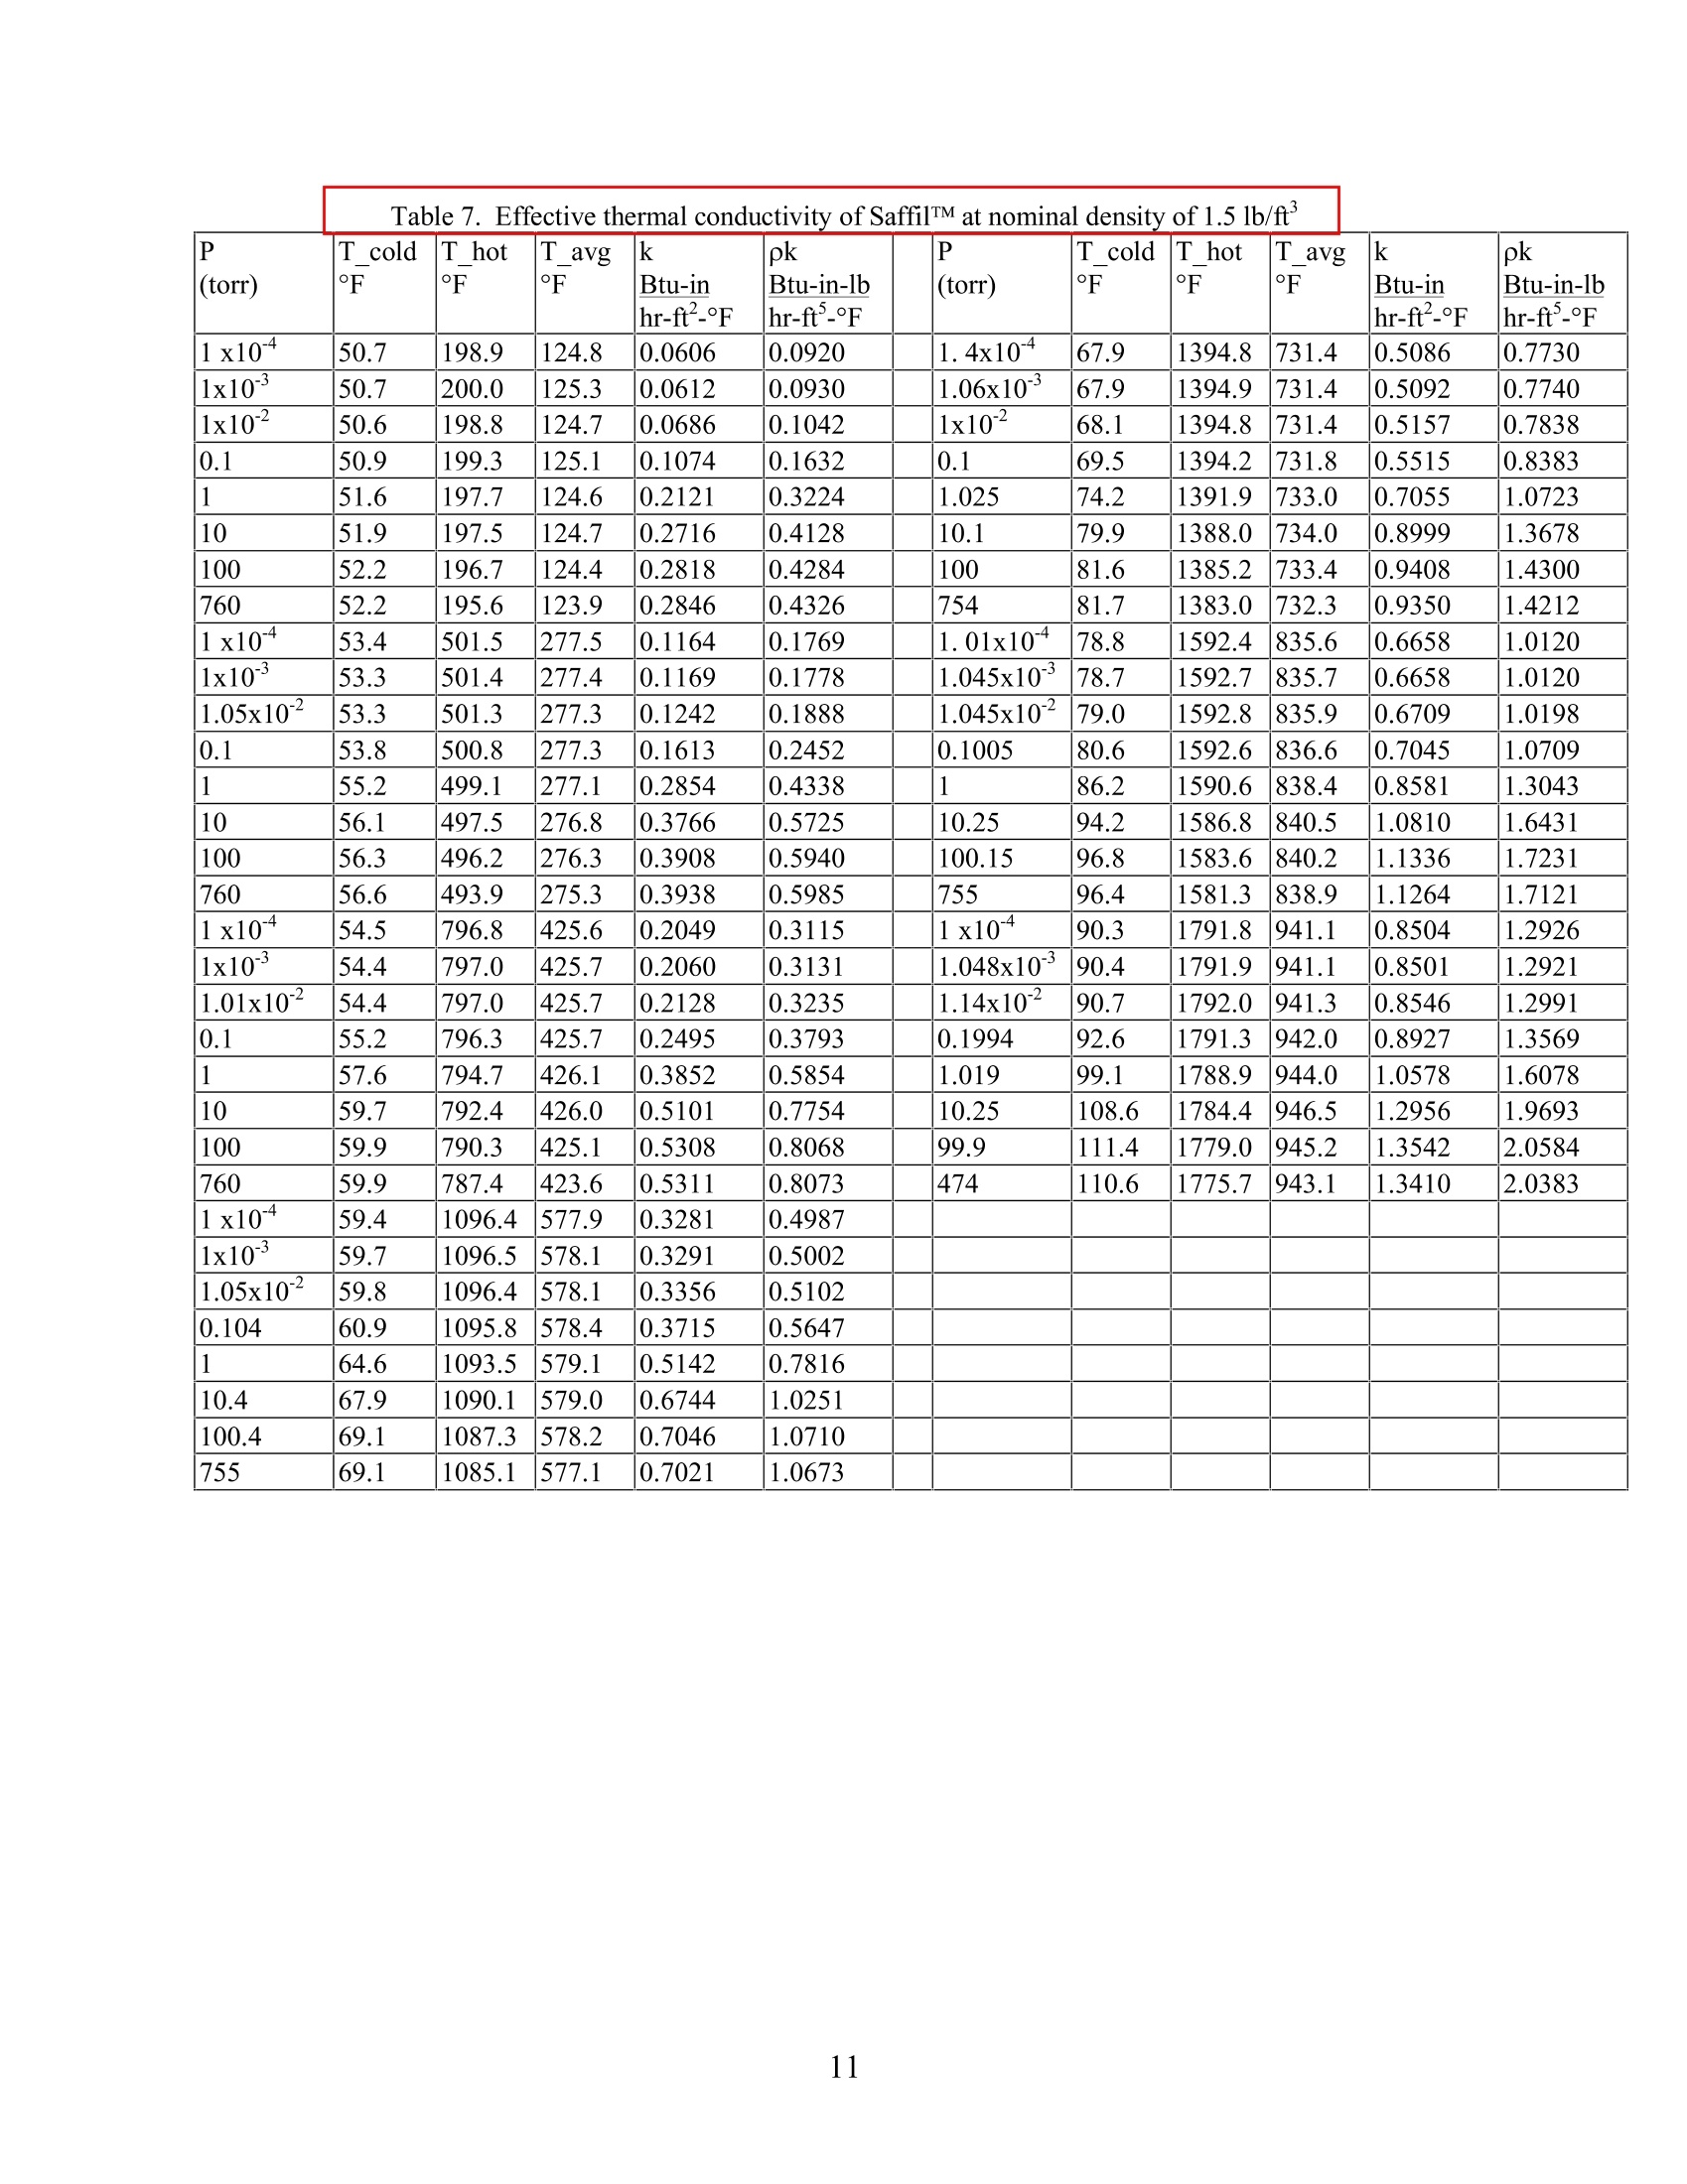
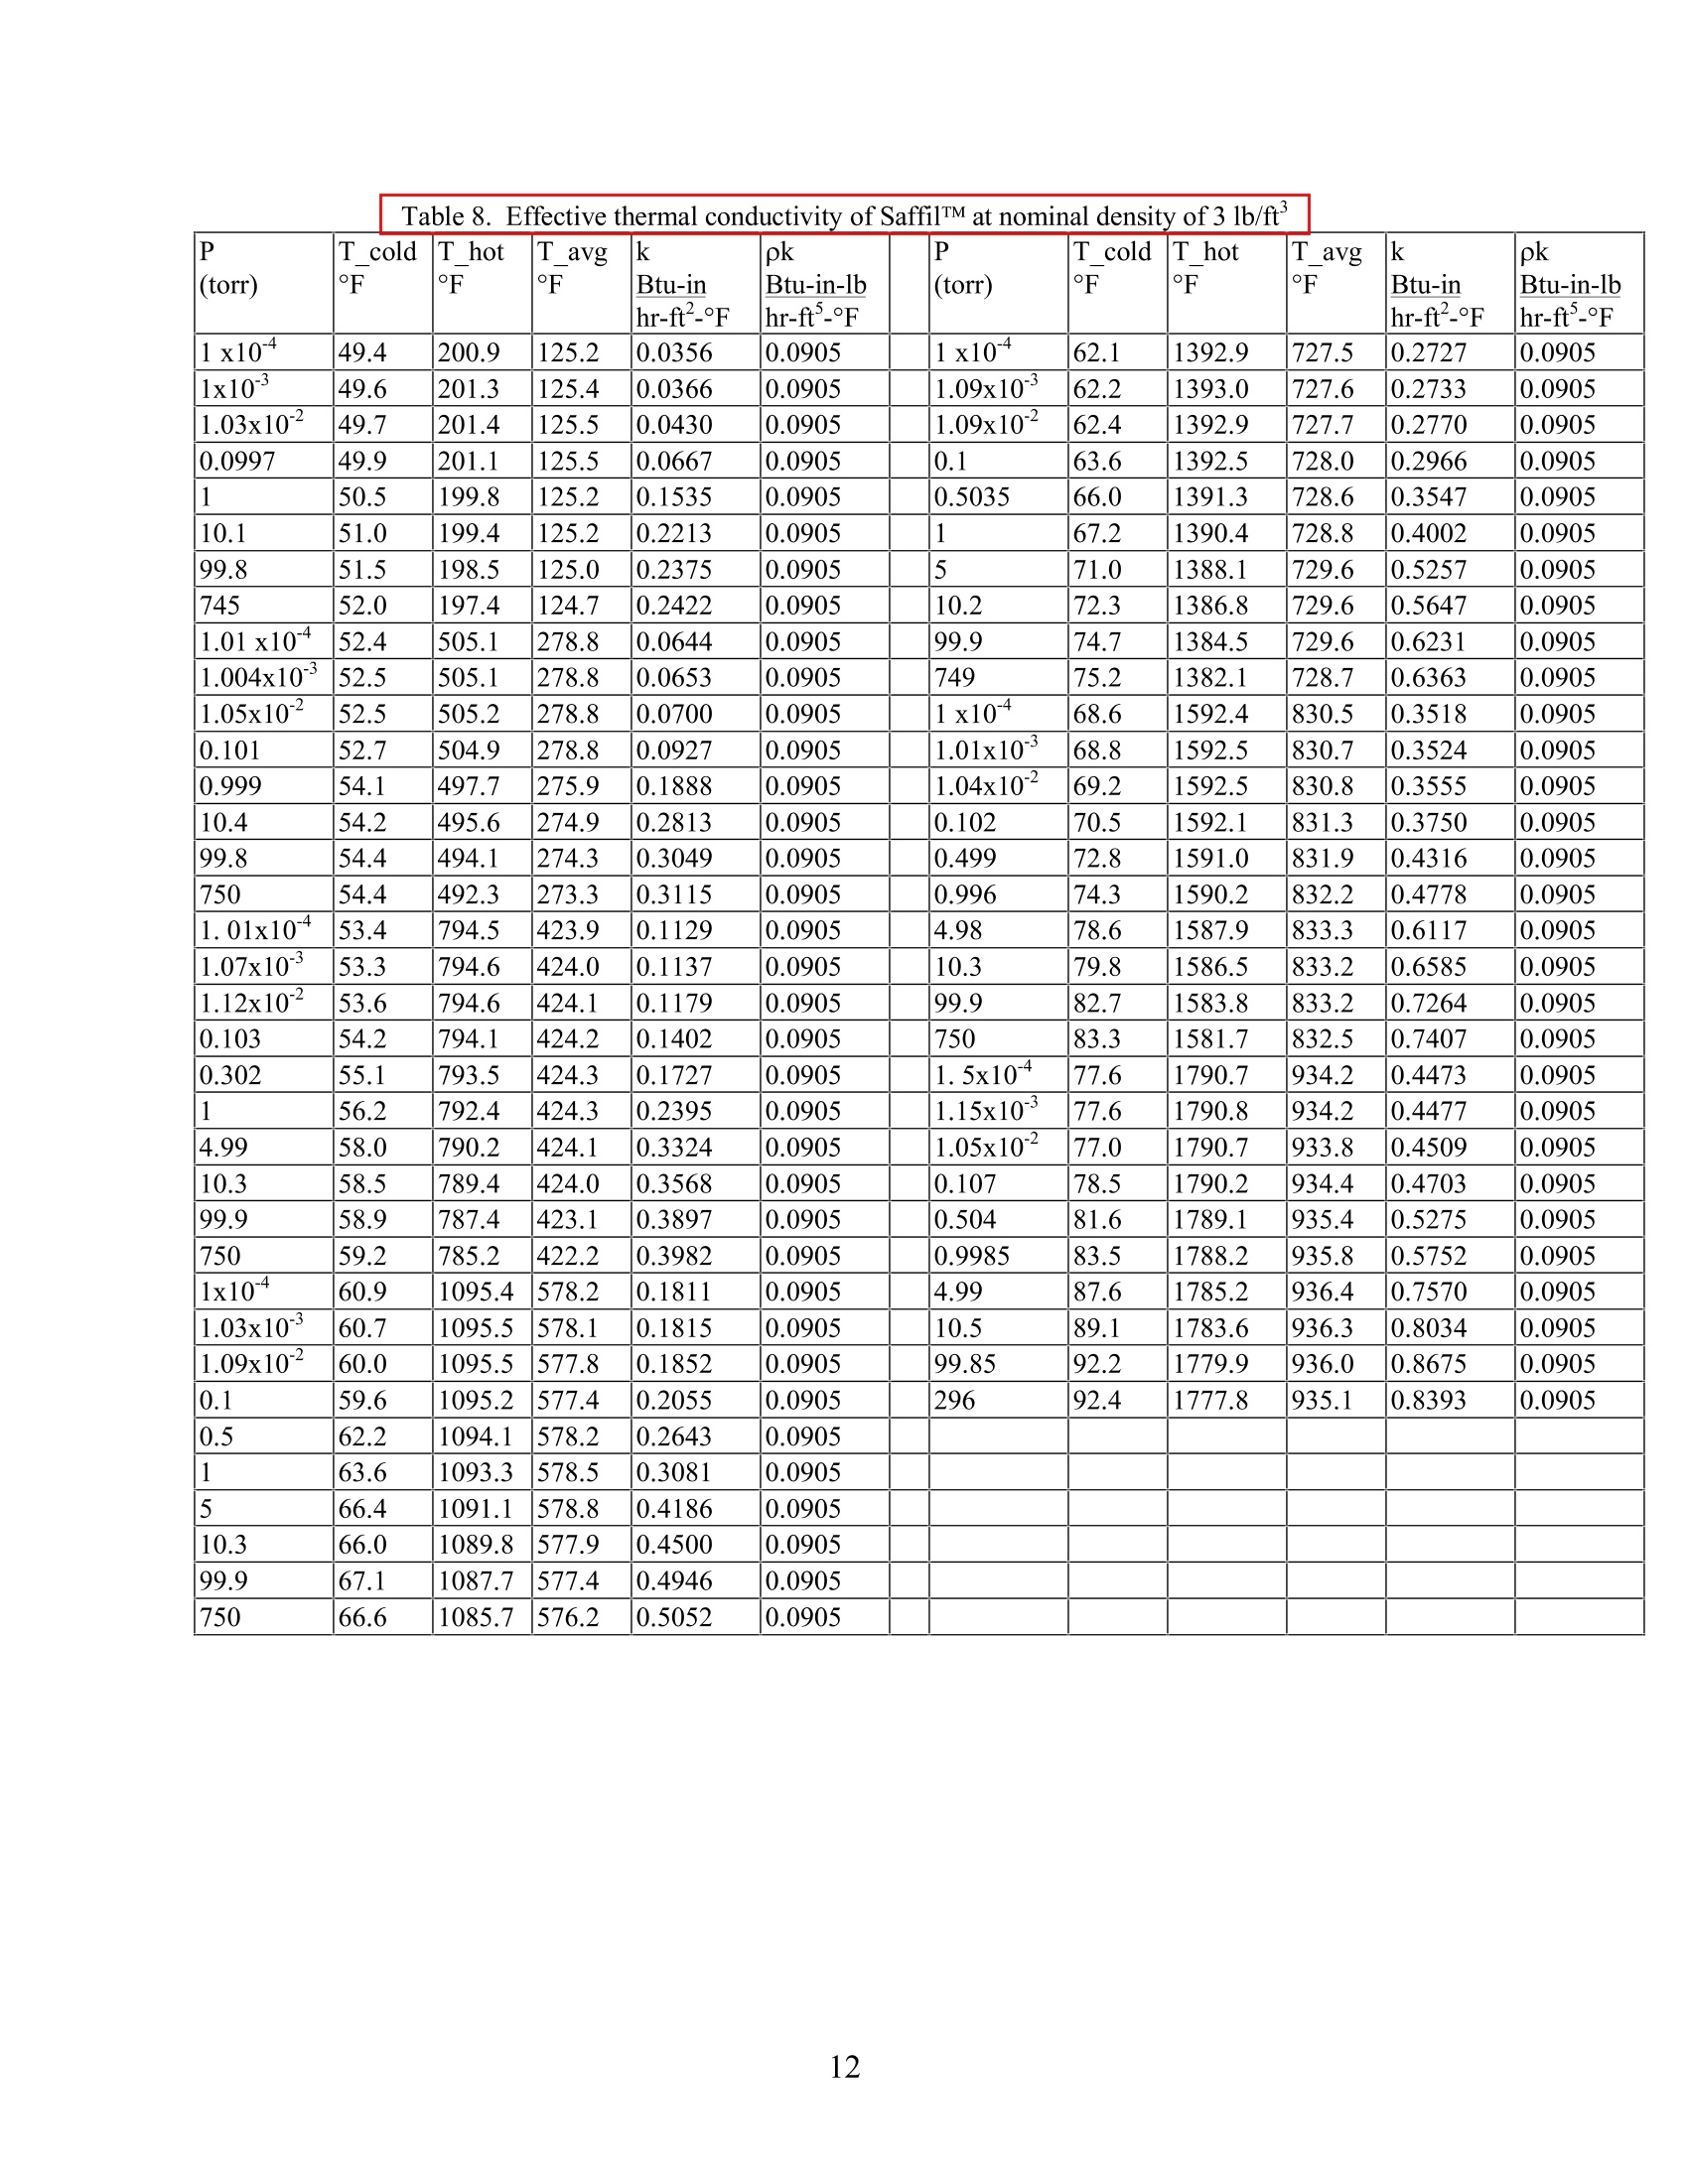
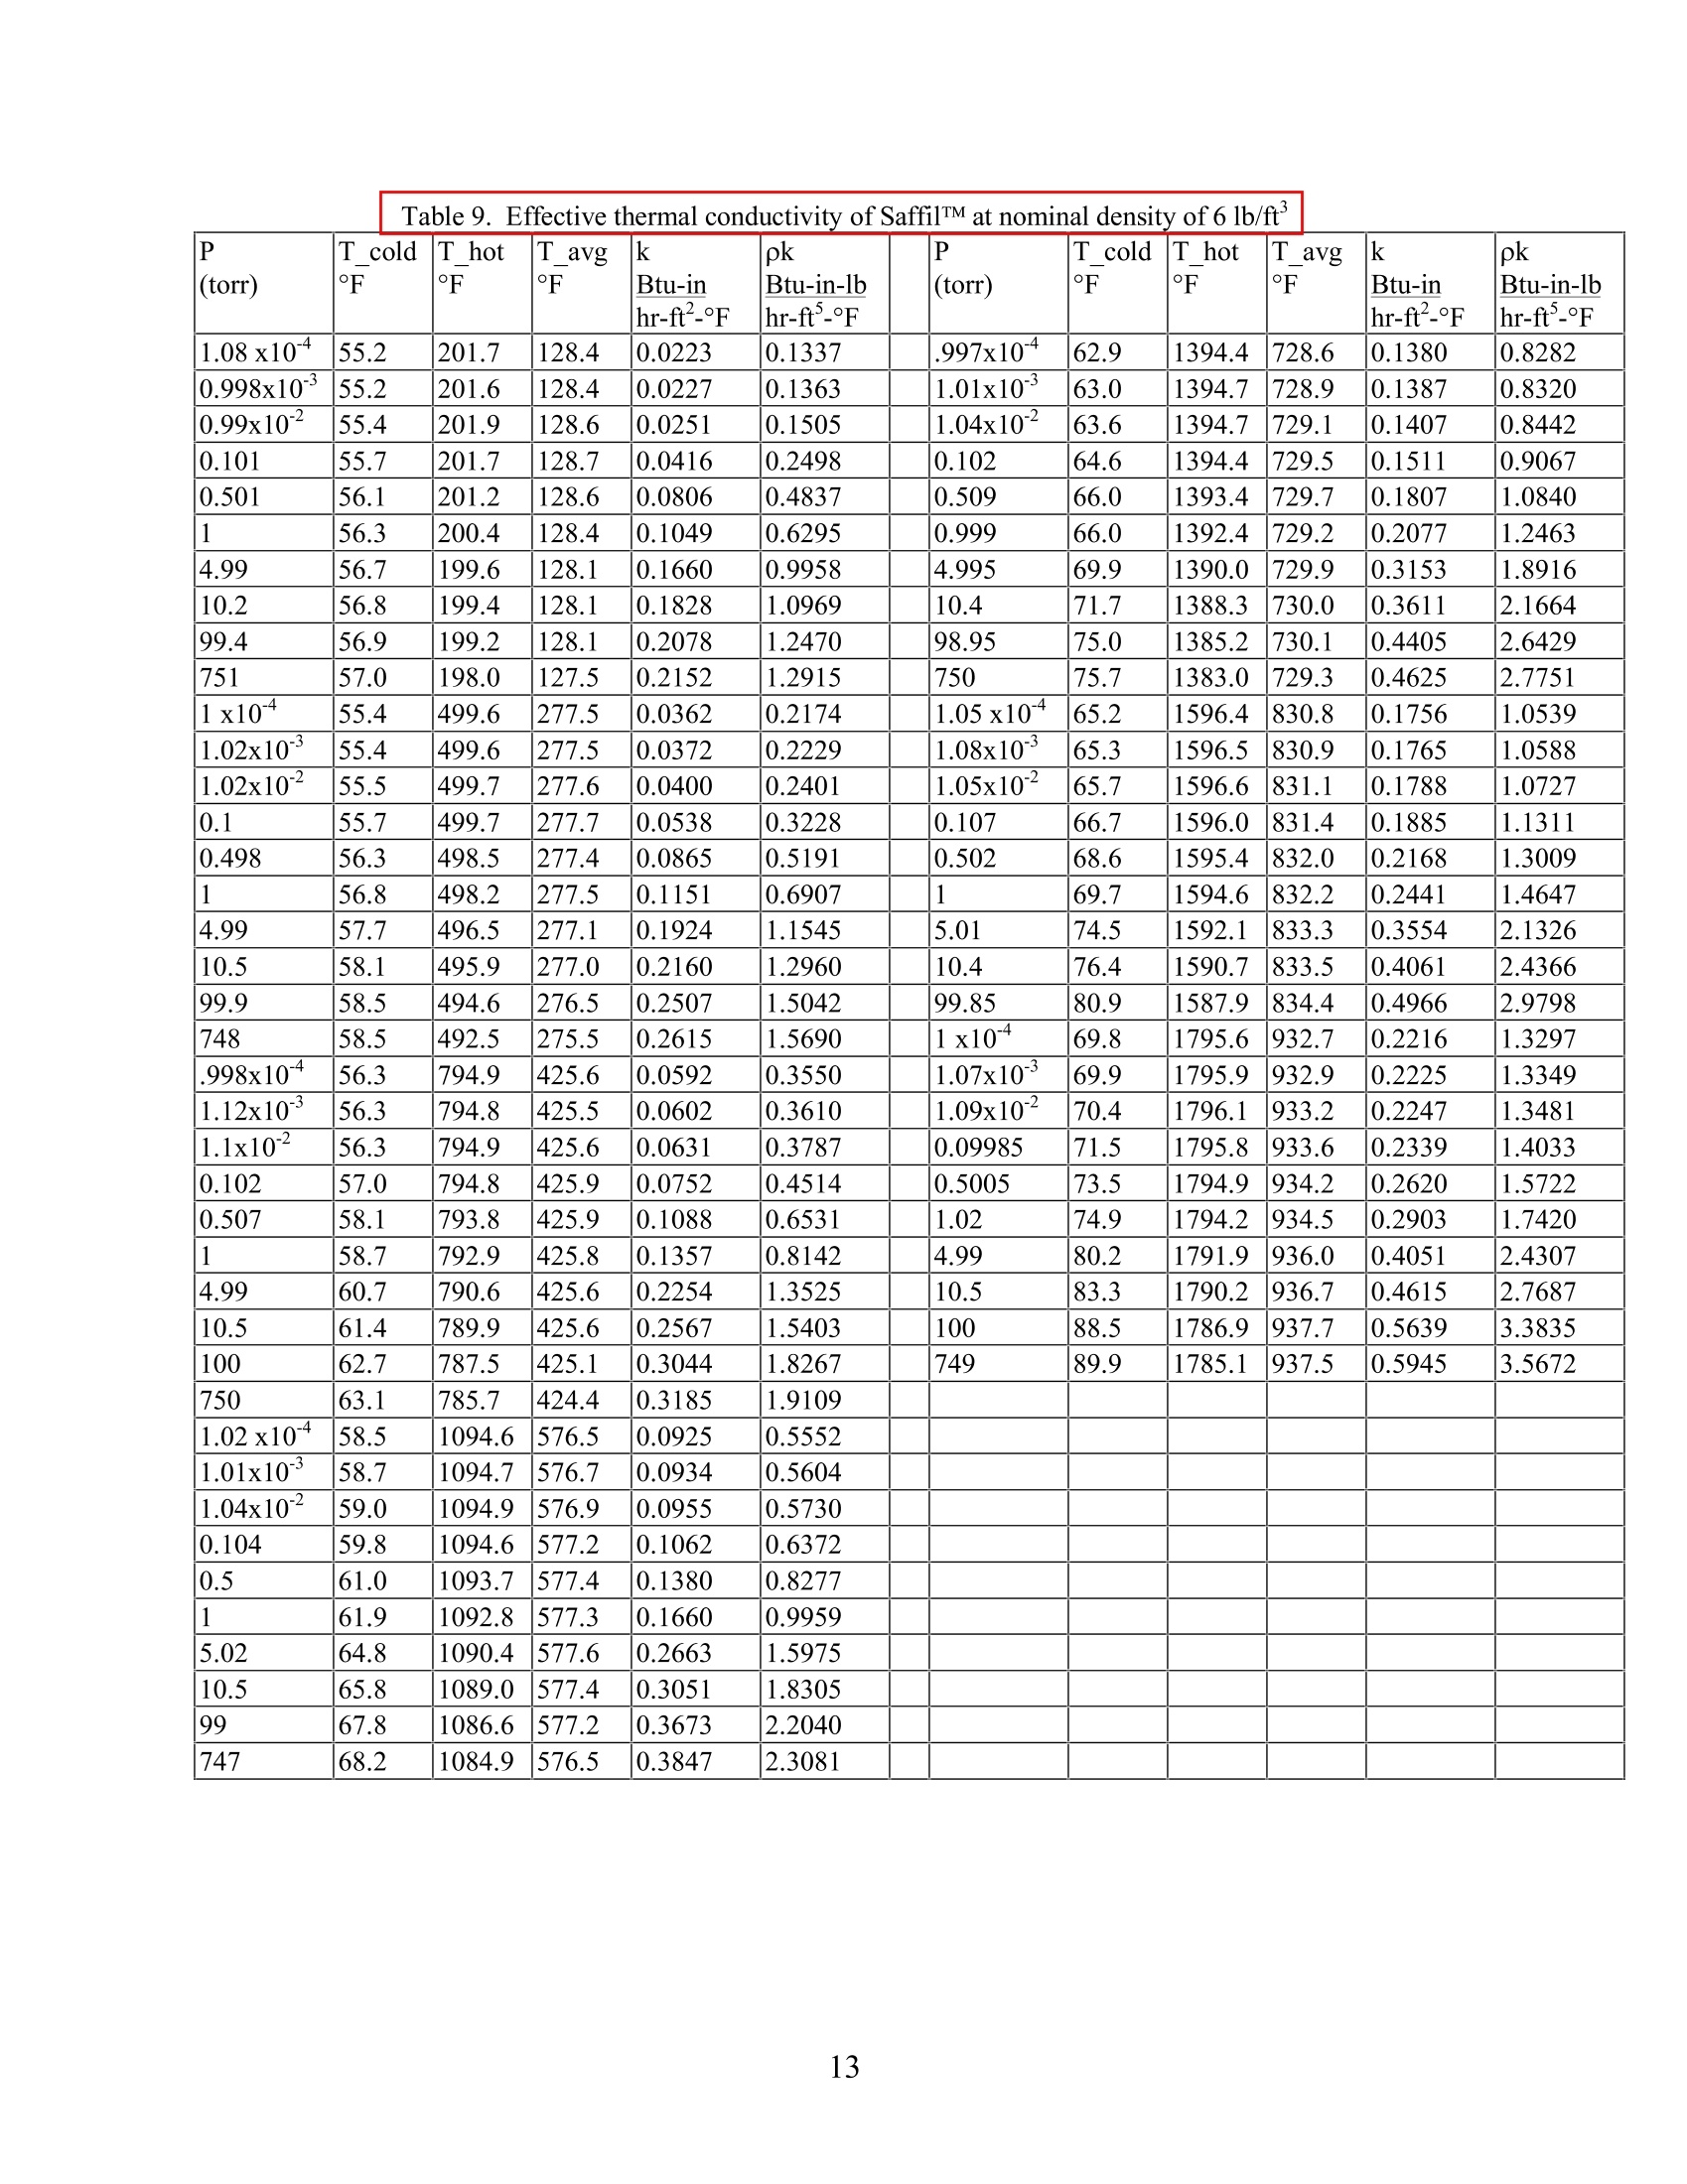
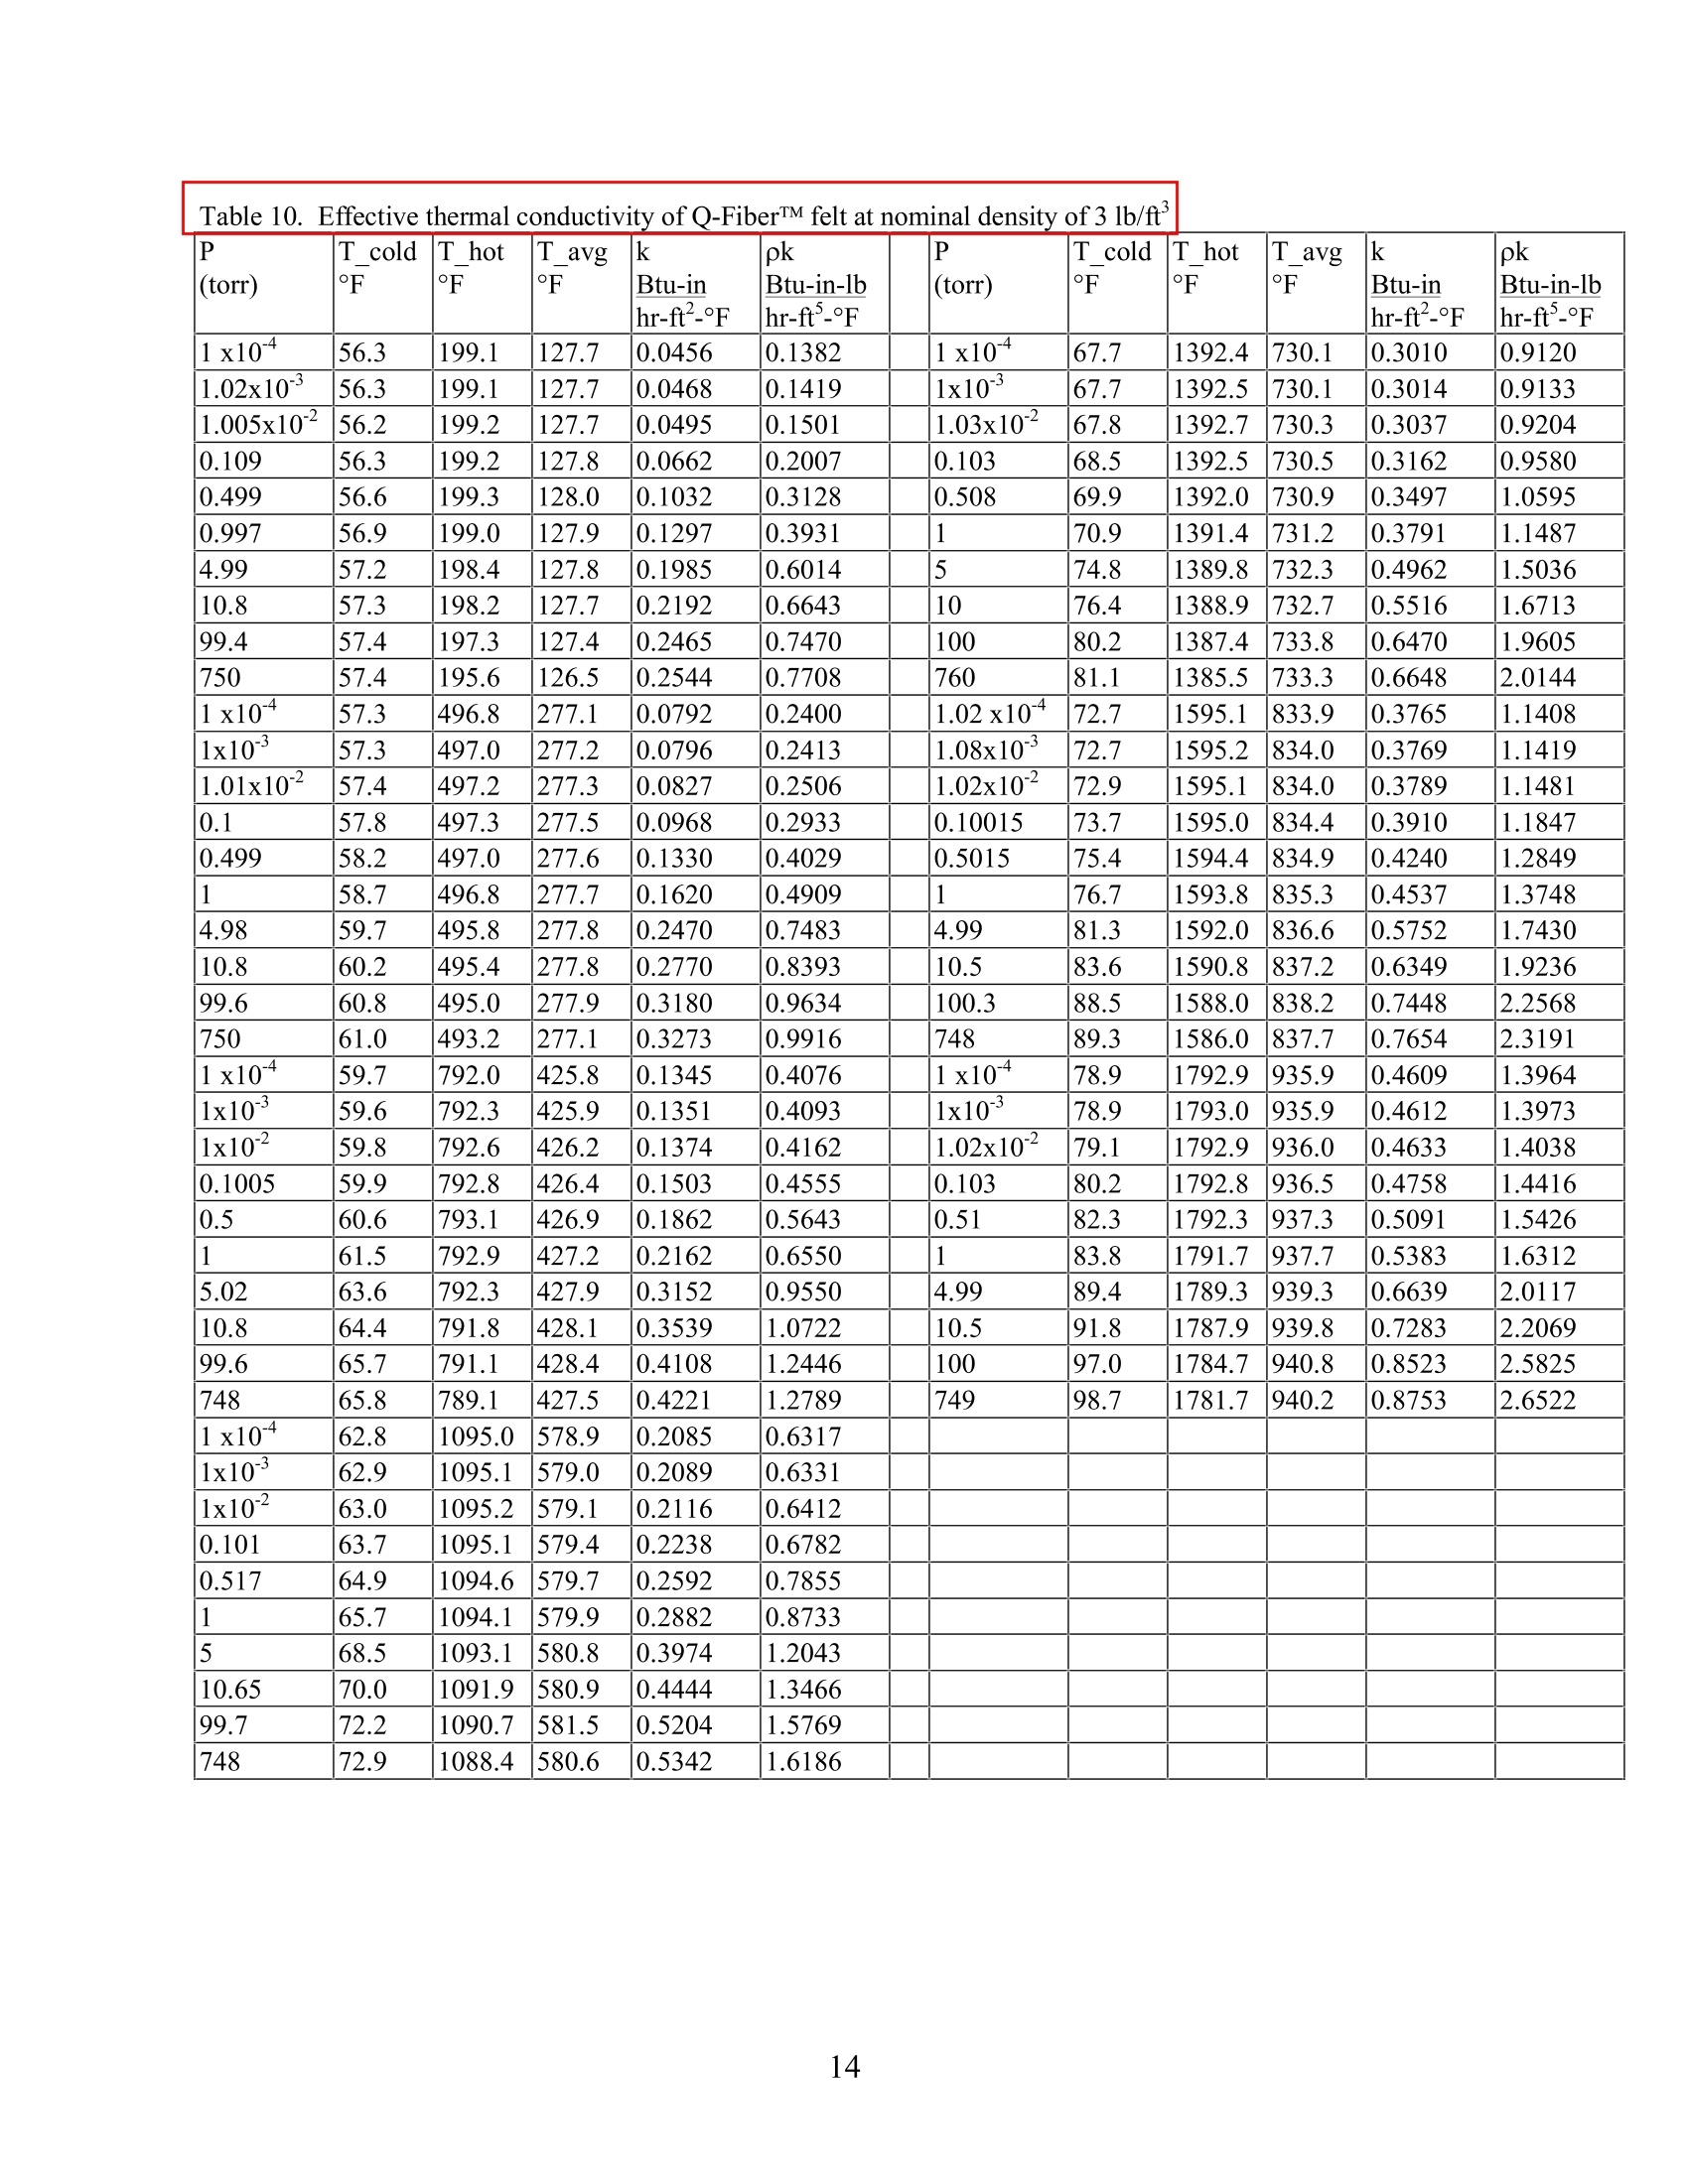
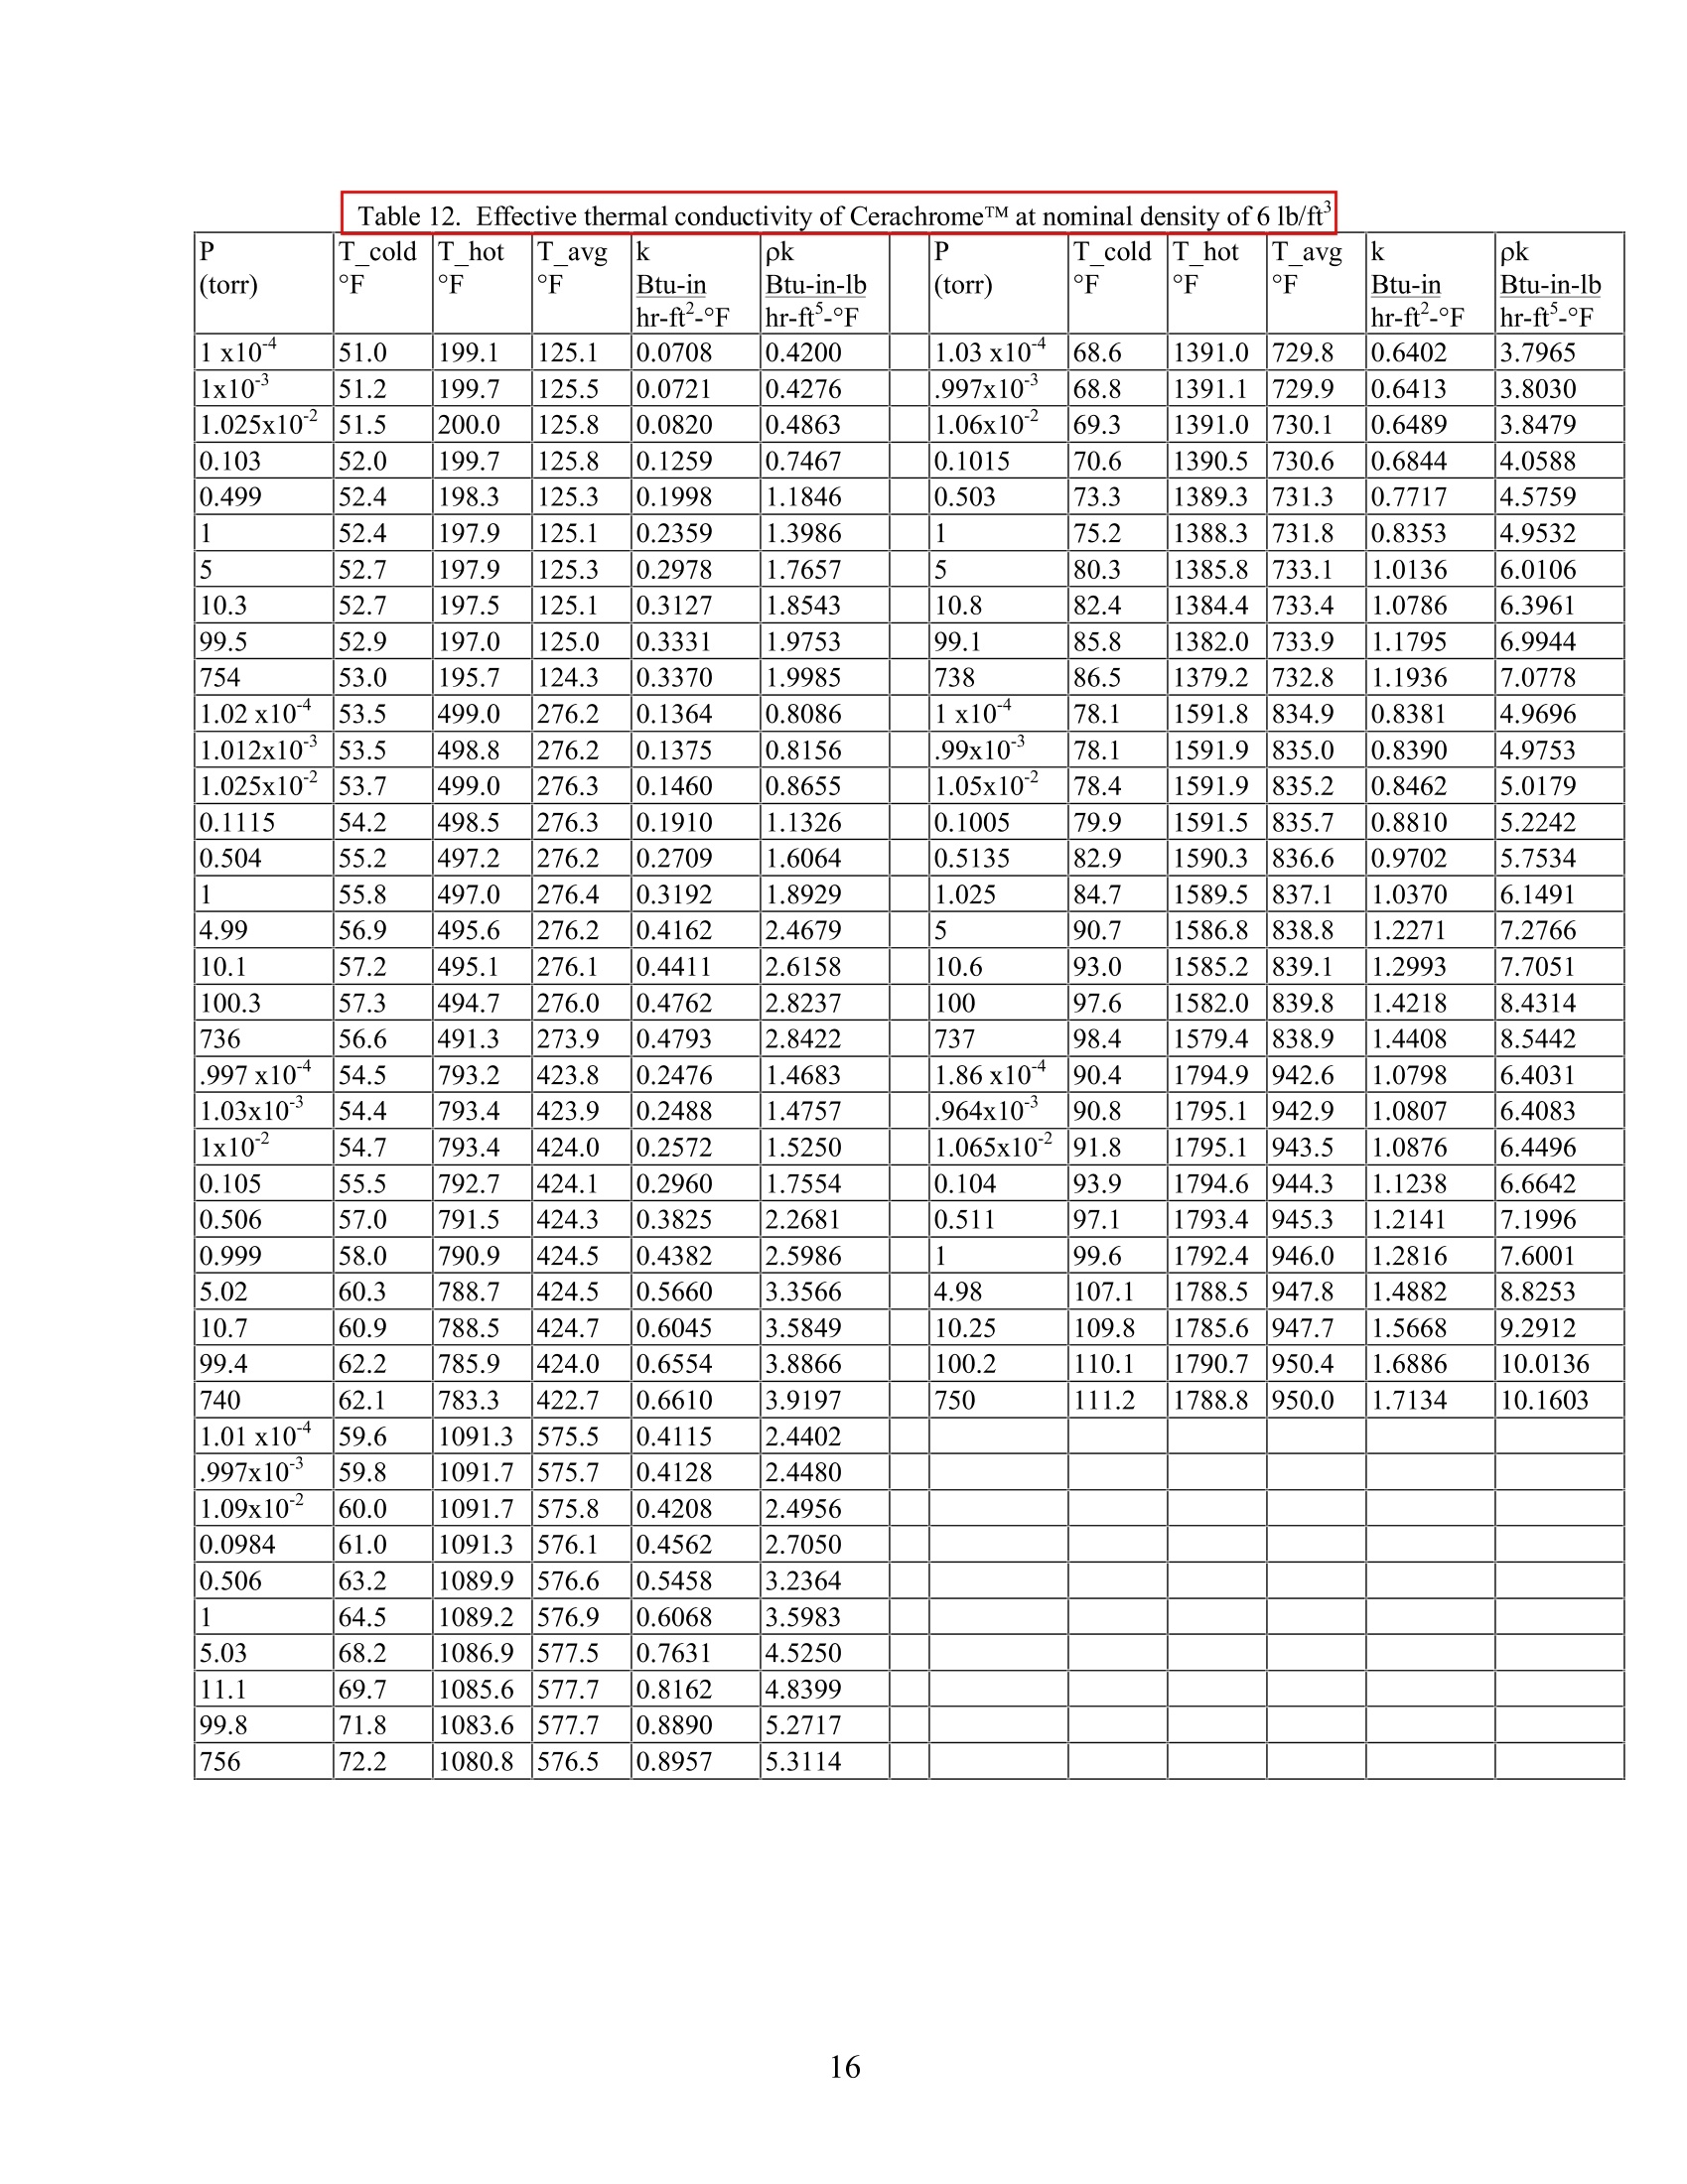
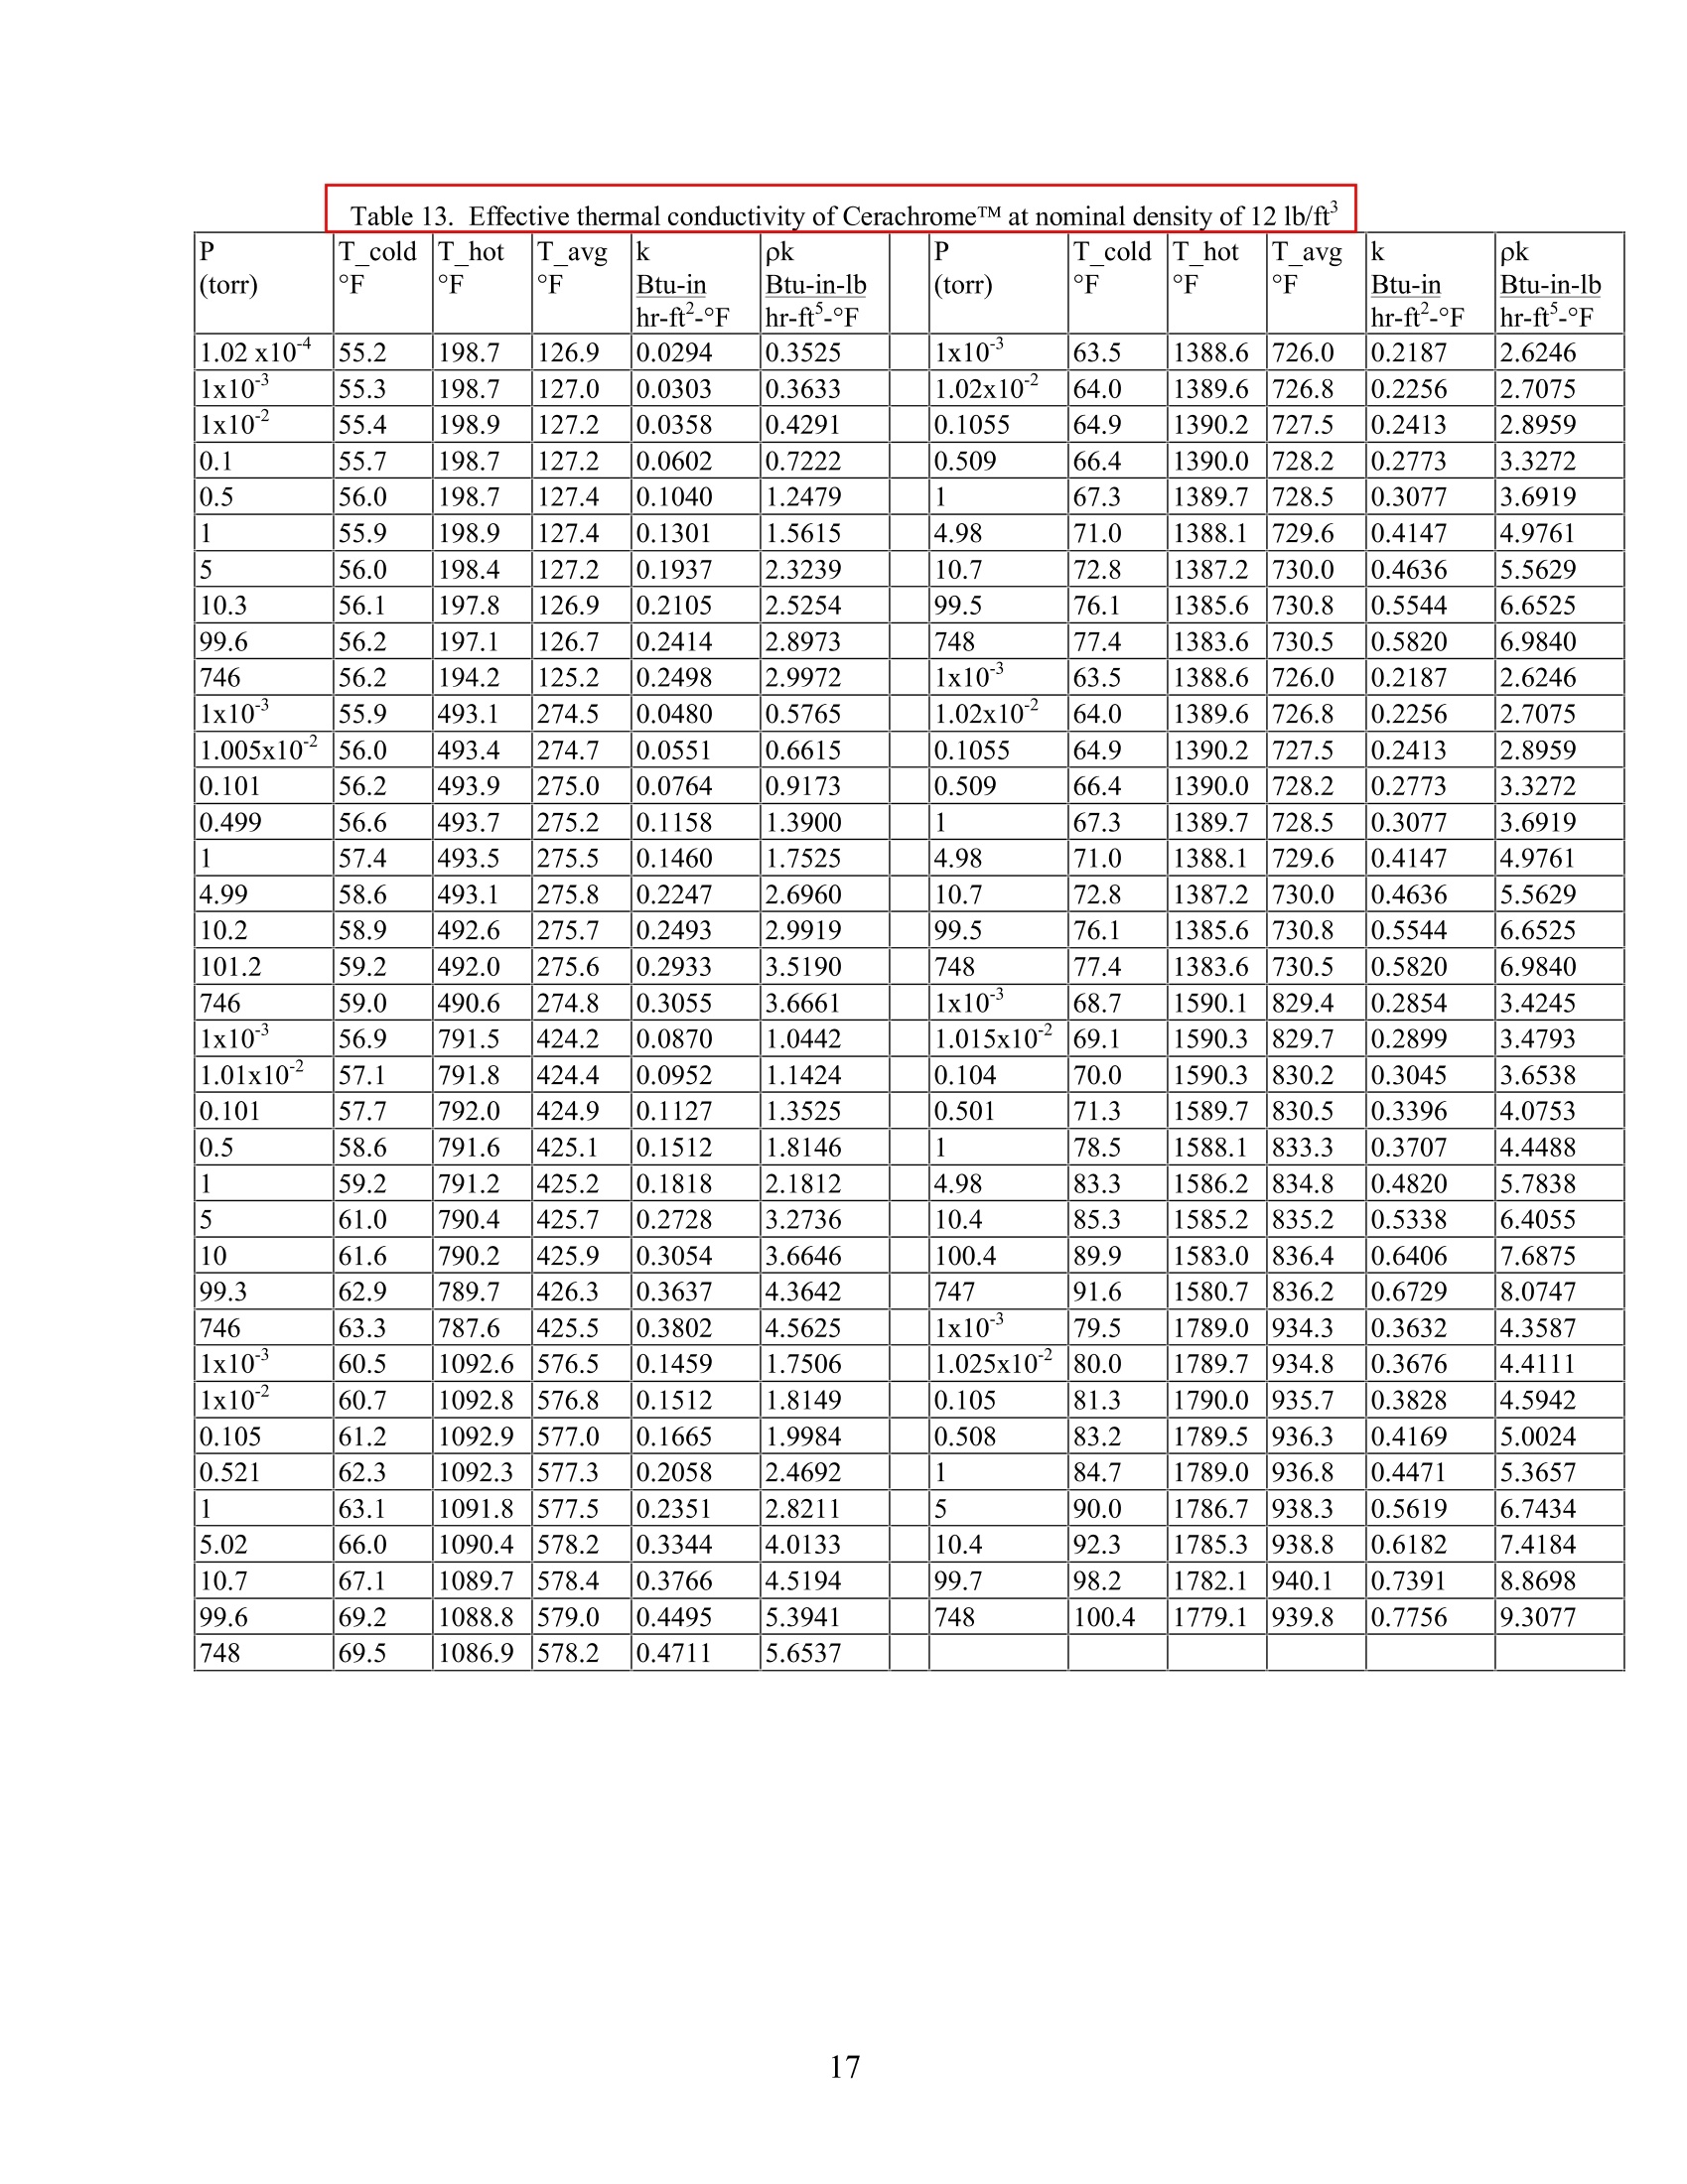
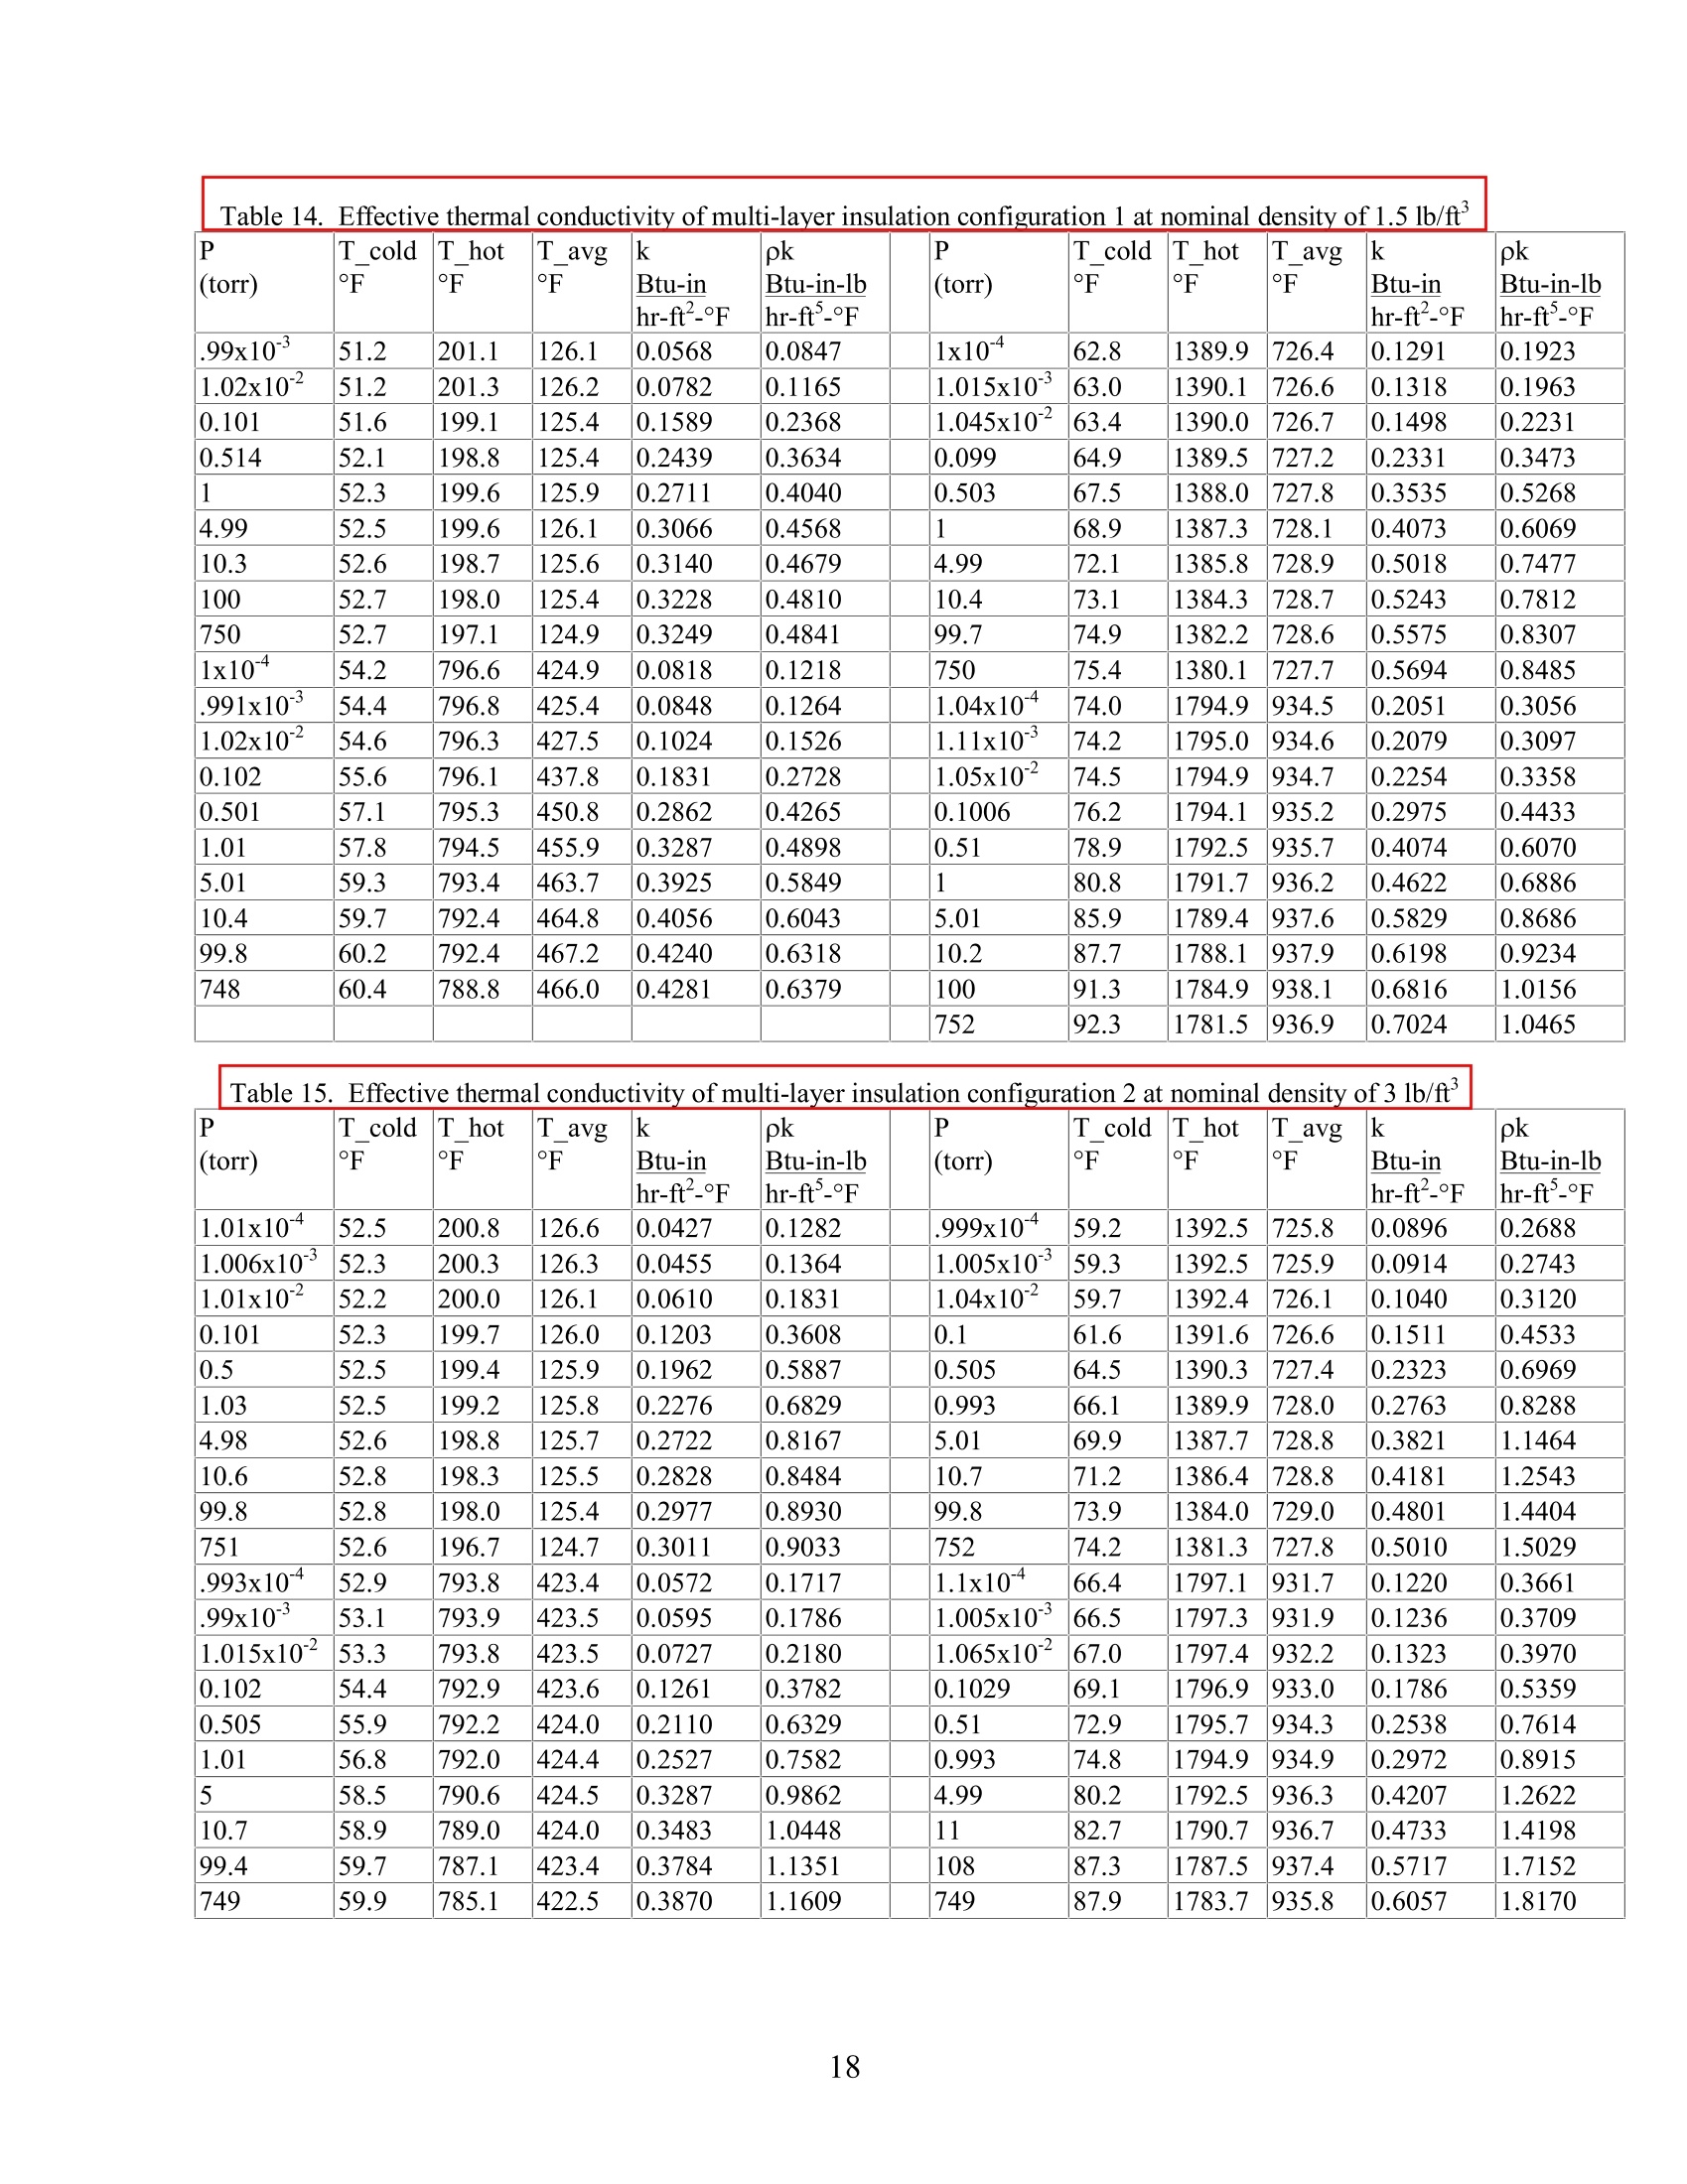
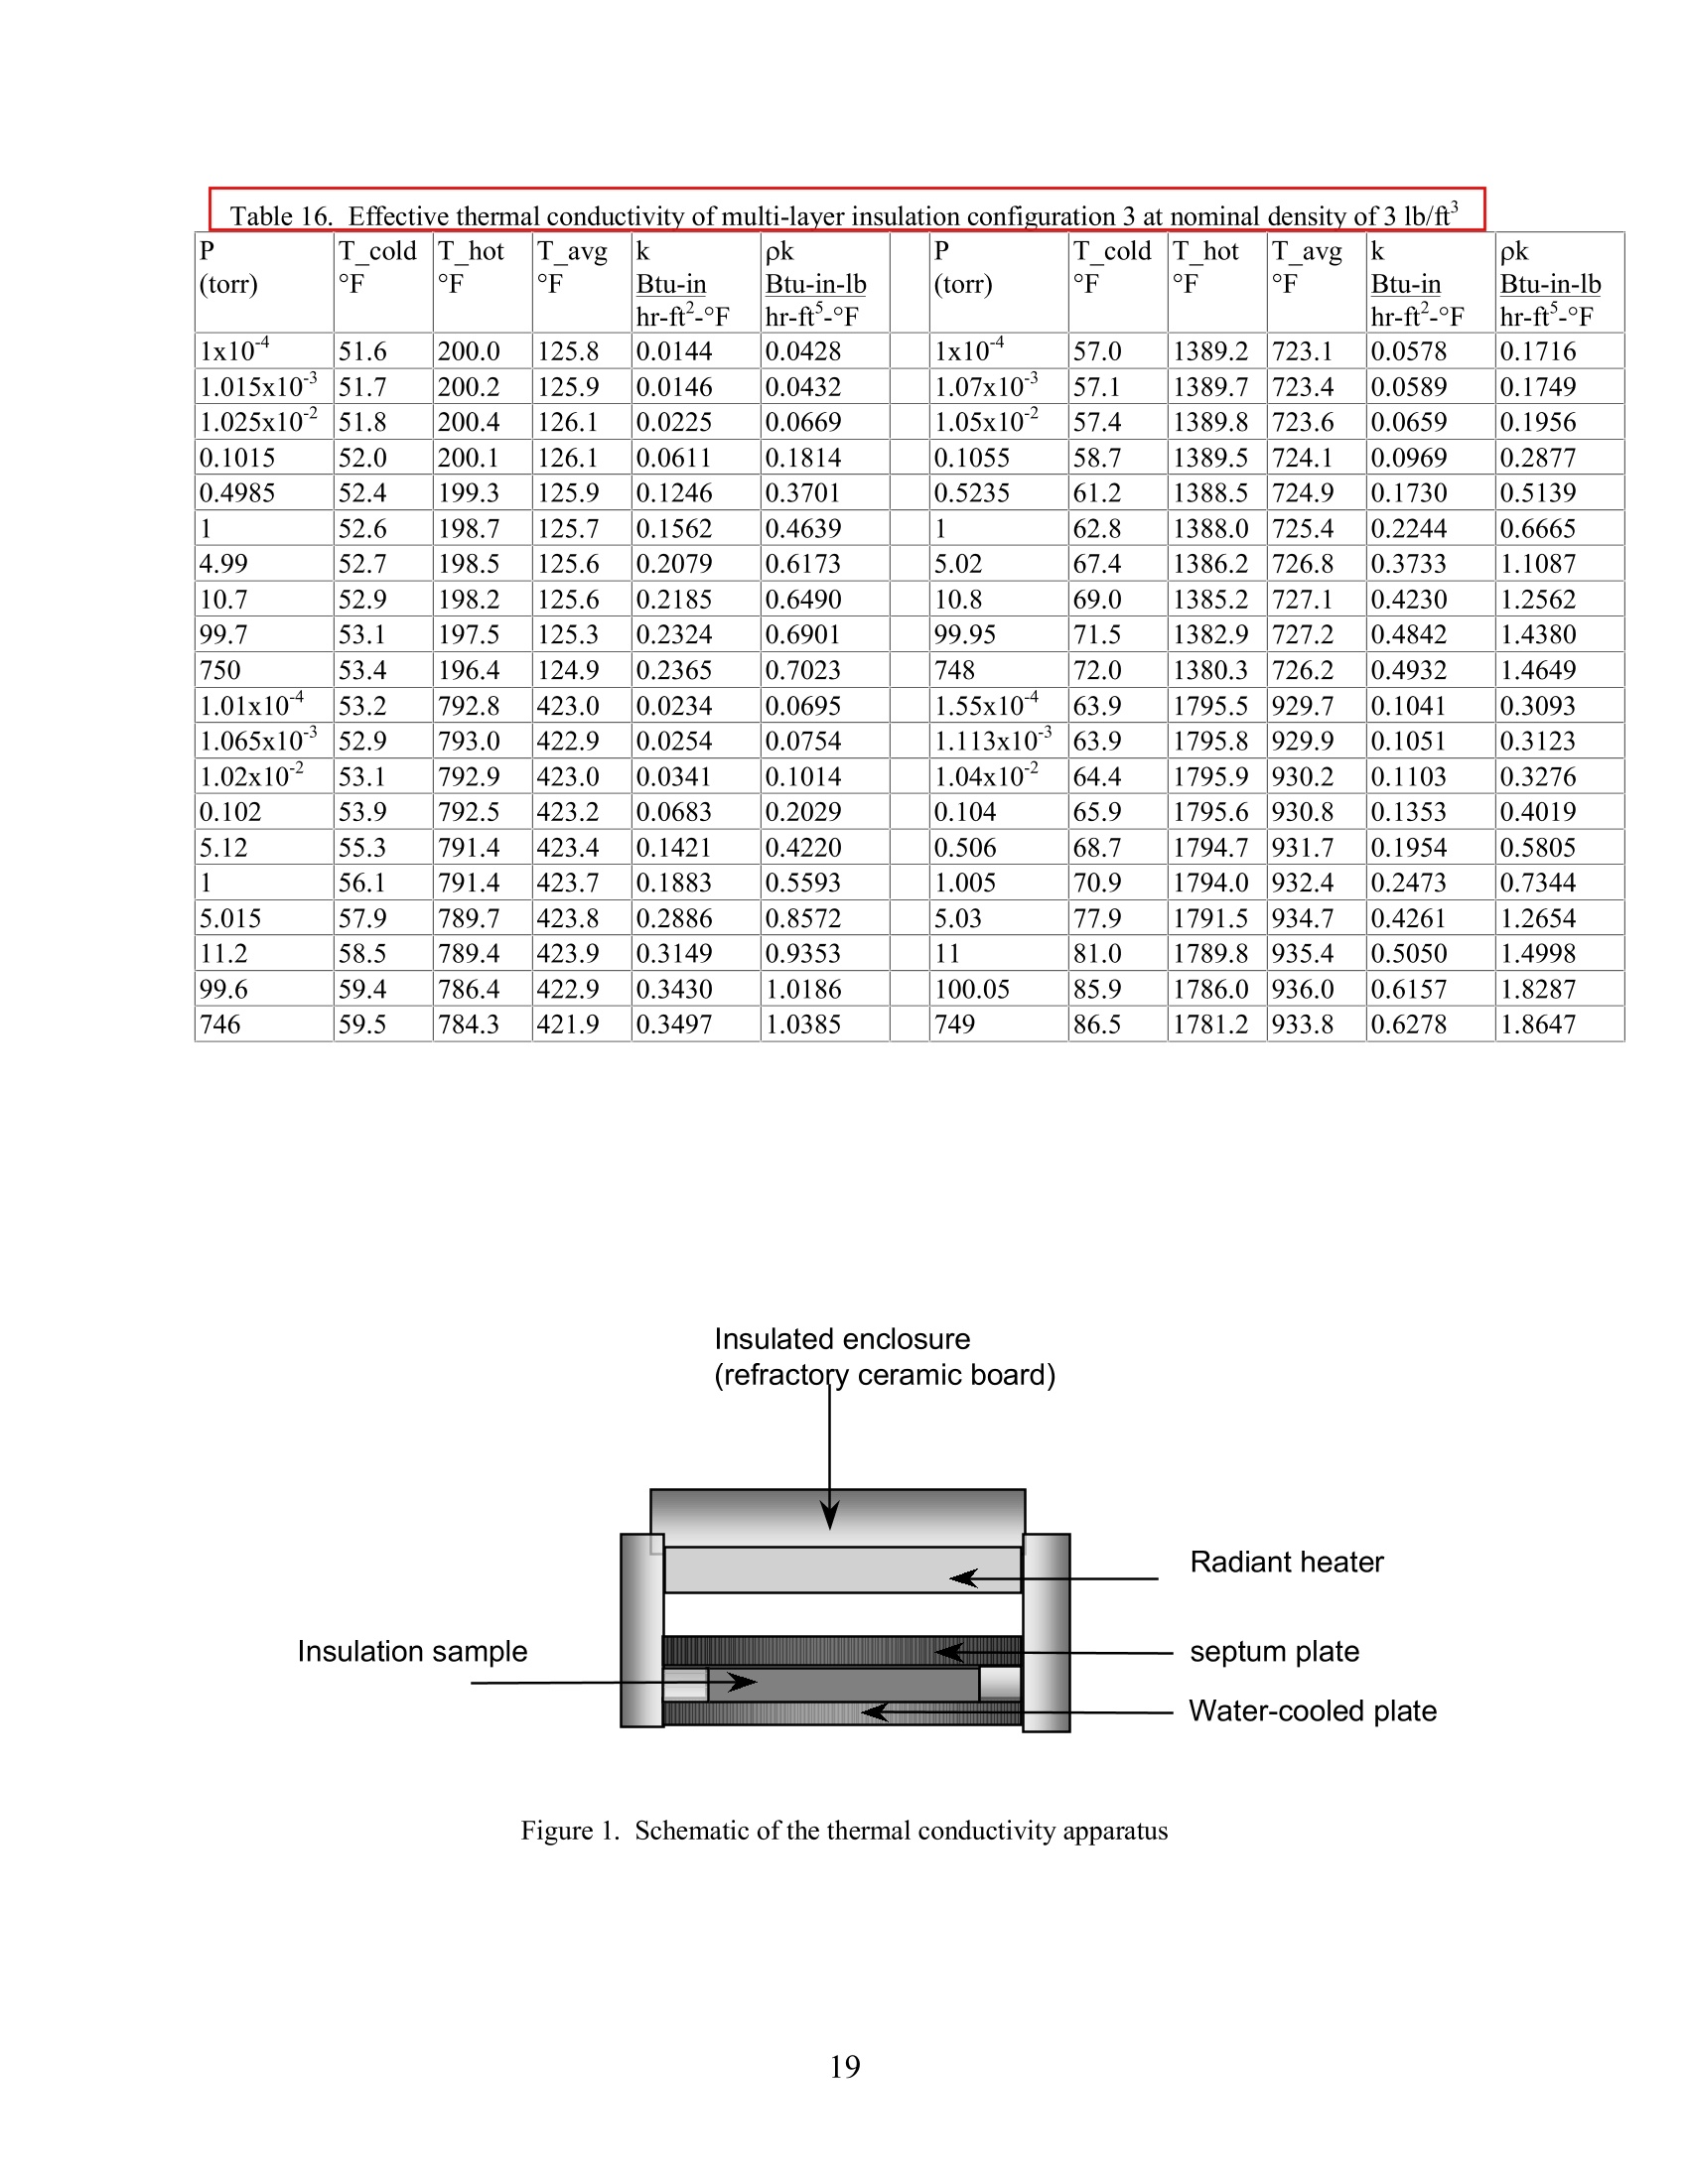
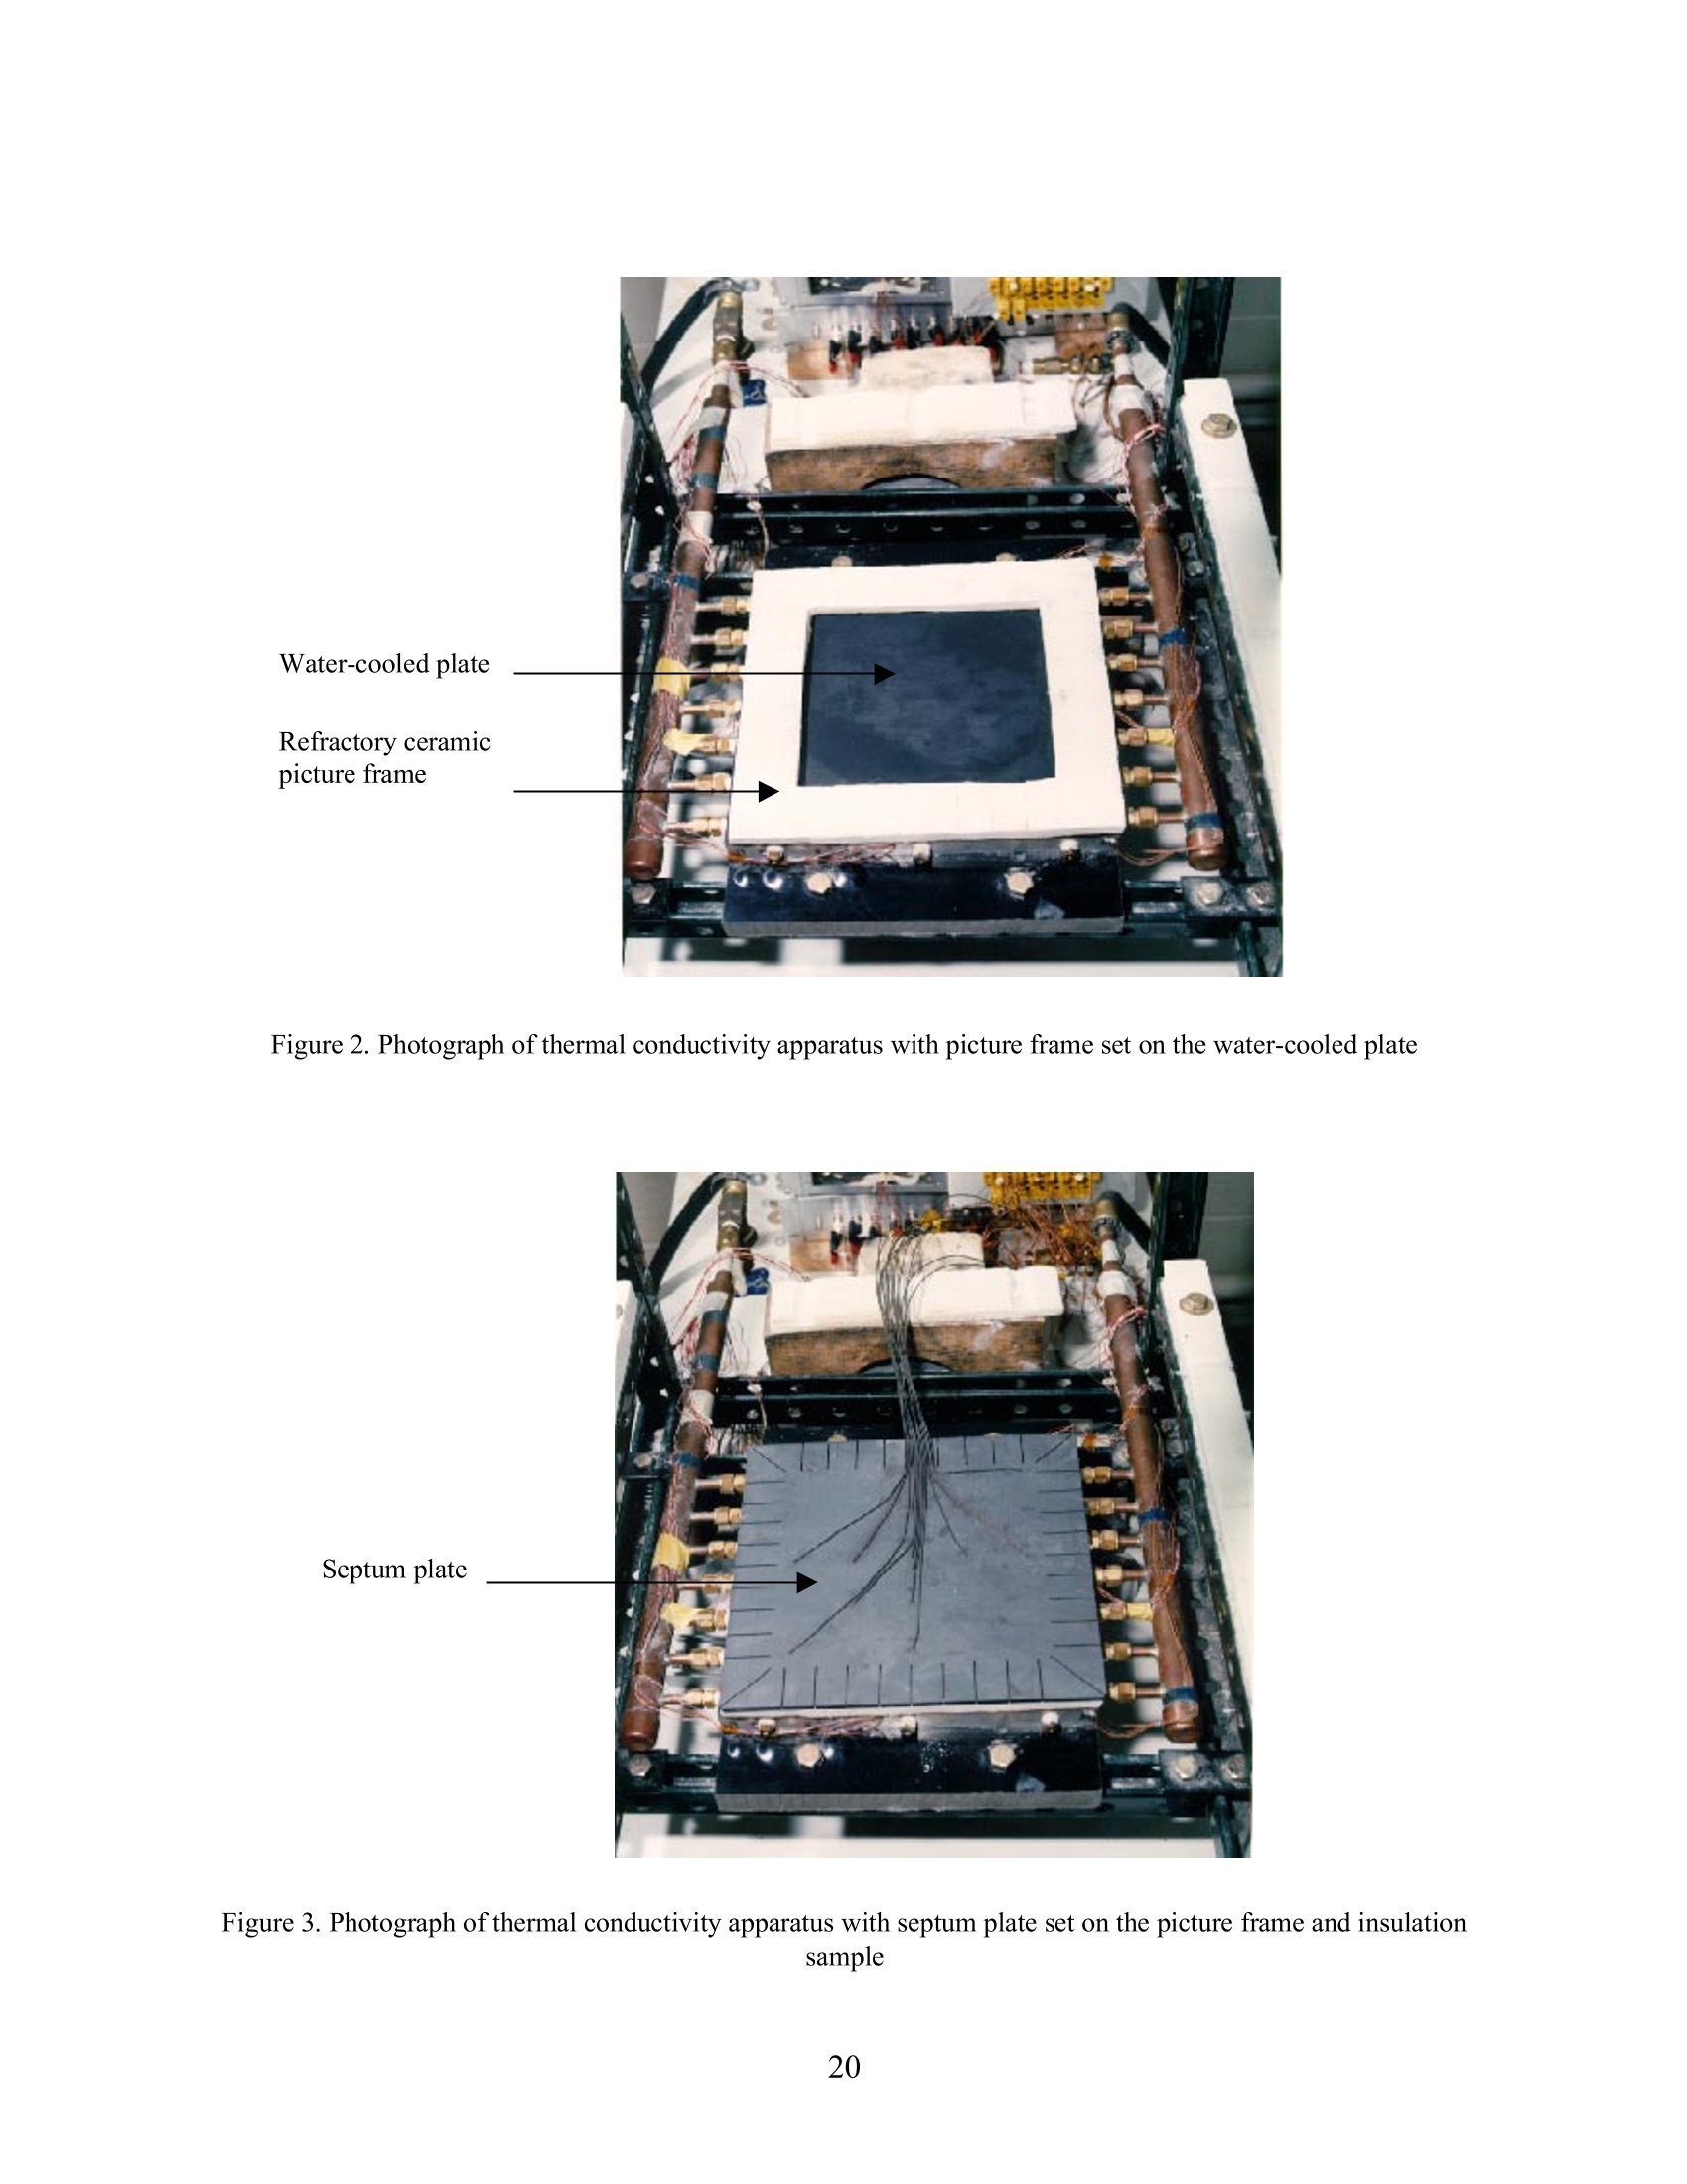
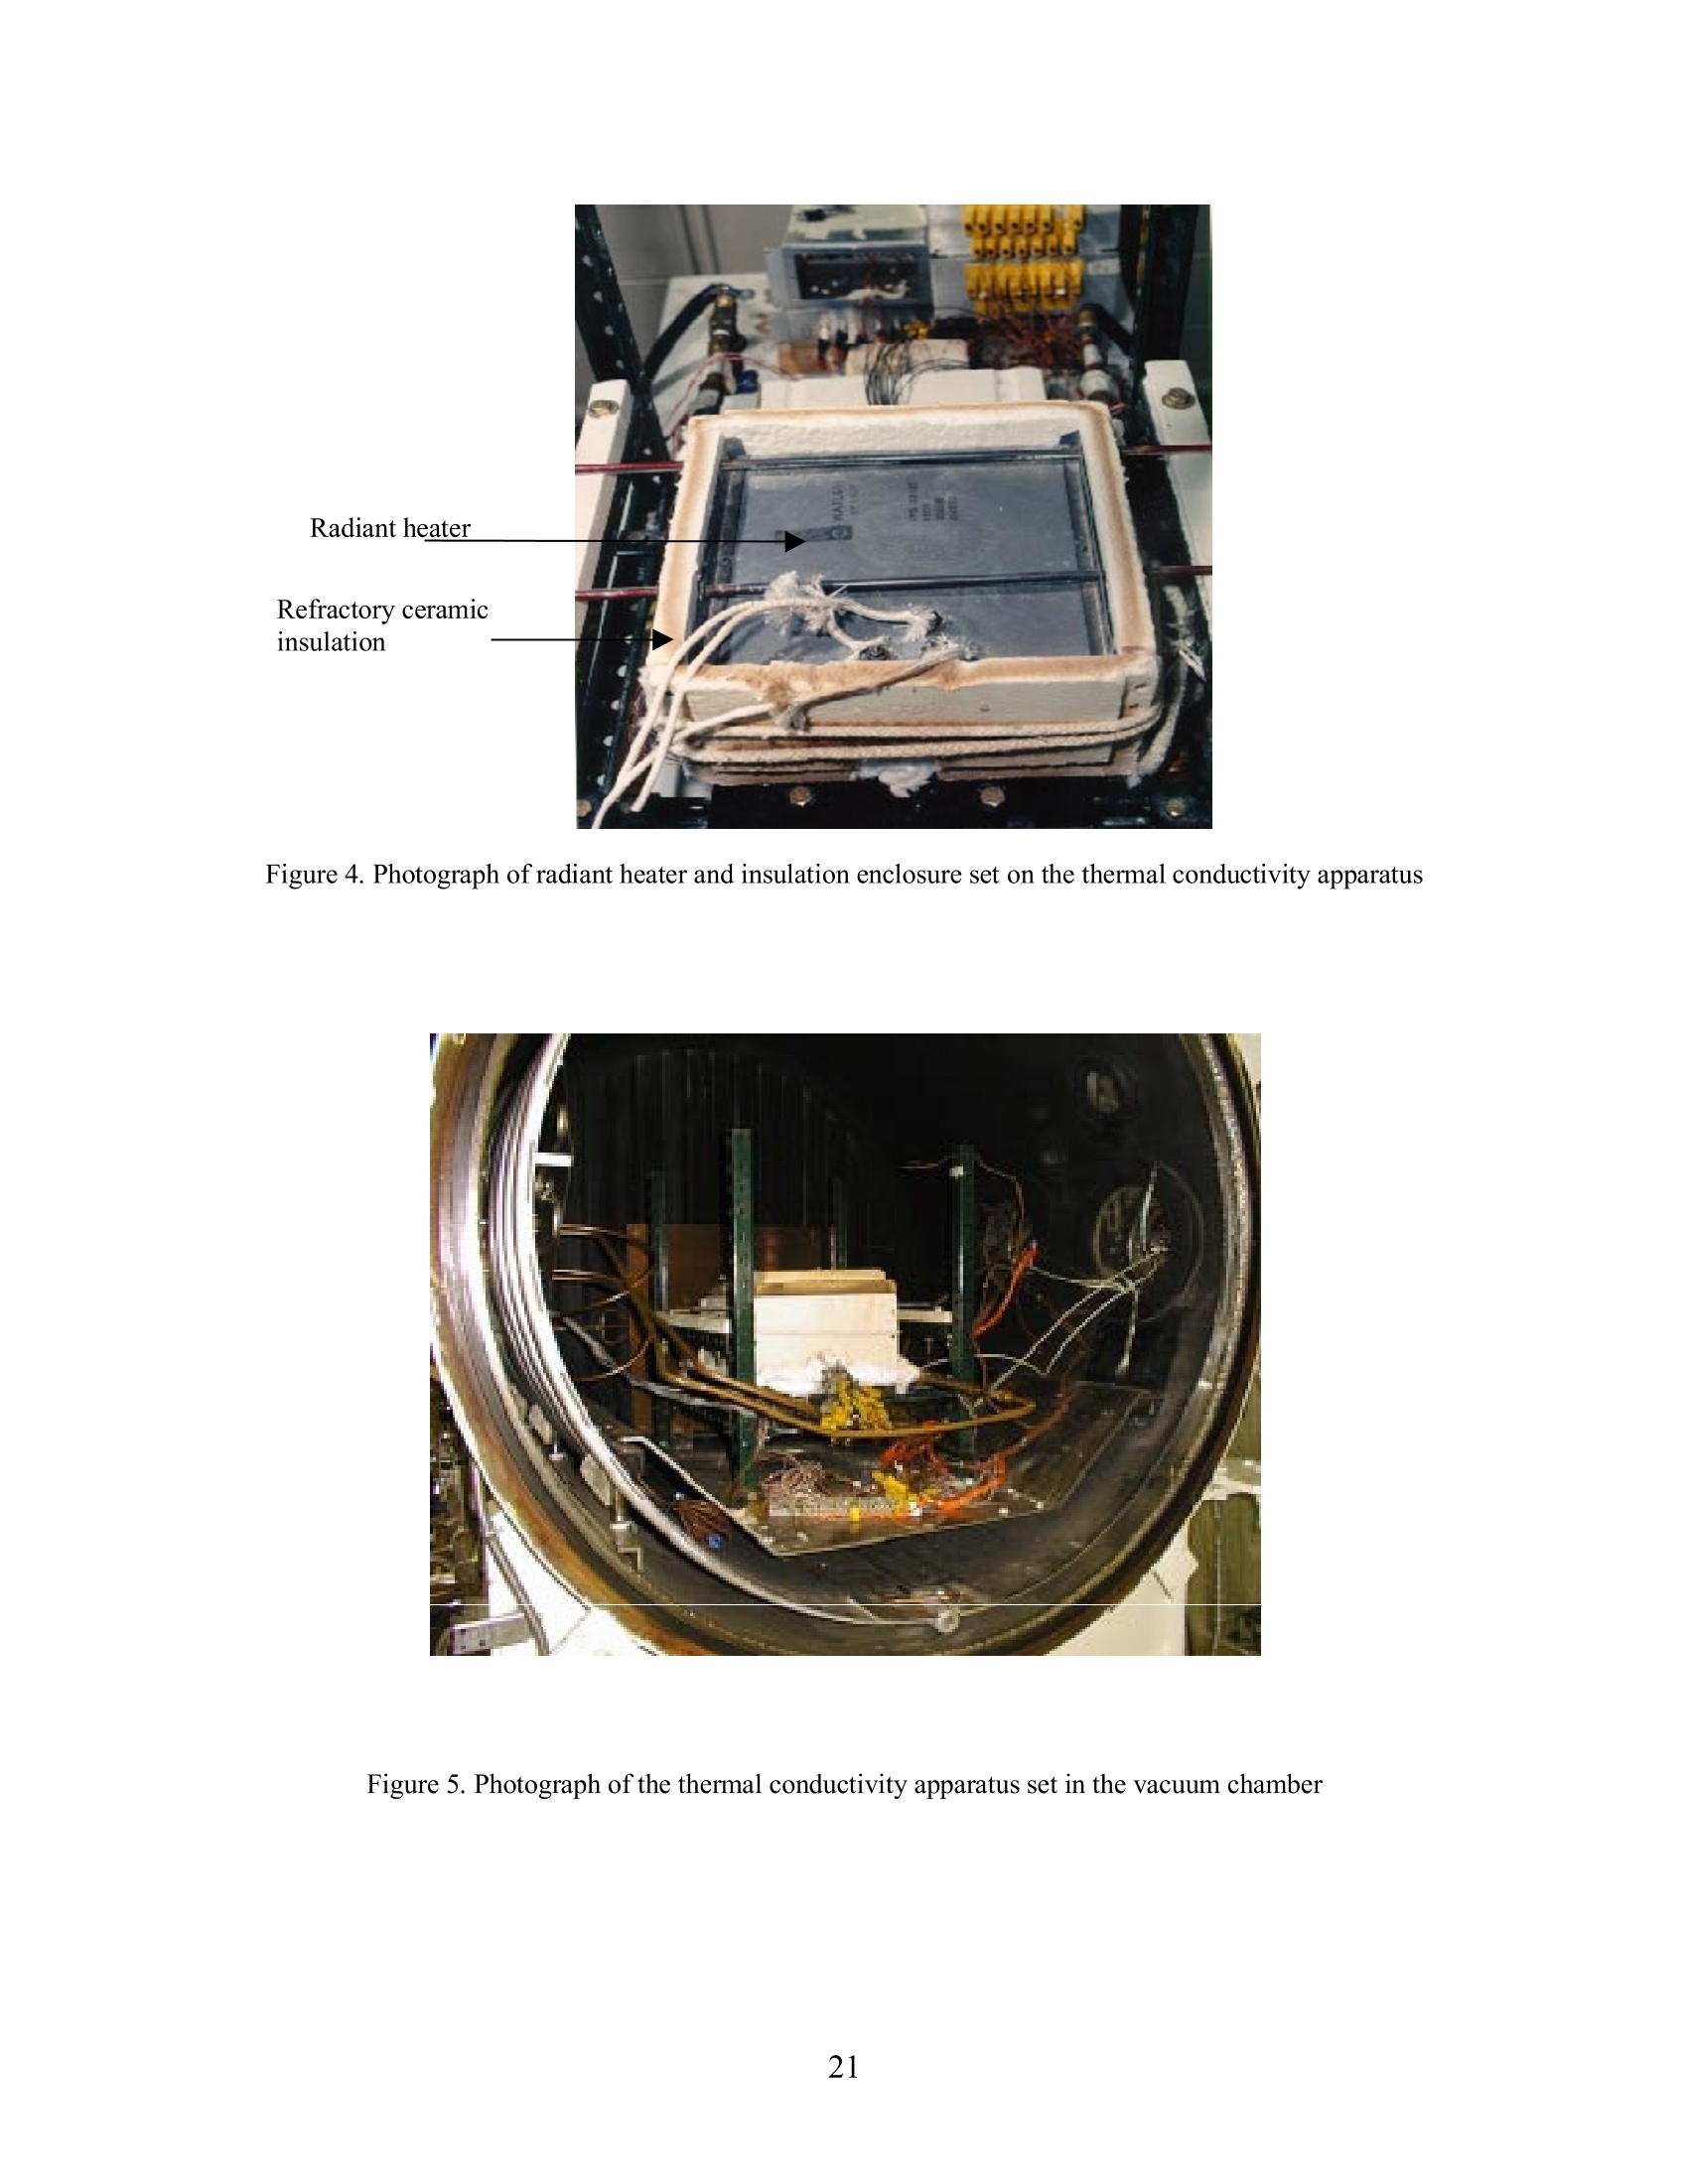
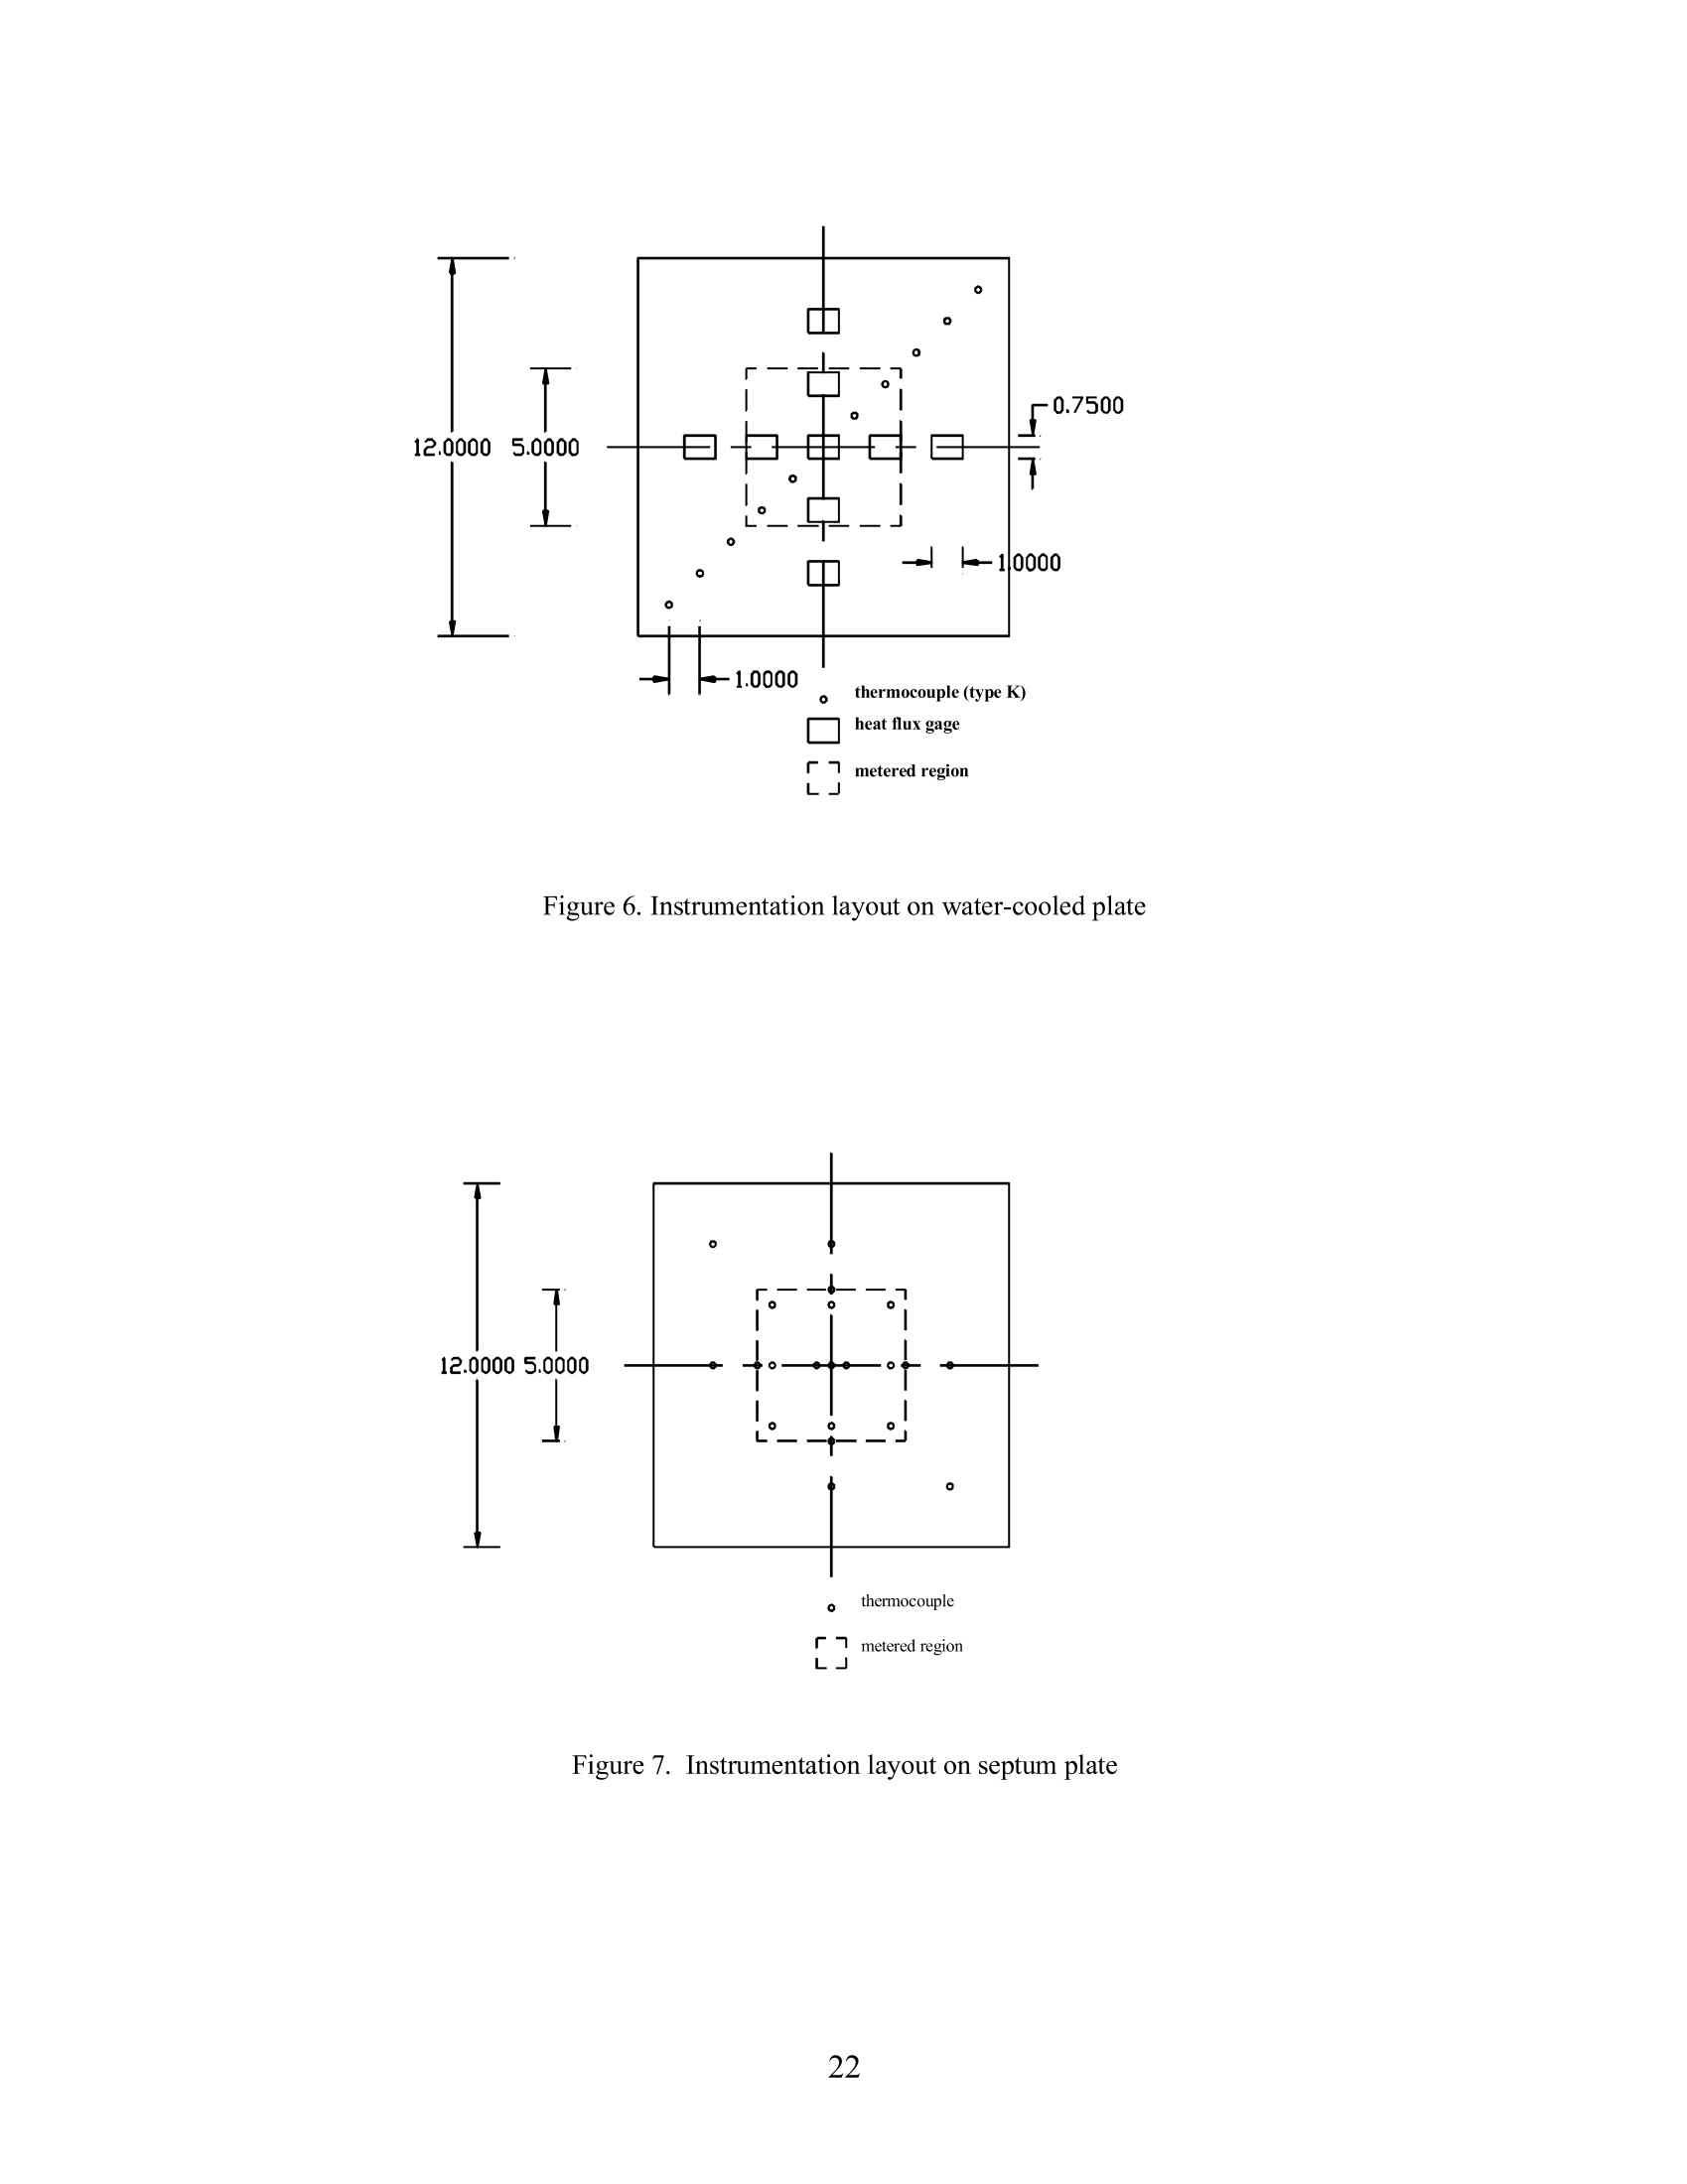
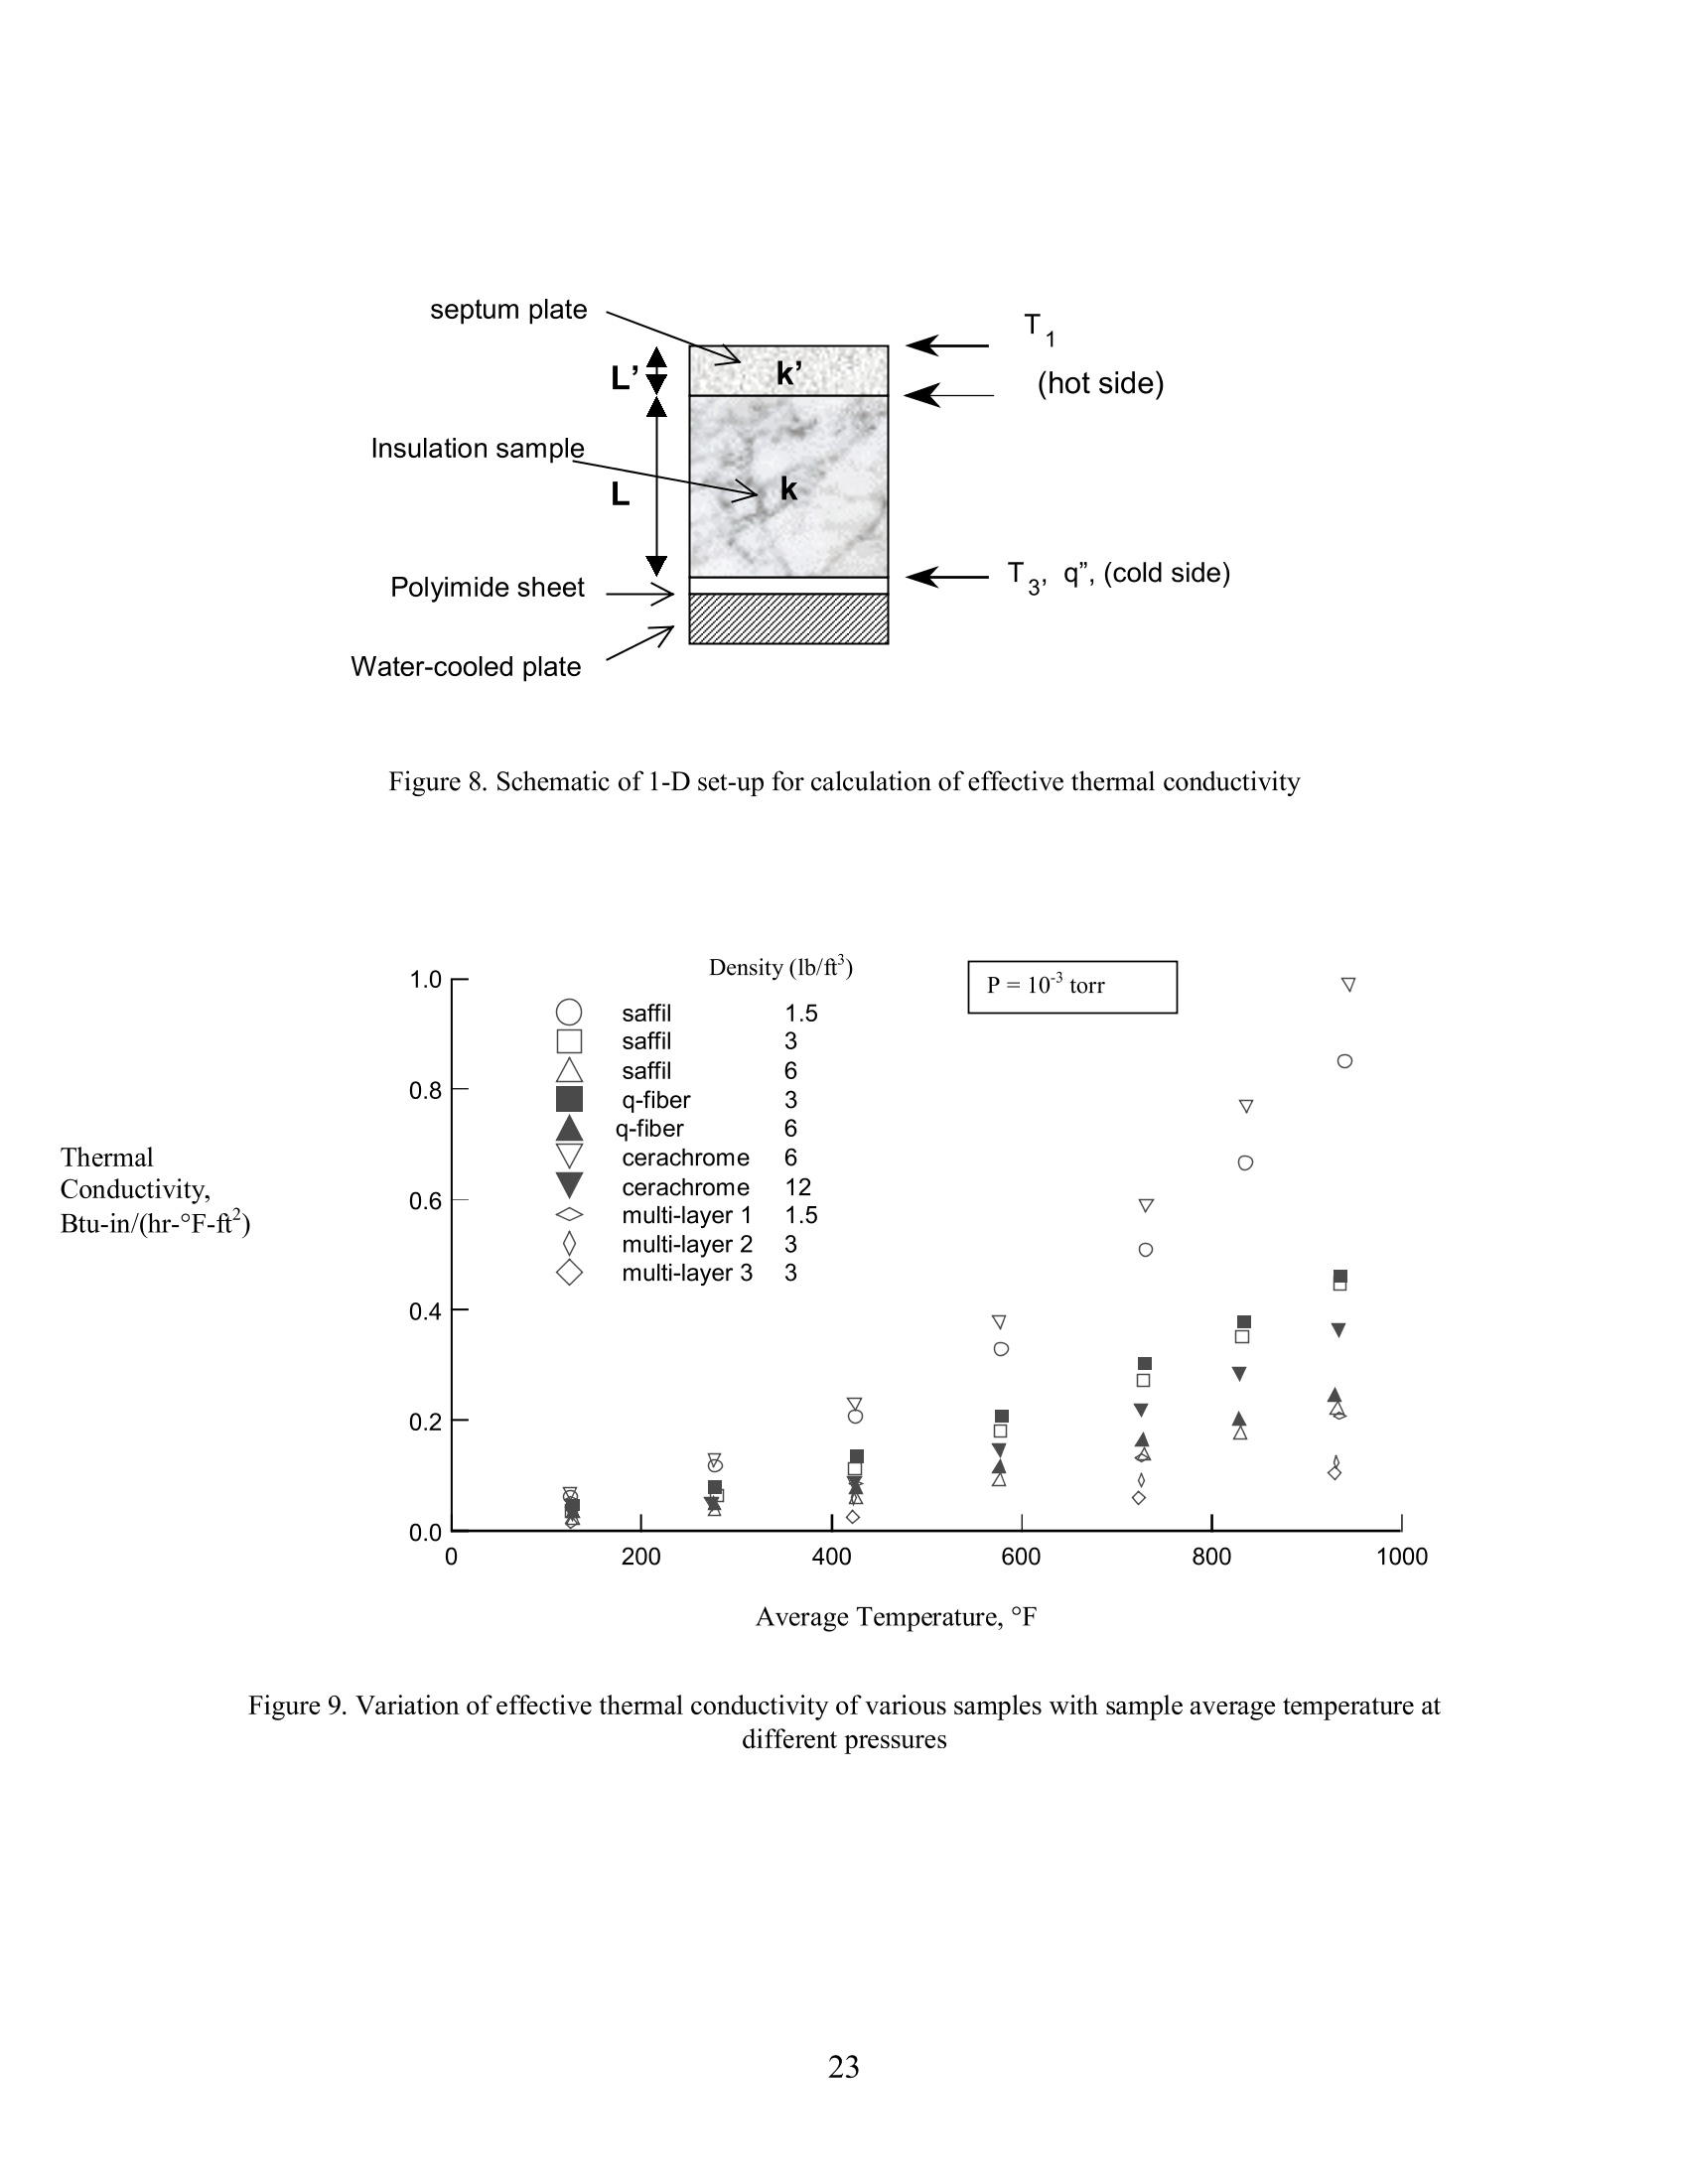
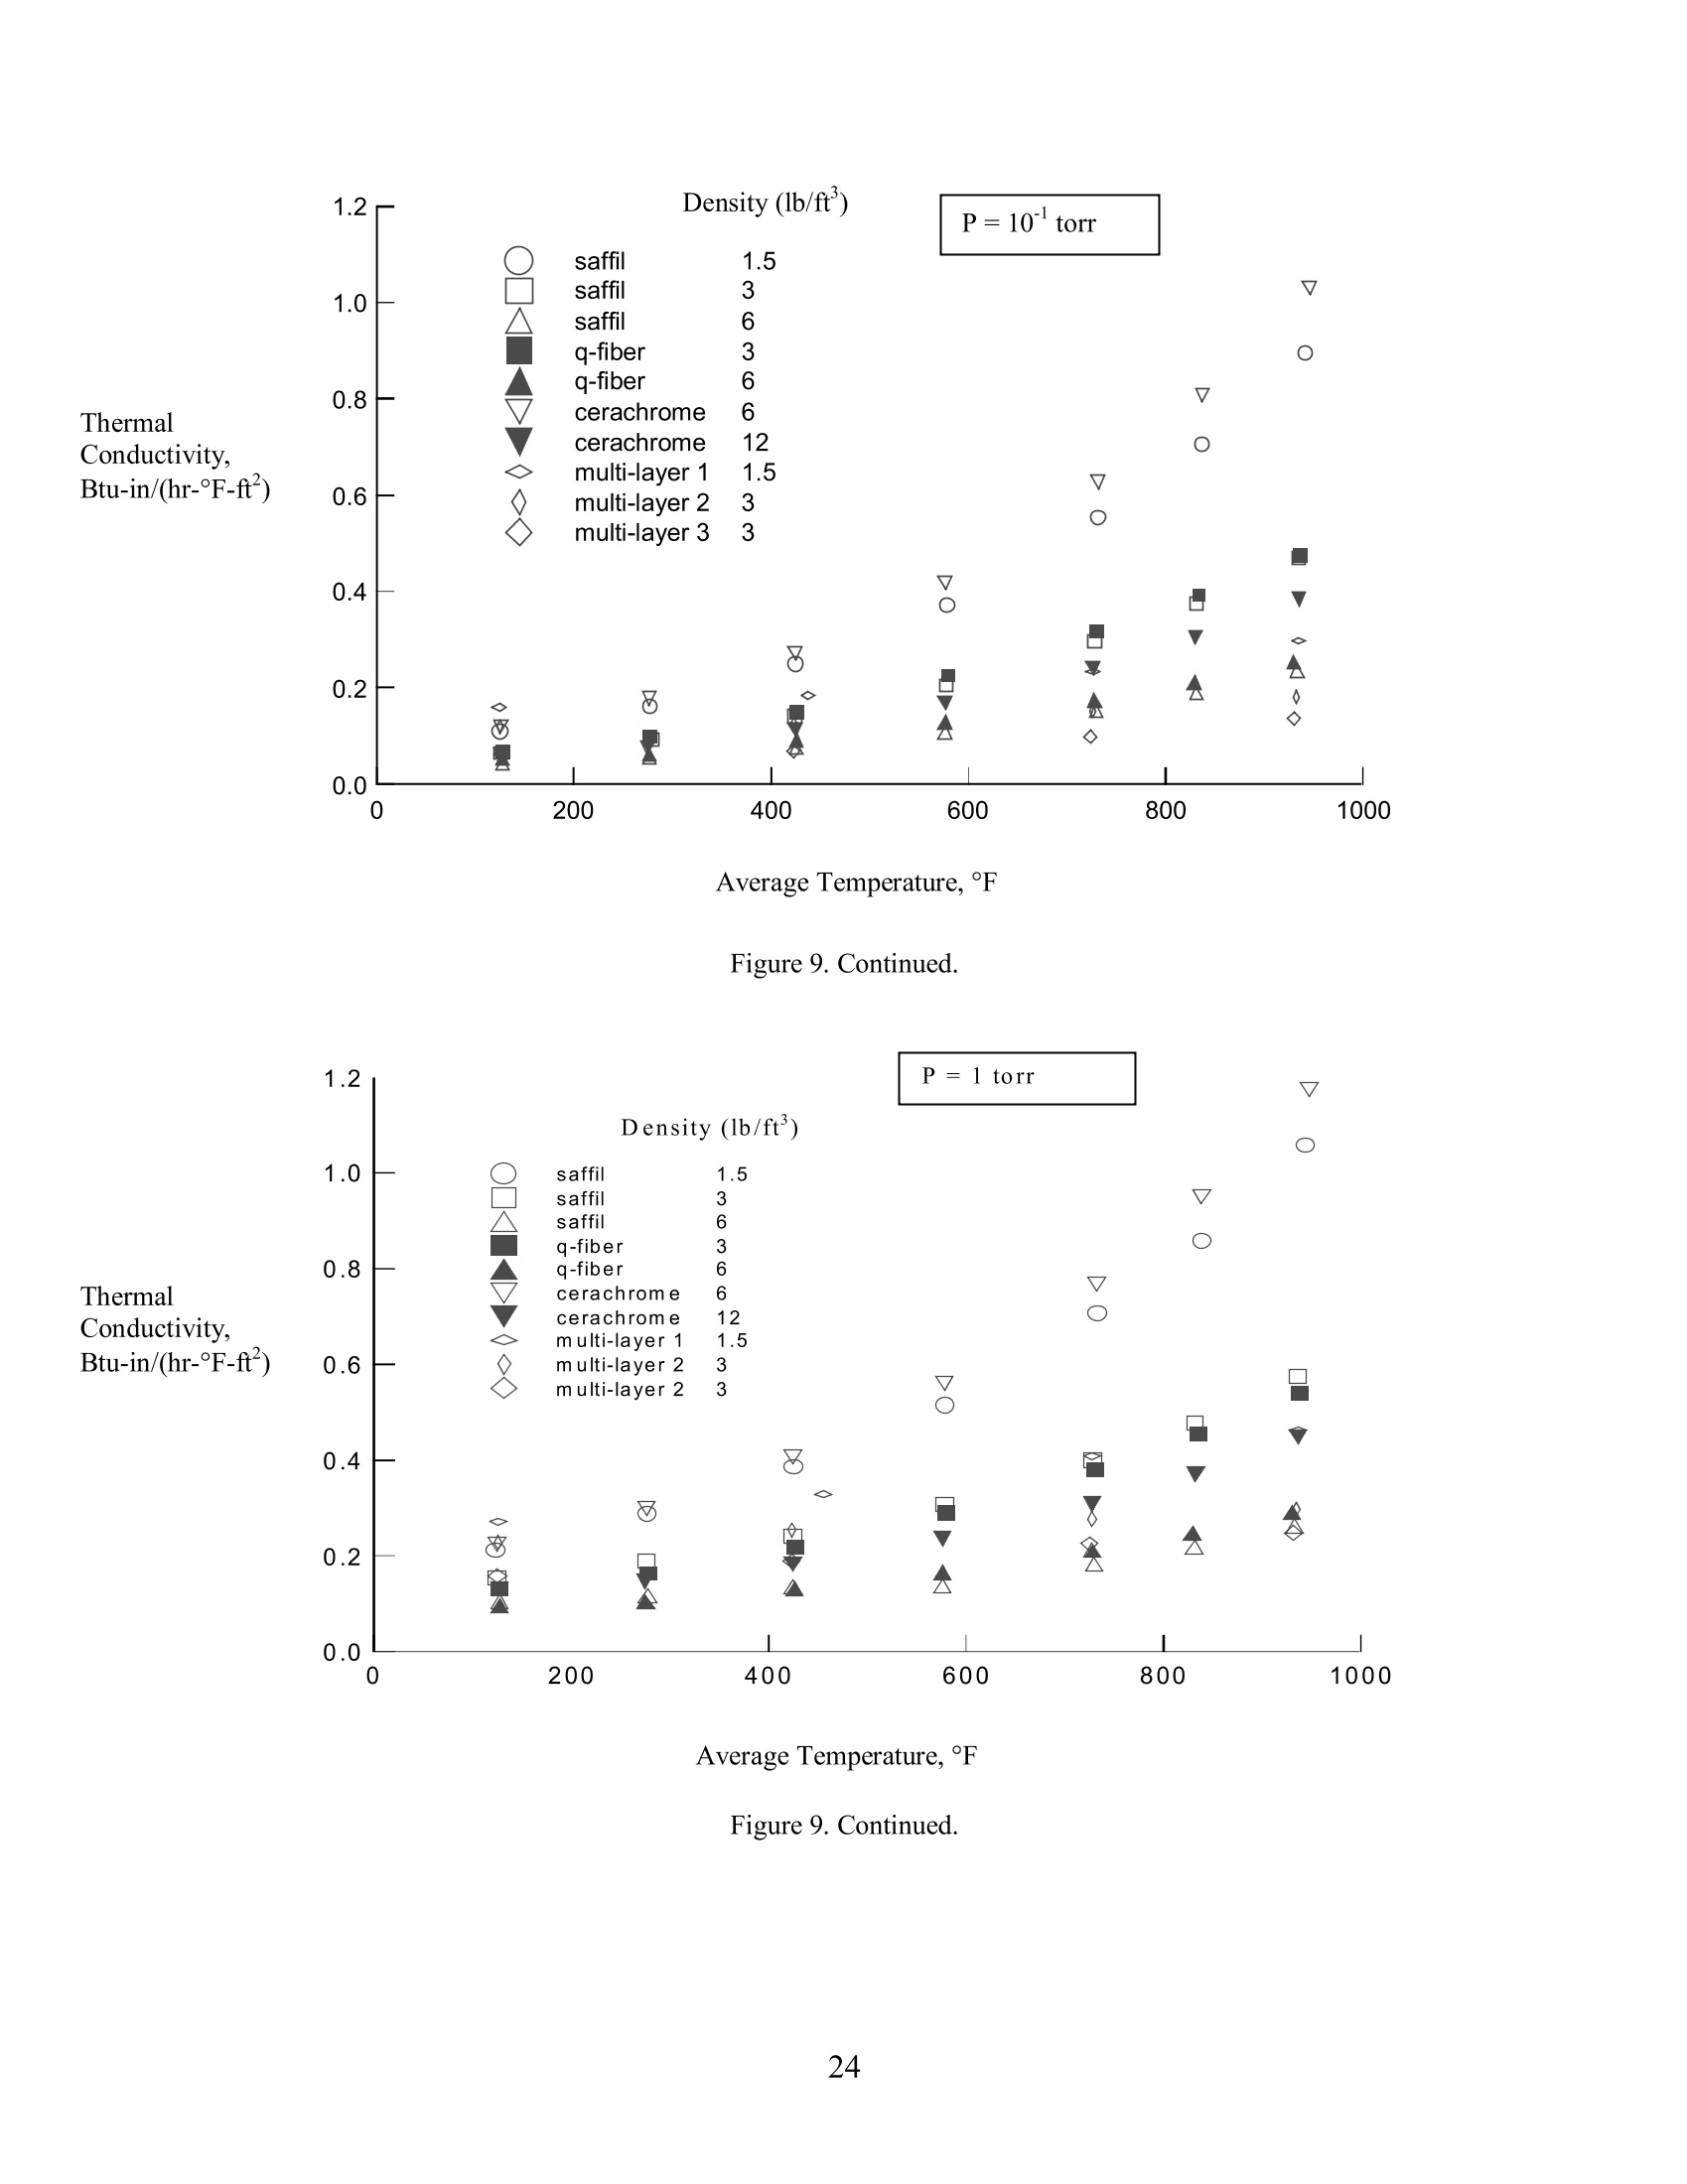
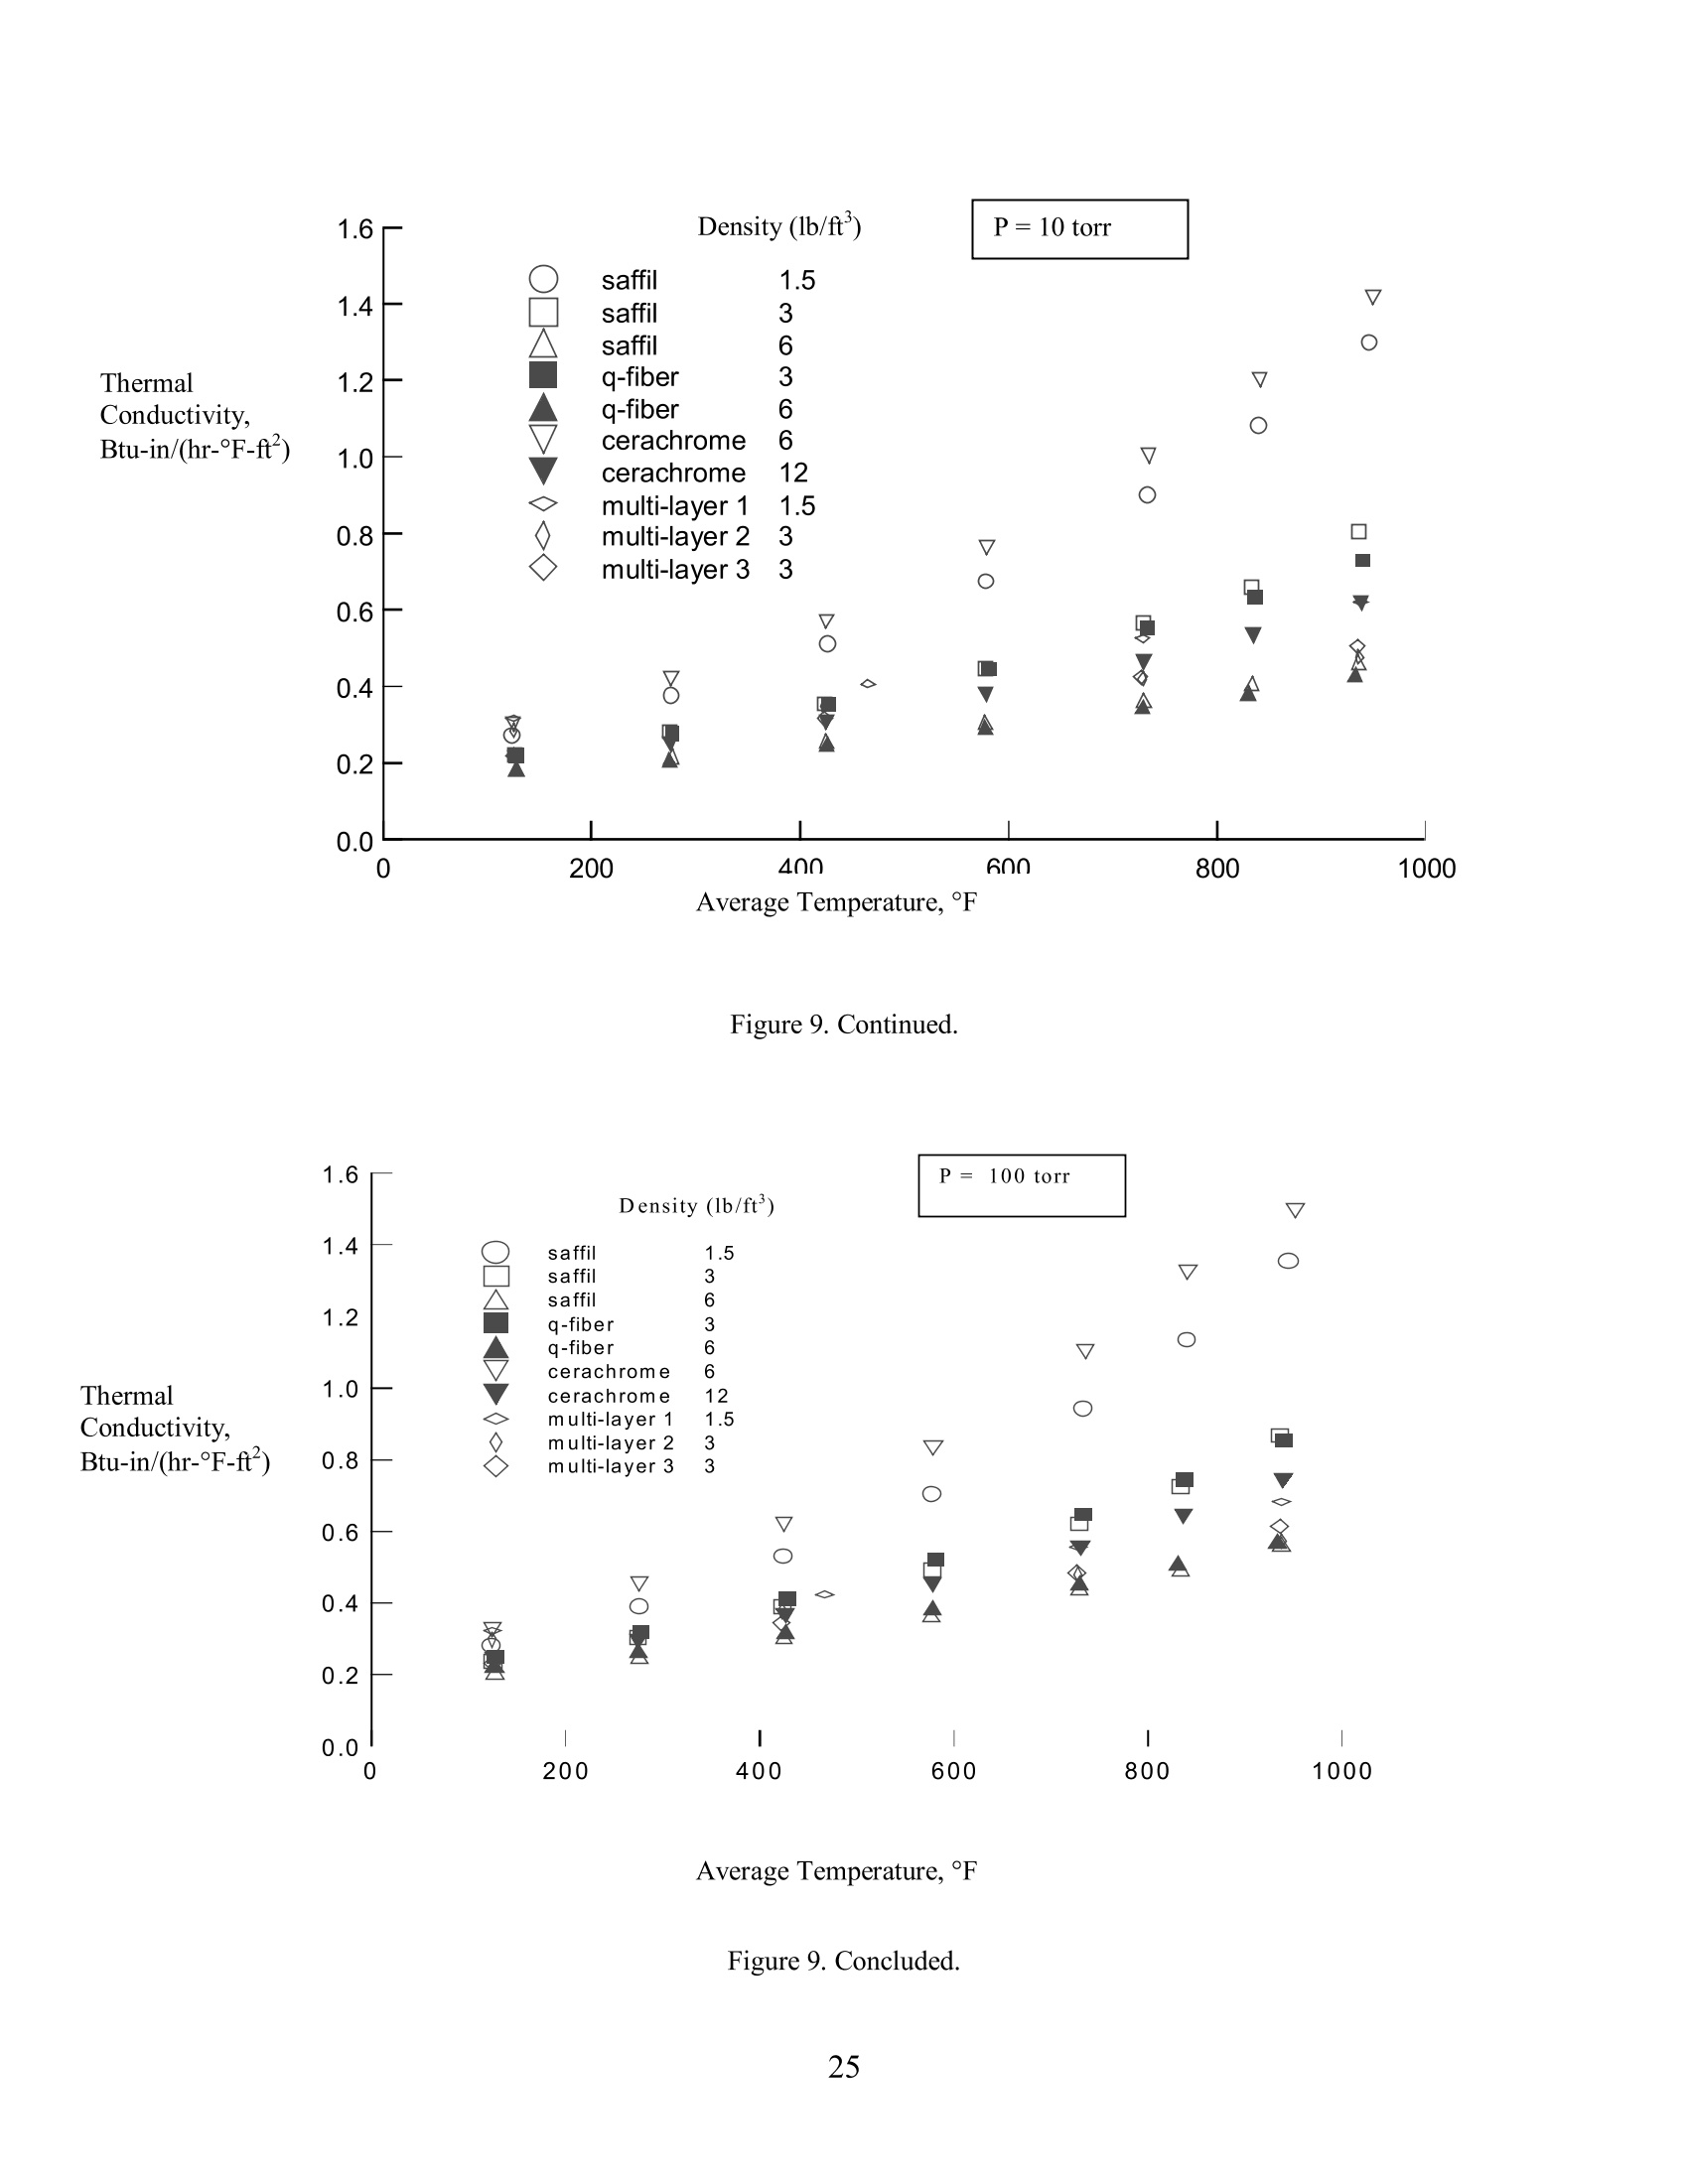
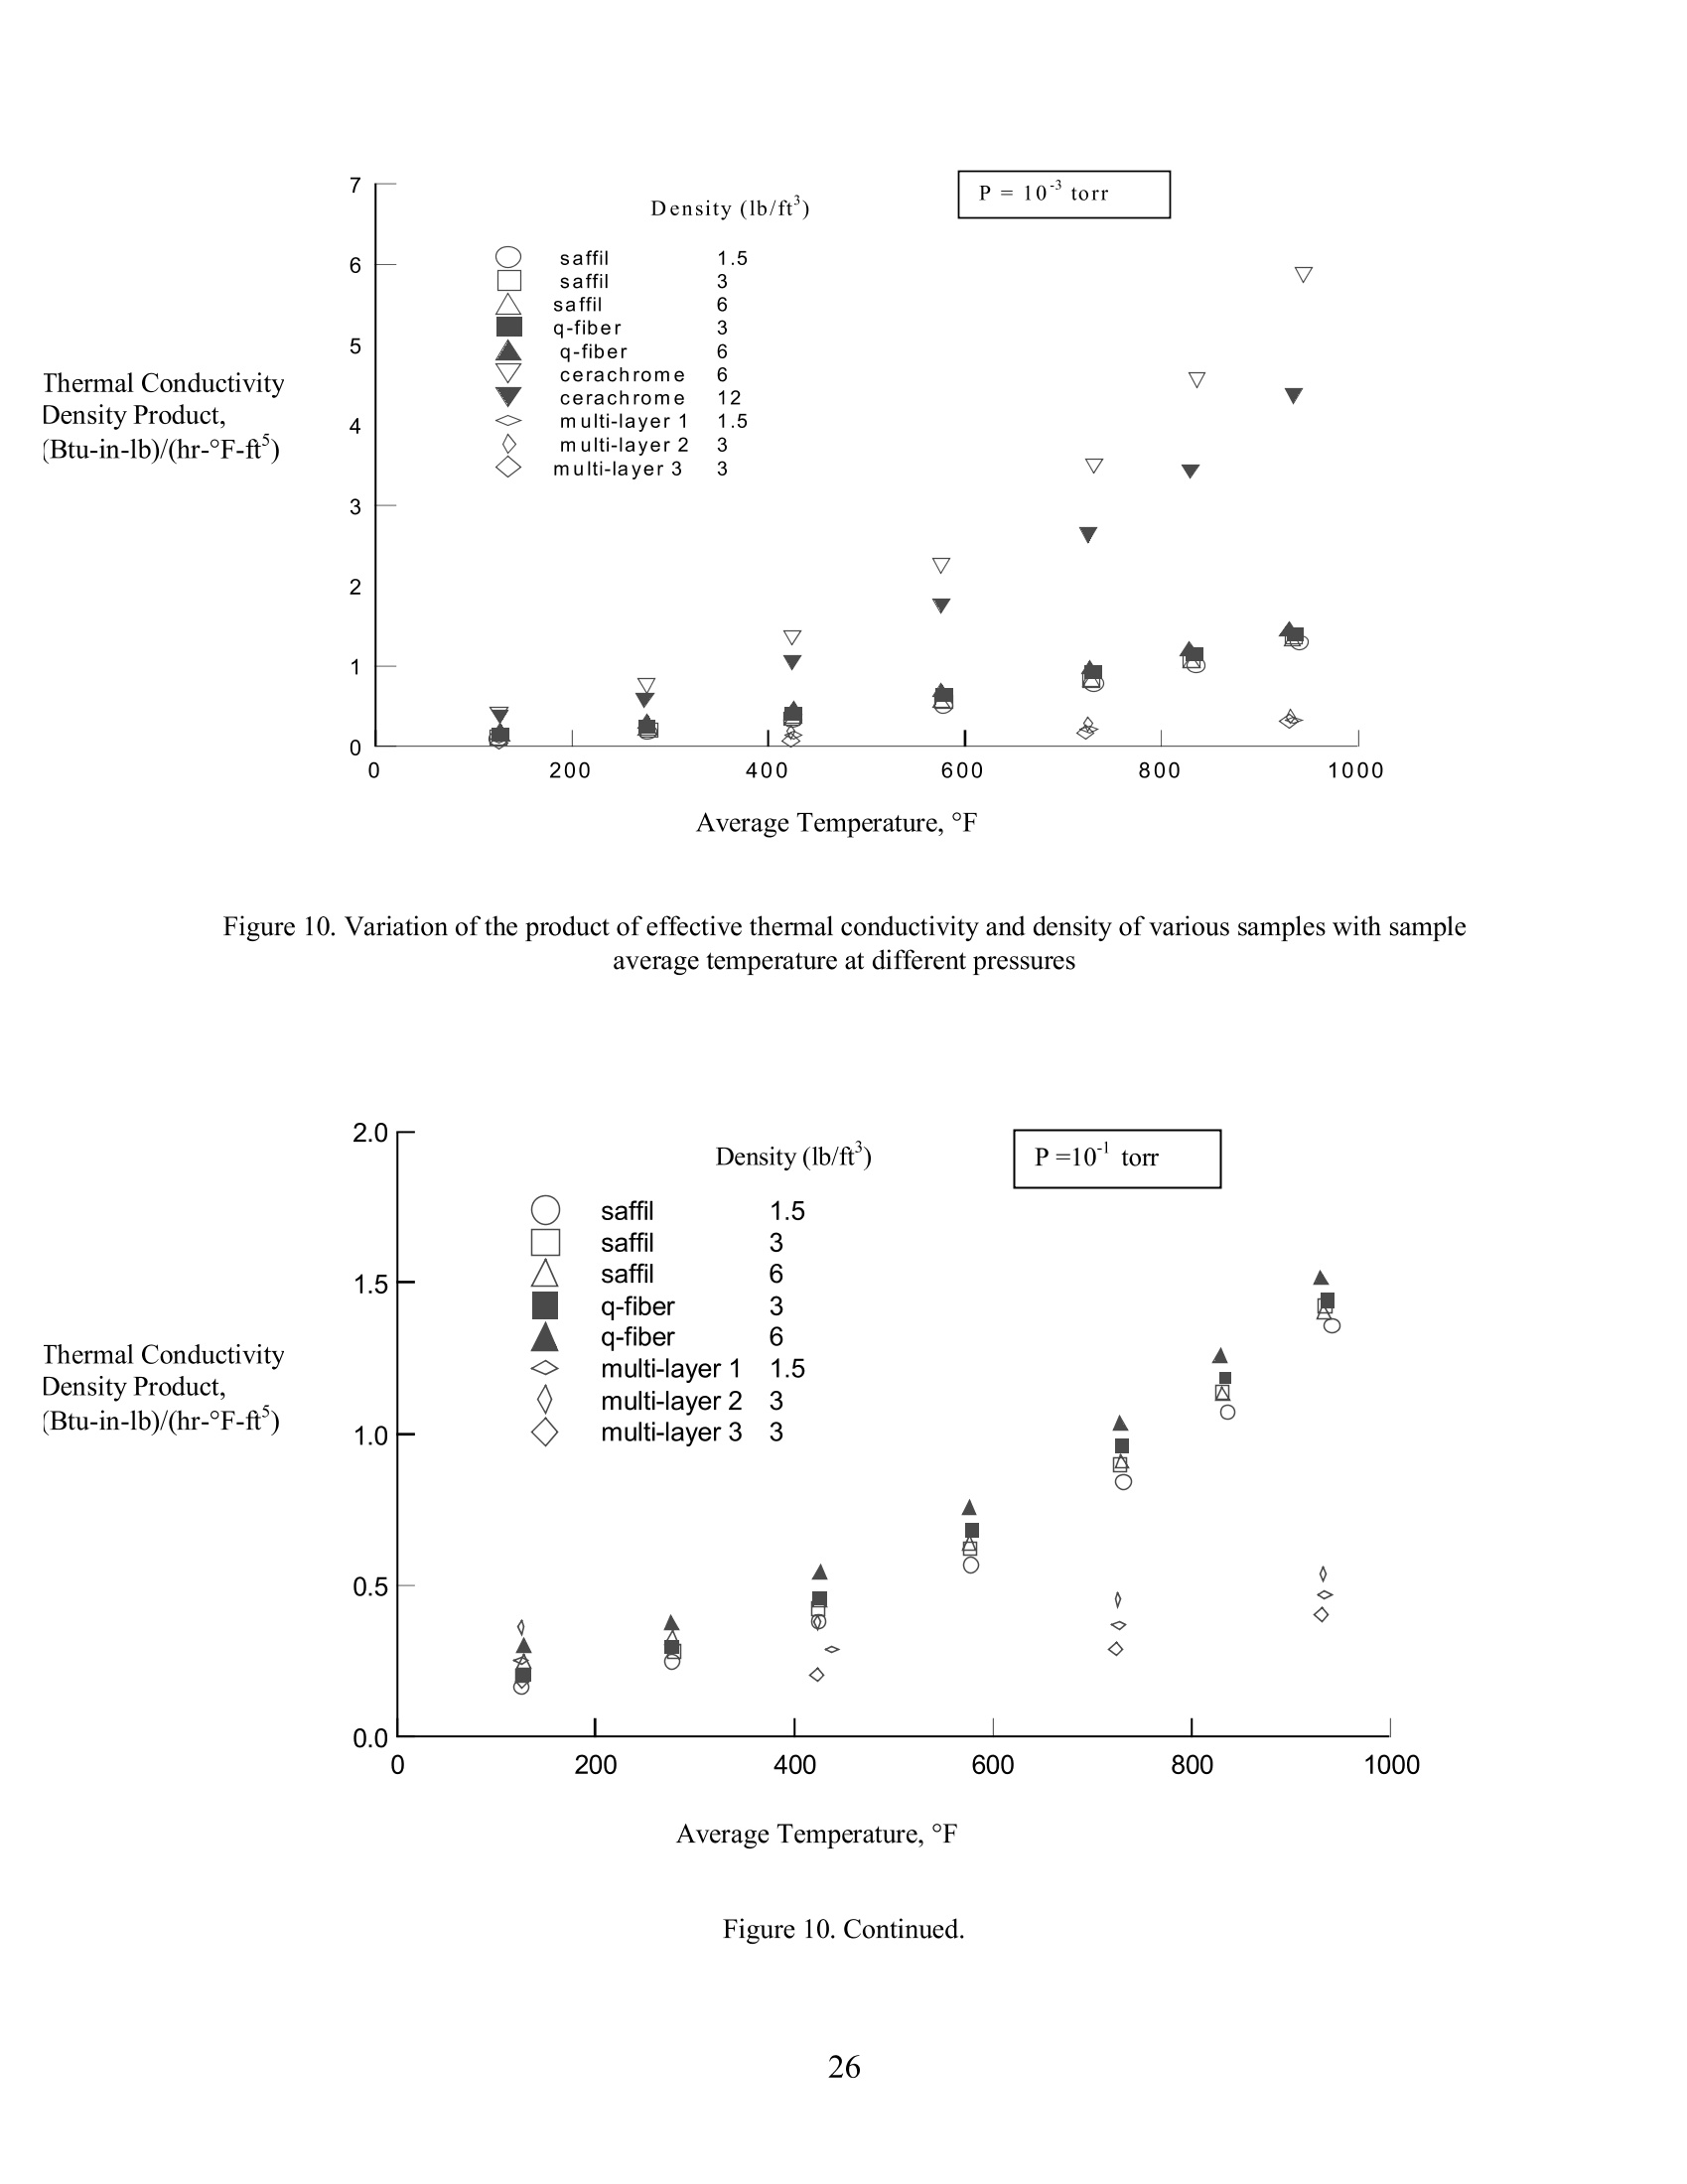
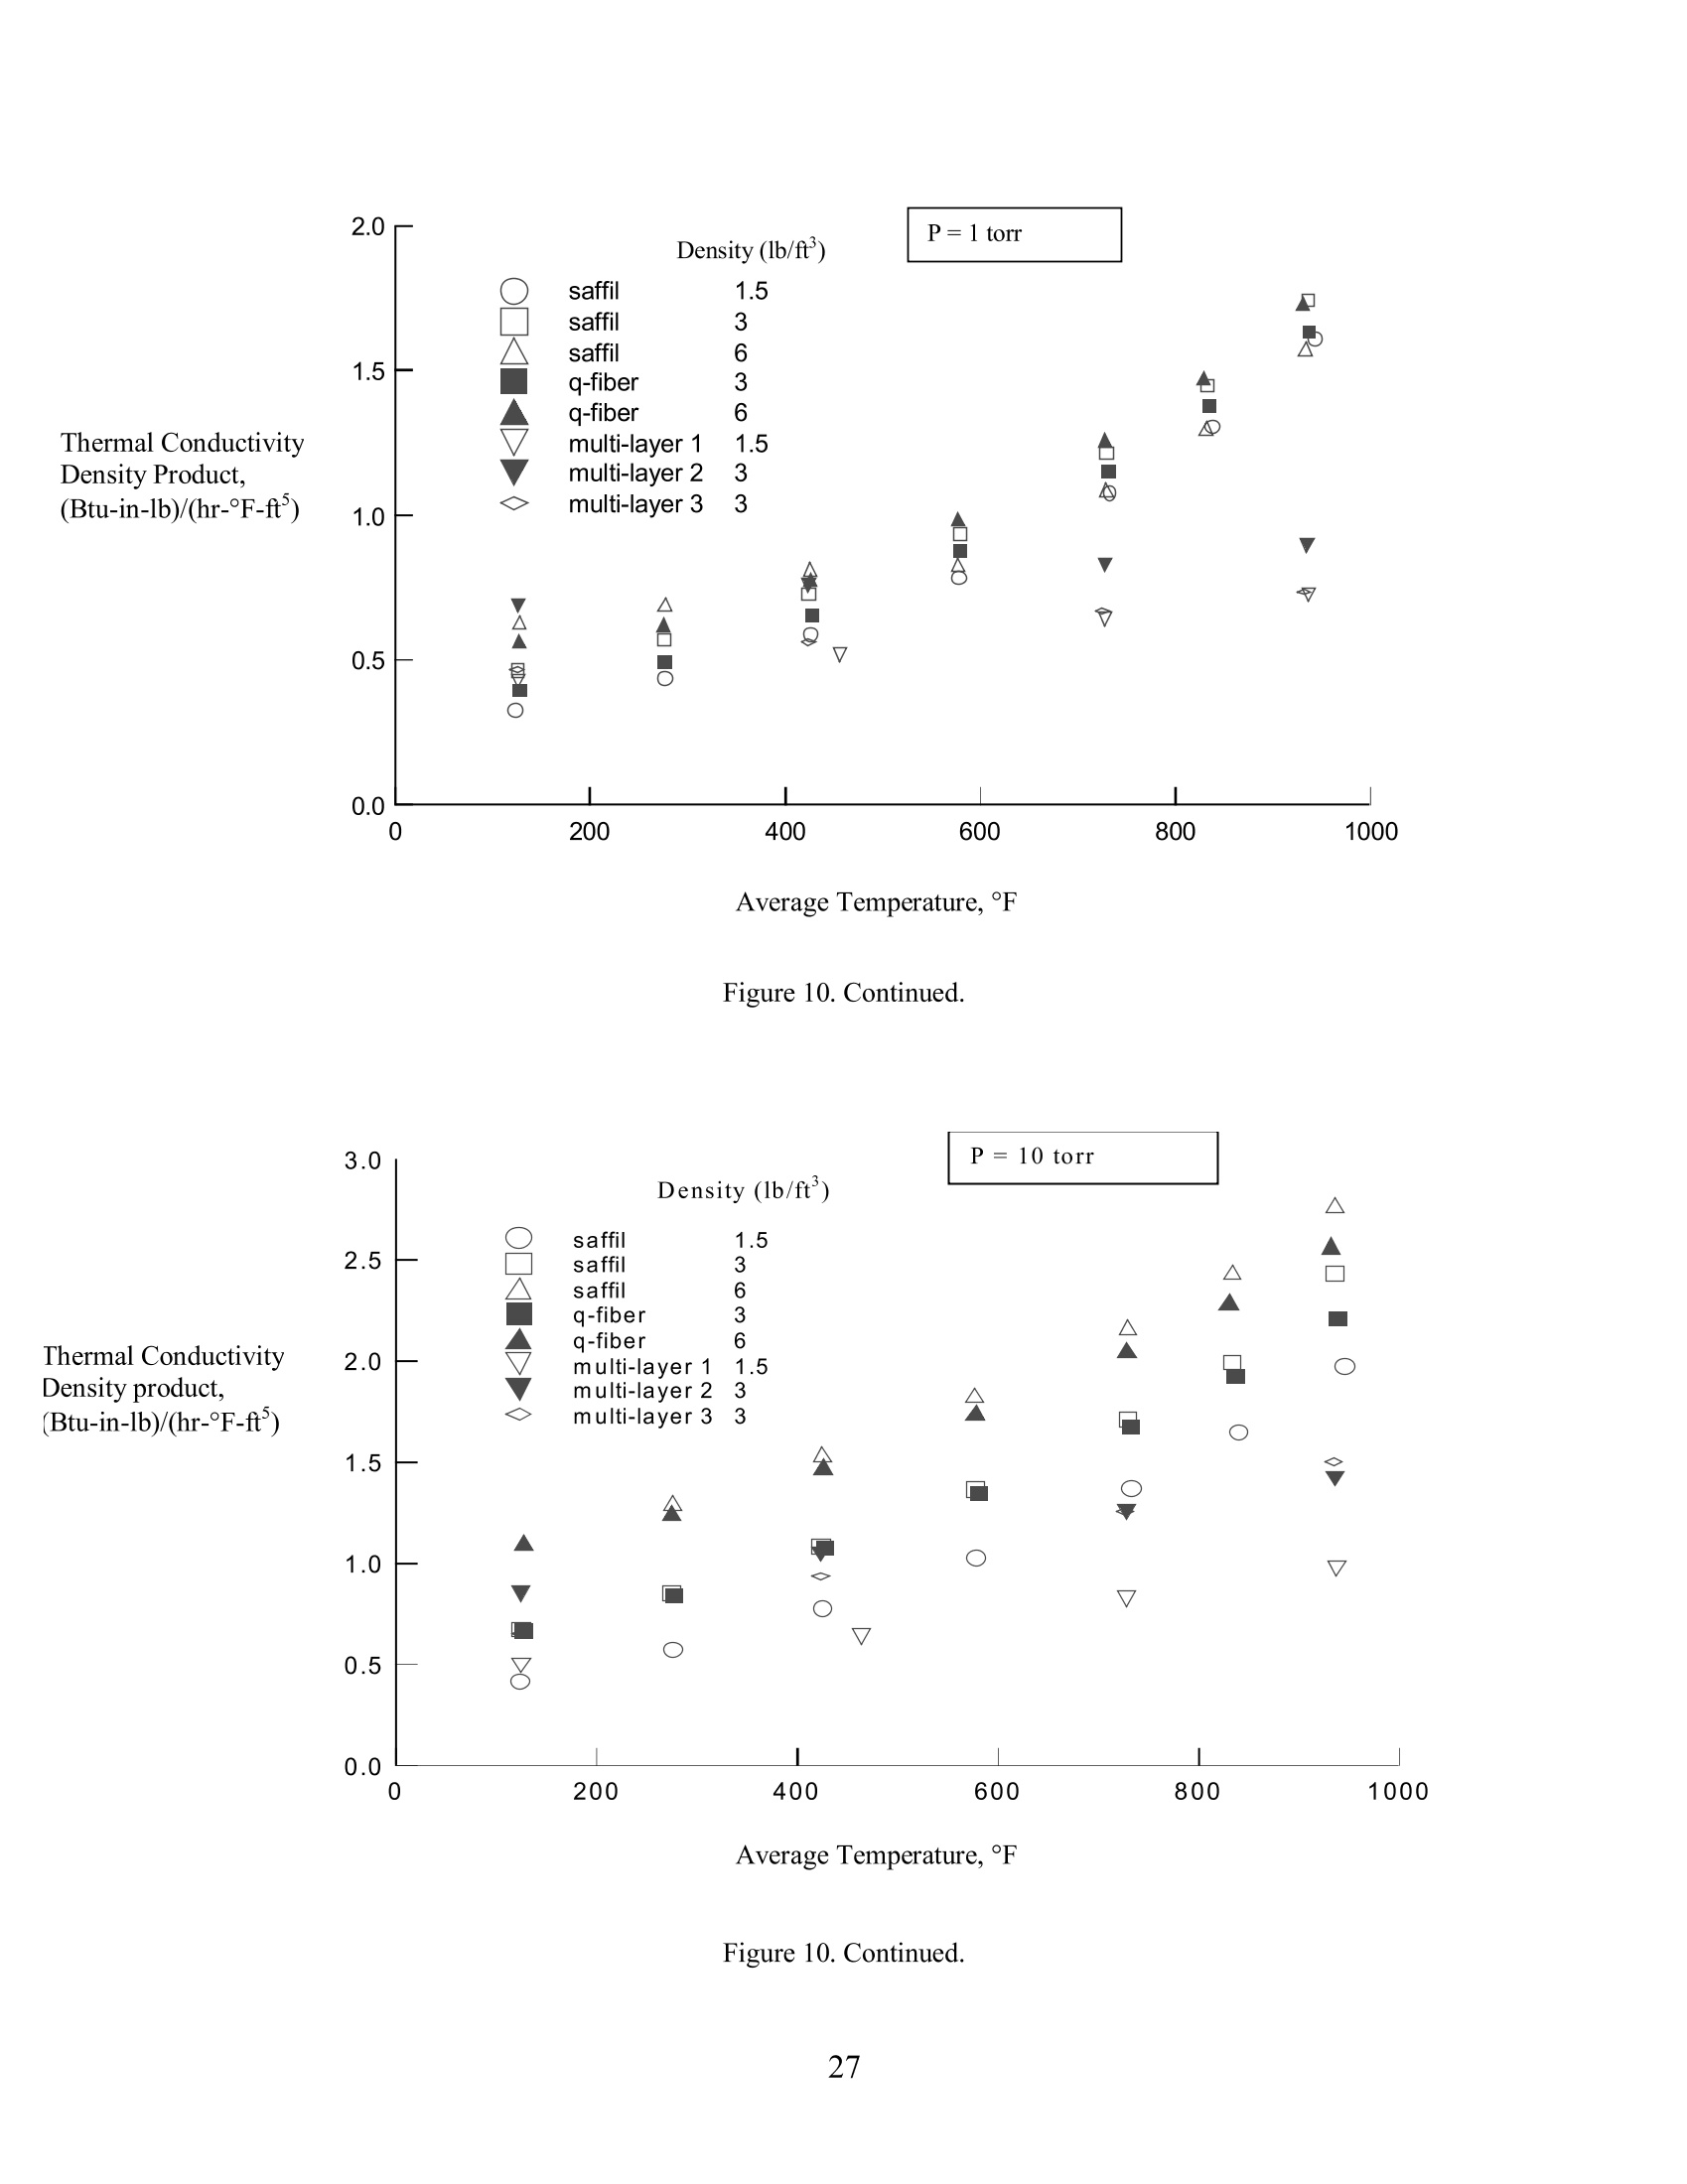
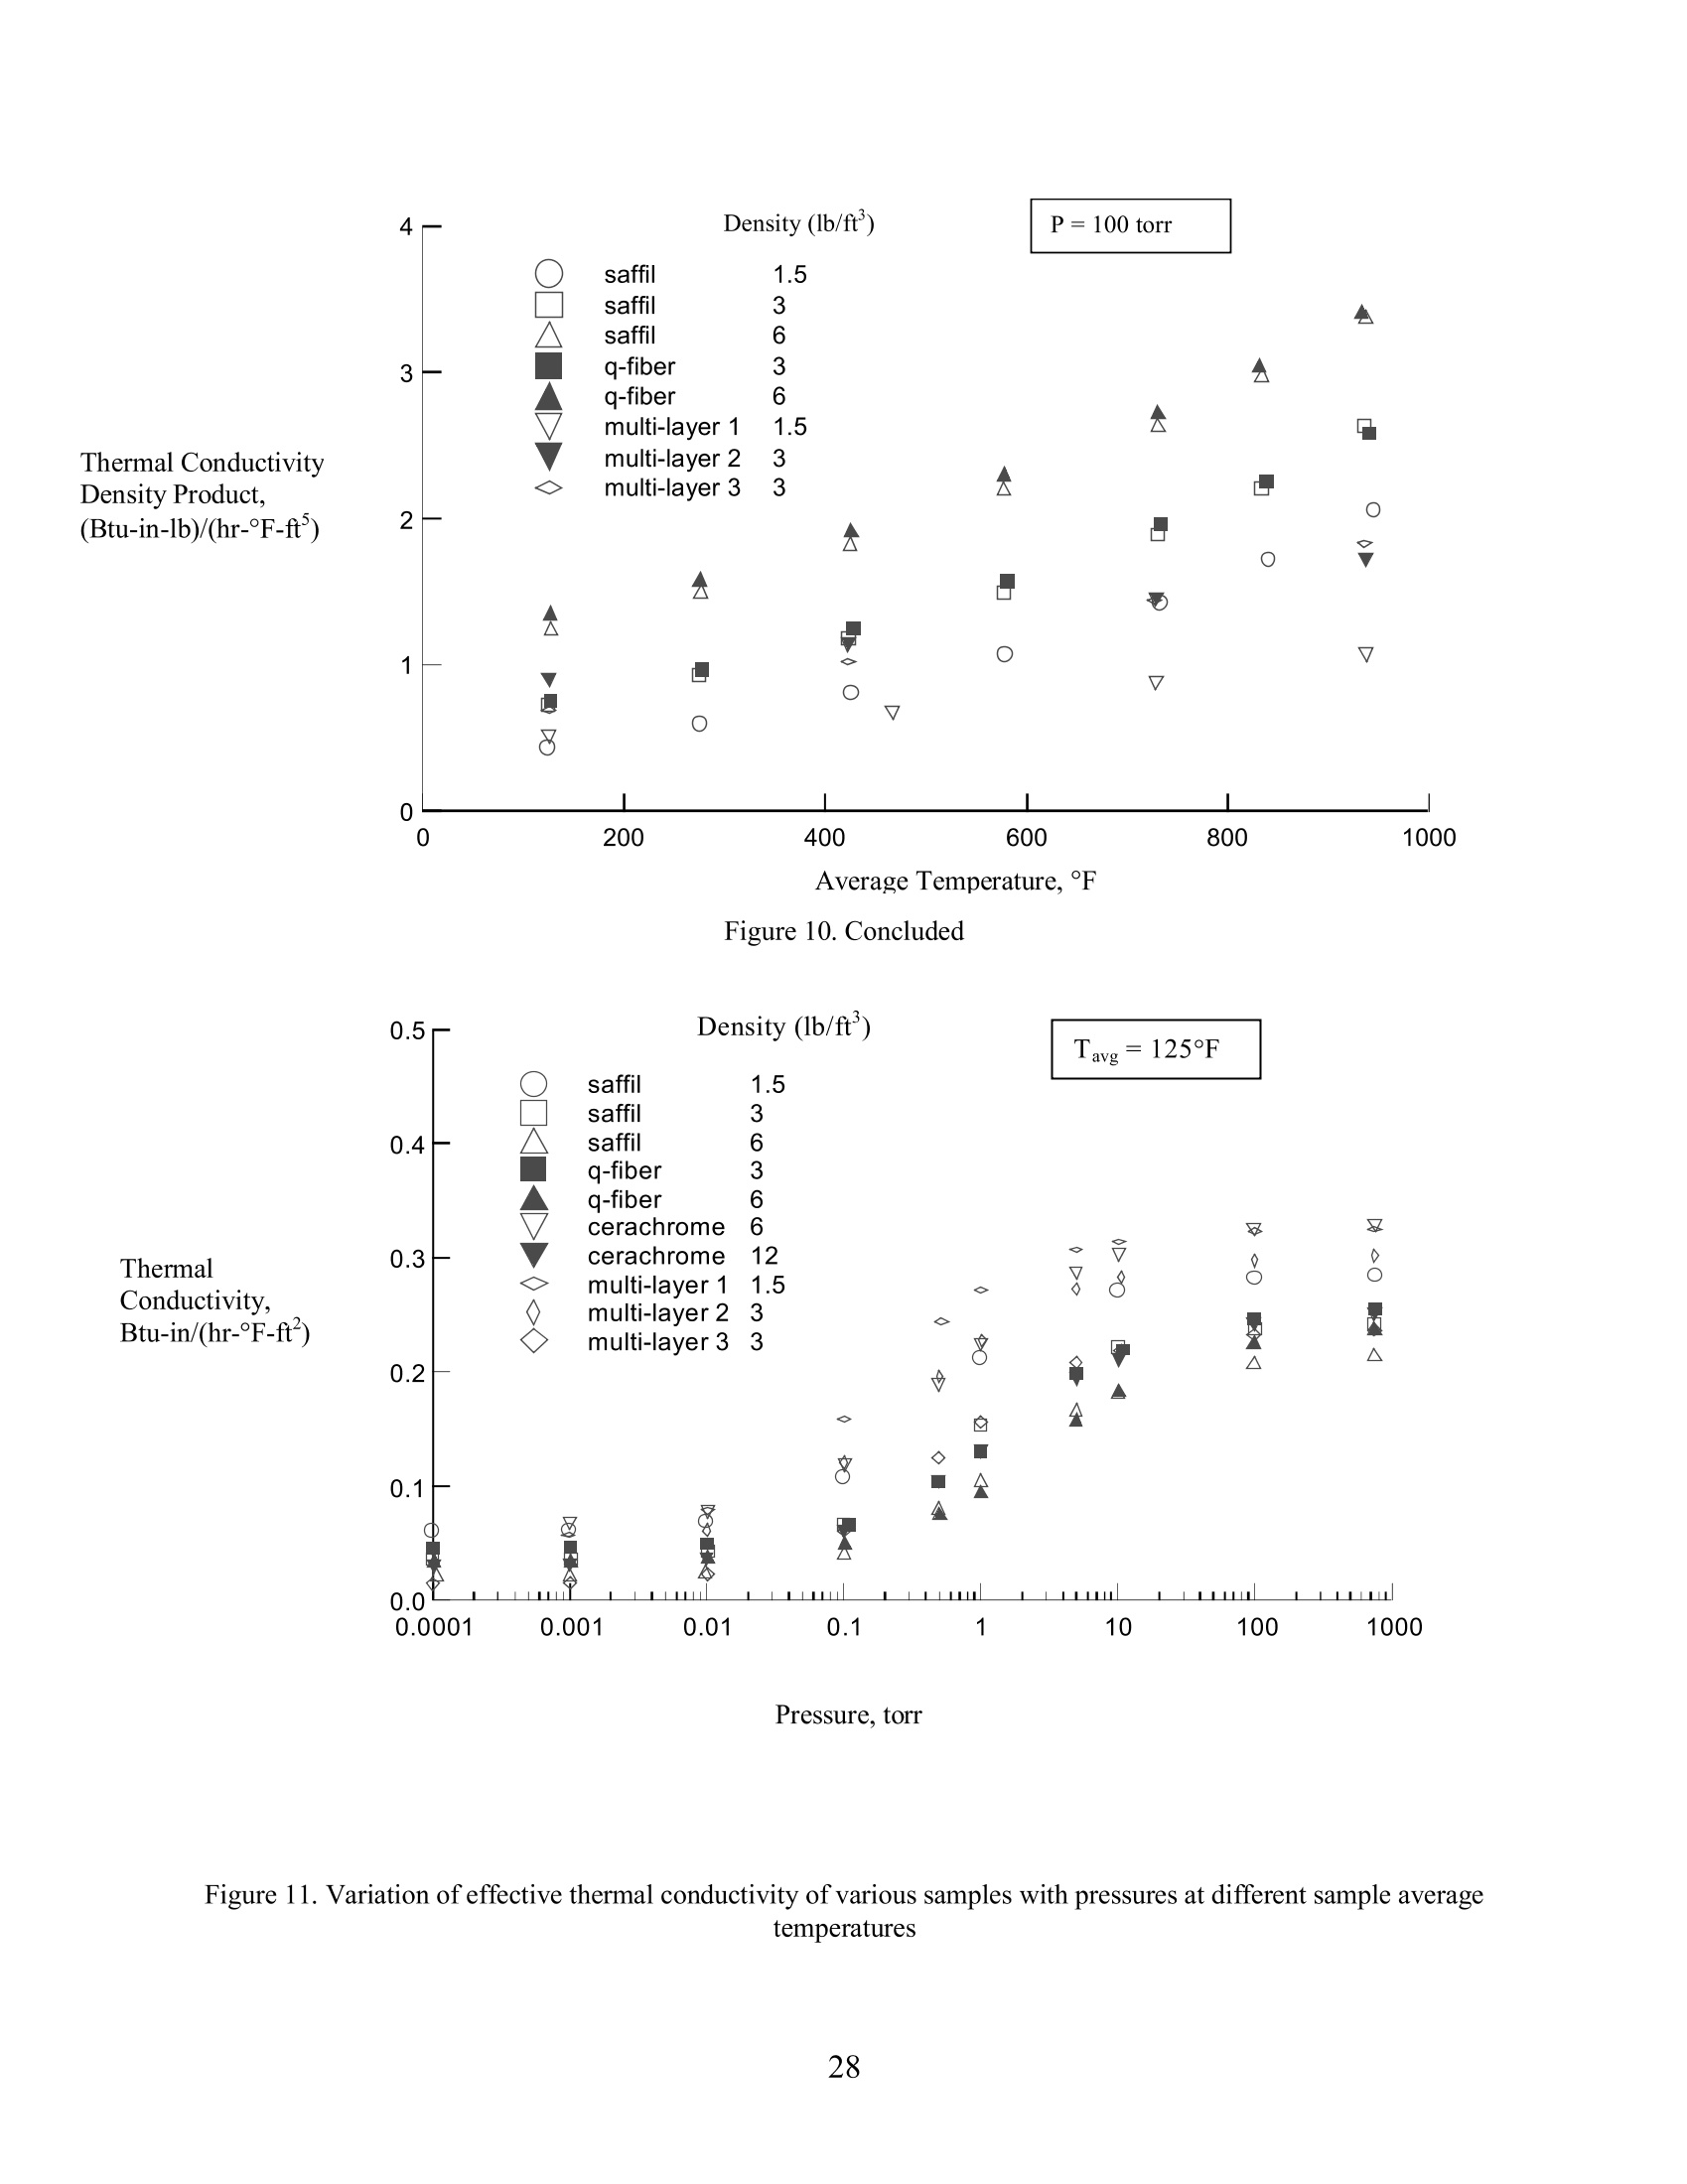
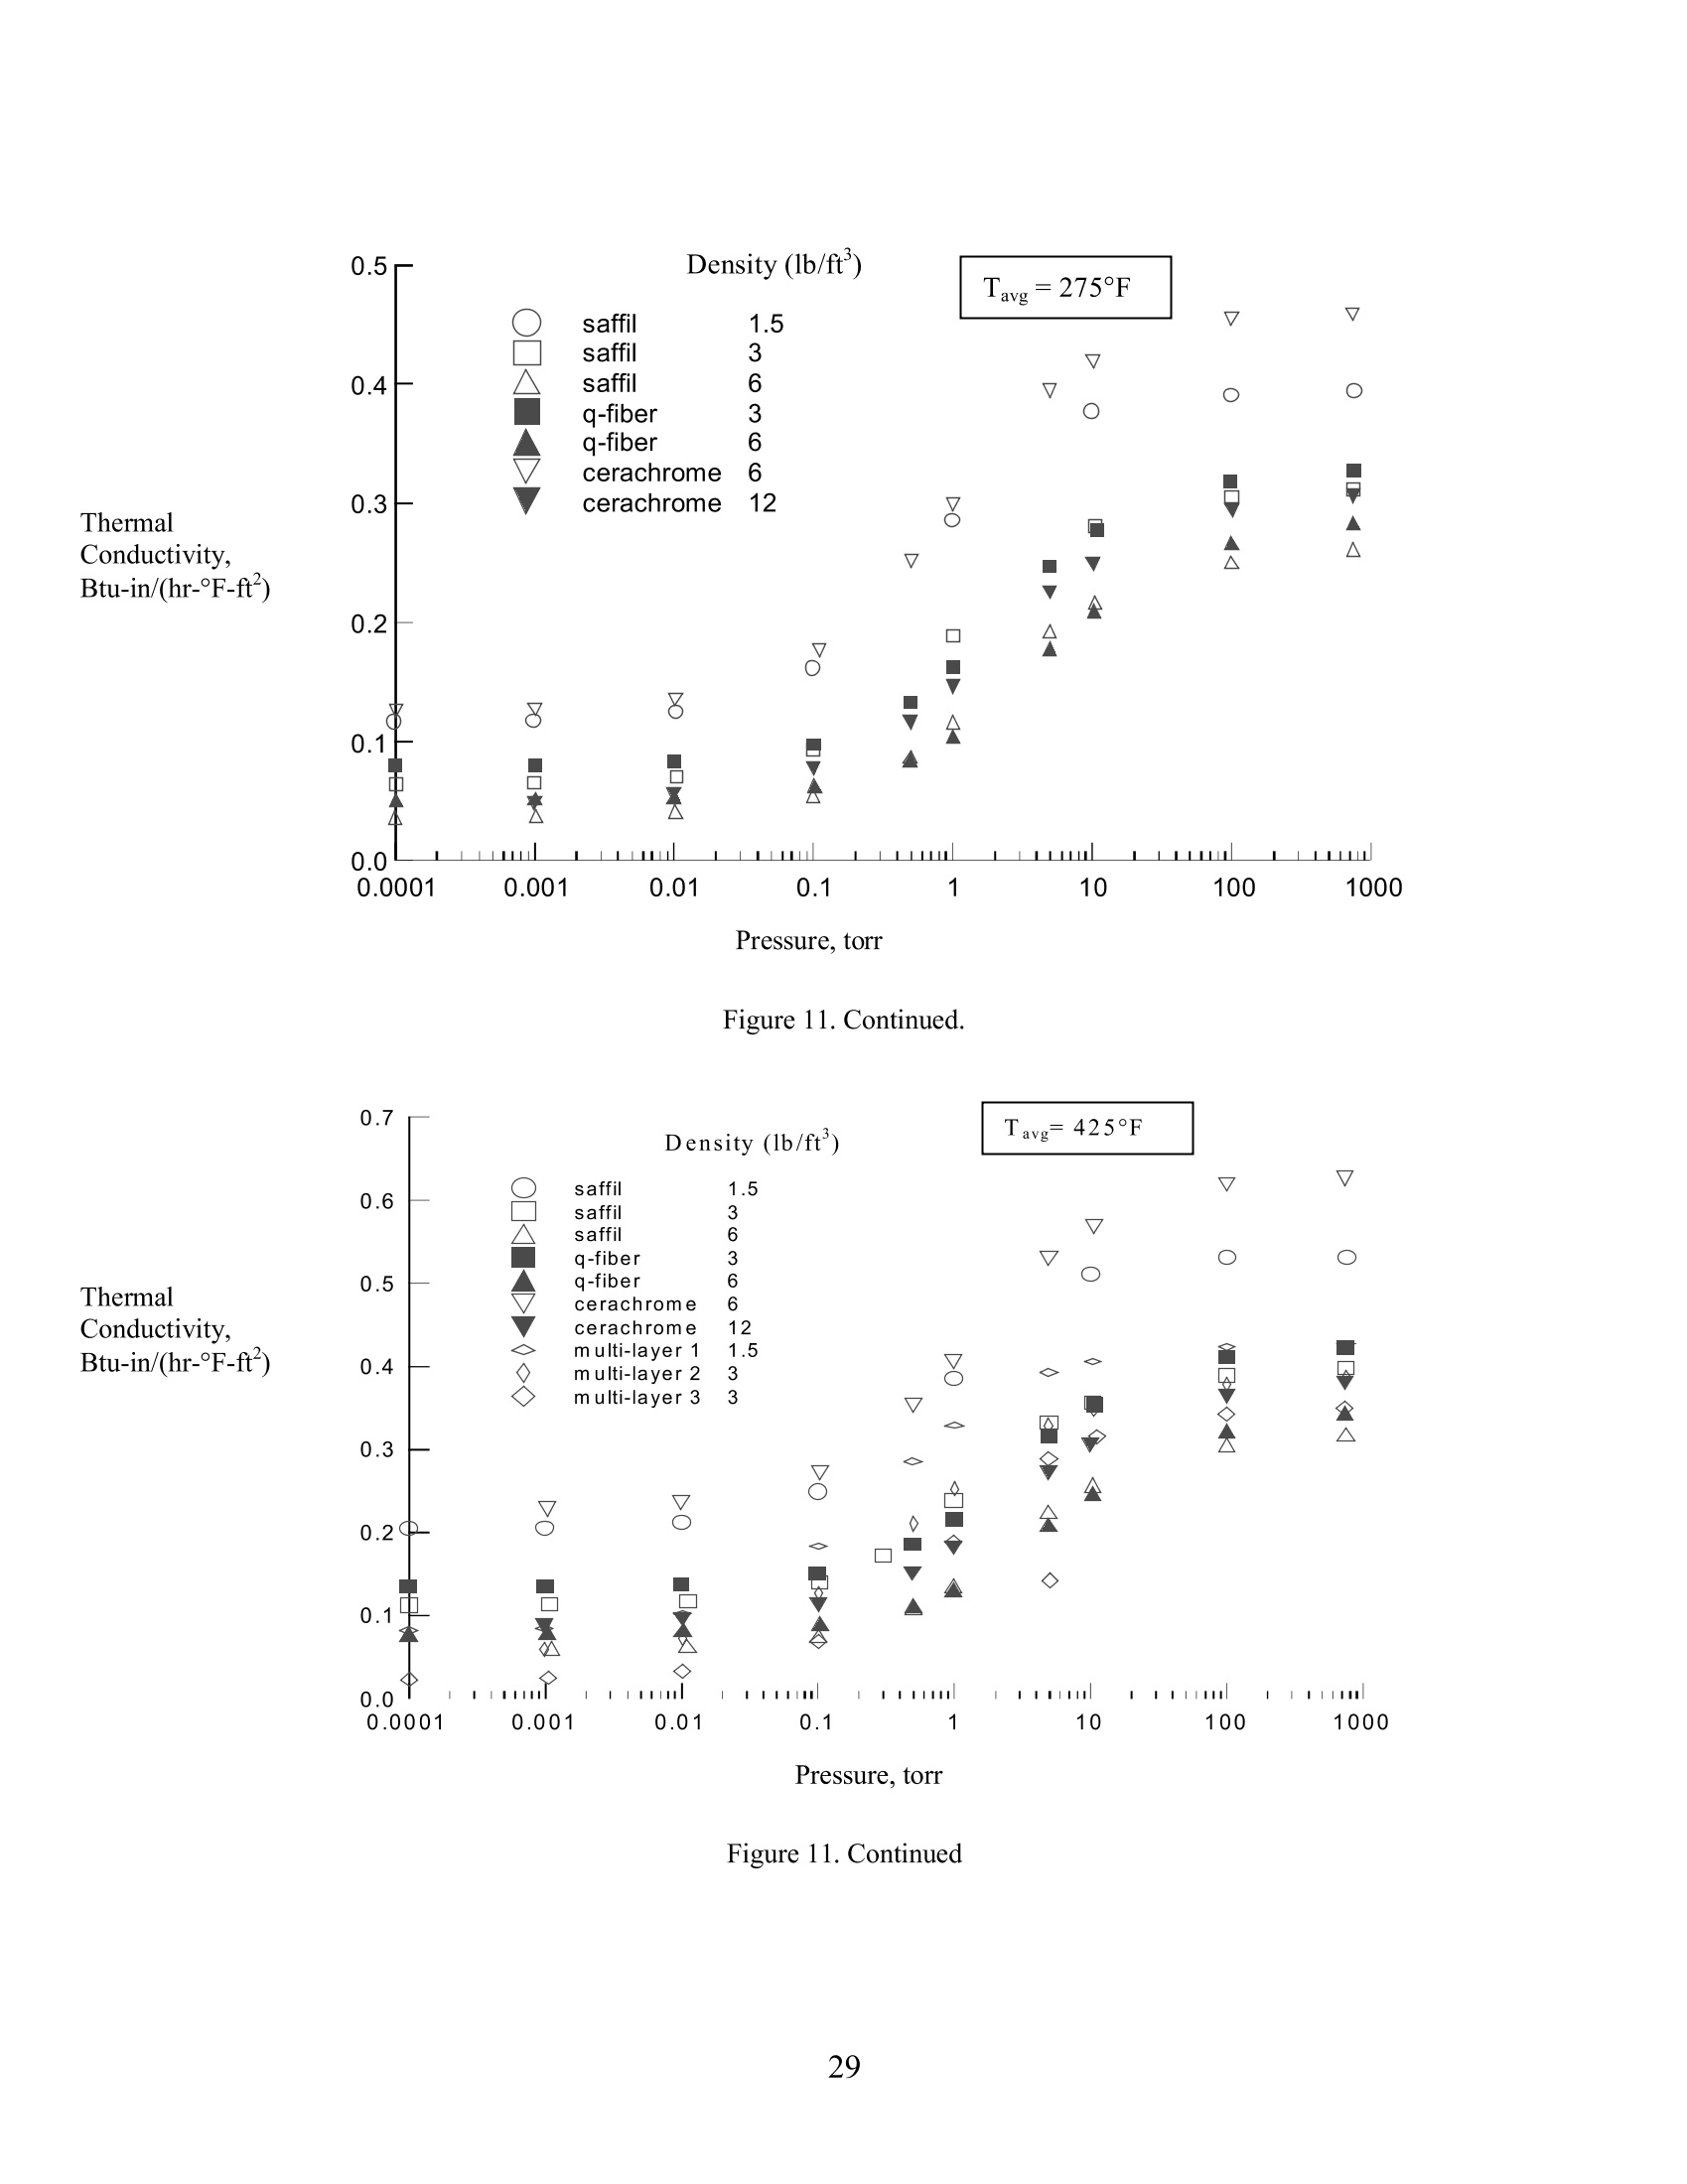
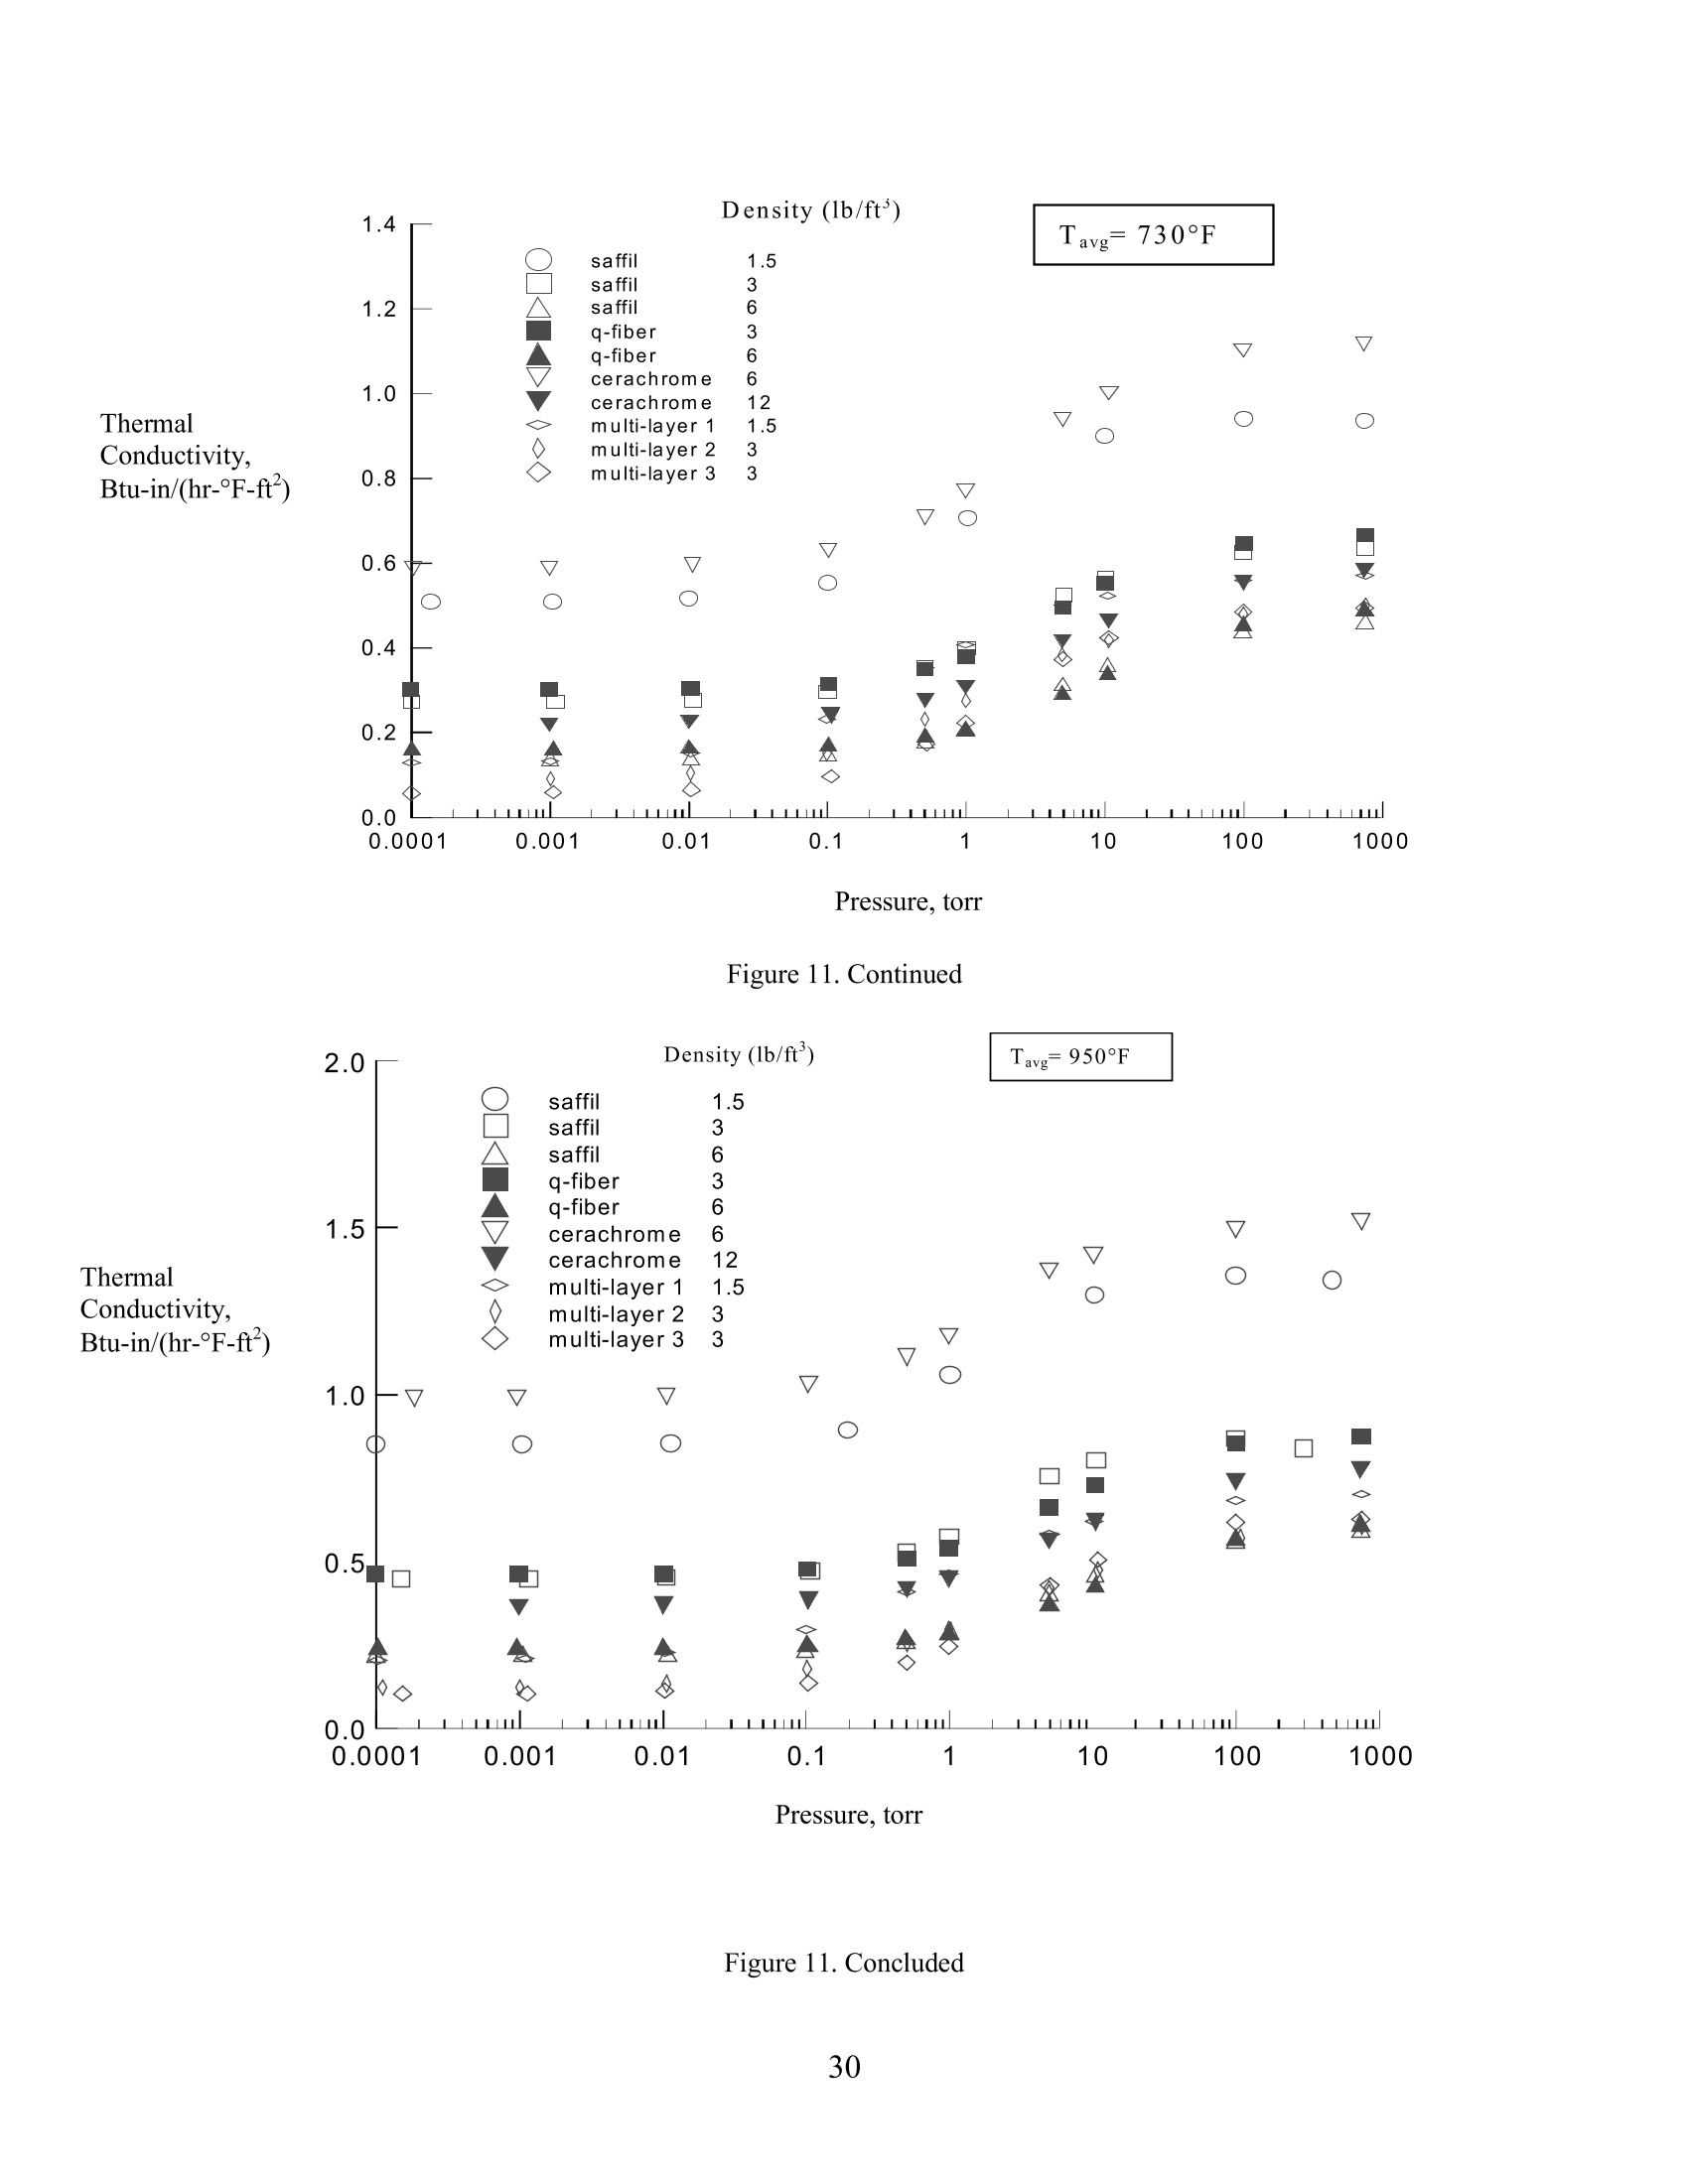
NASA/TM-1999-208972 The NASA STI Program Office ... in Profile Effective Thermal Conductivity of HighTemperature Insulations for ReusableLaunch Vehicles Kamran Daryabeigi Langley Research Center, Hampton, Virginia Since its founding,NASA has been dedicatedto the advancement of aeronautics and spacescience. The NASA Scientific and TechnicalInformation (STI) Program Office plays a keypart in helping NASA maintain this importantrole. The NASA STI Program Office is operated byLangley Research Center, the lead center forNASA’s scientific and technical information.The NASA STI Program Office providesaccess to the NASA STI Database, the largestcollection of aeronautical and space scienceSTI in the world. The Program Office is alsoNASA's institutional mechanism fordisseminating the results of its research anddevelopment activities. These results arepublished by NASA in the NASA STI ReportSeries, which includes the following reporttypes: ● TECHNICAL PUBLICATION. Reportsof completed research or a majorsignificant phase of research thatpresent the results of NASA programsand include extensive data or theoreticalanalysis. Includes compilations ofsignificant scientific and technical dataand information deemed to be ofcontinuing reference value. NASAcounterpart of peer-reviewed formalprofessional papers, but having lessstringent limitations on manuscriptlength and extent of graphicpresentations. TECHNICAL MEMORANDUM.Scientific and technical findings that arepreliminary or ofspecialized interest,e.g., quick release reports, workingpapers, and bibliographies that containminimal annotation.Does not containextensive analysis. ● CONTRACTOR REPORT. Scientific andtechnical findings by NASA-sponsoredcontractors and grantees. CONFERENCE PUBLICATION.Collected papers from scientific andtechnical conferences, symposia,seminars, or other meetings sponsoredor co-sponsored by NASA. SPECIAL PUBLICATION. Scientific.technical,or historical information fromNASA programs, projects, and missions,often concerned with subjects havingsubstantial public interest. ●TTECHNICAL TRANSLATION. English-language translations of foreignscientific and technical materialpertinent to NASA’s mission. Specialized services that complement theSTI Program Office’s diverse offeringsinclude creating custom thesauri, buildingcustomized databases, organizing andpublishing research results ... evenproviding videos. For more information about the NASA STIProgram Office, see the following: Access the NASA STI Program HomePage at http://www.sti.nasa.gov E-mail your question via the Internet tohelp@sti.nasa.gov Fax your question to the NASA STIHelp Desk at (301) 621-0134 Phone the NASA STI Help Desk at (301)621-0390 ● Write to:NASA STI Help DeskNASA Center for AeroSpace Information7121 Standard DriveHanover, MD 21076-1320 Effective Thermal Conductivity of HighTemperature Insulations for ReusableLaunch Vehicles Kamran Daryabeigi Langley Research Center, Hampton, Virginia National Aeronautics andSpace Administration Langley Research CenterHampton, Virginia 23681-2199 Acknowledgments The author gratefully acknowledges the contributions of Wayne D. Geouge and Jeffrey R. Knutson of NASALangley Research Center, Hampton, Virginia. The use of trademarks or names of manufacturers in the report is for accurate reporting and does not constitute anofficial endorsement, either expressed or implied, of such products or manufacturers by the National Aeronauticsand Space Administration. NASA Center for AeroSpace Information (CASI) 7121 Standard Drive (301)621-0390 National Technical Information Service (NTIS)5285 Port Royal RoadSpringfield, VA 22161-2171(703)605-6000 Abstract An experimental apparatus was designed to measure the effectivethermal conductivity of various high temperature insulations subject tolarge temperature gradients representative of typical launch vehicle re-entry aerodynamic heating conditions. The insulation sample cold sidewas maintained around room temperature, while the hot side was heatedto temperatures as high as 1800F. The environmental pressure wasvaried from 1 x 10"to 760 torr. All the measurements were performedina dry gaseous nitrogen environment. The effective thermalconductivity ofthe following insulation samples were measured: Saffil TMat 1.5, 3, 6 lb/ft, g-Fiber TM felt at 3, 6 Ibft, CerachromeTM at 6, 12lb/ft, and three multi-layer insulation configurations at 1.5 and 3 lb/ft.. Introduction Metallic and refractory-composite thermal protection systems are being considered for a newgeneration of reusable launch vehicles (RLV). The main function of the thermal protection system (TPS)is to maintain the vehicle structural temperature within acceptable limits during re-entry aerodynamicheating. The metallic TPS consists of a metallic shell panel fabricated from high temperature metallicalloy and mechanically attached to the substructure.The refractory-composite TPS consists of acomposite shell panel. In either case, the shell is filled with lightweight, non load-bearing, high-temperature fibrous insulation. Insulation for current metallic TPS for RLV experiences environmentalpressures from 1×10 to 760 torr, while the hot surface of insulation is exposed to temperatures as high as1800°F. Heat transfer through the insulation involves combined modes of heat transfer: solid conductionthrough fibers, gas conduction and natural convection in the space between fibers, and radiation throughparticipating media which includes absorption, scattering and emission of radiant energy by the fibers.The relative contributions of the different heat transfer modes vary during re-entry. Radiation becomesmore dominant at high temperatures with large temperature differences through the insulation, while gasconduction and natural convection contributions are minimal at low pressures and become moresignificant with increasing pressure. The complex coupling of the heat transfer modes makes the analysisand design of high-temperature insulation difficult. Heat transfer through insulation for re-entry aerodynamic heating is a transient problem, and both thethermal conductivity and specific heat of insulation as a function of temperature and pressure are requiredfor complete analysis.As a first step, the steady-state performance of the insulation should becharacterized by measuring the effective thermal conductivity of the insulation, where the contributionsof various modes of heat transfer are lumped in to an effective thermal conductivity. The experimentalapparatus for measuring the effective thermal conductivity shall be capable of providing thermalconductivity measurements at conditions representative of re-entry aerodynamic heating conditions forRLV. This means measuring thermal conductivity at environmental pressures from 10 to 760 torr, andat temperatures from room temperature up to 1800°F. Because radiation through participating media isan important component of heat transfer through insulation having large temperature gradients, theapparatus should be capable of imposing temperature differences through the sample as high as 1800°F.The American Society for Testing and Materials (ASTM) standard C-201 entitled “Standard TestMethod for Thermal Conductivity of Refractories” meets the requirements for this investigation.Therefore, a thermal conductivity apparatus was designed and fabricated that closely resembled this ASTM standard.The apparatus can be easily modified to measure the transient performance of theinsulation. The overall objective of this study is to design an experimental apparatus for measuring the effectivethermal conductivity of high-temperature insulations, and to compare the effective thermal conductivityof four high-temperature insulations. Thermal Conductivity Apparatus The apparatus used in this study followed the general guidelines from ASTM standard C-201'. Thestandard consists of a radiant heater, a silicon carbide septum plate directly placed on the specimen toprovide a flat boundary and a uniform hot-face temperature, and a water-cooled plate containing threewater calorimeters. The water calorimeters are maintained at 80.6°F (27C) while the hot surface can beheated to temperatures as high as 2732°F (1500℃). The main components of the thermal conductivityapparatus used in the present study consist of a radiant heater, an InconelTM Alloy septum plate directlyplaced on the specimen to provide a flat, uniform temperature boundary, and a water-cooled platecontaining thin film heat flux gages. A schematic of the apparatus is shown in Figure 1. The maindifference between this apparatus and the ASTM standard is that thin foil heat flux gages are used formeasuring the heat flux in the present apparatus, while water calorimeters are used in the ASTM standard. The apparatus consists of a water-cooled plate made of aluminum, 12 × 12×1 inches, with sevencoolant passages across the length of the plate. Each coolant passage is 0.375 inches in diameter, andcentered along the plate thickness. A polyimide sheet 0.005 inches thick is bonded to the top of thewater-cooled plate. The top side of the poyimide sheet constitutes the“cold side"boundary for theinsulation. A picture frame made of refractory ceramic board is set on the water-cooled plate to providesupport for the septum plate. The insulation sample to be tested is placed inside the picture frame. Theceramic board picture frame is two inches wide and its outside dimensions are 12 ×12 inches resulting ina test sample size of eight by eight inches. The ceramic board picture frame’s thickness can vary between0.5 and 2 inches. For the tests reported in the present study, the ceramic board picture frame and thus theinsulation sample is 0.522 inches thick. A photograph of the water-cooled plate with the ceramic boardpicture frame set on top of the plate is shown in Figure 2. A septum plate made of InconelTM alloy 625, with dimensions of 12 ×12×44 inches is used to providea uniform temperature boundary for the test specimen.The septum plate is placed directly on top of thepicture frame and the insulation sample. The bottom of the septum plate constitutes the “lboundary for the insulation sample. To alleviate bowing of the septum plate due to temperature gradientsfrom the plate center to plate edges, a series of slots 1.5 inches long, 0.060 inches wide were made aroundthe circumference of the plate with one-inch spacing, as shown in Figure 3 The apparatus uses a commercially available ceramic-fiber radiant heater which consists of rows ofiron-chrome-aluminum heater wires cast in a two inch thick ceramic, such that the heating elements arelocated near the front surface. The heater is 12×12 inches and is encased in a 2.5 inch deep sheet metalcase with ceramic fiber insulation on the backside of the heating elements.The heater surface can beheated up to 2000°F. The heater is located approximately 1.5 inches above the septum plate. The wholeassembly is insulated with one-inch thick refractory ceramic board, as shown in Figure 4, with additionalinsulation set on top of the heater, to minimize heat losses. The apparatus is placed in a 5 feet diameter,5feet long vacuum chamber capable of providing test pressures from 1 x 10 to 760 torr. A photograph ofthe apparatus in the vacuum chamber is shown in Figure 5. For all the tests reported in the present study, the insulation sample was sandwiched between twoparallel horizontal plates oriented perpendicular to local gravity vector.The lower plate (water-cooledplate) has a lower temperature than the upper plate (septum plate), therefore, eliminating naturalconvection heat transfer through the insulation. The only heat transfer mechanisms present are solid andgaseous conduction and radiation. Instrumentation The water-cooled plate is instrumented with nine thin film heat flux gages and ten type K (nickel-chromium/nickel-aluminum) thermocouples. A schematic showing the layout ofthe thermocouples andheat flux gages on the water-cooled plate is shown in Figure 6. The thermocouple wires are 0.005 inchesin diameter (36 gage) and have fiberglass insulation. The thermocouples were installed below the topsurface of the water-cooled plate with their junction located typically 0.01 inches below the top surface ofthe plate. An epoxy filled trench was made on the plate for subsurface burying of thermocouples andthermocouple leads. Each heat flux gage is one inch long and 0.75 inches wide, with a nominal thickness of 0.006 inches.The gages are thermopiles encapsulated in polyimide film, producing a voltage directly proportional tothe impinging heat flux with a nominal sensitivity of 3.3 ×10Volts/[Btu/hr-ft’]. Each heat flux gagealso employs a type T (copper/constantan) thermocouple for surface temperature measurement.flux gages were bonded to the top of the water-cooled plate with their lead wires buried underneath theplate top surface. Two epoxy filled trenches were made in the plate for subsurface burying of t fluxlXgage lead wires. A polyimide sheet 0.005 inches thick covers the plate at locations not covered by heatflux gages. The polyimide sheet was bonded to the plate to provide a uniform surface on tl water-cooled plate. The thickness of the bonding agent used for both the heat flux gages and the polyimidesheet was 0.003 inches. The top surface of the polyimide sheet was spray painted using a flat black paintwith an emittance value of 0.92 throughout the infrared spectrum. The septum plate is instrumented with 23 metal sheathed type K thermocouples.. The thermocoupleleads are 0.0126 inches in diameter(28 gage). The metallic sheath is 304 stainless steel, 0.0625 inches indiameter. The thermocouple junction is formed by welding both leads to the stainless steel sheath. Forthe installation of thermocouples on the septum plate, small holes 0.01 inches deep and with 45 degreeinclination angle with respect to the plate were drilled in the plate at the location of the sensors, and thesheathed thermocouples were inserted into the holes and then welded in place. The thermocouples wereinstalled on the top surface of the septum plate (opposite side from the insulation sample) so that uniformcontact between the septum plate and insulation test sample could be maintained. A schematic showingthe layout of the thermocouples on the septum plate is shown in Figure 7. The septum plate was oxidizedin an oven at 1800°F for 6 hours after the installation of the thermocouples.. The emittance of theoxidized InconelTM has been reported to be 0.8. The thermocouple and heat flux gage data are collected using a personal-computer-based dataacquisition system. The thermocouple data are converted to temperature using look-up tables by the dataacquisition software. Raw voltages from the heat flux gages are converted to heat flux by applying amanufacturer-suggested temperature correction to the raw data and then using the manufacturer’s linearcalibration for heat flux versus voltage for each sensor. The accuracy of the manufacturer’s calibrationfor the range of heat fluxes used in this study was verified by radiant calibration of the heat flux gagesusing a high intensity irradiance standard (solar constant lamp). Experimental Procedure The effective thermal conductivity of different samples are measured with nominal septum platetemperatures of 200, 500, 800,1100,1400,1600, and 1800°F, and nominal environmental pressures of1x104, 1x10,1x102,0.1,0.5,1,5,10,100, and 750 torr. The experimental procedure consists ofstarting the coolant for the water-cooled plate, pumping down the vacuum chamber to approximately 1torr, and then providing power to the ceramic fiber radiant heater. The power to the heater is controlledusing a proportional controller with input from the control thermocouple on the hot plate. The timerequired to reach the steady-state target temperature varies between 1 to 2 hours. Once the hot plate’stemperature is determined to be stable, the chamber is pumped down to 1x10 torr. Once all thethermocouples and heat flux gages on both the septum and water-cooled plates are stabilized, data storageinitiates.Then the vacuum chamber pressure is changed to the next higher value..The tests at eachseptum plate temperature for the ten different pressures take approximately 90 minutes.During theprocess of increasing pressure in the vacuum chamber, the chamber is filled with gaseous nitrogen insteadof atmospheric air. Filling the chamber with air would introduce water vapor into the chamber, whichwould significantly increase the time required for pumping-down to low pressures. Description of test specimen Four insulation samples were tested, three fibrous insulation samples and one multi-layer insulation.The fibrous insulation samples consisted of SaffilTM, Q-FiberTM felt and CerachromeTM. All the fibrousinsulation samples tested were 8 ×8×0.522 inches. SaffilTM is made of alumia fibers, Q-FiberTM felt ismade of silica fibers, while CerachromeTM is composed of silica and alumina fibers.The test matrixincluded three SaffilTM samples with nominal densities of 1.5, 3, and 6 lb/ft, two Q-FiberTM felt sampleswith nominal densities of 3 and 6 lb/ft’, and two CerachromeTM samples with nominal densities of 6 and12 lb/ft. A listing of the fibrous insulation samples tested in this study is provided in Table 1. Three different configurations of a multi-layer insulation were tested. The multi-layer insulations,consisting of thin foils coated with high-reflectance coating, were manufactured by S. D. Miller &Associates, Flagstaff, Arizona. The first multi-layer configuration consisted of four foils stacked on topof each other, with a nominal density of 1.5 lb/ft. The second configuration consisted of nine foils with anominal density of 3 lb/ft. No fibrous insulation was used in between the foils for the first twoconfigurations, but a thin layer of SaffilTM with a mass of about six grams was installed between the top ofthe specimen and the bottom of the septum plate, to prevent accumulation of InconelTM oxide flakes on thereflective foilss.. The mass of the SaffilTM was included in the calculation of the effective density.Thelast configuration consisted of four foils with five SaffilTM spacers, three in between the foils, one on topand one on bottom. The nominal density of this sample was 3 lb/ft. The three multi-layer configurationsemployed proprietary design that can not be disclosed in this report. The multi-layer insulation sampleswere 6×6×0.522 inches. Since the test set-up is designed for handling 8 ×8 inch specimen, the multi-layer insulation samples were located in the center of test set-up and a two-inch wide strip of SaffilTM at anominal density matching that of the corresponding multi-layer insulation was set around the testspecimen. A listing of the multi-layer insulation samples tested in this study is provided in Table 2. Data Analysis The effective thermal conductivity of the insulation sample is calculated from Fourier’s law using themeasured heat flux, septum and water-cooled plate temperatures, and sample thickness.Referring toFigure 8, the effective thermal conductivity of the insulation, k, is obtained from: where, Ti and Ts are the measured temperatures on top of septum plate and on top of the polyimidesheet bonded to the water-cooled plate, respectively,q"is the measured heat flux, L and L’ are the knowninsulation and septum plate thicknesses, respectively, and k’ is the thermal conductivity of the InconelTMseptum plate assumed to be known. Only the data from the central five by five inch section of the test set up shown in Figures 6 and 7,referred to as the metered region, are used for calculating the effective thermal conductivity. Theeffective thermal conductivity of the sample at each of the five heat flux gage locations in the meteredregion is calculated using Equation (1). Then, the data are averaged to obtain the averageffethermal condudcutcitviivtyi.ty. The average cold side temperature is obtained by averaging the measuredtemperatures on the five heat flux gages in the metered region.The septum plate bottom surfacetemperatures are calculated from measured temperatures on the septum plate top surface in the meteredregion, and then averaged to provide the average hot side temperature. The average test specimentemperature is obtained by averaging the average hot and cold side temperatures. Uncertainty Analysis An uncertainty analysis was performed to obtain error estimates for the experimentally determinedeffective thermal conductivity. The procedure for calculating the effective thermal conductivity bias andprecision uncertainties is that specified by Coleman and Steele’. The bias error for the estimated effectivethermal conductivity, AkB, is obtained from: where ALB, Aqp, AT2,B, and AT,B are the bias error estimates for the measurements of insulationthickness, heat flux, septum plate temperature and water-cooled plate temperature, respectively. Theprecision error for the estimated effective thermal conductivity, Akp, is obtained from: where ALp, Aqp,AT2.p, and AT3,p are the precision error estimates for the measurements of insulationthickness, heat flux, septum plate temperature and water-cooled plate temperature, respectively. Theoverall uncertainty in the estimation of the effective thermal conductivity, Aku, is obtained by combiningthe precision and bias error using the root-sum-square method : The bias error for the thermocouples was determined by performing a comparison calibration in acontrolled-temperature oven/bath with a NIST-traceable thermometer.The bias error for heat fluxsensors was determined by calibration against a high intensity irradiance standard (solar constant lamp).The precision error for the thermocouples and heat flux gages was determined from the experimentalmeasurements, by calculating the standard deviations of the temporal variations of each measuredquantity. The bias and precision error estimates for measurements of the insulation thickness, heat flux,septum plate and water-cooled plate temperatures are tabulated in Table 3.The bias, precision, andoverall uncertainties for effective thermal conductivity are presented in Table 4.+.The uncertainties arepresented as a percentage of uncertainty with respect to the calculated thermal conductivity..1Datapresented in the table are from measurements on SaffilTM at 1.5 lb/ft,and correspond to measurements atpressures of 1x10, 1x10, and 760 torr, and nominal sample average temperatures of 125, 580, and950°F. The overall uncertainty varied between 5.5 to 9.7 percent. To provide an independent assessment of the uncertainty of the effective thermal conductivitymeasurements, the effective thermal conductivity of fumed silica board, Standard Reference Material(SRM)1459 from the National Institute of Standard and Technology (NIST) was measured.The silicaboard was 12 ×12×1 inches, and its reported thermal conductivity at one atmosphere and at 75.F is0.012 Btu/(hr ft F). The effective thermal conductivity of the SRM sample was measured byHolometrix, Inc using the ASTM standard C-177 entitled“Standard Test Method for Steady-State HeatFlux Measurementsand ThermalTransmission Propertiesby Means of the Guarded-Hot-PlateApparatus," at mean temperatures up to 571°F, and the results are tabulated in Tabulated in Table 5. Theresults of the measurements using the present apparatus are provided in Table 6. The average specimentemperature, thee measured effective thermal conductivity using thepresent apparatus,, and thecorresponding thermal conductivity measurement from the guarded hot plate data obtained frominterpolating data in Table 5 are presented. The percentage error between measurements using the currentapparatus and the guarded hot plate data are also presented. The data from the current apparatus are towithin ±5.5% of guarded hot plate data. It should be noted that the measurements were performed with acold side temperature of approximately 85°F, with hot side temperatures of 128.1, 129.1, and 203.7°F.Thus, the temperature gradient through the specimen was significantly higher compared to the guardedhot plate technique. Furthermore, the present apparatus is not intended for making measurements on solidspecimen, since it doesn’t have any provisions for applying compressive forces on the sample to ensuregood thermal contact between the sample and the hot and cold plates.The present apparatus wasdesigned for measurements on fibrous insulation, where most of the heat transfer is through gasconduction and radiation and perfect thermal contact is not required.Despite this difference inmeasurement techniques, the difference in measured values using the two techniques was within theuncertainty limits presented in Table 4. Results and Discussion The experimental effective thermal conductivities of SaffilTM at nominal densities of 1.5, 3, and 6 lb/ft’are tabulated in Tables 7, 8, and 9, respectively. The entries in each table include the environmentalpressure in the chamber, average cold side temperature, average hot side temperature, average specimentemperature obtained by averaging the average hot and cold side temperatures, the calculated effectivethermal conductivity, and the product of density and thermal conductivity. Temperature in the tables are Btu-in in degrees Fahrenheit, the thermal conductivity is given in units ofhr-F-, while the product of Btu-in density and thermal conductivity is given in units of - lb -. The experimental effective thermal hr-F-jit’ft conductivities of Q-FiberTM at nominal densities of 3 and 6 lb/ft’are tabulated in Tables 10 and 11,respectively. Data for the measurements on CerachromeTM at nominal densities of 6 and 12 lb/ft’ arepresented in Tables 12 and 13, respectively. Data on the three multi-layer configurations are presented inTables 14,15, and 16. The effective thermal conductivity of various samples as a function of average temperature forenvironmental pressures of 1x10, 1×10, 1, 10, and 100 torr are shown in Figures 9a through 9e,respectively. The effective thermal conductivity varies non-linearly with sample average temperature,increasing rapidly with increasing temperature due to the nonlinear nature of radiation heat transfer. Thiseffect is more evident with lower density insulations..As the insulation density increases the solidconduction contribution to the overall heat transfer increases, but the radiation heat transfer decreasesmore rapidly, resulting in a net decrease in the effective thermal conductivity. At lower pressures, themulti-layer insulations have the lowest thermal conductivity. At higher pressures ( above 10 torr),SaffilTM and Q-FiberTM at 6 lb/ft’ provide the lowest thermal conductivity. CerachromeTM at 6 lb/ft’ andSaffilTM at 1.5 lb/ft’provided the highest effective thermal conductivities at all pressures. Since the effective thermal conductivities of samples were obtained at different sample densities, theproduct of thermal conductivity and density provides a good comparative quantity for comparing thesteady-state effectiveness of various samples.For steady-state heat transfer the product of thermalconductivity and density can be shown to be proportional to the mass of insulation required per unit area.The lightest weight insulation will have the lowest value of the product of thermal conductivity anddensity for steady-state heat transfer. The same trend may hold for slowly varying transient situations.The product of effective thermal conductivity and density of various samples as a function of sampleaverage temperature for environmental pressures of 1x10", 1x10, 1, 10, and 100 torr are shown inFigures 10a through 10e, respectively. In Figure 10a the CerachromeTM samples at 6 and 12 lb/ft'provided the highest thermal conductivity density product at environmental pressure of 1x10torr, 2 to 3times higher than all the other samples.The same trend continued for all the other environmentalpressures tested. Therefore, data from CerachromeTM were deleted for Figures 10b through 10e to enablebetter comparison of data from other samples. The three multi-layer insulation configurations providedthe best performance over the entire pressure and temperature range. The performance of SaffilTM and Q-FiberTM felt were similar under all measured conditions. At low pressures, where gas conduction is negligible, all densities of SaffilTM and Q-FiberTM hadnearly the same thermal conductivity density product at a given temperature. This implies that in theabsence of gas conduction, the mass of insulation required may be insensitive to the density of theinsulation. The effective thermal conductivity of various samples as a function of environmental pressure fornominal sample average temperatures of 125, 275, 425,730, and 950°F are shown in Figures 11a through11e, respectively. As can be seen, gas conduction is negligible up to 0.1 torr, rapidly increases between0.1 and 10 torr, and then stays relatively constant between 100 and 760 torr. Concluding Remarks A simple experimental apparatus was designed to measure the effective thermal conductivity ofvarious high temperature insulations subject to large temperature gradients representative of typicallaunch vehicle re-entry conditions.. The insulation sample cold side could be maintained around roomtemperature, while the hot side could be heated to temperatures as high as 1800°F. The environmentalpressure could be varied from 1 x 10 to 760 torr.The results of an uncertainty analysis yielded an overall uncertainty of 5.5 to 9.9 percent for the effective thermal conductivity measurements. Thermalconductivity measurements on a fumed silica reference material from NIST at atmospheric pressure werewithin 5.5 percent of reported data. Effective thermal conductivities were measured for the following insulation samples: SaffilTM at 1.5, 3,6 lb/ft, Q-FiberTM felt at 3, 6 lb/ft, CerachromeTM at 6, 12 lb/ft’, and three multi-layer insulationconfigurations at 1.5 and 3 lb/ft. Comparison of data showed that CerachromeTM was a much lesseffective insulator than the other insulations tested, and that SaffilTM and Q-FiberTM felt were comparablein performance under all tested conditions. The three multi-layer configurations provided bestperformance over the entire pressure and temperature range. References ( 1. ASTM Standard C 201: “Standard Test Method for Thermal Conductivity of Refractories,” 1996 Annual Book of ASTM St a ndards, V o l. 1 5 .01, R efractories, Carbon and Graphite Products, Activated Carbon Advanced Ceramics, 1996. ) ( 2. C l ark, R.K., Unnam, J . ,“ R esponse of Inconel 617 to Sea Salt and Re-entry Conditions,”Journa l of Spa c ecraft,Vol. 23, No.1,Jan-Feb 1 9 86, pp. 96-101 ) ( 3. Coleman, H.W., Steele, W.G., E xperimentation a nd U n certainty Analysis for E ngineers, 1 989, John W iley & Sons, Inc. ) ( 4. A A STM St a ndard C 177:“Standard Test Method for S teady-State Hea t Flu x Measurements and Ther m al T ransmission Properties b y Means of th e Guarded-Hot-Plate Apparatus , ”199 6 Annua l Book of ASTMStandards,Vol. 4.06, Thermal Insulation, Environmental Acoustics, 1996. ) Table 1. Description of fibrous insulation test specimen. Specimen were 8×8×0.522 inches Specimen Nominal density(lb/ft’) Actual density(1b/ft) SaffilTM 1.5 1.52 SaffilTM 3 3.03 SaffilTM 6 6.0 Q-FiberTM felt 3 3.03 Q-FiberTM felt 6 5.97 CerachromeTM 6 5.93 CerachromeTM 12 12.0 Table 2. Description of multi-layer insulation test specimen. Specimen were 6×6×0.522 inches Specimen Description Mass of foils (grams) Mass of SaffilTM (grams) Nominal density (lb/ft) Actual density (lb/ft) Multi-layer configuration 1 4 foils 7.74 0.53 1.5 1.49 Multi-layer configuration2 9 foils 14.04 0.7 3 3 Multi-layer configuration3 4 foils with five Saffil spacers 5.59 9.08 3 2.97 indicates mass of SaffilTM layer sandwiched between the top of specimen and bottom of septumplate Table3. Bias and precision uncertainties for experimentally measured quantities Measurement Bias error Precision error insulation thickness (in) 0.01 0.02 heat flux (Btu/hr-ft) 3.4% ofreading 1.14-8.5 Septum plate temperature (°F) 6.4 0.29 -0.76 Water-cooled plate temperature (°F) 0.18 0.36-.4 Table 4. Overall uncertainty estimates for effective thermal conductivity. Estimates obtained from data on SaffilTM at 1.5 lb/ft Pressure (torr) Average Temperature (°F) Bias Error (%) Precision Error Overall Error %) (%) 0.0001 124.8 5.86 7.68 9.66 0.01 124.7 5.86 7.29 9.35 760 123.9 5.96 4.73 7.61 0.0001 577.9 3.98 3.87 5.55 0.0105 578.1 3.98 3.87 5.55 755 577.1 3.97 3.85 5.53 0.0001 941.1 3.91 3.82 5.47 0.0114 941.3 3.91 3.84 5.48 474 943.1 3.91 3.82 5.47 Table 5. Effective thermal conductivity of NIST Standard Reference Material 1459 measured using the guarded hotplate technique Average Temperature (°F) Effective thermal conductivity (Btu/ft-hr-°F) 73 0.0121 210 .0129 391 .0139 571 .0165 Table 6. Comparison of effective thermal conductivity measurements on NIST Standard Reference Material 1459using the present apparatus and the guarded hot plate technique Average Temperature (°F) Thermal conductivity, present Thermal Conductivity, guarded hot plate technique (Btu/ft-hr-°F) Percent difference apparatus (Btu/ft-hr-°F) (%) 128.1 .0129 .0124 2.3 129.1 .0129 .0124 2.3 203.7 .0122 .0129 5.5 Table 9. Effective thermal conductivity of SaffilTM at nominal density of 6 lb/ft.3 Table 14. Effective thermal conductivity of multi-layer insulation configuration 1 at nominal density of 1.5 lb/ft P (torr) T cold °F T hot T_avg k Btu-in pk Btu-in-lb P T cold T_hot T avg k pk °F °F (torr) °F °F °F Btu-in Btu-in-lb hr-ft2oF hr-ft-oF hr-ft-oF hr-ft-F 99x10° 51.2 201.1 126.1 0.0568 0.0847 1x10 62.8 1389.9 726.4 0.1291 0.1923 1.02x10 51.2 201.3 126.2 0.0782 0.1165 1.015x10 63.0 1390.1 726.6 0.1318 0.1963 0.101 51.6 199.1 125.4 0.1589 0.2368 1.045x10 63.4 1390.0 726.7 0.1498 0.2231 0.514 52.1 198.8 125.4 0.2439 0.3634 0.099 64.9 1389.5 727.2 0.2331 0.3473 52.3 199.6 125.9 0.2711 0.4040 0.503 67.5 1388.0 727.8 0.3535 0.5268 4.99 52.5 199.6 126.1 0.3066 0.4568 1 68.9 1387.3 728.1 0.4073 0.6069 10.3 52.6 198.7 [25.6 0.3140 0.4679 4.99 72.1 1385.8 728.9 0.5018 0.7477 100 52.7 198.0 125.4 0.3228 0.4810 10.4 73.1 1384.3 728.7 0.5243 0.7812 750 52.7 197.1 124.9 0.3249 0.4841 99.7 74.9 1382.2 728.6 0.5575 0.8307 1x10 54.2 796.6 424.9 0.0818 0.1218 750 75.4 1380.1 727.7 0.5694 0.8485 .991x10 54.4 796.8 425.4 0.0848 0.1264 1.04x10* 74.0 1794.9 934.5 0.2051 0.3056 1.02x10° 54.6 796.3 427.5 0.1024 0.1526 1.11x10 74.2 1795.0 934.6 0.2079 0.3097 0.102 55.6 796.1 437.8 0.1831 0.2728 1.05x10~ 74.5 1794.9 934.7 0.2254 0.3358 0.501 57.1 795.3 450.8 0.2862 0.4265 0.1006 76.2 1794.1 935.2 0.2975 0.4433 1.01 57.8 794.5 455.9 0.3287 0.4898 0.51 78.9 1792.5 935.7 0.4074 0.6070 5.01 59.3 793.4 463.7 0.3925 0.5849 1 80.8 1791.7 936.2 0.4622 0.6886 10.4 59.7 792.4 464.8 0.4056 0.6043 5.01 85.9 1789.4 937.6 0.5829 0.8686 99.8 60.2 792.4 467.2 0.4240 0.6318 10.2 87.7 1788.1 937.9 0.6198 0.9234 748 60.4 788.8 466.0 0.4281 0.6379 100 91.3 1784.9 938.1 0.6816 1.0156 752 92.3 1781.5 936.9 0.7024 1.0465 Table 15. Effective thermal conductivity of multi-layer insulation configuration 2 at nominal density of 3 lb/ft P (torr) T cold°F T_hot °F T_avg °F k Btu-inhr-ft-oF pk Btu-in-lb P (torr) T cold °F T hot °F T_avg °F k pkBtu-in-lb Btu-in hr-ft-9F hr-ft-oF hr-ft-9F 1.01x10 52.5 200.8 126.6 0.0427 0.1282 .999x10"-4 59.2 1392.5 725.8 0.0896 0.2688 1.006x10⁻³ 52.3 200.3 126.3 0.0455 0.1364 1.005x10~*-3 59.3 1392.5 725.9 0.0914 0.2743 1.01x10~ 52.2 200.0 126.1 0.0610 0.1831 1.04x10~ 59.7 1392.4 726.1 0.1040 0.3120 0.101 52.3 199.7 126.0 0.1203 0.3608 0.1 61.6 1391.6 726.6 0.1511 0.4533 0.5 52.5 199.4 125.9 0.1962 0.5887 0.505 64.5 1390.3 727.4 0.2323 0.6969 1.03 52.5 199.2 125.8 0.2276 0.6829 0.993 66.1 1389.9 728.0 0.2763 0.8288 4.98 52.6 198.8 125.7 0.2722 0.8167 5.01 69.9 1387.7 728.8 0.3821 1.1464 10.6 52.8 198.3 125.5 0.2828 0.8484 10.7 71.2 1386.4 728.8 0.4181 1.2543 99.8 52.8 198.0 125.4 0.2977 0.8930 99.8 73.9 1384.0 729.0 0.4801 1.4404 751 52.6 196.7 124.7 0.3011 0.9033 752 74.2 1381.3 727.8 0.5010 1.5029 .993x10 52.9 793.8 423.4 0.0572 0.1717 1.1x10** 66.4 1797.1 931.7 0.1220 0.3661 .99x10° 53.1 793.9 423.5 0.0595 0.1786 1.005x10° 66.5 1797.3 931.9 0.1236 0.3709 1.015x10*-2 53.3 793.8 423.5 0.0727 0.2180 1.065x10 67.0 1797.4 932.2 0.1323 0.3970 0.102 54.4 792.9 423.6 0.1261 0.3782 0.1029 69.1 1796.9 933.0 0.1786 0.5359 0.505 55.9 792.2 424.0 0.2110 0.6329 0.51 72.9 1795.7 934.3 0.2538 0.7614 1.01 56.8 792.0 424.4 0.2527 0.7582 0.993 74.8 1794.9 934.9 0.2972 0.8915 5 58.5 790.6 424.5 0.3287 0.9862 4.99 80.2 1792.5 936.3 0.4207 1.2622 10.7 58.9 789.0 424.0 0.3483 1.0448 11 82.7 1790.7 936.7 0.4733 1.4198 99.4 59.7 787.1 423.4 0.3784 1.1351 108 87.3 1787.5 937.4 0.5717 1.7152 749 59.9 785.1 422.5 0.3870 1.1609 749 87.9 1783.7 935.8 0.6057 1.8170 Table 16. Effective thermal conductivity of multi-layer insulation configuration 3 at nominal density of3 lb/ft P (torr) T cold °F T_hot °F T_avg k Btu-in pk Btu-in-lb P T cold T_hot T_avg k pk °F (torr) °F °F °F Btu-in Btu-in-lb hr-ft2-oF hr-ft-oF hr-ft-F hr-ft-F 1x10⁴ 51.6 200.0 125.8 0.0144 0.0428 1x10 57.0 1389.2 723.1 0.0578 0.1716 1.015x10° 51.7 200.2 125.9 0.0146 0.0432 1.07x10 57.1 1389.7 723.4 0.0589 0.1749 1.025x10~-2 51.8 200.4 126.1 0.0225 0.0669 1.05x10 57.4 1389.8 723.6 0.0659 0.1956 0.1015 52.0 200.1 126.1 0.0611 0.1814 0.1055 58.7 1389.5 724.1 0.0969 0.2877 0.4985 52.4 199.3 125.9 0.1246 0.3701 0.5235 61.2 1388.5 724.9 0.1730 0.5139 1 52.6 198.7 125.7 0.1562 0.4639 1 62.8 1388.0 725.4 0.2244 0.6665 4.99 52.7 198.5 125.6 0.2079 0.6173 5.02 67.4 1386.2 726.8 0.3733 1.1087 10.7 52.9 198.2 125.6 0.2185 0.6490 10.8 69.0 1385.2 727.1 0.4230 1.2562 99.7 53.1 197.5 125.3 0.2324 0.6901 99.95 71.5 1382.9 727.2 0.4842 1.4380 750 53.4 196.4 124.9 0.2365 0.7023 748 72.0 1380.3 726.2 0.4932 1.4649 1.01x10 53.2 792.8 423.0 0.0234 0.0695 1.55x10* 63.9 1795.5 929.7 0.1041 0.3093 1.065x10⁻³ 52.9 793.0 422.9 0.0254 0.0754 1.113x10⁻³ 63.9 1795.8 929.9 0.1051 0.3123 1.02x10° 53.1 792.9 423.0 0.0341 0.1014 1.04x10 64.4 1795.9 930.2 0.1103 0.3276 0.102 53.9 792.5 423.2 0.0683 0.2029 0.104 65.9 1795.6 930.8 0.1353 0.4019 5.12 55.3 791.4 423.4 0.1421 0.4220 0.506 68.7 1794.7 931.7 0.1954 0.5805 1 56.1 791.4 423.7 0.1883 0.5593 1.005 70.9 1794.0 932.4 0.2473 0.7344 5.015 57.9 789.7 423.8 0.2886 0.8572 5.03 77.9 1791.5 934.7 0.4261 1.2654 11.2 58.5 789.4 423.9 0.3149 0.9353 11 81.0 1789.8 935.4 0.5050 1.4998 99.6 59.4 786.4 422.9 0.3430 1.0186 100.05 85.9 1786.0 936.0 0.6157 1.8287 746 59.5 784.3 421.9 0.3497 1.0385 749 86.5 1781.2 933.8 0.6278 1.8647 Figure 1. Schematic of the thermal conductivity apparatus Figure 2. Photograph of thermal conductivity apparatus with picture frame set on the water-cooled plate Septum plate Figure 3. Photograph of thermal conductivity apparatus with septum plate set on the picture frame and insulationsample Figure 4. Photographof radiant heater and insulation enclosure set on the thermal conductivity apparatus Figure 5. Photograph of the thermal conductivity apparatus set in the vacuum chamber Figure 6. Instrumentation layout on water-cooled plate Figure 7. Instrumentation layout on septum plate Figure 8. Schematic of 1-D set-up for calculation of effective thermal conductivity Thermal Conductivity, Btu-in/(hr-°F-ft) Figure 9. Variation of effective thermal conductivity of various samples with sample average temperature atdifferent pressures Thermal Conductivity. Btu-in/(hr-°F-ft) Figure 9. Continued. Thermal Average Temperature, °F Figure 9. Continued. Thermal Conductivity, Average Temperature, F Figure 9. Continued. Thermal Conductivity, Btu-in/(hr-°F-ft) Average Temperature, F Figure 9. Concluded. Thermal Conductivity Density Product, (Btu-in-lb)/(hr-°F-ft) Figure 10. Variation of the product of effective thermal conductivity and density of various samples with sampleaverage temperature at different pressures Thermal Conductivity Density Product, (Btu-in-lb)/(hr-°F-ft) Average Temperature, °F Figure 10. Continued. Thermal Conductivity Density Product, (Btu-in-lb)/(hr-°F-ft) Average Temperature, °F Figure 10. Continued. 3.0 Thermal Conductivity Density product, (Btu-in-lb)/(hr-F-ft) Figure 10. Continued. 27 Thermal ConductivityDensity Product,(Btu-in-lb)/(hr-°F-ft) 1000 Figure 10. Concluded Thermal Conductivity, Btu-in/(hr-°F-ft) Pressure, torr Figure 11. Variation of effective thermal conductivity of various samples with pressures at different sample averagetemperatures Thermal Conductivity, Btu-in/(hr-°F-ft) Pressure, torr Figure 11. Continued. Thermal Conductivity, Btu-in/(hr-°F-ft) Pressure, torr Figure 11. Continued Thermal Conductivity, Btu-in/(hr-°F-ft) Pressure, torr Figure 11. Continued Thermal Conductivity, Btu-in/(hr-°F-ft) Pressure, torr Figure 11. Concluded REPORT DOCUMENTATION PAGE Form ApprovedOMB No. 0704-0188 Public reporting burden for this collection of information is estimated to average 1 hour per response, including the time for reviewing instructions, searching existing datasources, gathering and maintaining the data needed, and completing and reviewing the collection of information. Send comments regarding this burden estimate or any otheraspect of this collection of information, including suggestions for reducing this burden, to Washington Headquarters Services, Directorate for Information Operations andReports, 1215 Jefferson Davis Highway, Suite 1204, Arlington, VA 22202-4302, and to the Office of Management and Budget, Paperwork Reduction Project (0704-0188), Washington, DC 20503. 1. AGENCYUSE ONLY (Leave blank) 2.REPORT DATE February 1999 3.REPORT TYPE AND DATES COVERED Technical Memorandum 4. TITLE AND SUBTITLE Effective Thermal Conductivity of High Temperature Insulations forReusable Launch Vehicles 5. FUNDING NUMBERS 242-33-03-29 6. AUTHOR(S) Kamran Daryabeigi 7.PERFORMING ORGANIZATION NAME(S) AND ADDRESS(ES) NASA Langley Research Center Hampton, VA 23681-2199 8.PERFORMING ORGANIZATIONREPORT NUMBER L-17808 9. SPONSORING/MONITORING AGENCY NAME(S) AND ADDRESS(ES) National Aeronautics and Space AdministrationWashington, DC 20546-0001 10. SPONSORING/MONITORINGAGENCY REPORT NUMBER NASA/TM-1999-208972 11.SUPPLEMENTARY NOTES 12a. DISTRIBUTION/AVAILABILITY STATEMENT Unclassified-UnlimitedSubject Category 34 Distribution: Standard Availability: NASA CASI (301) 621-0390 12b. DISTRIBUTION CODE 13. ABSTRACT (Maximum 200 words) An experimental apparatus was designed to measure the effective thermal conductivity of various high temperature insulations subject to large temperature gradients representative of typical launch vehicle re-entry aerodynamic heating conditions. The insulation sample cold side was maintained around room temperature, while the hot side was heated to temperatures as high as 1800 degrees Fahrenheit. The environmental pressure was varied from 0.0001 to 760 torr. All the measurements were performed in a dry gaseous nitrogen environment. The effective thermal conductivity of Saffil,Q-Fiber felt, Cerachrome, and three multi-layer insulation configurations were measured. 14. SUBJECT TERMS Thermal conductivity; Fibrous insulation, Multi-layer insulation 15.NUMBER OF PAGES35 16.PRICE CODEA03 17. SECURITY CLASSIFICATIONOF REPORT Unclassified 18. SECURITY CLASSIFICATIONOF THIS PAGEUnclassified 19. SECURITY CLASSIFICATIONOF ABSTRACT Unclassified 20. LIMITATIONOF ABSTRACTUL February February
确定


还剩33页未读,是否继续阅读?

产品配置单
上海依阳实业有限公司为您提供《可重复使用运载火箭高温隔热材料的有效导热系数测试技术研究》,该方案主要用于航空中检测,参考标准--,《可重复使用运载火箭高温隔热材料的有效导热系数测试技术研究》用到的仪器有高温热流计法导热系数测试系统
推荐专场

相关方案
更多
该厂商其他方案
更多